Supporting Information Contents - Royal Society of · PDF file · 2015-10-27S2...
19
S1 BODIPY-based colorimetric/ratiometric fluorescence probes for sulfite in aqueous solution and in living cells Shanshan Liu, a Lun Song, a Qian Sun, a Zhaoyang Chen, a Yu Ge, b Weibing Zhang a and Junhong Qian *a a Shanghai Key Laboratory of Functional Materials Chemistry, School of Chemistry and Molecular Engineering, East China University of Science and Technology, Shanghai 200237, China b Shanghai Institute of Quality Inspection and Technical Shanghai, 200233, China. [email protected] Supporting Information Contents Experiment--------------------------------------------------------------------------------------S2 NMR spectra of M1 and M2------------------------------------------------------------------S4 NMR and ESI spectra of M3, BSP1 and BSP2--------------------------------------------S5 The absorption and emission spectra of BSP1 in different solvents -------------------S11 The concentration-dependent absorption spectra of BSP1 in PBS --------------------S12 Plot of fluorescence intensity vs. absorbance of BSP1----------------------------------S13 I 554 /I 618 vs. time of BSP1 in the presence of sulfite-------------------------------------S14 The influence of pH value on I 554 / I 618 of BSP1------------------------------------------S15 The concentration-dependent absorption spectra of BSP2 in PBS --------------------S16 The normalized absorption spectra of BSP1 and BSP2---------------------------------S17 Time-dependent absorption and emission spectra of BSP2 in CTAB-PBS-----------S18 Sulfite effect on the absorption spectrum of BSP2--------------------------------------S19 Electronic Supplementary Material (ESI) for RSC Advances. This journal is © The Royal Society of Chemistry 2015
Transcript of Supporting Information Contents - Royal Society of · PDF file · 2015-10-27S2...

S1
BODIPY-based colorimetric/ratiometric fluorescence probes for sulfite in
aqueous solution and in living cells
Shanshan Liu,aLun Song,a Qian Sun,aZhaoyang Chen,a Yu Ge,bWeibing Zhanga and Junhong
Qian*a aShanghai Key Laboratory of Functional Materials Chemistry, School of Chemistry and Molecular Engineering, East China University of Science and Technology, Shanghai 200237, China
bShanghai Institute of Quality Inspection and Technical Shanghai, 200233, China.
Supporting Information
Contents
Experiment--------------------------------------------------------------------------------------S2
NMR spectra of M1 and M2------------------------------------------------------------------S4
NMR and ESI spectra of M3, BSP1 and BSP2--------------------------------------------S5
The absorption and emission spectra of BSP1 in different solvents -------------------S11
The concentration-dependent absorption spectra of BSP1 in PBS --------------------S12
Plot of fluorescence intensity vs. absorbance of BSP1----------------------------------S13
I554/I618 vs. time of BSP1 in the presence of sulfite-------------------------------------S14
The influence of pH value on I554/ I618 of BSP1------------------------------------------S15
The concentration-dependent absorption spectra of BSP2 in PBS --------------------S16
The normalized absorption spectra of BSP1 and BSP2---------------------------------S17
Time-dependent absorption and emission spectra of BSP2 in CTAB-PBS-----------S18
Sulfite effect on the absorption spectrum of BSP2--------------------------------------S19
Electronic Supplementary Material (ESI) for RSC Advances.This journal is © The Royal Society of Chemistry 2015

S2
Experiment
Materials and reagents
All the commercial reagents and solvents (Aladdin Corporation) were of analytical
grade and used without further purification. Ultra-pure water was prepared through a
Sartorius Arium 611DI system. Phosphate salts were used to keep a stable pH and ion
strength in detection systems. Absorption spectra were measured with an Evolution
220 UV-Visible spectrophotometer (Thermo Scientific). Fluorescence spectra were
conducted on a Lumina Fluorescence Spectrometer (Thermo Scientific). All pH
measurements were performed with a model FE20 meter purchased from Mettler
Toledo. NMR spectra were recorded using a Bruker AV-400 spectrometer (400MHz).
Mass spectra were performed with a MA 1212 Instrument using standard condition
(ESI, 70 eV).
Time titration of sulfite-probe systems
3 mM of the stock solutions of BSP1 and BSP2 in DMF were prepared ahead. The
stock solution of BSP1 or BSP2 was diluted with PBS (20 mM, pH 7.4) with or
without 1 mM CTAB to acquire 1×10⁻⁵ M dye aqueous solution. 50 μL of 30 mM
freshly prepared Na2SO3 in PBS (20 mM, pH 7.4) were added to 3 mL of 1×10⁻⁵ M
dye aqueous solution. Absorption and emission spectra of the above solution were
collected at different intervals.
Sulfite titration
0~50 μL of 30 mM Na2SO3 in PBS were added into 3 mL of 1×10⁻⁵ M BSP1 in
CTAB-PBS or BSP2 in PBS solutions. The spectra were recorded 2 h and 20 min
after each addition of sulfite to BSP1 and BSP2 solutions, respectively.
HPLC traces
High-performance liquid chromatography (HPLC) spectra were carried out on an
Agilent Technologies 1260 Infinity LC system. The mobile phases were degassed
with an ultrasonic apparatus for 14 min. Mobile phase: A: water, B: acetonitrile;
gradient elution: 2–8 min 10–95% B, 10-12 min 95–10% B; Isocratic elution: 0–2 min
10% B, 8-10 min 95% B, and 12-14 min 10% B. Injection volume: 10 μL; flow rate:
1.0 mL/min; detection wavelength: isosbestic point 512 nm.

S3
Live cell culture and fluorescence imaging
HeLa cells were cultured in Dulbecco's modified Eagle's medium (DMEM)
supplemented with 10% fetal bovine serum (FBS) in an atmosphere of 5% CO2 and
95% air at 37 °C. The cells were washed with phosphate buffered solution (PBS, 20
mM, pH 7.4) and pre-incubated with 500 μM Na2SO3, then incubated with BSP1 (10
μM) and CTAB (1 mM) in DMEM for 120 min at 37 C and washed 3 times with
PBS. For the control experiment, the cells were only incubated with 10 μM of BSP1
and CTAB (1 mM) for 120 min. Cell imaging was carried out after washing the cells
with PBS. Emission was collected at 500-550 nm for the green channel and at
570–620 nm for the red channel. The excitation wavelength was set at 514 nm for
green and red channels.

S4
Fig. S1 1H-NMR spectra of M1 and M2.
S5

S6
4000 3500 3000 2000 1500 1000 500
20
40
60
80
100
T %
/ cm-1
M3
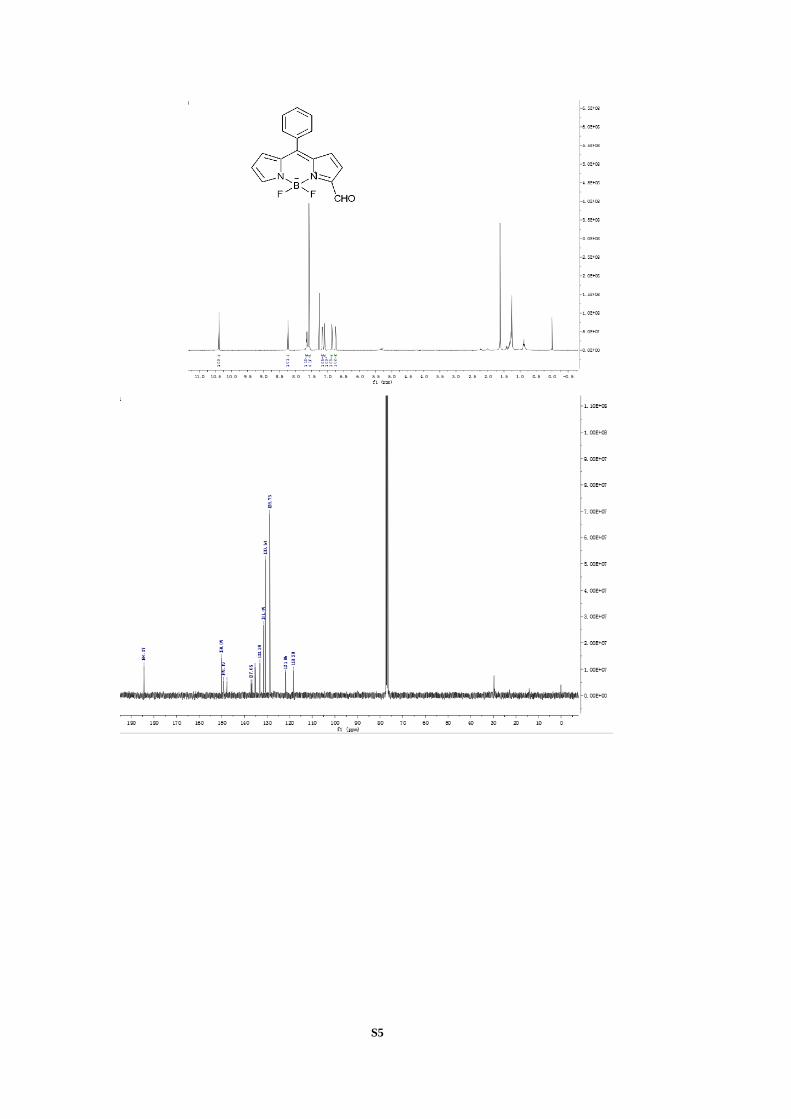
Fig. S2 1H-NMR, 13C-NMR, MS and IR spectra of M3.

S7
S8
4000 3500 3000 2000 1500 1000 50020
40
60
80
100
/ cm-1
T %
BSP1
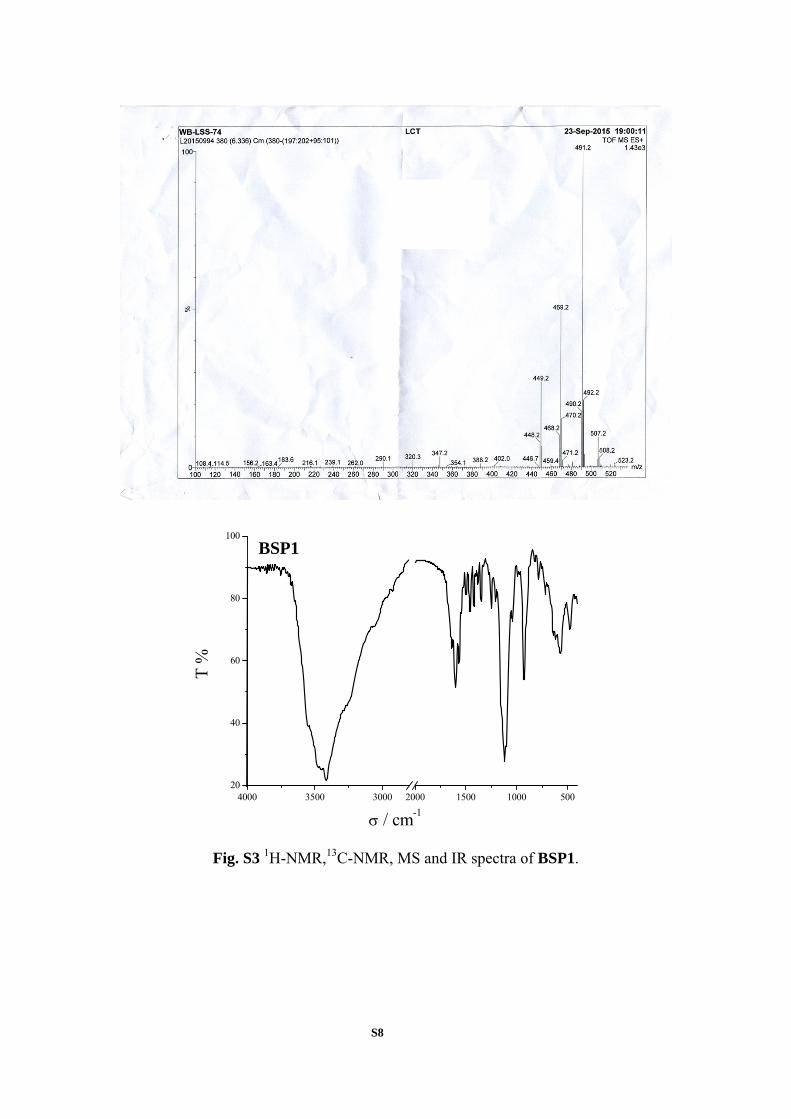
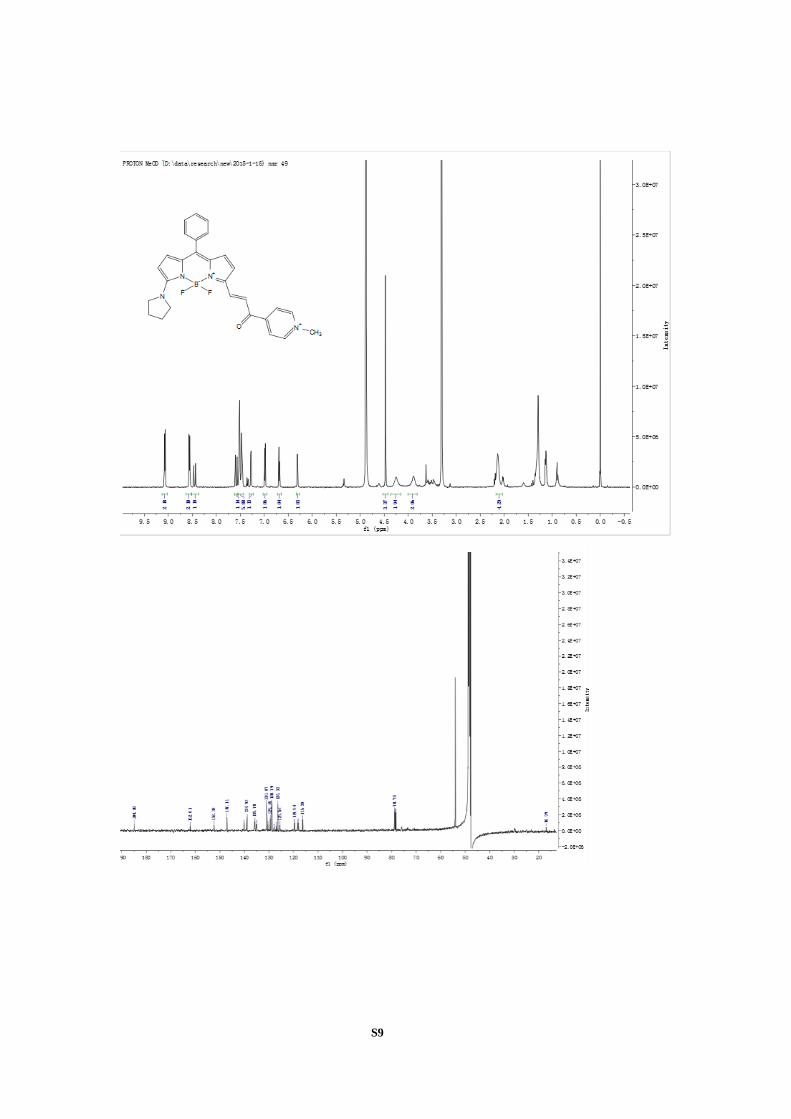
Fig. S3 1H-NMR,13C-NMR, MS and IR spectra of BSP1.
S9

S10
4000 3500 3000 1500 1000 50030
40
50
60
70
80
90
100
/ cm-1
T %
BSP2
Fig. S4 1H-NMR, 13C-NMR, MS and IR spectra of BSP2.

S11
400 450 500 550 600 650 700 750
0.00
0.06
0.12
0.18
0.24
0.30
DCM MeCN EA MeOH DMF CTAB-PBS PBS H2OA
/ nm
a
560 600 640 680 7200
8000
16000
24000
32000
40000
I / a
.u.
/ nm
EA DCM DMF MeCN CTAB-PBS MeOH PBS H
2O
b
Fig. S5 The absorption (a) and emission (b) spectra of BSP1 (10 µM) in different
solvents.

S12
400 450 500 550 600 650 700 750
0.000
0.007
0.014
0.021
0.028
0.035
[BSP1] / M 0.1 0.3 0.5 0.7 1 1.5 2 2.5 3 3.5
A
[BSP1] / M
a
0.0 0.8 1.6 2.4 3.2 4.00.000
0.007
0.014
0.021
0.028
0.035
A
[BSP1] / M
b
Fig. S6 The absorption spectra of BSP1 with different concentrations in PBS.
S13
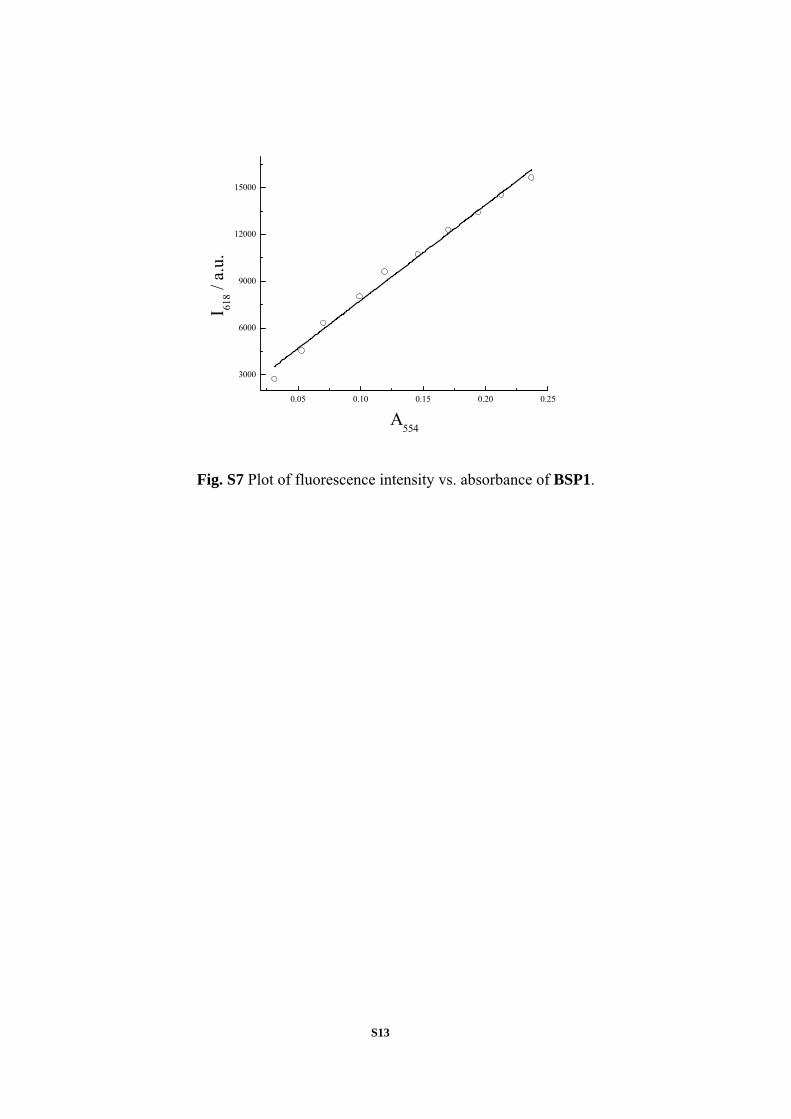
0.05 0.10 0.15 0.20 0.25
3000
6000
9000
12000
15000
I 618 /
a.u.
A554
Fig. S7 Plot of fluorescence intensity vs. absorbance of BSP1.

S14
0 30 60 90 120 150 180
0
1
2
3
4I 55
4 / I 61
8
t / min
Fig. S8 I554/I618 vs. time of BSP1-sulfite system. [BSP1] =10 μM, [sulfite] = 500 M,
1 mM CTAB-PBS (20 mM, pH 7.4), λex= 512 nm, 25°C.

S15
2 4 6 8 10 12
0
2
4
6
13500
15000
16500
0
2
4
6
13500
15000
16500
I 554 /
I 618
I / a
.u.
pH
a
2 4 6 8 10 120.22
0.24
4
8
0.22
0.24
4
8
A49
4 / A
554
A
pH
b
Fig. S9 The effect of pH value on the fluorescence intensity of BSP1 at 618 nm and I554/I618 of BSP1-SO3H (a), and the absorbance of BSP1 at 554 nm and A494/ A554 of BSP1-SO3H (b), 1 mM CTAB-PBS (20 mM).
S16
400 500 600 700
0.00
0.08
0.16
0.24
0.32
0.40
[BSP2] / M 1 3 5 7 10 15 20 25 30
A
/ nm
a
0 6 12 18 24 30
0.00
0.08
0.16
0.24
0.32
0.40
A56
7
[BSP2] / M
b
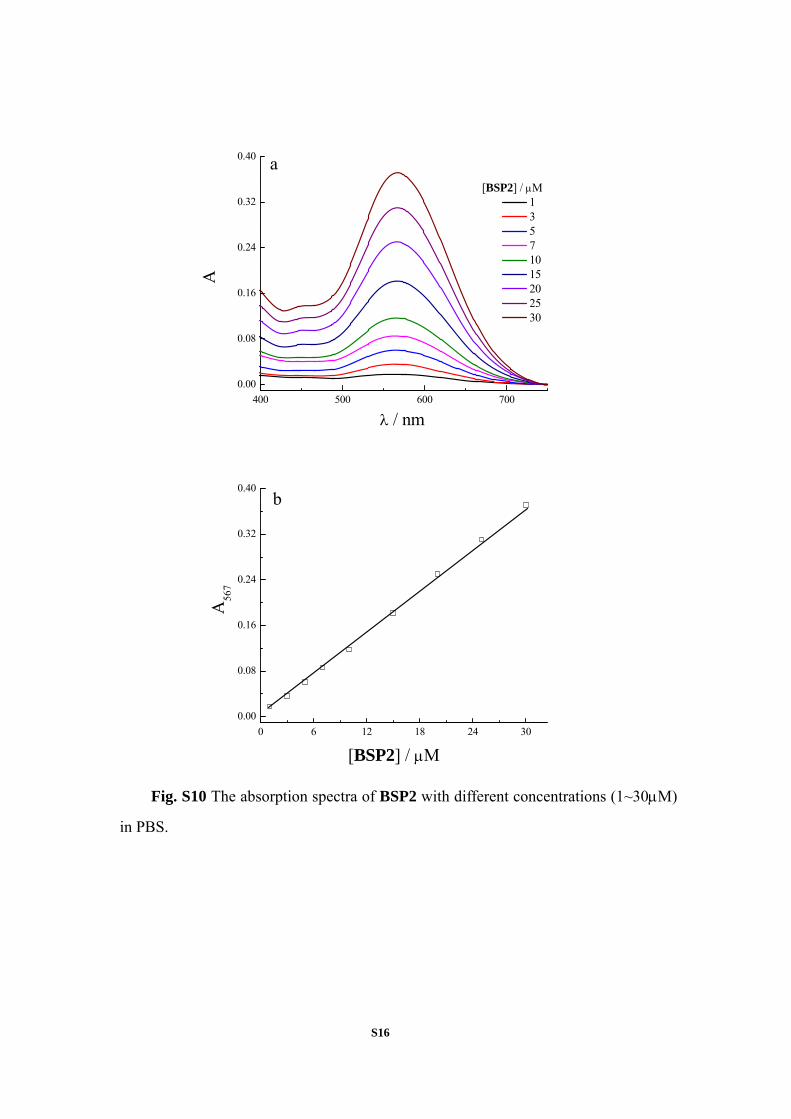
Fig. S10 The absorption spectra of BSP2 with different concentrations (1~30M)
in PBS.
S17
500 550 600 650 7000.0
0.2
0.4
0.6
0.8
1.0
BSP2 BSP1
A /
norm
aliz
ed
nm
13 nm
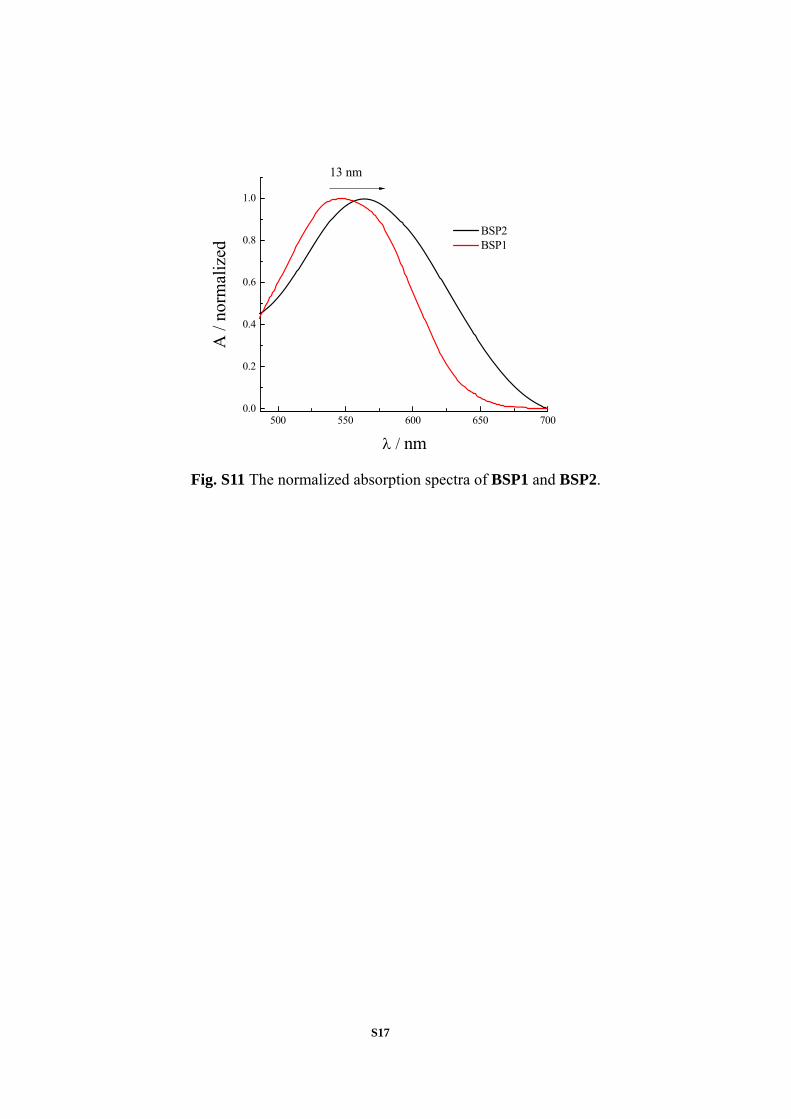
Fig. S11 The normalized absorption spectra of BSP1 and BSP2.
S18
400 450 500 550 600 650 700 750
0.00
0.03
0.06
0.09
0.12
t / min 0 1 3 5A
/ nm
a
560 600 640 680 720
0
800
1600
2400
3200
4000
/ nm
t / min 0 1 3 5
I / a
.u.
b
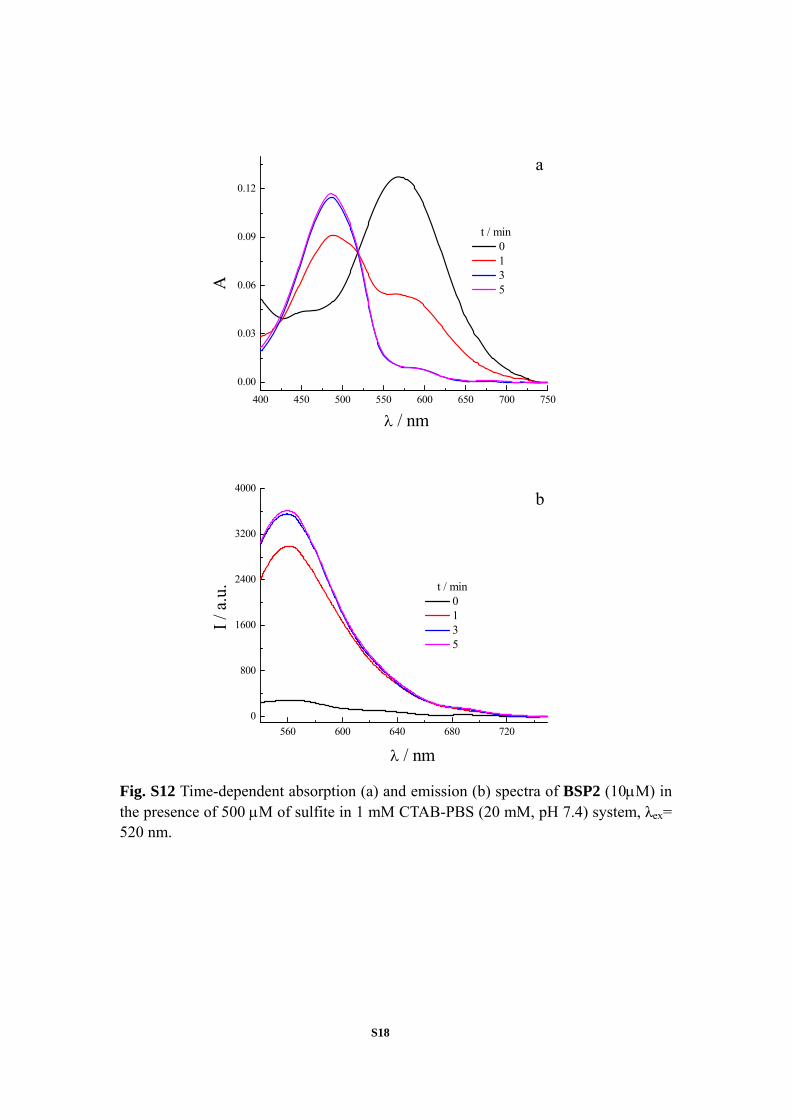
Fig. S12 Time-dependent absorption (a) and emission (b) spectra of BSP2 (10M) in the presence of 500 M of sulfite in 1 mM CTAB-PBS (20 mM, pH 7.4) system, λex= 520 nm.

S19
400 450 500 550 600 650 700
0.00
0.03
0.06
0.09
0.12
[sulfite] / M 0 10 20 40 50 80 100
A
/ nm
a
0 20 40 60 80 100
0.4
0.8
1.2
1.6
2.0
A47
0 / A
567
[sulfite] / M
y=0.2739+0.01468x
R2=0.9844
b
Fig. S13 (a) The absorption spectra of BSP2 with different concentrations of sulfite; (b) the absorbance ratio at 470 nm and 567 nm (A470/ A567) as a function of sulfite concentration. 20 mM PBS, pH 7.4, 25°C, [BSP2] = 10 μM, recorded 20 min after each addition.