SUPPORTING INDIA ON SDG 12 MONITORING AND REPORTING
182
SUPPORTING INDIA ON SDG 12 MONITORING AND REPORTING A Critical Appraisal
Transcript of SUPPORTING INDIA ON SDG 12 MONITORING AND REPORTING

SUPPORTING INDIA ON SDG 12 MONITORING
AND REPORTINGA Critical Appraisal

AuthorsShailly Kedia (TERI) (Principal Investigator), Souvik Bhattacharjya (TERI) (Co-Principal Investigator), Mani Juneja (TERI) (Team Member), Monica Dutta (TERI) (Team Member)
Suggested citation SWITCH-Asia RPAC -TERI (SWITCH-Asia Regional Policy Advocacy Component and The Energy and Resources Institute) (2021), Supporting India on SDG 12 Monitoring and Reporting: A Critical Appraisal, Authors: Kedia, S., S. Bhattacharjya, M. Juneja and M. Dutta, Output under SWITCH-Asia Regional Policy Advocacy Component Supported by European Union.
ContactMr. Mushtaq Ahmed MemonRegional Coordinator for Resource EfficiencyUnited Nations Environment Programme, Regional Office for Asia and the PacificProject Manager, Regional Policy Advocacy Component(SWITCH-Asia – the European Union funded programme)Email: [email protected]
Disclaimer: This publication was produced with the financial support of the European Union. Its contents are the sole responsibility of the SWITCH-Asia Regional Policy Advocacy Component and do not necessarily reflect the views of the European Union.

Table of ContentsAcknowledgements............................................................................................................................Abbreviations.....................................................................................................................................Executive Summary..........................................................................................................................Introduction....................................................................................................................................... Status of SDG Reporting in India................................................................................................. Objectives.................................................................................................................................... Approach...................................................................................................................................... References.................................................................................................................................Target 12.1 (10YFP on SCP)............................................................................................................ Snapshot of Target 12.1............................................................................................................... Policy Relevance......................................................................................................................... Conceptualization..................................................................................................................... Global Indicator Framework........................................................................................................ National Indicator Framework..................................................................................................... Critique.................................................................................................................................... Methodology and Data................................................................................................................ Recommendations..................................................................................................................... References...................................................................................................................................Target 12.2 (Natural Resources) ..................................................................................................... Snapshot of Target 12.2............................................................................................................... Policy Relevance......................................................................................................................... Conceptualization......................................................................................................................... Global Indicator Framework....................................................................................................... National Indicator Framework..................................................................................................... Critique.......................................................................................................................................... Methodology and Data................................................................................................................ Recommendations........................................................................................................................ References....................................................................................................................................Target 12.3 (Address Food Loss and Waste).................................................................................. Snapshot of Target 12.3............................................................................................................... Policy Relevance......................................................................................................................... Conceptualization......................................................................................................................... Global Indicator Framework......................................................................................................... National Indicator Framework....................................................................................................... Critique......................................................................................................................................... Methodology and Data................................................................................................................
IIIVI13881011111115151717171920222223242429333436384040414242434444
Recommendations........................................................................................................................ References...................................................................................................................................Target 12.4 (Hazardous Waste and Chemicals)............................................................................... Snapshot of Target 12.4............................................................................................................... Policy Relevance......................................................................................................................... Conceptualization......................................................................................................................... Global Indicator Framework...................................................................................................... National Indicator Framework..................................................................................................... Critique......................................................................................................................................... Methodology and Data............................................................................................................... Recommendations....................................................................................................................... References...................................................................................................................................Target 12.5 (Waste Management)................................................................................................... Snapshot of Target 12.5............................................................................................................... Policy Relevance......................................................................................................................... Conceptualization........................................................................................................................ Global Indicator Framework....................................................................................................... National Indicator Framework..................................................................................................... Critique........................................................................................................................................ Methodology and Data................................................................................................................ Recommendations....................................................................................................................... References...................................................................................................................................Target 12.6 (Sustainability Practices by Companies)....................................................................... Snapshot of Target 12.6............................................................................................................... Policy Relevance......................................................................................................................... Conceptualization......................................................................................................................... Global Indicator Framework...................................................................................................... National Indicator Framework...................................................................................................... Critique.......................................................................................................................................... Methodology and Data................................................................................................................ Recommendations........................................................................................................................ References....................................................................................................................................Target 12.7 (Sustainable Public Procurement)................................................................................. Snapshot of Target 12.7............................................................................................................... Policy Relevance......................................................................................................................... Conceptualization......................................................................................................................... Global Indicator Framework......................................................................................................... National Indicator Framework...................................................................................................... Critique......................................................................................................................................... Methodology and Data................................................................................................................ Recommendations........................................................................................................................ References..................................................................................................................................
464749495051515457576061646465666666676869707272727474747677787981818283838486868889

Target 12.8 (Awareness and Education on Sustainable Development and Lifestyles).................... Snapshot of Target 12.8............................................................................................................... Policy Relevance......................................................................................................................... Conceptualization......................................................................................................................... Global Indicator Framework........................................................................................................ National Indicator Framework...................................................................................................... Critique........................................................................................................................................ Methodology and Data................................................................................................................ Recommendations....................................................................................................................... References...................................................................................................................................Target 12.a (Strengthening Scientific and Technological Capacity on SCP).................................... Snapshot of Target 12.a............................................................................................................... Policy Relevance.......................................................................................................................... Conceptualization......................................................................................................................... Global Indicator Framework....................................................................................................... National Indicator Framework...................................................................................................... Critique......................................................................................................................................... Methodology and Data................................................................................................................ Recommendations....................................................................................................................... References....................................................................................................................................Target 12.b (Sustainable Tourism).................................................................................................... Snapshot of Target 12.b............................................................................................................... Policy Relevance......................................................................................................................... Conceptualization......................................................................................................................... Global Indicator Framework......................................................................................................... National Indicator Framework...................................................................................................... Critique........................................................................................................................................ Methodology and Data................................................................................................................ Recommendations........................................................................................................................ References...................................................................................................................................Target 12.c (Rationalize Inefficient Fossil-fuel Subsidies)................................................................ Snapshot of Target 12.c.............................................................................................................. Policy Relevance......................................................................................................................... Conceptualization......................................................................................................................... Global Indicator Framework......................................................................................................... National Indicator Framework...................................................................................................... Critique........................................................................................................................................ Methodology and Data................................................................................................................ Recommendations....................................................................................................................... References.................................................................................................................................. The Way Forward........................................................................................................................ Annexure: Meta-data for Proposed Indicators.............................................................................
919192929293939494969898999999100101101103104106106107108108109110111112113115115116117117117118118125128131141
Foreword The Covid-19 pandemic is an unprecedented crisis faced by humanity today. The crisis has reaffirmed the importance of Agenda 2030 and the Sustainable Development Goals. The health and socio-economic consequences of pandemic make the implementation of 17 Sustainable Development Goals (SDGs) difficult but at the same time also underpins the importance of maintaining progress.
Sustainable consumption and production (SCP) is an integral part of the global agenda and is one of the seventeen SDGs. SDG 12 on ensuring responsible consumption and production - promotes the reduction of wasteful consumption and production patterns by encouraging governments, businesses, and consumers to adopt sustainable practices.
The need to facilitate dialogue across countries on SDG 12 implementation, monitoring and reporting is reinforced during global emergencies such as the one witnessed due to Covid- 19. It is crucial to have a robust follow-up mechanism to monitor progress on these goals and inform policy and design interventions/initiatives taking a longer-term view to trigger a more resilient, more inclusive economic model built around ‘Green’ principles.
This report lays important groundwork for strengthening the national reporting process on SDG 12 by providing a focused analysis of the National Indicator Framework for SDG 12 and makes recommendations for its monitoring. The research is based on a thorough consultative process, engaging relevant stakeholders, and has reinforced that participation is a significant element needed to achieve the overall SDG.
The report aims to facilitate constructivism for advancing discussions and initiatives on SCP and SDG 12 involving governments, international organisations, development agencies, civil society, research & academia, and the public at large.
SDG 12 is a cross-cutting goal with a central role to promote resource-efficient and a low carbon path. India’s progress in achieving Goal 12 and Agenda 2030 will support climate-neutral, circular and inclusive growth. The EU stands as a strong supporter of SCP in the region but also globally. We are pleased to be able to contribute to strengthening SDG 12 reporting in India in partnership with UNEP and MOEFCC.
EU Delegation to India
ISUPPORTING INDIA ON SDG 12 MONITORING AND REPORTINGA Critical Appraisal
AcknowledgementsThe project is a part of the European Union SWITCH-Asia Regional Policy Advocacy Component implemented by the United Nations Environment Programme (UNEP) in collaboration with The Energy and Resources Institute (TERI). The project aims to promote research, policy dialogue and capacity building in India on Sustainable Consumption and Production (SCP) and Goal 12 of the Sustainable Development Goals (SDGs). After discussions with the Ministry of Environment Forests and Climate Change (MOEFCC) and Ministry of Statistics and Programme Implementation (MOSPI), to carry out this project, UNEP has entered into a small-scale funding agreement with TERI to undertake a study that will provide technical support to the government. The objective of the project is to strengthen the national reporting process on SDG 12 by harmonizing the national indicator framework with the global indicator framework to the extent possible. Rooted in research and consultative processes, this knowledge product aims to systematize critical appraisal on the National Indicator Framework for SDG 12 to make recommendations for the monitoring and reporting of the different nationally defined indicators while considering aspects such as harmonization with targets, policy cycle, data limitations, and feasibility to report at sub-national levels. The team would like to acknowledge with gratitude the guidance and support received from Nitya Nanda (TERI), Suneel Pandey (TERI), Isabelle Louis (UNEP), Mushtaq Memon (UNEP), Atul Bagai (UNEP) and Divya Datt (UNEP). The team would like to thank the SWITCH-Asia RPAC team of Archana Datta, Tunnie Srisakulchairak and Luz Maria Fernandez Garcia for their technical supervision, coordination and review. The report was edited by Jebah David with executive support from John Andruse (TERI) and M K Bineesan (TERI)
The team is also thankful to the following experts and stakeholders for their inputs and their participation in consultations (listed alphabetically): Aastha Dwivedi, Assistant Director, Statistics (MOEFCC), Anshu Singh, Deputy Director General, Statistics (MOEFCC), Ashutosh Ojha, Deputy Director General - SDGs (MOSPI), B Vinod Babu, Additional Director, Waste Management Division, Central Pollution Control Board (MOEFCC), Bhawna Singh, Additional Director, International Cooperation (MOEFCC), Clementine O’ Connor (UNEP), Dinesh Runiwal, Scientist ‘D’ (MOEFCC), Elisa Tonda (UNEP), Fabienne Pierre (UNEP), Farid Yaker (UNEP), Hanna Thorsteinsdottir (UNEP), Himanshu Sharma (UNEP), James Matthew, Deputy Director General, Statistics (MOEFCC), Jillian Campbell (UNEP), Jinhua Zhang, UNEP, Jitendra Sharma (UNEP), Krishna Kumar Tiwari, Deputy Director, Social Statistics Division (MOSPI), Kushal Vashisht, Director, International Cooperation (MOEFCC), Manoj Kumar Gangeya, Director, Hazardous Substance Management Division (MOEFCC), P Bhanumati, Deputy Director General, Social Statistics Division (MOSPI), Rakesh Kumar Maurya, Director, Social Statistics Division (MOSPI), Richa Sharma, Joint Secretary, International Cooperation (MOEFCC), Sanyukta Samaddar, Adviser (NITI Aayog), Sonu Singh, Scientist ‘E’ (MOEFCC), Surya Dasgupta, Assistant Director (MOSPI)

IISUPPORTING INDIA ON SDG 12 MONITORING AND REPORTINGA Critical Appraisal
Abbreviations10 YFP
ABRR
AMC
ARR
ASI
BEE
BHEL
BIS
BRR
BRS
BRSR
BSI
C&D
CDP
CEA
CFCs
CIL
CPCB
CPPP
CPRI
CRC
CSR
CTC
DACFW
DAHDF
DALY
DBTK
DBTL
DGFT
DMC
DNA
10 Year Framework of Programmes on Sustainable Consumption and Production Patterns
Annual Business Responsibility Reports
Aizawl Municipal Corporation
Aggregate Revenue Requirement
Annual Survey of India
Bureau of Energy Efficiency
Bharat Heavy Electricals Limited
Bureau of Indian Standards
Business Responsibility Reporting
Basel, Rotterdam and Stockholm
Business Responsibility and Sustainability Reporting
Bombay Stock Exchange
Construction and Demolition
Carbon Disclosure Project
Central Electricity Authority
Chlorofluorocarbons
Coal India Limited
Central Pollution Control Board
Central Public Procurement Portal
Central Power Research Institute
Chemical Review Committee
Corporate Social Responsibility
Carbon tetrachloride
Department of Agriculture, Cooperation and Farmer Welfare
Department of Animal Husbandry & Dairying
Disability Adjusted Life Years
Direct Benefit Transfer in PDS Kerosene
Direct Benefit Transfer of Domestic LPG
Directorate General of Foreign Trade
Domestic Material Consumption
Designated National Authority

IIISUPPORTING INDIA ON SDG 12 MONITORING AND REPORTINGA Critical Appraisal
DST
EGOM
ESD
ESG
FAO
FCI
FLI
FLP
FSI
FWI
GCED
GDP
GEF
GeM
GERD
GFR
GI
GIF
GRI
HCFCs
HPMP
HSMD
HW
IEA
ILO
IMF
IOC
IRENA
ITEC
LLIN
LODR
LPG
MCA
MEA
Department of Science and Technology
Empowered Group of Ministers
Education for Sustainable Development
Environmental, Social, Governance
Food and Agriculture Organisation
Food Corporation of India
Food Loss Index
Food Loss Percentages
Forest Survey of India
Food Waste Index
Global Citizenship Education
Gross Domestic Product
Global Environmental Facility
Government e-Market
Gross Domestic Expenditure on Research and Development
General Financial Rules
Global Indicator
Global Indicator Framework
Global Reporting Initiative
Hydrochlorofluorocarbons
HCFC Phase-out Management Plan
Hazardous Substances Management Division
Hazardous Waste
International Energy Agency
International Labour Organization
International Monitory Fund
Indian Oil Corporation
International Renewable Energy Agency
Indian Technical and Economic Cooperation
Long Lasting Insecticidal Nets
Listing Obligations and Disclosure Requirements
Liquefied Petroleum Gas
Ministry of Corporate Affairs
Multilateral Environmental Agreement
IVSUPPORTING INDIA ON SDG 12 MONITORING AND REPORTINGA Critical Appraisal
MHRD
MIA
MMDR
MOAFW
MOCAFPD
MOCF
MOEFCC
MOF
MOHUA
MOJS
MOPNG
MOSPI
MOST
MOT
MSE
MSIHC
MSME
MSW
MSY
MTOE
NEP
NFP
NGRBC
NI
NIF
NIPFP
NITI
NSE
NSSO
NTPC
NVGs
OECD
OMCs
PCBs
Ministry of Human Resource Development
Minamata Initial Assessment
Minerals and Mining Development Regulatory Act
Ministry of Agriculture and Farmers Welfare
Ministry of Consumer Affairs, Food & Public Distribution
Ministry of Chemicals and Fertilizers
Ministry of Environment Forests and Climate Change
Ministry of Finance
Ministry of Housing and Urban Affairs
Ministry of Jal Shakti
Ministry of Petroleum and Natural Gas
Ministry of Statistics and Programme Implementation
Ministry of Science and Technology
Ministry of Tourism
Medium and Small Enterprise
Manufacture, Storage and Import of Hazardous Chemicals
Ministry of Micro, Small and Medium Enterprises
Municipal Solid Waste
Minimum Sustainable Yield
Million Tonne of Oil Equivalent
National Environment Policy
National Focal Point
National Guidelines on Responsible Business Conduct
National Indicator
National Indicator Framework
National Institute of Public Finance and Policy
National Institution for Transforming India
National Stock Exchange
National Sample Survey Office
National Thermal Power Corporation
National Voluntary Guidelines
Organisation for Economic Co-operation and Development
Oil Marketing Companies
Polychlorinated Biphenyls

VSUPPORTING INDIA ON SDG 12 MONITORING AND REPORTINGA Critical Appraisal
PCCs
PDS
PIC
POFA
POPs
PSU
RFD
RPAC
SAIL
SASB
SCAAP
SCP
SDGs
SEBI
SEBs
SEEA
SOPs
SPCBs
SPP
STCI
STP
TERI
TSDF
ULBs
UNCED
UNEP
UNESCO
UNGC
UNSD
UNWTO
VNR
WHO
WTO
Pollution Control Committees
Public Distribution System
Prior Informed Consent
Perfluorooctanoic Acid
Persistent Organic Pollutants
Public Sector Utilities
Results Framework Document
Regional Policy Advocacy Component
Steel Authority of India Limited
Sustainability Accounting Standards Board
Special Commonwealth African Assistance Programme
Sustainable Consumption and Production
Sustainable Development Goals
Securities and Exchange Board of India
State Electricity Boards
United Nations System of Environmental and Economic Accounting
Standard Operating Procedures
State Pollution Control Boards
Sustainable Public Procurement
Sustainable Tourism Criteria
Sewage Treatment Plant
The Energy and Resources Institute
Treatment, Storage and Disposal Facilities
Urban Local Bodies
United Nations Conference on Environment and Development
United Nations Environment Programme
United Nations Educational, Scientific and Cultural Organization
UN Global Compact
United Nations Statistics Division
United Nations World Tourism Organization
Voluntary National Review
World Health Organization
World Trade Organization
VISUPPORTING INDIA ON SDG 12 MONITORING AND REPORTINGA Critical Appraisal
Executive Summary India has 17 per cent of the world population and is key to global achievement of sustainable development goals (SDGs). Given the federal nature of the country, state and local governments play a pivotal role in implementing sustainable development. There has been a focus on unsustainable patterns of production and consumption since Agenda 21, the outcome document of the United Nations Conference on Environment and Development (UNCED), which marked the period of norm cascading of sustainable development in the global discourse. The inclusion of responsible consumption and production as a distinct goal under SDGs provides further impetus to policy action along with monitoring and reporting.
India’s National Environmental Policy (NEP) of 2006 highlighted the fact that unsustainable consumption patterns, particularly in industrialized countries have serious adverse impacts on the environment, both local and global. Along with the principle of the ‘polluter pays’, NEP underscored that efficiency of resource use may also be accomplished by the use of policy instruments that create incentives to minimize wasteful use and consumption of natural resources.
This study was conducted under the Regional Policy Advocacy Component under SWITCH-Asia, which is supported by the European Union and managed by the United Nations Environment Programme (UNEP). After discussions with the Ministry of Environment Forests and Climate Change (MOEFCC) and Ministry of Statistics and Programme Implementation (MOSPI), to carry out this project, UNEP has entered into a small-scale funding agreement with The Energy and Resources Institute (TERI) to undertake a study that will provide technical support to the government. The objective of the project is to strengthen the national reporting process on SDG 12 by harmonizing the national indicator framework with the global indicator framework to the extent possible. Rooted in research and consultative processes, this knowledge product aims to systematize critical appraisal on the National Indicator Framework for SDG 12 to make recommendations for the monitoring and reporting of the different nationally defined indicators while considering aspects such as harmonization with targets, policy cycle, data limitations, and feasibility to report at sub-national levels.
The SDG NIF is an evolving framework open for revisions taking into consideration continuous improvements. One such exercise for deliberations on improving NIF was undertaken in 2019 through the sectoral committee on ‘Environment and Climate Change’ where the study team participated as experts. According to the latest Progress Report prepared by MOSPI on the NIF, for SDG 12, out of 15 national indicators, 9 are reported on while the rest of the 6 are ‘under compilation’. The report also benefitted from consultations with government officials as well as experts from the UN system. A national consultative dialogue1 was also organized under the project, which brought together experts and stakeholders including NITI Aayog, Ministry of Environment, Forest and Climate Change (MOEFCC), and Ministry of Statistics and Programme Implementation (MOSPI) along with representatives from various international agencies, government agencies, research institutes and non-governmental organizations to deliberate on issues covered under the eleven targets of SDG 12.
1 Proceedings of the workshop can be accessed from https://www.teriin.org/event/national-consultative-roundtable-dialogue-reporting-and-moni-toring-sdg-12

VIISUPPORTING INDIA ON SDG 12 MONITORING AND REPORTINGA Critical Appraisal
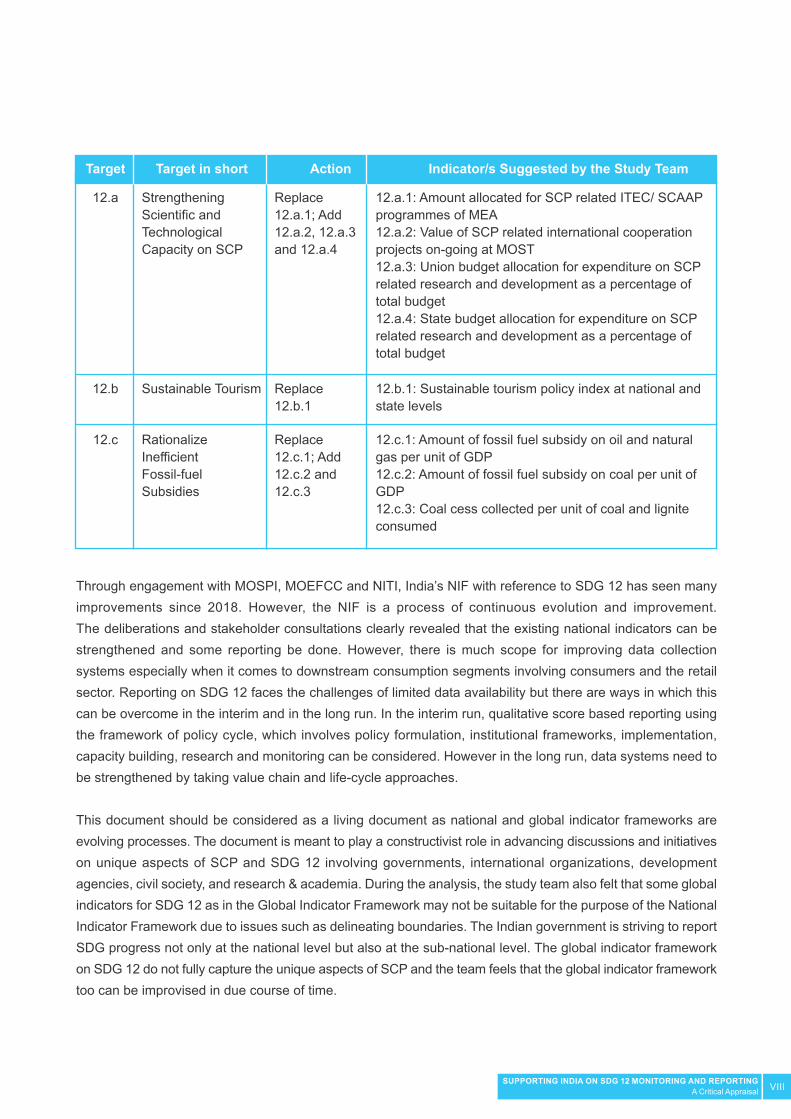
Target-wise recommendations for immediate considerations are tabulated as follows.
10YFP on SCP
Address Food Loss and Waste
Hazardous Waste and Chemicals
Waste Management
Sustainable Public Procurement
Awareness and Education on SustainableDevelopment and Lifestyles
Sustainability Practices by Companies
Natural Resources 12.2.1: Percentage variation in per capita use of natural resources12.2.1 (i): Percentage variation in per capita use of metallic ores12.2.1 (ii): Percentage variation in per capita use of non-metallic minerals12.2.1 (iii): Percentage variation in per capita use of oil12.2.1 (iv): Percentage variation in per capita use of coal12.2.1 (v): Percentage variation in per capita use of natural gas12.2.1 (vi): Per capita variation in groundwater use
12.1.1: Sustainable consumption and production action plan or framework at national and state level
12.3.3: Food loss
12.4.1 National compliance with international multilateral environmental agreements on hazardous waste and other chemicals
12.5.1: Solid waste treatment rate12.5.2: Source segregation rate12.5.3: Percentage of states/ UTs putting partial or complete ban on single use plastic products (carry bags)
12.7.1: Degree of SPP at the national level12.7.2: Degree of SPP at state levels12.7.3: Degree of SPP at municipal/ city levels12.7.4: Degree of SPP in public enterprises
12.8.1: Extent to which (i) global citizenship education and (ii) education for sustainable development are mainstreamed in (a) national and state education policies; (b) curricula; (c) teacher education; and (d) student assessment 12.8.2: Expenditure on awareness activities for sustainable development and lifestyles by the Ministry of Information and Broadcasting and Ministry of Environment, Forest and Climate Change
12.6.1: BRSR/BRR compliance rate12.6.2: CSR reporting compliance rate
12.1
12.3
12.4
12.5
12.7
12.8
12.6
12.2
Replace 12.1.1
Retain; Add 12.3.3
Replace 12.4.1; Retain
Replace all
Replace 12.7.1; Add
Strengthen 12.8.1; Add 12.8.2
Replace all
Retain but disaggregate
Target ActionTarget in short Indicator/s Suggested by the Study Team
VIIISUPPORTING INDIA ON SDG 12 MONITORING AND REPORTINGA Critical Appraisal
Through engagement with MOSPI, MOEFCC and NITI, India’s NIF with reference to SDG 12 has seen many improvements since 2018. However, the NIF is a process of continuous evolution and improvement. The deliberations and stakeholder consultations clearly revealed that the existing national indicators can be strengthened and some reporting be done. However, there is much scope for improving data collection systems especially when it comes to downstream consumption segments involving consumers and the retail sector. Reporting on SDG 12 faces the challenges of limited data availability but there are ways in which this can be overcome in the interim and in the long run. In the interim run, qualitative score based reporting using the framework of policy cycle, which involves policy formulation, institutional frameworks, implementation, capacity building, research and monitoring can be considered. However in the long run, data systems need to be strengthened by taking value chain and life-cycle approaches.
This document should be considered as a living document as national and global indicator frameworks are evolving processes. The document is meant to play a constructivist role in advancing discussions and initiatives on unique aspects of SCP and SDG 12 involving governments, international organizations, development agencies, civil society, and research & academia. During the analysis, the study team also felt that some global indicators for SDG 12 as in the Global Indicator Framework may not be suitable for the purpose of the National Indicator Framework due to issues such as delineating boundaries. The Indian government is striving to report SDG progress not only at the national level but also at the sub-national level. The global indicator framework on SDG 12 do not fully capture the unique aspects of SCP and the team feels that the global indicator framework too can be improvised in due course of time.
Sustainable Tourism
Strengthening Scientific and Technological Capacity on SCP
Rationalize Inefficient Fossil-fuel Subsidies
12.b.1: Sustainable tourism policy index at national and state levels
12.a.1: Amount allocated for SCP related ITEC/ SCAAP programmes of MEA12.a.2: Value of SCP related international cooperation projects on-going at MOST12.a.3: Union budget allocation for expenditure on SCP related research and development as a percentage of total budget 12.a.4: State budget allocation for expenditure on SCP related research and development as a percentage of total budget
12.c.1: Amount of fossil fuel subsidy on oil and natural gas per unit of GDP12.c.2: Amount of fossil fuel subsidy on coal per unit of GDP12.c.3: Coal cess collected per unit of coal and lignite consumed
12.b
12.a
12.c
Replace 12.b.1
Replace 12.a.1; Add 12.a.2, 12.a.3 and 12.a.4
Replace 12.c.1; Add 12.c.2 and 12.c.3
Target ActionTarget in short Indicator/s Suggested by the Study Team
IXSUPPORTING INDIA ON SDG 12 MONITORING AND REPORTINGA Critical Appraisal
The study is a humble attempt to arrive at recommendations for indicators that can be reported on immediately and also capture unique aspects of SCP. In many areas as far as SCP is concerned, based on the inputs received by stakeholders and experts, the study also suggests areas where strengthening data systems should be urgently initiated. Merely having a SCP related polices in place does not warranty positive environmental and social outcomes. Micro-studies are essential to better understand the impact of SCP policies.
It is 2021 and we are already in the crucial decade where progress on SDGs has to be accelerated to meet the Agenda 2030 goals by 2030. While striving for the perfect indicators and data collection systems, lack of data should not stall reporting and having a monitoring framework in place. The study team would be happy to take the research and capacity building agenda on strengthening awareness as well as for reporting on unique aspects of SDG 12 in India and internationally.

1SUPPORTING INDIA ON SDG 12 MONITORING AND REPORTINGA Critical Appraisal
IntroductionContext
There has been a focus on unsustainable patterns of production and consumption since the adoption of Agenda 21. Agenda 21 is the outcome document of the United Nations Conference on Environment and Development (UNCED) that marked the period of norm cascading of sustainable development in the international discourse. Following UNCED, sustainable consumption and production (SCP) was integral to the discussion at the World Summit on Sustainable Development, Johannesburg in 2002. Responsible consumption and production is now one of the seventeen sustainable development goals (SDGs). SDG 12 seeks to encourage reduction of wasteful consumption and efficiency in production patterns by raising awareness and promoting responsible practices among governments, businesses and consumers.
SWITCH-Asia is a programme funded by the European Union to promote sustainable consumption and production to contribute to the economic prosperity and poverty reduction in Asia. The programme is implemented through three components: i) the SWITCH-Asia Regional Policy Advocacy Component (RPAC); ii) the Sustainable Consumption and Production (SCP) Facility, and iii) Grants. Every component is managed by a different organization. The RPAC is managed by the United Nations Environment Programme (UNEP); the overall objective of this component is to strengthen the dialogue on policies on sustainable consumption and production at the regional, sub-regional and national level. To this end, RPAC has identified the need to facilitate dialogue across the region in SDG 12 reporting.
In this context, the national activity to support India on SDG 12 monitoring and reporting was initiated by SWITCH-Asia RPAC in 2019 after discussions with the Ministry of Environment Forests and Climate Change (MOEFCC) and Ministry of Statistics and Programme Implementation (MOSPI). To carry out this project, UNEP has entered into a small-scale funding agreement with The Energy and Resources Institute (TERI) to jointly provide technical support to the government. Based on the feedback of key stakeholders, the project will also aim to build capacities and support the key actors in their roles and responsibilities for strengthening the National Indicator Framework on India. To cover this issue, an indicator will be identified for capacity building and reporting.
India’s National Environmental Policy (NEP) of 2006 highlighted the fact that unsustainable consumption patterns, particularly in industrialized countries have serious adverse impacts on the environment, both local and global. Along with the principle of the ‘polluter pays’, NEP underscored that efficiency of resource use may also be accomplished by the use of policy instruments that create incentives to minimize wasteful use and consumption of natural resources. The inclusion of responsible consumption and production as a distinct goal under the SDGs provides further impetus to policy action along with monitoring and reporting. SDG 12 is on ensuring responsible consumption and production; it promotes reduction of wasteful consumption and production patterns by encouraging governments, businesses and consumers to adopt sustainable practices.

2SUPPORTING INDIA ON SDG 12 MONITORING AND REPORTINGA Critical Appraisal
India has 17 per cent of the world population and is key to global SDG achievement. Given the federal nature of the country, state and local governments play a pivotal role in implementing sustainable development as they are responsible for seventy per cent more public spending than the central governments (NITI 2019). Figure 1.1 shows key SCP related policies in India across resource value chains both upstream and downstream.
• Sustainable Development Framework for the Mining Sector in India • Minerals and Mining Development Regulatory Act • National Mineral Policy • Coal Cess• National Policy on Biofuels 2018• National Water Policy 2012• National Mission for Sustainable Agriculture • National Bamboo Mission 2018
• National Design Policy • Science, Technology and Innovation Policy• Bureau of Indian Standards Act
• National Manufacturing Policy• National Manufacturing Competitiveness Program • ZED Certification Scheme for MSMEs
• Labelling Schemes like Ecomark• Ecotourism Policy • Sustainable Tourism Policy• National Water Policy • National Programme of Mid-Day Meal in Schools • National Water Mission• Draft National Water Framework Bill, 2016
• Steel Recycling Policy• Fly Ash Utilization Policy• Waste Management Rules• Sustainable Tourism Criteria for India • Bio-Medical Waste Management Rules 2016• Hazardous and Other Wastes (Management & Transboundary Movement) Rules, 2016• Solid Waste Management Rules, 2016 • Plastic Waste Management Rules, 2016 • E-waste (Management) Rules, 2016• Bio-medical Waste Management Rules, 2016• Batteries Management Rules, 2001
Extraction/ Upstream Resource Management
Design
Manufacturing/ Processing
Use phase
Disposal phase
Figure 1.1: SCP policies at various stages of resource value chains
Source: TERI study team

3SUPPORTING INDIA ON SDG 12 MONITORING AND REPORTINGA Critical Appraisal
Status of SDG Reporting in India
India is a signatory to the 2030 Agenda for Sustainable Development and is committed to participating in the international review of progress of SDGs. The follow-up and review of the 2030 Agenda takes place at the United Nations’ High-Level Political Forum (HLPF), which meets annually under the auspices of the UN Economic and Social Council (ECOSOC). At the HLPF, UN member countries present their Voluntary National Review (VNR) on the implementation of SDGs. India presented its second Voluntary National Review at the HLPF in July 2020; it was titled “Decade of Action: Taking SDGs from Global to Local” (NITI 2020a). At the national level, the National Institution for Transforming India (NITI) Aayog is in charge of overall coordination and monitoring of SDGs, including preparation of VNRs. NITI has undertaken a mapping exercise for which every SDG has been mapped against responsible government agencies and relevant programmes in India. MOSPI is responsible for the development of the National Indicator Framework (NIF) which considers national priorities and needs.
India’s NIF is a consolidated list of relevant indicators based on the available information and through a consultative process involving central ministries/ departments and state governments. The SDG India Index released by NITI Aayog is also an extensively comprehensive tool for monitoring of the SDGs at a sub-national level. NIF as well as NITI Aayog’s SDG India Index are expected to be the backbone of monitoring of SDGs in India for providing appropriate direction to the policies related to the SDGs. The Union Cabinet of India has approved a process for refining national indicators through a committee chaired by the secretary, MOSPI (MOSPI 2021b). Therefore, national indicators can be refined through this process (MOSPI 2018, 2019, 2020, 2021a). The indicators in the NIF are not unilaterally decided; they have been developed through a consultation process and a Cabinet Note. The Government of India has constituted a High Level Steering Committee (HLSC) under the Chairmanship of Chief Statistician of India (CSI) & Secretary, MOSPI with members from NITI Aayog, Ministry of Home Affairs, Ministry of Health and Family Welfare, Ministry of Environment, Forest and Climate Change (MOEFCC), Ministry of Finance and MoSPI to periodically review and refine the NIF. The line ministries/departments propose changes in the NIF keeping the relevancy of indicators and data availability in view. These proposals are placed before the Technical Advisory Committee (TAC), constituted in pursuance of the Terms of References of HLSC under the chairpersonship of the Director General (Statistics), MOSPI inter-alia to examine, review and recommend the proposal(s) of refinement/ deletion/ addition of indicators in NIF for approval by HLSC. For SDG 12, MOEFCC is the nodal ministry and indicators are approved by the Ministry at the level of HMEFCC before being incorporated in NIF. State governments are also expected to undertake a mapping of indicators for the development of State Indicator Frameworks (SIF) for providing policy directions to state governments. MOSPI also conducted a baseline exercise (MOSPI 2019) for reporting on the SDGs indicators that were listed in the first version of NIF (MOSPI 2018). NITI works closely with MOSPI, central ministries, state governments along with development agencies, think tanks and civil society for localizing the SDGs.

4SUPPORTING INDIA ON SDG 12 MONITORING AND REPORTINGA Critical Appraisal
The latest version of GIF includes 247 indicators, with 231 unique indicators (UN 2021). There are 308 indicators in the NIF (Version 3.0) (MOSPI 2021a). For SDG 12, the latest NIF identifies 15 indicators for SDG 12, whereas the Global Indicator Framework (GIF) identifies 13 indicators for SDG 12. National indicators and global indicators for SDG 12 are listed along with tier classification and reporting done in India (Table 1.1). Although it is desirable that the GIF be harmonized with NIF, the former is meant to inform about the SDG progress at the global level whereas the latter is meant to inform progress and policies at the national level. Moreover, NIF also serves the purpose of informing both national and sub-national policies considering national circumstances.
Table 1.1: National and global indicators under SDG 12
12.1 Implement the 10-Year Framework of Programmes on Sustainable Consumption and Production Patterns, all countries taking action, with developed countries taking the lead, taking into account the development and capabilities of developing countries
12.2 By 2030, achieve the sustainable management and efficient use of natural resources
12.3 By 2030, halve per capita global food waste at the retail and consumer levels and reduce food losses along production and supply chains, including post-harvest losses
12.1.1 Number of countries developing adopting or implementing policy instruments aimed at supporting the shift to sustainable consumption and production
12.2.1 Material footprint,material footprint per capita, and material footprint per GDP
12.2.2 Domestic material consumption, domestic material consumption per capita, and domestic material consumption per GDP
12.3.1 (a) Food loss index and (b) food waste index
12.1.1 Number of countries with sustainable consumption and production (SCP) national action plans or SCP mainstreamed as a priority
12.2.1 Percentage variation in per capita use of natural resources
12.3.1 Per capita food availability, (kg per year per person)
12.3.2 Post harvest storage and distribution losses of central/states pool stocks of wheat and rice
Tier II
Tier II
Tier I
Tier II
No
No
Yes
Yes
Target Tier ReportingGlobal Indicator National Indicator

5SUPPORTING INDIA ON SDG 12 MONITORING AND REPORTINGA Critical Appraisal
12.4 By 2020, achieve the environmentally sound management of chemicals and all wastes throughout their life cycle, in accordance with agreed international frameworks, and significantly reduce their release to air, water and soil in order to minimize their adverse impacts on human health and the environment
12.5 By 2030, substantially reduce waste generation through prevention, reduction, recycling and reuse
12.6 Encourage companies, especially large and transnational companies, to adopt sustainable practices and to integrate sustainability information into their reporting cycle
12.7 Promote public procurement practices that are sustainable, in accordance with national policies and priorities
12.4.1 Number of parties to international multilateral environmental agreements on hazardous waste, and other chemicals that meet their commitments and obligations in transmitting information as required by each relevant agreement
12.4.2 (a) Hazardous waste generated per capita; and (b) proportion of hazardous waste treated, by type of treatment
12.5.1 National recycling rate, tons of material recycled
12.6.1 Number of companies publishing sustainability reports
12.7.1 Degree of sustainable public procurement policies and action plan implementation
12.4.1 Whether the country has ratified international multilateral environmental agreements on hazardous waste and other chemicals
12.4.2 (a) Hazardous waste generated per capita (in MT/ person); and (b) proportion of hazardous waste treated, by type of treatment
12.5.1 Number of waste recycling plants installed
12.5.2 Number of municipal corporations using waste segregation techniques
12.5.3 Number of municipal corporations banning single use plastic
12.6.1 Proportion of companies publishing sus-tainability reports
12.7.1 Green public procurement policy developed and adopted by the Central Ministries/States/UTs (Numbers)
Tier I
Tier II
Tier II
Tier II
Tier II
Yes
Yes
Yes
Yes
No
No
No
Target Tier ReportingGlobal Indicator National Indicator
6SUPPORTING INDIA ON SDG 12 MONITORING AND REPORTINGA Critical Appraisal
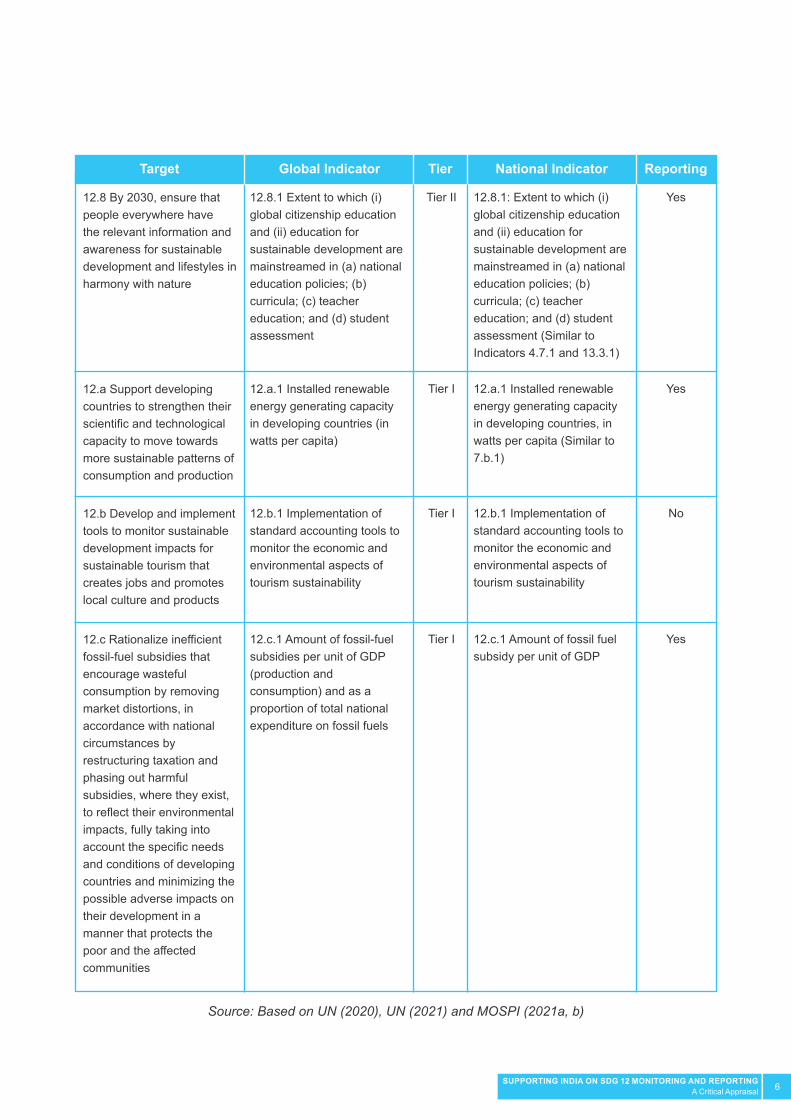
12.a Support developing countries to strengthen their scientific and technological capacity to move towards more sustainable patterns of consumption and production
12.b Develop and implement tools to monitor sustainable development impacts for sustainable tourism that creates jobs and promotes local culture and products
12.c Rationalize inefficient fossil-fuel subsidies that encourage wasteful consumption by removing market distortions, in accordance with national circumstances by restructuring taxation and phasing out harmful subsidies, where they exist, to reflect their environmental impacts, fully taking into account the specific needs and conditions of developing countries and minimizing the possible adverse impacts on their development in a manner that protects the poor and the affected communities
12.8 By 2030, ensure that people everywhere have the relevant information and awareness for sustainable development and lifestyles in harmony with nature
12.a.1 Installed renewable energy generating capacity in developing countries (in watts per capita)
12.b.1 Implementation of standard accounting tools to monitor the economic and environmental aspects of tourism sustainability
12.c.1 Amount of fossil-fuel subsidies per unit of GDP (production and consumption) and as a proportion of total national expenditure on fossil fuels
12.8.1 Extent to which (i) global citizenship education and (ii) education for sustainable development are mainstreamed in (a) national education policies; (b) curricula; (c) teacher education; and (d) student assessment
12.a.1 Installed renewable energy generating capacity in developing countries, in watts per capita (Similar to 7.b.1)
12.b.1 Implementation of standard accounting tools to monitor the economic and environmental aspects of tourism sustainability
12.c.1 Amount of fossil fuel subsidy per unit of GDP
12.8.1: Extent to which (i) global citizenship education and (ii) education for sustainable development are mainstreamed in (a) national education policies; (b) curricula; (c) teacher education; and (d) student assessment (Similar to Indicators 4.7.1 and 13.3.1)
Tier I
Tier I
Tier I
Tier II
Yes
No
Yes
Yes
Target Tier ReportingGlobal Indicator National Indicator
Source: Based on UN (2020), UN (2021) and MOSPI (2021a, b)

7SUPPORTING INDIA ON SDG 12 MONITORING AND REPORTINGA Critical Appraisal
According to the Progress Report prepared by MOSPI on the NIF, for SDG 12, out of 15 national indicators, 9 are reported on whereas the rest of the 6 are ‘under compilation’ (MOSPI 2021b). Conversely, the India SDG Index2 prepared by NITI, which considers 2019 data3, had several indicators under SDG 12 (NITI 2020). These include: (1) Groundwater withdrawal against availability (%); (2) Percentage use of nitrogen fertilizer out of the total NPK (nitrogen phosphorous potassium); (3) Per capita hazard waste generated; (4) Ratio of processed quantity of hazard waste sent to recycle to hazard waste generated; (5) Municipal solid waste (MSW) treated against MSW generated (%); (6) Installed capacity of grid interactive bio power per 100000 population; and (7) Wards with 100 per cent source segregation (%). There is no strict one to one mapping between SDG NIF indicators and SDG India Index indicators and the difference between the two is due to the latter considering state data as a key factor. Although the two frameworks are not strictly comparable, they can be harmonized with each other to the extent possible4 In the absence of data availability for the NIF indicators, seven proxy indicators were used in the SDG India Index 2019–20 for Goal 12 with reasonable alignment with the SDG Targets mentioned in GIF.
The SDG NIF is an evolving framework open for revisions taking into consideration continuous improvements. One such exercise for updating of NIF was undertaken in 2019 through the sectoral committee on ‘Environment and Climate Change’ where the study team participated as experts5. The findings and recommendations of this study are expected to contribute to future updating of India’s NIF.
2 The SDG Index by NITI Aayog tracks the progress of all states and union territories (UTs) on a set of 100 National Indicators derived from the National
Indicator Framework, measuring their progress on the outcomes of interventions and schemes of the Government of India. The SDG India Index 2019–20 is
intended to provide a holistic view on the social, economic and environmental status of the country and its states and UTs. It has been designed to provide
an aggregate assessment of the performance of all Indian states and UTs, and to help leaders and change makers evaluate their performance on social,
economic and environmental parameters.3 At the time of writing this report, Niti Aayog’s SDG index release for 2020 was postponed due to the Model Code of Conduct for the state assembly elections. 4 For example, in SDG India Index ‘Percentage ground water withdrawal against availability’ has been taken in SDG 12, which is also available in NIF as
Indicator 6.4.1 as it is considered to be more relevant to the SDG Target 6.4 while finalizing the NIF. Similarly, NITI has considered the indicator ‘Percentage
use of nitrogenous fertilizer to total fertilizer (N, P & K)’ under SDG 12 and this indicator is NIF indicator 14.1.3 as the same is considered more relevant to
SDG Target 14.1.5 MOSPI has constituted six sectoral committees for working on the methodologies of SDG indicators. These sectoral committees consisting of members
inter-alia, using relevant data source from ministries, UN agencies/development partners, research institutions, will mainly work together to evolve a methodology
for Tier III global indicators, examination of Tier I and Tier II global indicators in the Indian context and identifying data gaps in the monitoring of SDGs. The
study team was invited to these meetings; the study team thanks MOSPI for engaging in constructive discussions.

8SUPPORTING INDIA ON SDG 12 MONITORING AND REPORTINGA Critical Appraisal
Objectives
The objective of the project is to strengthen the national reporting process on SDG 12 by harmonizing the national indicator framework with the global indicator framework to the extent possible. Rooted in research and consultative processes, this knowledge product aims to systematize critical appraisal on the National Indicator Framework for SDG 12 to make recommendations for the monitoring and reporting of the different nationally defined indicators while considering aspects such as harmonization with targets, policy cycle, data limitations, and feasibility to report at sub-national levels.
Approach
The document is structured around the eleven targets of SDG 12 and indicators proposed in NIF. For each target, current indicators in the National Indicator Framework and the Global Indicator Framework are analysed in terms of their methodology. Further, each target chapter maps key policies, programmes and initiatives currently being implemented in India on specific SDG 12 targets. Each chapter also critically appraises the indicators pointing to their limitations. This is followed by a section on ‘methodology and data’ that details the methodology for reporting and the availability of data. Finally, recommendations are made in terms of the indicator, flow of data from different sources/levels and computation details in the MOSPI metadata template. Based on the assessment under the various sections mentioned earlier, recommendations are provided for monitoring and reporting by identifying/suggesting indicators, which are based on four criteria including relevance to the target, harmonization with the global indicator, data availability and possibility of disaggregation at the state level. All the indicators are grounded in national policies and initiatives and their practicality in the Indian context while exploring their harmonisation with the global indicators to the extent possible. Another key aspect considered was the policy cycle, wherein there were many new areas where data was not available. It was felt that qualitative metrics involving policies can be considered.
The approach for the exercise has been based on review of primary and secondary literature. Figure 1.2 depicts the approach of the study. Preliminary findings were presented or circulated to key stakeholders who were given time to respond to the comments. These stakeholders include officials from ministries in India and experts from UNEP. For consultations and validation, the study team participated in meetings with the Sectoral Committee on Environment and Climate Change; these meetings were convened by MOSPI for the national indicator framework. The team attended four of these meetings where a presentation on the study was made before the participants to solicit their feedback. Moreover, UNEP also sent draft chapters to the concerned nodal ministries for their inputs and meetings were arranged where the officials wanted a further discussion.

9SUPPORTING INDIA ON SDG 12 MONITORING AND REPORTINGA Critical Appraisal
The suggestion on indicators considers aspects such as relevance to national policies, targets under SDG 12 as well as availability of data. Available data is considered not only in terms of publicly available reports and publications but also primary information that can be collected through questionnaires by various government agencies. The report benefitted from feedback from key agencies and line ministries. In fact, in the process of preparing the report, the national indicators on SDG 12 have been revised by MOSPI. The Energy and Resources Institute (TERI) with the United Nations Environment Programme (UNEP), through the European Union funded SWITCH-Asia RPAC, organised a consultative dialogue on monitoring and reporting of Sustainable Development Goal (SDG) 12 - Sustainable Consumption and Production (SCP) on 2 March, 2021. The event brought together experts and stakeholders including NITI Aayog, Ministry of Environment, Forest and Climate Change (MOEFCC), and Ministry of Statistics and Programme Implementation (MOSPI) along with representatives from various international agencies, government agencies, research institutes and non-governmental organizations to deliberate on issues covered under the eleven targets of SDG 12. The draft study finding were presented at the event for obtaining inputs for strengthening the national reporting process on SDG 12. The team is grateful to all the participants for their valuable inputs.
Figure 1.2: Study approach
Source: TERI study team
Literature review and desk based research
Consultation and validation
Refining chapters and indicators
Meta-data for all indicators
Final report
Draft chapters and indicatiors
Criterion 1:Relevance to target
and national policies
Criterion 2:Harmonization with
the global indicator
Criterion 3:Data availability
Criterion 4:Disaggregation at the
state level where possible

10SUPPORTING INDIA ON SDG 12 MONITORING AND REPORTINGA Critical Appraisal
References
MOSPI (Ministry of Statistics and Programme Implementation) (2018), Sustainable Development Goals: National Indicator Framework (November, 2018), New Delhi: MOSPI, Government of India. MOSPI (Ministry of Statistics and Programme Implementation) (2019), Sustainable Development Goals National Indicator Framework Baseline Report 2015-16, New Delhi: MOSPI, Government of India.
MOSPI (Ministry of Statistics and Programme Implementation) (2020), Sustainable Development Goals: National Indicator Framework (March, 2020), New Delhi: MOSPI, Government of India.
MOSPI (Ministry of Statistics and Programme Implementation) (2021a), Sustainable Development Goals: National Indicator Framework (Version 3.0 as on 31.03.2021), New Delhi: MOSPI, Government of India.
MOSPI (Ministry of Statistics and Programme Implementation) (2021b), Sustainable Development Goals National Indicator Progress Report (Version 3), New Delhi: MOSPI, Government of India.
NITI (National Institution for Transforming India) (2020a), India VNR 2020: Decade of Action-Taking SDGs from Global to Local, New Delhi: NITI.
NITI (National Institution for Transforming India) (2020b), SDG India Index and Dashboard: 2019-20, New Delhi: NITI.
UN (United Nations) (2012), The Future We Want: Outcome Document of the United Nations Conference on Sustainable Development (A/CONF.216/5), New York: UN.
UN (United Nations) (2020), Global Indicator Framework for the Sustainable Development Goals and Targets of the 2030 Agenda for Sustainable Development (A/RES/71/313), New York: UN
UN (United Nations) (2021), Tier Classification for Global SDG Indicators (Version 29 March 2021), New York: UN.

11SUPPORTING INDIA ON SDG 12 MONITORING AND REPORTINGA Critical Appraisal
Target 12.1 (10YFP on SCP)Snapshot of Target 12.1
Policy Relevance
Mainstreaming sustainable consumption and production in decision-making at all levels is a core function of the 10 Year Framework of Programmes on Sustainable Consumption and Production Pattern (10YFP). Expected to “support the integration of sustainable consumption and production (SCP) into sustainable development policies, programmes and strategies, as appropriate, including, where applicable, into poverty reduction strategies” (UN 2012), the 10YFP is implemented through its platform, the One Planet Network, formed over the last seven years.
Target 12.1: Implement the 10-Year Framework of Programmes on Sustainable Consumption and Production Patterns, all countries taking action, with developed countries taking the lead, taking into account the development and capabilities of developing countries
Indicator
Suggested National Indicator
Indicator
12.1.1: Number of countries developing, adopting or implementing policy instruments aimed at supporting the shift to sustainable consumption and production
Sustainable consumption and production action plan or framework at national and state levels
12.1.1: Number of countries with sustainable consumption and production (SCP) national action plans or SCP mainstreamed as a priority or a target into national policies
Yes
In sync with global indicator
No
Tier II
Various line ministries and state departments
MOEFCC
Data Availability for India
Note
Baseline data Availabilityfor India
Tier Classification6
Data Sources
Data source
Global Indicator Framework (UN 2021, 2020a, 2020b)
Recommendations by Study Team
National Indicator Framework (MOSPI 2021, 2020a, 2020b)
6 Tier I: Indicator is conceptually clear; it has an internationally established methodology; standards are available; and data are regularly produced by countries
for at least 50 per cent of countries and of the population in every region where the indicator is relevant.
Tier II: Indicator is conceptually clear; it has an internationally established methodology; standards are available; but data are not regularly produced by
countries.
Tier III: No internationally established methodology or standards are yet available for the indicator, but methodology/standards are being (or will be) developed
or tested.

12SUPPORTING INDIA ON SDG 12 MONITORING AND REPORTINGA Critical Appraisal
The purpose of Indicator 12.1.1 is to help assess the level of inclination of governments towards promoting SCP practices. This indicator also captures the orientation and progression of the policy instruments used towards SCP. Thus, it evaluates the governments’ progress in development and application of policies addressing sustainable consumption and production, whether at cross-cutting or sectoral level. The indicator is also considering both legal and non-legal instruments. The first category is essential to the shift, as legal instruments can be binding in nature and provides the ground for enforcement or incentives for SCP. The ability to develop, pass and implement legislative provisions is an indication of the jurisdictions’ engagement in the shift towards sustainable consumption and production. The second category is also essential to ensure institutional engagement, commitment and ownership. In some cases, non-binding policy instruments can lead to the creation of new legal ones. The development and implementation of non-binding instruments across sectors also provides information on engagement of partners and other stakeholders in SCP. Table 2.1 depicts existing frameworks and policies in India on SCP sectors.
Table 2.1: Existing frameworks and policies in India for SCP sectors
Agriculture and fishery; Buildings
Industrial sector (including MSMEs)
Energy
National Mission for Sustainable Agriculture (NMSA)
National Mission on Enhanced Energy Efficiency (Standard and Labelling Programme, Demand side management in agriculture (Ag DSM), 2009)
National Manufacturing Policy, 2011
National Policy on Electronics, 2012
Electricity Act, 2003
Zero-Defect, Zero-Effect
Super-Efficient Equipment Programme
Ecomark Labelling Scheme
The Standards and Labelling Programme including star labels by the Bureau of Energy Efficiency
Renewable Energy Certification, 2010
Science , Technology and Innovation Policy 2013 (STI Policy 2013)
Energy Conservation Act, 2001
National Mission on Enhanced Energy Efficiency under NAPCC
Energy Conservation Plan
Energy Conservation Building Code
1
2
3
# Sector SCP Policies

13SUPPORTING INDIA ON SDG 12 MONITORING AND REPORTINGA Critical Appraisal
Tourism
Public Sector Consumption
Water resources and sanitation
Green Rating for Integrated Habitat Assessment
Unnat Jyoti by Affordable LEDs for All
End to End Energy Efficiency (4E) for MSME sector
National Tourism Policy, 2002
Sustainable Tourism Criteria for India (STCI)
Indian Adventure Tourism Guidelines, 2018 (MOT 2018b)
Task Force on Sustainable Public Procurement
Bureau of Energy Efficiency (standards, labelling, guidelines, awareness and knowledge sharing)
Government e-Marketplace
Quality Council of India (QCI)
ECO MARK, Product Certification, Third party certification by Bureau of Indian Standards
Develop minimum energy performance standards and start labelling by Bureau of Energy Efficiency.
Make in India
Zero-Effect Zero-Defect (ZED)
Scheme Government e-Market place (GeM)
National Water
Swachh Bharat Mission
National Mission for Clean Ganga
National River Conservation Plan
Mission National Lake Conservation Plan
Model Bill for the Conservation, Protection, Regulation and Management of Groundwater, 2016
National Rural Drinking Water Programme
4
5
6
# Sector SCP Policies
14SUPPORTING INDIA ON SDG 12 MONITORING AND REPORTINGA Critical Appraisal
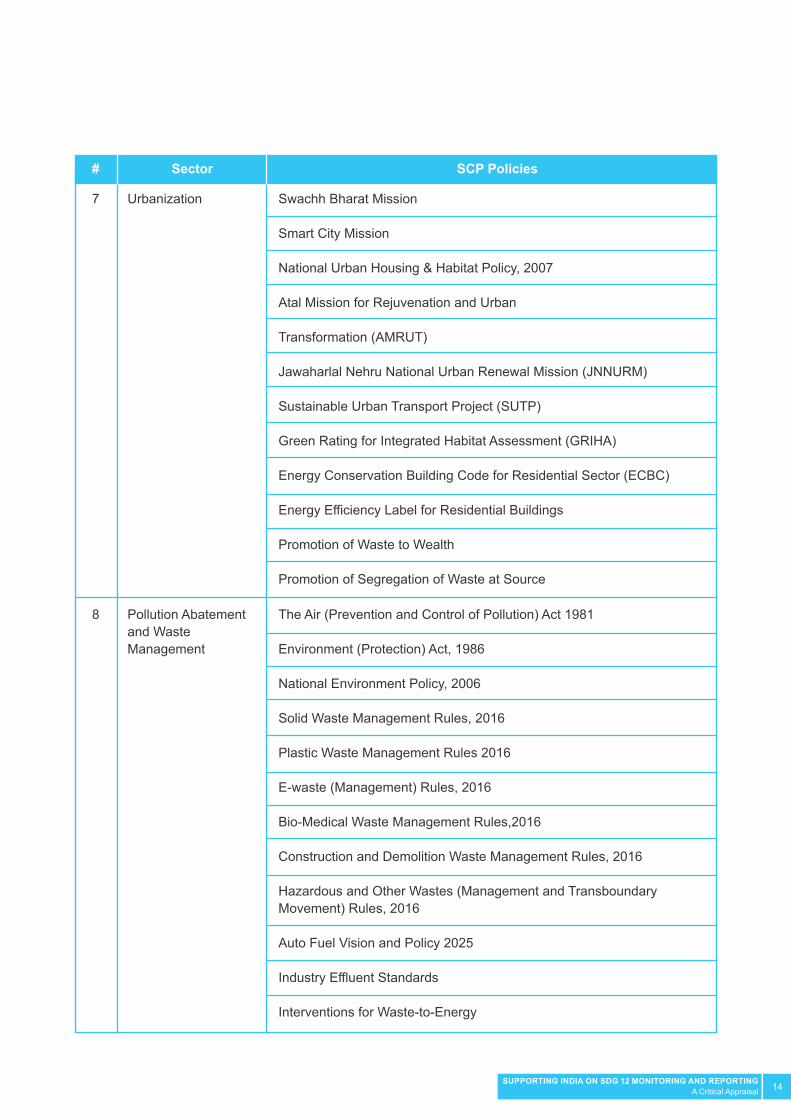
Urbanization
Pollution Abatement and Waste Management
Swachh Bharat Mission
Smart City Mission
National Urban Housing & Habitat Policy, 2007
Atal Mission for Rejuvenation and Urban
Transformation (AMRUT)
Jawaharlal Nehru National Urban Renewal Mission (JNNURM)
Sustainable Urban Transport Project (SUTP)
Green Rating for Integrated Habitat Assessment (GRIHA)
Energy Conservation Building Code for Residential Sector (ECBC)
Energy Efficiency Label for Residential Buildings
Promotion of Waste to Wealth
Promotion of Segregation of Waste at Source
The Air (Prevention and Control of Pollution) Act 1981
Environment (Protection) Act, 1986
National Environment Policy, 2006
Solid Waste Management Rules, 2016
Plastic Waste Management Rules 2016
E-waste (Management) Rules, 2016
Bio-Medical Waste Management Rules,2016
Construction and Demolition Waste Management Rules, 2016
Hazardous and Other Wastes (Management and Transboundary Movement) Rules, 2016
Auto Fuel Vision and Policy 2025
Industry Effluent Standards
Interventions for Waste-to-Energy
7
8
# Sector SCP Policies

15SUPPORTING INDIA ON SDG 12 MONITORING AND REPORTINGA Critical Appraisal
Finance State Energy Conservation Fund (SECF)
Scheme SDBI Make in India Soft Loan Fund for Micro, Small and Medium Enterprises (SMILE)
Green Energy Corridor
National Clean Energy and Environment Fund
Partial Risk Guarantee Fund Framework for Energy-Efficient Economic Development (FEED)
Venture Capital Fund for Energy Efficiency (VCFEE)
ESCerts (Energy Saving Certificates)
Renewable Energy Certificates
Green Masala Bonds
Green Infrastructure Bond
9
# Sector SCP Policies
Source: TERI study team
Conceptualization
This indicator can be classified as a qualitative indicator that shows the presence of a SCP policy in the national plans or SCP mainstreaming as a priority or target in national policies. It encompasses policy instruments including macro-, regulatory, voluntary and financial policies supporting the shift to SCP. These policies incorporate policies that identify SCP as a key priority, policies focused on SCP and sectoral policies with SCP objectives.
Global Indicator Framework
Under this indicator, the global indicator framework reports when a government have moved through one or more stage(s) of ‘policy cycle’ on one or more policy instrument(s) during the reporting period. This indicator is calculated at relevant aggregation levels based on information collected from the National Focal Points and other government officials; users of the data should be mindful of double counting the same policy when aggregating data each year. This is more of an implementation framework rather than a target and actually covers all other targets. The 10YFP has National Focal Points who are designated by governments to act as liaisons between countries with UNEP serving as the 10YFP Secretariat; it also has programmes of the One Planet Network in line with SCP priorities at national and regional levels. For India, the National Focal Point is based at MOEFCC, International Cooperation Division.

16SUPPORTING INDIA ON SDG 12 MONITORING AND REPORTINGA Critical Appraisal
Policy
Type of macro-policy
Focus
Type of instrument
Sectors
Impact measured
Macro-policy; policy instrument
Macro-policy focused on SCP; macro-policy with SCP as a key priority/objective; sectoral macro-policy with SCP objectives
Macro-policy with SCP as a key priority; sustainable development; green economy/green growth; circular economy; development/poverty eradication
Regulatory/legal; economic/financial; voluntary/self-regulatory
Agriculture and fishery; Buildings and construction; Consumer goods; Culture and recreation; Financial sector; Education; Energy; Food & Beverage; Forestry; Environmental protection; Environmental services; Government and Civil Society; Housing; Industrial sector (Including SMEs); Scientific Research, Development and Innovation; Tourism; Transport; Waste (including Chemicals); Water.
Resource efficiency; environmental impact; human well-being
Disaggregation Criterion
Source: Based on UNEP (2018)
The primary objectives of the One Plan for One Planet strategy of the 10 YFP are to:
• Establish an effective implementation mechanism for Goal 12 of the United Nations 2030 Agenda for Sustainable Development. • Catalyse ambitious actions by providing tools and solutions that support the shift to sustainable consumption and production. • Lead the systemic and cohesive implementation of sustainable consumption and production. • Demonstrate the impacts of sustainable consumption and production and its role in addressing key environmental and social challenges.
The reporting is considered when the macro-policy has SCP as a key priority or components like sustainable development, green economy, circular economy or development/poverty eradication. The policy can be under development, just adopted, under implementation or reached its end date and evaluated between 2002 and 2022. In 2017, 71 countries plus the European Union participated in the pilot reporting on SDG 12.1.1 and in 2019, 43 countries plus the EU participated in reporting on SDG 12.1.1. According to a webinar presentation provided by the One Planet Network, the four types of instruments that can be considered for reporting on the indicator under Target 12.1 are categorized under national strategies, roadmaps or plans, legal/regulatory instruments, economic/fiscal instruments and voluntary/information based instruments (Table 2.2).
Table 2.2: Criterion for policies to be considered under Target 12.1

17SUPPORTING INDIA ON SDG 12 MONITORING AND REPORTINGA Critical Appraisal
The data is collected through an online survey based on a metadata sheet. The questions included in the survey are revised as needed and appropriately aligned with the related on-going work under the SDGs.
National Indicator Framework
According to the latest National Indicator Framework (NIF) developed by MOSPI, Indicator 12.1.1 is “Number of countries with sustainable consumption and production (SCP) national action plans or SCP mainstreamed as a priority or a target into national policies”. According to the earlier NIF document, Indicator 12.1.1 was on “Formulation of national SCP framework and integration of SCP with national /state planning process” (MOSPI 2018).
Critique
The latest national indicator is based on the global indicator framework, which is on number of countries. As the national indicator is meant to aid national implementation, this may not be suitable. Conceptual aspects for Indicator 12.1.1 do not examine formulation and integration of SCP framework with the existing national or state level policies and plans. At the national level, India has several examples of SCP policies, which are also listed from NITI Aayog’s mapping of schemes. India already has SCP policies such as National Environment Policy (NEP), Zero-Defect, Zero-Effect (ZED), Ecomark Labelling Scheme, Perform, Achieve and Trade Scheme (PAT), National Clean Energy and Environment Fund (NCEEF), National Action Plan on Climate Change (NAPCC) and State Action Plan on Climate Change, and the draft Resource Efficiency Policy. Although policies in India (such as the resource efficiency policy) are still in the draft stage, using the global indicator methodology which accounts for ‘policy cycle’, this can still be reported by the MOEFCC National Focal Point for One Planet Network.
Methodology and Data
Based on the national indicator framework and the framework suggested by UNEP for monitoring 10YFP, various types of policy instruments can be considered for reporting on this indicator. The study team suggests the following indicator for target 12.1.
• 12.1.1: Sustainable consumption and production action plan or framework at national and state levels
A framework for SCP is proposed for which information can be collected through surveys/ questionnaires. Such a framework can build on the global indicator framework. MOEFCC, being the nodal agency can collect the responses. A suggested matrix is provided in Figure 2.1 as reference. Policy instruments and policy cycle can be based on the global indicator framework. One Planet Network implements the commitment of the 10YFP; through ‘six accelerator programmes’ – sustainable public procurement, tourism; consumer information; building & construction; lifestyles & education; and food systems. As Target 12.1 is an overarching target for SDG 12, all themes of SDG 12 can be considered. One Planet Network does not include waste management and practices by businesses and hence, a more comprehensive framework for themes can be derived from SDG 12 targets. Apart from themes, life policy instruments, policy cycles, and life cycle stages can be incorporated (Figure 2.1).

18SUPPORTING INDIA ON SDG 12 MONITORING AND REPORTINGA Critical Appraisal
• Macro polices, frameworks, roadmaps, plans or strategies• Legal/ regulatory instruments• Economic/ fiscal instruments• Voluntary/ information-based instruments
• Under development (initial stage)• Just adopted• Under implementation through specific actions• Monitored and evaluated
• Natural resources• Sustainable public procurement and subsidies related policies• Agriculture and food• Tourism• Waste• Scientific research, Development and Innovation• Education
• Extraction/ Upstream Resource Management• Design • Manufacturing/ Processing • Use phase• Disposal phase
Policy instruments SDG 12 ThemesPolicy cycle phase Life cycle stage
Source: TERI study team
Figure 2.1: Matrix for developing SCP action plan or framework
Table 2.3: Sources for reporting for Target 12.1
The various policy instruments for the thematic areas suggested earlier can be mapped at the national level and by states. The study team feels that the reporting of these instruments can be undertaken at the national level immediately and at the state levels in the near term (1–3 years).
The NFP can prepare a common questionnaire based on the questionnaire/ checklist and this can be sent to various ministries that can be indicative of the various sectors as well. Similarly, a questionnaire can also be prepared for various state governments wherein the environment department of each state can aggregate data from the respective line departments. This exercise of collecting information in the form of policy instruments can be done annually. The ministries and their respective sources of data are listed according to SDG 12 themes in Table 2.3. The involvement of various ministries would also reflect on the sectoral aspects and they would help report on progress at the sector level and the industry level in the future.
1 Ministry of Environment, Forest and Climate Change
Ministry of CoalMinistry of Petroleum and Natural Gas
Ministry of Mines
Ministry of Jal Shakti
Department of Environment
Department of Power/ Energy
Department of Mines and Geology
Department of Water Resources
Natural resources
Forests
Fossil fuels
Minerals
Water
# Theme/ sectorSource of information
National level State level

19SUPPORTING INDIA ON SDG 12 MONITORING AND REPORTINGA Critical Appraisal
2
3
6
7
5
4
Ministry of Finance
Ministry of Agriculture and Farmers WelfareMinistry of Consumer Affairs, Food and Public Distribution
Ministry of Environment, Forest and Climate Change
Ministry of Housing and Urban Affairs
Ministry of Science and Technology
Ministry of Human Resource Development
Ministry of Tourism
Department of Finance
Department of AgricultureDepartment of Consumer affairs
Department of Environment
Housing and Urban Planning Departments
Department of Science and Technology
Department of Education
Tourism Department
Sustainable public procurement and subsidies
Agriculture and food
Waste
Scientific research, Development and Innovation
Education
Tourism
# Theme/ sectorSource of information
National level State level
Source: TERI study team
Recommendations
It is proposed that the National Focal Point aggregates data from various ministries/ sources. For monitoring and reporting of the indicator, existing policies fulfilling the SCP criteria can be considered for reporting of data. The study team suggests reporting on the following indicator:
• 12.1.1: Sustainable consumption and production action plan or framework at national and state levels
Information on the existing SCP policies and policy instruments can be compiled by MOEFCC from the aforementioned listed sources through questionnaires and reports on the indicator. Figure 2.2 shows the flow of the data at national and state levels to an aggregator who in turn can report the same for monitoring and reporting.

20SUPPORTING INDIA ON SDG 12 MONITORING AND REPORTINGA Critical Appraisal
NFP of 10YFP based at MOEFCCMOSPI
NITI
Nodal departments Line ministries
Data sources for national/ state levels Aggregator for
Indicator 12.1.1Monitoring and
ReportingState National
Source: TERI study team
Figure 2.2: Proposed data flow for indicator under Target 12.1
References
MOSPI (Ministry of Statistics and Programme Implementation) (2018), Sustainable Development Goals: National Indicator Framework (November, 2018), New Delhi: MOSPI, Government of India.
MOSPI (Ministry of Statistics and Programme Implementation) (2019), Sustainable Development Goals National Indicator Framework Baseline Report 2015-16, New Delhi: MOSPI, Government of India.
MOSPI (Ministry of Statistics and Programme Implementation) (2020a), Sustainable Development Goals: National Indicator Framework (March 2020), New Delhi: MOSPI, Government of India.
MOSPI (Ministry of Statistics and Programme Implementation) (2020b), Sustainable Development Goals Progress Report, New Delhi: MOSPI, Government of India.
MOSPI (Ministry of Statistics and Programme Implementation) (2021), Sustainable Development Goals National Indicator Progress Report (Version 3), New Delhi: MOSPI, Government of India.
NITI Aayog (2018), Mapping of Central Schemes and Ministries of Government of India: Sustainable Development Goals, India, New Delhi: NITI Aayog, Government of India.
UN (United Nations) (2019), Tier Classification for Global SDG Indicators (Version 11 December 2019), New York: UN.
UN (United Nations) (2020a), Tier Classification for Global SDG Indicators (Version 17 April 2020), New York: UN.

21SUPPORTING INDIA ON SDG 12 MONITORING AND REPORTINGA Critical Appraisal
UN (United Nations) (2020b), Global SDG Indicators Database, New York: UN.
UN (United Nations) (2021), Tier Classification for Global SDG Indicators (Version 29 March 2021), New York: UN.
UNEP (United Nations Environment Programme) (2008), Guidelines for National Programmes on Sustainable Consumption and Production, Nairobi: UNEP.
UNEP (United Nations Environment Programme) (2014), Interim progress report prepared by the 10YFP Secretariat on behalf of the 10YFP Board for the High-Level Political Forum, Nairobi: UNEP.
UNEP (United Nations Environment Programme) (2014), Sustainable Consumption and Production in the proposed Sustainable Development Goals: A paper from the inter-agency coordination group of the 10 Year Framework of Programmes on SCP, Nairobi: UNEP.
UNEP (United Nations Environment Programme) (2015), Sustainable Consumption and Production Indicators for the future SDGs, UNEP Discussion Paper – March 2015, Nairobi: UNEP.
UNEP (United Nations Environment Programme) (2016), Practical Tools for Sustainable Consumption and Production: Promoting Mainstreaming and Implementation at National Level, Nairobi: UNEP.
UNEP (United Nations Environment Programme) (2018), Metadata Sustainable Development Goals: SDG Indicator 12.1.1, Nairobi: UNEP.
UNEP (United Nations Environment Programme) (2019), Launching the official reporting on SDG12.1 for Member States: 10 Year Framework of Programmes on SCP, Nairobi: UNEP.
UNEP (United Nations Environment Programme) (undated), Marrakech Process on Sustainable Consumption and Production, Flyer, Nairobi: UNEP.

22SUPPORTING INDIA ON SDG 12 MONITORING AND REPORTINGA Critical Appraisal
Target 12.2 (Natural Resources)Snapshot of Target 12.2
Target 12.2: By 2030, achieve the sustainable management and efficient use of natural resources
Indicator
Suggested National Indicator
Indicator
12.2.1 Material footprint, material footprint per capita, and material footprint per GDP
12.2.2 Domestic material consumption, domestic material consumption per capita, and domestic material consumption per GDP
12.2.1: Percentage variation in per capita use of natural resources12.2.1 (i): Percentage variation in per capita use of metallic ores12.2.1 (ii): Percentage variation in per capita use of non-metallic minerals12.2.1 (iii): Percentage variation in per capita use of oil12.2.1 (iv): Percentage variation in per capita use of coal12.2.1 (v): Percentage variation in per capita use of natural gas12.2.1 (vi): Per capita variation in groundwater use
12.2.1: Percentage variation in per capita use of natural resources
No (data only available at
global level)
Yes
In sync with national and global indicators. Basket of six resources can be expanded later
No
Tier II
Tier I
MOSPI Energy StatisticsIBM Indian Minerals YearbookMOSPI Environment Statistics/ MOJS
MOSPI
Data Availability for India
Note
Baseline Data Availability for India
Tier Classification
Data Sources
Data source
Global Indicator Framework (UN 2021, 2020a, 2020b)
Recommendations by Study Team
National Indicator Framework (MOSPI 2021, 2020a, 2020b)

23SUPPORTING INDIA ON SDG 12 MONITORING AND REPORTINGA Critical Appraisal
Policy Relevance
The world is consuming resources at increasingly destructive rates. Aspirations for higher income and better living have driven up consumption of biotic and non-biotic resources at unprecedented levels in recent years. In 2017, the world had consumed more than 90 billion tonnes of materials. Economic growth has been primarily driven by increased global demand for construction minerals, biomass for food and feed, fossil energy carriers. These three material groups account for four fifths of the total global material extraction.
There is however a significant gap between resource consumption per capita between developed and developing countries. Average consumption of resources per capita in a developed country is as high as 16 tonnes compared to that of a developing country like India where the per capita consumption per year is around 5 tonnes (UNEP 2019). Global material consumption since 1970 has increased by more than 240 per cent. In particular, since 2000, the annual rate of extraction has experienced a significant jump compared to what it was before the start of the millennium. This indicates growing dependence on natural resources resulting in undue burden on environmental resources. It is projected that by 2060, global resource extraction could grow to 190 billion tonnes from its current consumption of 94 billion tonnes. This would see resource use rising from 11.9 tonnes per person in 2015 to 18.5 tonnes per capita in 2060. The unprecedented growth in resource consumption—without effectively managing the impacts associated with extraction, use and disposal—would result in substantial stress on resource supply and environmental pressures and impacts (UNEP 2019). Further, an annual assessment of ‘Global Footprint Network’, in 2019 revealed that the world consumed carbon, food, water, fibre, land and timber in a record 212 days (GFN 2019). In order to meet the current demand for resources, humanity will need equivalent of 1.7 Earths (UNDESA 2019).
There is however a growing consensus and understanding in India that resource efficiency and secondary resource management needs to be promoted for achieving circular economy. Sectoral initiatives have been able to address the issue of resource efficiency through certain policies and programs across various life cycle stages of goods and services. Key policies that can be linked to such initiatives can be mapped across various life cycle stages and are presented here.
India’s commitment towards further enhancing and promoting sustainable consumption and production is reflected through the recent draft of ‘Resource Efficiency’ policy prepared by the Ministry of Environment Forest and Climate Change. The draft of the National Resource Efficiency Policy, 2019, is considered to be a significant step towards the desired transition as it will help to identify opportunities, facilitate thinking and support action towards closing resource use loops by establishing links and synergies across existing sectoral and/or resource specific strategies.

24SUPPORTING INDIA ON SDG 12 MONITORING AND REPORTINGA Critical Appraisal
The broad objectives of the policy are (i) savings in primary/virgin raw material by increasing efficiency in use in the sense of reduction in their use per unit of economic output and substituting their use with secondary/recycled raw materials, (ii) identify hotspot sectors for promoting resource efficiency in India and design interventions to promote resource efficiency and circular economy in identified sectors, (iii) develop capacity and strengthen research and information systems for promoting resource efficiency and circular economy (iv) create an institutional mechanism to achieve the aforementioned objectives through coordination and synergy across sectors and tiers of government. To meet these objectives, the national resource efficiency policy for India is based on the following principles: (i) Promote economic growth that is sustainable and equitable (inter-generational and intra-generational); (ii) Reduce primary resource consumption to ‘sustainable’ levels, in keeping with achieving the SDGs and staying within the planetary boundaries; (iii) Create higher value with less material through resource efficient and circular approaches; (iv) Minimize waste creation and loss of embedded resources at the end of life of products (v) Ensure security of supply and reduce import dependence for essential materials.
Conceptualization
Global Indicator Framework
The global indicator framework proposes three different types of indicators.
• domestic material consumption (DMC) • domestic material consumption per capita • domestic material per GDP
The DMC indicator provides an assessment of the absolute level of use of resources, and allows distinguishing consumption driven by domestic demand from consumption driven by the export market. It is important to note that the term “consumption” as used in DMC denotes apparent consumption and not final consumption. DMC does not include upstream “hidden” flows related to imports and exports of raw materials and products. In other words, it is defined as the amount of material directly used in an economy (i.e. excluding indirect flows).
It is however to be acknowledged that the global indicator framework is still evolving. However, there are certainlimitations of the global indicator 12.2 vis-à-vis the target identified in the global indicator framework (UN 2019b). The target highlights that countries should “…achieve the sustainable management and use of natural resources”. However, there are issues with regard to the way this management and use is measured. For example, DMC is (DMI – Exports) and direct material input (DMI) is domestic extraction and imports. However, not all what is extracted is going to be manufactured and there will be inventory (stock) in a particular year. At the same time, it is critical to learn how much of the raw materials have been converted into resources and finally embodied in the products manufactured available for final consumption. This assessment will help in providing deeper insights on the ways resources are converted and on resource efficiency along product and process value chains. This was initially classified as a tier II indicator; however, it has been put under tier I under the updated tier classification.

25SUPPORTING INDIA ON SDG 12 MONITORING AND REPORTINGA Critical Appraisal
The global indicator framework also incorporated material footprint (or material footprint per capita/material footprint per GDP) as another indicator to capture the sustainable management and efficient use of natural resources. The total material footprint is the sum of the material footprint for biomass, fossil fuels, metal ores and non-metal ores. However, the Inter-Agency and Expert Group on SDG Indicators (IAEG-SDG), has agreed that the methodology is applicable only at the global level and there is no requirement for country level monitoring.
Value chains differ for different natural resources; hence, understanding their categories and type is critical before discussing data requirements for efficiency assessment. Natural resources are materials or components found within the environment, that may be transformed to produce benefits such as increased wealth or enhanced well-being; in the process, it may be consumed. On the basis of origin, resources may be categorized into abiotic and biotic resources.
Natural resources can be classified based on their origin or on their stage of development or whether they are exhaustible or renewable. Biotic resources are those that are obtained from the biosphere, i.e., living and organic material including forests and animals. Abiotic resources are those that come from non-living inorganic materials. For example, non-metallic minerals, and metallic minerals, land and fresh water are abiotic resources whereas forests, fish, coal, and petroleum are biotic resources.
Depending on the stage of development, natural resources can also be classified as potential resources, actual resources, reserve resources and stock resources. Potential resources are those resources that are available in the environment and can be used in the future. Iron ore is available underground but unless it is actually mined out and put to use, it remains as a potential resource. Actual resources are those that have been geologically surveyed, their quantity and quality have been established and are being used currently. Reserve resources are those that can be mined currently and in the future in an economically viable manner. Finally, stock resources are those that have been proved to be available but cannot be extracted currently due to lack of technology.
Resources are also classified as renewable and exhaustible. Those resources that can be replenished naturally are called renewable resources. If the rate of extraction is greater than their generation, then there is net depletion of the stock whereas if the rate of extraction is less than the natural yield then it will lead to net addition to the stock. When the rate of extraction is equal to the rate of regeneration, it is called the minimum sustainable yield (MSY), representing a state of dynamic equilibrium. This implies that the volume of the stock available for exploitation remains constant, assuming that other factors remain constant. Resources like air, forest, solar energy, water are examples of renewable resources.
Non-renewable resources are those that exists in fixed quantity or those that cannot be regenerated or replenished over time. These include fossil fuels, metallic and non-metallic minerals. Most of such resources take long time to form. Given the fact that these resources play an important role in fuelling and promoting economic growth, there is a need for judicious use of these resources.
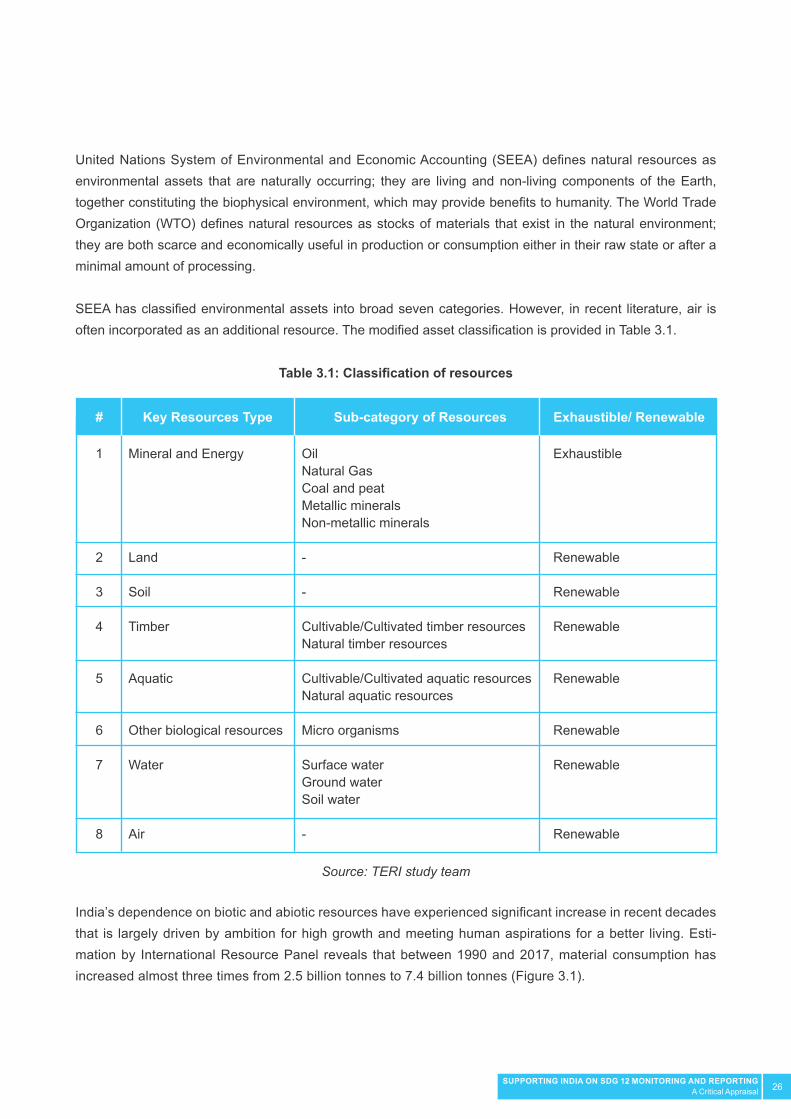
26SUPPORTING INDIA ON SDG 12 MONITORING AND REPORTINGA Critical Appraisal
United Nations System of Environmental and Economic Accounting (SEEA) defines natural resources as environmental assets that are naturally occurring; they are living and non-living components of the Earth, together constituting the biophysical environment, which may provide benefits to humanity. The World Trade Organization (WTO) defines natural resources as stocks of materials that exist in the natural environment; they are both scarce and economically useful in production or consumption either in their raw state or after a minimal amount of processing.
SEEA has classified environmental assets into broad seven categories. However, in recent literature, air is often incorporated as an additional resource. The modified asset classification is provided in Table 3.1.
India’s dependence on biotic and abiotic resources have experienced significant increase in recent decades that is largely driven by ambition for high growth and meeting human aspirations for a better living. Esti-mation by International Resource Panel reveals that between 1990 and 2017, material consumption has increased almost three times from 2.5 billion tonnes to 7.4 billion tonnes (Figure 3.1).
Table 3.1: Classification of resources
Source: TERI study team
1
2
3
4
5
6
7
8
OilNatural GasCoal and peat Metallic mineralsNon-metallic minerals
-
-
Cultivable/Cultivated timber resourcesNatural timber resources
Cultivable/Cultivated aquatic resourcesNatural aquatic resources
Micro organisms
Surface waterGround water Soil water
-
Exhaustible
Renewable
Renewable
Renewable
Renewable
Renewable
Renewable
Renewable
Mineral and Energy
Land
Soil
Timber
Aquatic
Other biological resources
Water
Air
# Key Resources Type Sub-category of Resources Exhaustible/ Renewable

27SUPPORTING INDIA ON SDG 12 MONITORING AND REPORTINGA Critical Appraisal
The compound annual growth rate (CAGR) in domestic material consumption has increased at a modest rate of 2–3 per cent between 1970 and 2000. However, since the beginning of this millennium, the estimated CAGR in resource consumption has nearly doubled. This has made India the second largest consumer of resources after China’s consumption of more than 32 billion tonnes. Continued reliance on virgin materials from within India and outside for driving economic growth will not only have serious consequences on their future availability and costs, but also pose serious threat to environment. IRP (2019) categorizes resources into four categories: biomass, fossil fuels, metal ores, and non-metallic minerals. The global data base is informed by IRP (2019). The global indicator does not include land, soil and water. It is also unclear as to how the global indicator framework accounts for natural (non-cultivable) aquatic resources.
Consumption of non-metallic minerals has experienced the highest growth followed by fossil fuels and metallic ores for the entire period between 1970 and 2016. India has a total built up construction area of 15.8 billion square metres and majority of the additions have taken place over the last 20 years leading to a sharp rise in consumption of non-metallic minerals. Fossil fuels have been the engine of economic growth leading to heavy exploitation of coal resources as well as heavy imports of crude oil. Metallic minerals have played an important role in promoting infrastructure development, manufacturing of electrical, non-electrical machineries, telecommunication equipment and consumer durables among others.
Figure 3.1: India’s trend on material consumption between 1970 and 2017
Source: IRP (2019) and Material Flow Net (2019)
Bill
ion
Tonn
es
8
7
6
5
4
3
2
1
0
1970
1972
1974
1976
1978
1980
1990
1992
1994
1996
1998
2000
2002
2004
2006
2008
2010
2012
2014
2016
1982
1984
1986
1988
Non-metallic minerals Metal ores Fossil fuels Biomass

28SUPPORTING INDIA ON SDG 12 MONITORING AND REPORTINGA Critical Appraisal
National Indicator Framework
The National Indicator Framework has proposed percentage variation in per-capita use of natural resources for measuring and monitoring sustainable management and efficient use of natural resources. The estimates are to be made available annually as mentioned in the NIF document.
The discourse and debate around resource exploitation is confined to shrinking availability and often ignores impacts on their quality. In the context of the target identified under SDG 12.2 which is promotion of sustainable management and efficient use of natural resources, it is extremely important to also understand the existing environmental/quality impacts associated with exploitation of the natural resources. Although there are specific targets for certain resources that take into consideration the quality aspect (e.g. target 6.3), the very nature of target 12.2 solicits its conjunctive analysis of quantity and environmental issues.
Heavy extraction and usage of resources leads to degradation of resources and deterioration in quality. Forest and arable land is deteriorating due to urbanization, over population and resource intensive farming practices. A recent analysis by TERI reveals that 96.40 million hectares (mha) area (approximately 30%) of the total geographic area in India is undergoing some form of land degradation or other in 2011–13, which is an increase of 1.87 mha area or 0.57 per cent of TGA since 2003–05.
Surface and ground water resources are contaminated due to discharge of untreated water from the residential and industrial sectors, as well as the pollution arising due to leachate formation from municipal wastes dumping sites. Recent assessments by the Central Pollution Control Board reveal that there are more than 350 river stretches in India that are polluted; 45 of them are critically polluted. Almost one-third of the polluted river stretches have been found in Maharashtra, Assam and Gujarat.
Wildlife resources are being lost due to poaching and hunting for profit motives. Growing emissions of harmful pollutants from residential, industrial and urban sectors has led to significant deterioration of air quality. According to the World Health Organization (WHO), approximately 99 per cent of the Indian population resides where the pollution level is above the WHO Air Quality Guideline of 10 µg/m3 (IHME and HEI, 2017). India alone contributes to around 26 per cent of the worldwide deaths caused by ambient air pollution and around 29 per cent of the global household air pollution mortality cases (WHO 2018). As per the study conducted by ICMR – PHI (2018), air pollution is the second leading cause of mortality in India and 12.5 per cent of the total mortality was attributable to air pollution during 2017 i.e. 1.24 million deaths. Moreover, it was found that in 2016, exposure to outdoor air pollution accounted for 6.4 per cent of the total disability adjusted life years (DALY).
For reporting in the national indicator, various aspects of life-cycle based approaches along with resource-wise data can be considered. These are briefly discussed for life-cycle stages of extraction; processing; manufacturing; use; and disposal; and for resource categories of mineral resources, land, water, and biomass.
29SUPPORTING INDIA ON SDG 12 MONITORING AND REPORTINGA Critical Appraisal
Extraction/ Mining: The process of extraction of minerals includes the use of energy that is required to drill deep bores into the earth surface and dislodge mineral deposits for collection and transportation. The major energy product used during the process of mining is electricity but during transportation, diesel is more used. The data on electricity consumption and petroleum consumption under different processes is captured by MOSPI, Central Electricity Authority (CEA) and Ministry of Petroleum and Natural Gas (MOPNG) annually. However, for the data on water and other inputs, the coal mining companies or Coal India Limited can be approached. Using the various inputs, the desirable outcome, which is the quantity of resources mined, can be estimated using the amount of minerals extracted, imports and exports. The net addition to the stock through mining can be estimated by the summation of production and imports minus the exports. The data for the production of resources can be obtained by the respective ministries of each resource; trade data can be sourced from the Directorate General of Foreign Trade (DGFT).
Though the economy usually accounts only for the desirable outcomes, each economic process also creates some undesirable outcomes that are harmful for the environment. Mining has the potential to demolish flora and fauna and contaminate soil, air and water in the surroundings. Accounting for these undesirable outcomes would require the estimation of the loss of the forest cover and land degradation. The Forest Survey of India (FSI) biennially releases detailed data on the forest cover and the change in stock. Other than the loss of land and forest cover, mining process also releases large amount of carbon and particulate matter emissions into the atmosphere, which have severe health implications.
Processing/ Smelting/Refining: Following the extraction of minerals, the process of the separation of the base metal from its ore called smelting, is done by applying heat in the presence of oxidizing agents, such as air, or reducing agents, such as coke. The inputs used during smelting are the extracted minerals from mining and the forms of energy or water consumed for the process. The smelting and refining process then leads to the generation of refined resources, which are then used as inputs in other manufacturing processes. The data on the inputs used during smelting/refining can be sourced from MOSPI’s Annual Survey of India (ASI).
Therefore, the net addition to the stock can be estimated using the production, export and import of refined resources. The data of refined minerals or produced minerals can be obtained from the Indian Bureau of Mines or the respective ministries that publish data annually. Apart from the desirable outcomes, smelting also produces undesirable outcomes such as air emissions and process wastes such as wastewater and slag. The elements that are released from the smelters also contaminate the soil in the vicinity destroying much of the land and emissions that lead to health impacts.

30SUPPORTING INDIA ON SDG 12 MONITORING AND REPORTINGA Critical Appraisal
Manufacturing (including fabrication and design and assembly): Once the refined resources/minerals are produced, they are used as intermediate goods in other manufacturing processes. The amount of resource used as input in other manufacturing process is often recorded in the ASI. The other inputs in the process also include the consumption of different sources of energy and water, which have to be accounted for in the value chain.
Thus, the desirable outcomes of this process of fabrication, design and assembly would be the production of final goods using the minerals mined and refined domestically. This outcome, which will be in the form of the net stock addition, can then be estimated using the data on resource embodiment products produced, products imported and exported. Further, the undesirable outcomes of this process would include carbon emissions and the production of rejects, which have negative impacts on both environmental and human health.
Use phase: The consumption of the final goods produced domestically in the earlier stages of the value chain are consumed at this stage, which is called the ‘use phase’. The products generated in the earlier stages of the value chain through mining, refining and fabrication are inputs in this phase of the value chain and thus do not have any desirable outcome. However, they still produce unwanted form of outputs like the air emissions that have severe implications on environment and health. The data on the final consumption is recorded and maintained by MOSPI, which can be used here to articulate the data required for this stage of the value chain.
Disposal phase: The last phase of the value chain of resources is the disposal phase wherein either scrap is generated or it is processed and recycled for reuse. The inputs at the disposal stage are the used final goods, which were produced using the primary minerals and the energy or water consumed for the process of recycling the waste produced (though the energy used for recycling is far less than the energy used for mining and smelting).
Therefore, the desirable outputs of this stage are the recovered amount of recycled materials that can be used again in manufacturing processes and add economic value. However, this recycling process also leads to certain undesirable outcomes like carbon emissions. It is important to note that the process of recycling emits lesser amount of green-house gases than the other initial stages of the value chain like extraction and smelting.
Data related to every stage of the value chain related to inputs and outputs is presented in Table 3.2.

31SUPPORTING INDIA ON SDG 12 MONITORING AND REPORTINGA Critical Appraisal
An overview of various types of resources is provided for mineral resources; land water; and biomass.
Mineral resources: The physical asset accounts can be compiled resource wise and include estimates of the opening and closing stock of mineral and energy resources and changes in the stock over the accounting period. The measurement units used to compile and present the relevant information will vary by type of resource. However, for accounting purposes, the same measurement unit should be used, for a single resource, to record the opening and closing stocks and the changes in the stocks over an accounting period. Hidden flows for mineral resources are extremely crucial. Although it is desirable to have primary information on hidden flows, getting relevant information may be a challenge. In such cases, acceptable multipliers are normally used based on compiled information on hidden material flows. The multipliers give information on how much hidden material flows originate from production in tonnes (or kilograms) of direct flows e.g. how many tonnes are extracted from the earth’s crust to produce one tonne of iron ore.
Table 3.2: Data sources for each stage of the value chain
Source: TERI study team
1
2
3
4
5
MOMMOCCEAMOPNGMOCI
MOMMOCMOPNG
MOCIMOCMOPNG
MOSPI
MOEFCC MOHUA
MOCMOSPIMOPNGMOM
MOCMOSPIMOPNGMOM
MOCMOSPIMOPNGMOM
MOCMOPNGMOMMOCI
MOCMOPNGMOMMOCI
MOCMOPNGMOMMOCI
MOCMOPNGMOMMOCI
MOCMOPNGMOMMOCI
MOCMOPNGMOMMOCI
MOEFCC
MOEFCC
MOEFCC
MOEFCC
MOEFCC
Extraction
Smelting/refining/
Manufacturing (including fabrication and design and assembly)
Use phase
Disposal phase
MOSPI/ MOCI Data sources on consumption to be developed (including from market research)
MOEFCC MOHUA
Data sources on consumption to be developed (including from market research)
# Stage of the value chain Production
(A)Import
(B)Export
(C)
Possible data sources for
Inputs
Possible data sources for desirable outputs
Possible data sources for Undesirable
outputs
32SUPPORTING INDIA ON SDG 12 MONITORING AND REPORTINGA Critical Appraisal
Again, the domestic multipliers are in most ways easy to determine from official statistics but the multipliers for imported raw materials and commodities are not so transparent and therefore there is a need for international co-operation to determine them. Taking a life cycle based approach, the following stages are important.
Land: The objective of land accounts in physical terms is to assess the area of land and changes that may have arisen due to land use change pattern over an assessment period. A range of physical land accounts can be prepared – for example, accounts for land use, land cover or land ownership (by industry or institutional sector). SEEA also proposes accounting for soil resource. Soil classification takes into account the degradation of agricultural soil due to soil erosion or extraction of top soil for other economic activities. However, this is often incorporated in the land use pattern. Land is scarce in India, even though the country has the seventh largest land area in the world with an area of about 328 million hectares. The measurement units of land in physical terms are units of area such as hectares or square metres. Generally, the total area of land for a country will remain unchanged from one period to the next. Hence, the changes between the opening and closing stock of land in physical terms will be primarily comprised of changes between different classes of land, for example classes relating to land ownership, land use or land cover (UN 2012). Most of the land utilization data reporting in India is based on the agricultural use. It is pertinent that land statistics based on land use classification needs to evolve as a source of data and should go beyond the scope of agriculture.
Water: Water is a continuous flowing resource that is in movement throughout the process of precipitation, evaporation, runoff, infiltration and flows to the seas. Therefore, the asset accounting of water needs to focus on the inflows and outflows of water to and from the land surface and sub-surface and on the destination of these flows. The asset accounts present information on the stock of water at the beginning and ends of an accounting period whether it is in artificial reservoirs, lakes or rivers or stored underground or as soil water. The accounts then record the flows of water that is extracted, consumed, or added through precipitation, or via flows to and from other countries and returned to the sea. India is experiencing a very significant water challenge. It is estimated that more than 800 million people in India have per capita water availability close to or lower than 1000 m3 – the official threshold for water scarcity as per the Falken mark Index. More than 80 per cent of rural households have no individual piped water supply, and 12 per cent of the population live without access to clean water near their homes. Further, 70 per cent of India’s surface water is contaminated. Average per capita water availability is expected to reduce to 1341 m3 by 2025 and 1140 m3 by 2050, close to the official water scarcity threshold (NITI 2019).
In light of this emerging risk that the country may face, it is pertinent to adopt interventions based on data on water availability from various sources as well as consumption use across various sectors in the economy. The physical asset account framework for water will help in collating data, providing inputs to the depletion and utilisation levels of water across various sectors and thus help in prioritization of interventions and investments that promote water use efficiency and quality improvements and mitigating negative impacts on the environment. The key data sources for water asset accounts will be the Central Water Commission and the Central Ground Water Board. Other information can also be obtained from the state irrigation departments and from the state water resource departments, water supply agencies and urban local bodies. The Ministry of Jal Shakti presents the river basin atlas of India that gives detailed information of major water resource projects along with the location of all hydrological observation sites including major dam and barrages.
33SUPPORTING INDIA ON SDG 12 MONITORING AND REPORTINGA Critical Appraisal
However this is not published frequently and the latest atlas available is for the year 2012. The central ground water board provides state-wise ground water resources availability, utilization and stage of development. This is based on the dynamic ground water resource assessment. The ministry also periodically provides data related to (i) water and waste water analysis, (ii) status of common effluent treatment plant, (iii) status of sewage treatment plant and (iv) status of water supply, wastewater generation and treatment in class I cities and class II towns of India. Availability of water usage data is a challenge. The data on availability of water, which includes the two most important sources of water, ground water and surface water are not reported frequently, further aggravating the challenge of reporting. Ground water is recorded at the state level; however, the surface water data is recorded according to river basins; therefore, this cannot be used to estimate the availability of water. Hence, ground water data, which is collected and reported state wise by the Central Ground Water Board can be considered for immediate reporting.
Biomass: Biomass is renewable resource and has the potential to provide employment especially in rural areas. It is a promising source for renewable power/energy generation based on commercially available thermal or biological conversion technologies. Given the importance of biomass power, the India government as well as different states having high biomass power potential is already promoting biomass power policies and programs. However, the success has been mixed. Biomass can arise from agro-residues, as well as forest residues. Trends in biomass data from agro-residues is not available. The Ministry of New and Renewable Energy provides biomass resource potential for different states in India (MNRE 2019). However, it is a static spatial inventory assessment and cannot be used for agro-residue based biomass generation/consumption in India. The data available according to MNRE (2019) is only for 2002–2004. The latest available report by the National Sample Survey Office of MOSPI on “Household Consumption of Various Goods and Services in India, 2011–12”, in volume terms (kilograms) and only including data for firewood and chips is reported in NSSO (2014). For data on dung, only monetary values are available. Moreover, for vegetables, total values (and even sub-total values) are not available in NSSO (2014). Hence, the study team recommends taking the volume consumption data from NSSO for ‘Firewood and Chips’.
Critique
There are limitations with regard to the extent the global indicator framework and the National Indicator Framework has been able to appropriately capture target 12.2. Currently, even GIF is limited in its interpretation of Target 12.2 as it totally ignores aspects linked to ‘sustainable management’ of natural resources, which goes much beyond mere consumption. The target, among other things, underscores the importance of sustainable management and use of natural resources. The domestic material consumption per capita as adopted in the global indicator framework or the percentage variation in per capita use of resources as defined in the latest version of National Indicator Framework fails to capture the environmental impacts associated with exploitation of natural resources.

34SUPPORTING INDIA ON SDG 12 MONITORING AND REPORTINGA Critical Appraisal
Moreover, percentage variation in per capita use of natural resources does not capture the absolute value of resources consumed in the economy. India may have low per capita material consumption when compared with the global average; however, the absolute level of consumption is very high. In fact, India has been found to be the second largest consumer of materials (only after China), although it may have one of the lowest per capita consumption of many resources.
Even if the indicator occurs more than once, one should realize its importance in different aspects for its multi-functionality. There is ambiguity with respect to the term ‘use’ as mentioned in the National Indicator Framework versus ‘consumption’ as referred to in the global indicator framework. The global indicator framework defines consumption as using any resource that has been taken out from its natural form. However, it can also be argued that resources may be taken out from its natural form, but may not be put to use. Market prices often determine the rate of the utilization of these resources even though they may have been extracted from their natural form. Hence, there is a need to differentiate data between stock and flow of resources. An ideal National Indicator Framework should not only consider the extraction of resources from its natural form, but should also have data related to the flow of the resources so that its use is captured along with its efficiency of consumption. Finally, there will be issues with regard to aggregation of material consumption data. Difficulty in aggregation may arise due to the difference in physical units of resources in which they are measured and also the non-overlapping time periods for which data are collected and/or reported.
Methodology and Data
As mentioned earlier, the current SDG 12.2 indicators under both the global indicator framework as well as in the National Indicator Framework are based on measuring the consumption of natural resources and they do not capture the volume of resources that is not put to use which can be a proportion (less than one) of the total extracted resources. Further, as extraction means the withdrawal of the mineral from its source, it is not necessary that the entire extracted mineral will be consumed; the part not consumed is called ‘unused extraction’. This leads to the concept of hidden flows. Hidden flows often are not accounted. They denote materials that are extracted or moved, but do not enter the economy. Although hidden flows are of no direct economic benefit, they undermine the viability of ecosystems. According to OECD, hidden flows are the displacement of environmental assets without absorption into the economic sphere, (e.g. overburden from mining operations). It is not necessary that all the minerals extracted are consumed and all are used as inputs for production purposes; some may be retained, kept unused in the form of inventory/stock. This is extremely common for metallic and non-metallic mineral resources. Domestic material consumption when added to hidden flows (including imports), lead to estimation of total material requirement. Hence, domestic material requirement is domestic material consumption and the imports including their associated overburden. However, for practical reasons (due to unavailability of data of hidden flows), DMC is used. DMC leads to domestic processed outputs and is defined by OECD as the ‘total mass of materials which have been used in the national economy, before flowing into the environment. These flows occur at the processing, manufacturing, use, and final disposal stages of the economic production-consumption chain.’ In other words, all loses that happen along the value chain is essentially consolidated under the DPO (Fischer-Kowalski et. Al, 2011). This will include emissions to air, emissions to land, emissions to water, dissipative use of products, and dissipative losses. What is retained is net addition to the stock and exports (Schandl & Miatto, 2019).

35SUPPORTING INDIA ON SDG 12 MONITORING AND REPORTINGA Critical Appraisal
Hence, from the aforementioned discussion, measuring the ‘domestic material consumption’ alone would not serve the objective of measuring sustainable levels of consumption and production. It is critical that data related to hidden flows, associated with domestic extraction and imports, losses during processing as well as the change in stocks are also inventoried for various resources.
Reporting for national indicators: To begin with, reporting can be done for key categories of natural resources, which have been identified by the study team based on regular reporting. These are listed in Table 3.3.
Table 3.3: Sources for reporting on the proposed six categories of resources
Source: TERI study team
1
2
3
4
5
6
Indian Mineral Yearbook, Ministry of Mines
Indian Mineral Yearbook, Ministry of Mines
Coal Directory of India: Coal Statistics, Coal Controller’s Organization, Ministry of Coal
Indian PNG Statistics for the Year, Ministry of Petroleum and Natural Gas
Indian PNG Statistics for the Year, Ministry of Petroleum and Natural Gas
Groundwater Yearbook, Central Ground Water Board; Ministry of Jal Shakti
Cannot be calculated due to boundary issues
Cannot be calculated due to boundary issues
Cannot be calculated due to boundary issues
Cannot be calculated due to boundary issues
Cannot be calculated due to boundary issues
Groundwater Yearbook, Central Ground Water Board; Ministry of Jal Shakti
Metal ores
Non-metallic minerals
Coal
Petroleum
Natural Gas
Ground water
# ResourceSource of information
State levelNational level
36SUPPORTING INDIA ON SDG 12 MONITORING AND REPORTINGA Critical Appraisal
The computation for the proposed indicators is as follows:
Percentage variation in per capita use of natural resources
To calculate percentage variation in per capita use of natural resources
where,VNRin is the per capita variation in natural resource (NR) in category i for year nVNRi(n-1) is the per capita variation in natural resource (NR) in category i for the previous year n – 1PVNRin is the percentage variation in natural resource (NR) in category i for year n
In case of groundwater, at this stage, only data on use of groundwater disaggregated by sector is available. The data source for population can be the Office of the Registrar General & Census Commissioner, India (ORGI 2006).
Recommendations
The global indicator framework has identified two broad categories of indicators i.e. domestic material consumption (DMC), (or domestic material consumption per capita, or domestic material per GDP) and material footprint (or material footprint per capita/material footprint per GDP). Global indicator 12.1.1 cannot be disaggregated at the national or sub-national level due to boundary issues. India’s National Indicator Framework has proposed percentage variation in per-capita use of natural resources for measuring and monitoring sustainable management and efficient use of natural resources. As a starting point, the study team recommends to report on the already listed national indicators considering six categories of natural resources:
• 12.2.1: Percentage variation in per capita use of natural resources - 12.2.1 (i): Percentage variation in per capita use of metallic ores - 12.2.1 (ii): Percentage variation in per capita use of non-metallic minerals - 12.2.1 (iii): Percentage variation in per capita use of oil - 12.2.1 (iv): Percentage variation in per capita use of coal - 12.2.1 (v): Percentage variation in per capita use of natural gas - 12.2.1 (vi): Per capita variation in groundwater use
Resources such as biomass, land, forestry, biodiversity and water have not been included in the indicators as they are well captured under other SDGs and are better reflected there. As the national indicator framework is dynamic, the national indicators can be further harmonized with the global indicators once the data collection and reporting systems of biomass, water and land-use are strengthened further. Figure 3.2 shows the data flow for reporting on the six category of resources for Target 12.2.
VNRin=[(REin+ Iin-Ein )÷Tpn ]-[(REi(n-1) + Ii(n-1) - Ei(n-1))÷Tp(n-1)]
PVNRin=[(VNRin- VNRi(n-1) )÷VNR(n-1) ]×100

37SUPPORTING INDIA ON SDG 12 MONITORING AND REPORTINGA Critical Appraisal
A desirable data template has been presented initially for four broad categories of resources: mineral resourc-es (fossil fuel and non-fossil fuel), land, water resources and biomass. The team did not consider the resources of biomass, land, forestry, biodiversity and aspects of water as among the six resources. Some aspects of for-estry and land degradation are better reflected in other SDGs. There are issues of data availability for biomass along with boundary issues (such as resource embeddedness of trade involving exports and imports). Data systems need to be strengthened to be able to report on Global Indicator 12.2.1 (environmental footprint). The team also recommends expanding the category of resources and eventually also report on biomass consump-tion as well as environmental footprint.
Ideally, data need to capture the extraction of resources, the quantity of resources consumed during each stage of the value chain, the amount wasted or lost and embodiment of these resources in the final products. The benefit of analysing such data is the detailed assessment that can be undertaken on resource consumed across various stages of the product value chains/categories as well as the corresponding evaluation of effi-ciency potential. In future, if an aggregate score is to be created, one can consider weight assignments through principal component analysis rather than using mere simple average methods.
Figure 3.2: Proposed data flow for reporting on Target 12.2
Source: TERI study team
MOEFCC
MOSPI
NITI
Ministry of Mines
Ministry of Petroleum and Natural Gas
Ministry of Coal
Ministry of Jal Shakti
Data sources for national level Aggregator Monitoring and
Reporting

38SUPPORTING INDIA ON SDG 12 MONITORING AND REPORTINGA Critical Appraisal
References
Fischer-Kowalski et. al, (2011), “Methodology and Indicators of Economy-wide Material Flow Accounting: State of the Art and Reliability across Sources”, Journal of Industrial Ecology, DOI: 10.1111/j.1530-9290.2011.00366.x.
GASAB (Government Accounting Standards Advisory Board) (2020), Natural Resource Accounting in India- Issues, Challenges and Way Forward, New Delhi: GASAB.
GFN (Global Footprint Network) (2019), “Earth Overshoot Day 2019 is July 29, the earliest ever”, 26 June, California: Global Footprint Network, URL: https://www.overshootday.org/newsroom/press-release-june-2019-english/
ICMR (Indian Council of Medical Research) (2018),”The Impact of Air Pollution on Deaths, Disease Burden, and Life Expectancy across the States: The Global Burden of Disease Study 2017”,The Lancet Planetary Health. 3(1), New Delhi: Indian Council of Medical Research.
IRP (International Resource Panel) (2019), “Global Material Flows Database”, Nairobi: United Nations Environment Programme, URL: https://www.resourcepanel.org/global-material-flows-database.
Material Flow Net (2019), “Material Flow by Country”. URL: http://www.materialflows.net/.
Mathur, A and S. Bhattacharjya (2019), “Policy Framework for Fostering Resource Efficiency in India”, in C.K. Mishra Ed. ‘’Special Issue on Environment”, The Journal of Governance, IC Centre for Governance, 18: 202-208.
MNRE (Ministry of New and Renewable Energy) (2019), National Biomass Atlas, New Delhi: MNRE, Government of India.
MOSPI (Ministry of Statistics and Programme Implementation) (2020a), Sustainable Development Goals: National Indicator Framework (March 2020), New Delhi: MOSPI, Government of India.
MOSPI (Ministry of Statistics and Programme Implementation) (2020b), Sustainable Development Goals Progress Report, New Delhi: MOSPI, Government of India.
MOSPI (Ministry of Statistics and Programme Implementation) (2021), Sustainable Development Goals National Indicator Progress Report (Version 3), New Delhi: MOSPI, Government of India.
NITI (NITI Aayog) (2019), Composite Water Management Index, New Delhi: NITI Aayog
NSSO (National Sample Survey Office) (2014), NSS Report No. 558: Household Consumption of Various Goods and Services in India, 2011-12, New Delhi, NSSO, Ministry of Statistics and Programme Implementation, Government of India.
39SUPPORTING INDIA ON SDG 12 MONITORING AND REPORTINGA Critical Appraisal
ORGI (Office of the Registrar General & Census Commissioner, India) (2006), Population Projections for India and States 2001-2026: Report of the Technical Group on Population Projections Constituted by the National Commission on Population, New Delhi: ORG, Ministry of Home Affairs, Government of India.
Schandl, Heinz and Miatto, Alessio (2019), “Data on the Domestic Processed Output, Balancing Items, and Solid Waste Potential for Five Major World Economies”, Data on Brief 22, pg 662-675, DOI: : https://doi.org/10.1016/j.jclepro.2018.08.333
UN (United Nations) (2012), “Revision of the System of Environmental - Economic Accounting (SEEA) SEEA Central Framework”, New York: UN, URL: https://unstats.un.org/unsd/envaccounting/seearev/Chapters/SEEA_CentralFramework_Ch5.pdf
UN (United Nations) (2019b), Metadata for Target 12.2: By 2030, Achieve the Sustainable Management and Efficient Use of Natural Resources, New York: United Nations.
UN (United Nations) (2020a), Tier Classification for Global SDG Indicators (Version 17 April 2020), New York: UN.
UN (United Nations) (2020b), Global SDG Indicators Database, New York: UN.
UN (United Nations) (2021), Tier Classification for Global SDG Indicators (Version 29 March 2021), New York: UN.
UNDESA (Department of Economic and Social Affairs) (2019), SDG 12 in Numbers, New York: UNDESA,URL:https://www.un.org/development/desa/undesavoice/more-from undesa/2019/06/45212.html.
WHO (World Health Organisation) (2018), Ambient Air Pollution: Health Impacts. Details, Geneva: World Health Organisation, URL: http://www.who.int/airpollution/ ambient/health-impacts/en/, last accessed on December 12, 2019.
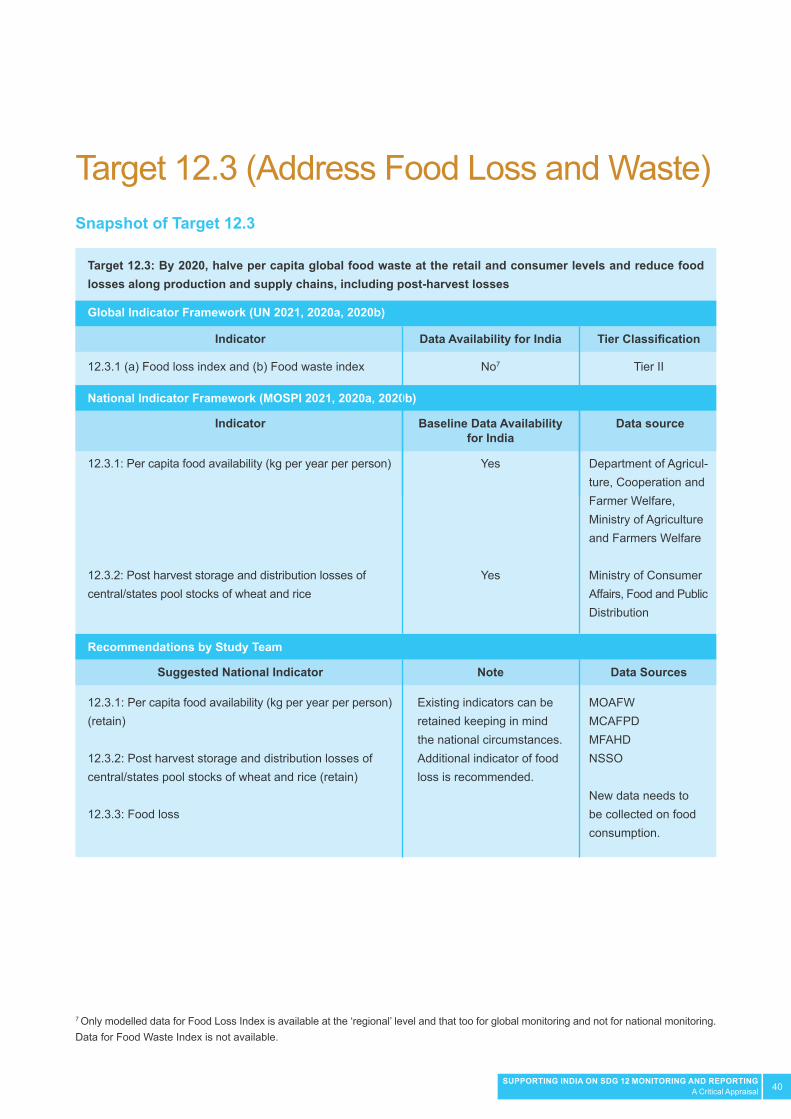
40SUPPORTING INDIA ON SDG 12 MONITORING AND REPORTINGA Critical Appraisal
Target 12.3 (Address Food Loss and Waste)Snapshot of Target 12.3
Target 12.3: By 2020, halve per capita global food waste at the retail and consumer levels and reduce food losses along production and supply chains, including post-harvest losses
Indicator
Suggested National Indicator
Indicator
12.3.1 (a) Food loss index and (b) Food waste index
12.3.1: Per capita food availability (kg per year per person) (retain)
12.3.2: Post harvest storage and distribution losses of central/states pool stocks of wheat and rice (retain)
12.3.3: Food loss
12.3.1: Per capita food availability (kg per year per person)
12.3.2: Post harvest storage and distribution losses of central/states pool stocks of wheat and rice
No7
Existing indicators can be retained keeping in mind the national circumstances. Additional indicator of food loss is recommended.
Yes
Yes
Tier II
MOAFWMCAFPDMFAHDNSSO
New data needs to be collected on food consumption.
Department of Agricul-ture, Cooperation and Farmer Welfare,Ministry of Agriculture and Farmers Welfare
Ministry of ConsumerAffairs, Food and PublicDistribution
Data Availability for India
Note
Baseline Data Availability for India
Tier Classification
Data Sources
Data source
Global Indicator Framework (UN 2021, 2020a, 2020b)
Recommendations by Study Team
National Indicator Framework (MOSPI 2021, 2020a, 2020b)
7 Only modelled data for Food Loss Index is available at the ‘regional’ level and that too for global monitoring and not for national monitoring. Data for Food Waste Index is not available.

41SUPPORTING INDIA ON SDG 12 MONITORING AND REPORTINGA Critical Appraisal
Policy Relevance
In spite of increasing global food production that is sufficient to feed the world population, hunger levels across the world persists. As per the FAO report ‘The State of Food Security and Nutrition in the World, 2017’, around 190.7 million people are undernourished in India (FAO 2017). The ranking of India as per the 2018 Global Hunger Index was 103. According to Gustavsson et al. (2011), 1.3 billion tonnes of edible food (approximately one-third of food produced for human consumption) is lost and wasted in the entire supply chain every year. Food wastage has implications for unsustainable consumption and production (FAO 2012; Flor et al. 2017). Food and Agriculture Organization (2013: 6) estimates the resource footprint of food wastage. The blue water footprint in terms of consumption of surface and groundwater resources of food wastage is about 250 km3, which is equivalent to the annual water discharge of the Volga River, or three times the volume of Lake Geneva. The land footprint of the food is 1.4 billion hectares of land, which represents close to 30 per cent of the world’s agricultural land area. Although difficult to quantify, impacts on biodiversity at a global level due to food wastage compounds the negative externalities from mono-cropping and agriculture expansion into forests and protected areas leading to habitat and biodiversity loss.
Target 12.3 is also linked to public health issues such as overconsumption, obesity and public health. These problems are explicitly stated in Goal 2 (zero hunger) and Goal 12 (responsible consumption and production), which makes them completely dependent on one another. Developing countries face the problem of upstream food loss in agricultural and food value chains owing to infrastructure issues, poor transportation and storage. For developed countries, food waste are much higher in upstream segments of food value chains at retail and consumer levels and are also often connected with overconsumption. ICAR, in a study, estimated that an annual value of harvest and post-harvest losses of major agricultural produces at the national level was of INR 926.5 billion in 2012–13 (ICAR 2015). They highlighted that the underlying cause of this post-harvest loss was due to the lack of infrastructure for short-term storage, particularly at the farm level, as well as the lack of intermediate processing in the production catchments.
Issues of waste management for food systems in India go beyond harvest and post-harvest waste of produce. They involve management of crop residue waste. India has polices for agricultural crop residue management. The government has a national scheme on promotion of agricultural mechanization for in-situ management of crop residue in the states of Punjab, Haryana, Uttar Pradesh and NCT of Delhi. Food-grains after harvesting (post-harvest) is managed in terms of storage by the Food Corporation of India (FCI) and state agencies for central pool stocks. The food-grains, procured at purchase centres by FCI, are immediately shifted to go-downs. FCI reports spoilage of food-grains in market due to rain or other causes. There are no separate food policies related to food processing and downstream (end consumer) food wastage; these are considered to fall under industrial waste and solid waste management related rules monitored by the Central Pollution Control Board.
42SUPPORTING INDIA ON SDG 12 MONITORING AND REPORTINGA Critical Appraisal
Conceptualization
Global Indicator Framework
Target 12.3 of SDG 12 states “By 2030, halve per capita global food waste at the retail and consumer levels and reduce food losses along production and supply chains, including post-harvest losses”. Reduction in food waste at retailer and consumer levels would help in achieving sustainability on the consumption side; reduction in food loss along the production and supply chains would cater to sustainable production. The global target is to be measured through two indices (one each on supply and demand side): Indicator 12.3.1 (a) Food Loss Index (FLI) and Indicator 12.3.1 (b) Food Waste Index (FWI) (UN 2021; UN 2019a; UN 2019b).
FLI measures all food loss in the value chain from post-harvest up to (but not including) the retail stage. FAO defines food loss as any food (human-edible crop and livestock commodity) discarded/disposed of along the food supply chain from harvest up to, but excluding, the retail level, which does not re-enter the chain in the form of any other productive utilization, such as animal feed or industrial use (FAO 2012). Losses that occur during storage, transportation, distribution, packaging and processing are included here. Global Indicator 12.3.1 (a) belongs to Tier II classification. As defined by FAO, FLI would be computed as a ratio of food loss percentages (FLP) in the current year and food loss percentages in the base year according to a standard fixed-base index formula. In calculating FLI and FLP, weights used are the value of the commodities at international prices. FLI would comprise of ten (two from each food group) commodities from five food groups (cereals & pulses, fruits & vegetables, roots & tubers and oil-bearing crops, animal products and fish and fish products). A list of ten commodities was chosen for international comparability purpose, as it would be practically difficult for countries to measure losses of all commodities. A simpler version of this indicator could be to aggregate losses8 along the supply chain and obtain a measure of percentage of production that does not reach the retail stage. Data on production, trade and utilizations including losses, once cross-checked and validated, form the basis for the compilation of the food balance sheets (FBS). The FBS are an accounting framework whereby supply (production + imports + stock withdrawals) should equal utilization (export + food processing + feed + seed + industrial use + losses).
Food waste9 refers to ‘decrease in the quantity or quality of food resulting from decisions and actions by retailers, food service providers and consumers.’ When no data on food loss is available at the country-commodity l evel, FAO developed a loss imputation model to estimate losses of all countries and commodities and compiled the Global Food Loss Index for SDG regions and commodity groups. Global Indicator 12.3.1 (b) on Food Waste Index has a Tier II classification with an agreed methodology. The methodology has three levels. Level 1 of the Food Waste Index proposes a method to estimate food waste using modelled data for member states that have not yet undertaken their own measurement; the food waste fraction of municipal solid waste data and other relevant data available in the country are used to provide a snapshot of food waste generation at country level.
8 Losses at each stage could be assumed to be independent of each other 9 Food waste will include fresh produce that are sorted out because they are not considered optimal, foods discarded by retailers/consumers that are close to, at or beyond “best-before” date, food that is often unused or left over or discarded from household kitchens and eating establishments.

43SUPPORTING INDIA ON SDG 12 MONITORING AND REPORTINGA Critical Appraisal
The estimate provides a case for action, while governments work on the development of a full baseline; however, this estimate cannot be used to track changes in food waste generation across time. Level 2 of the Food Waste Index provides a full baseline at the retail and consumer level, enabling reporting on SDG 12.3. It generates primary data on food waste generation that will show progress (or lack thereof) over time. Countries collect, weigh and analyse food waste collected from a representative sample of households, food service pro-viders and retailers or use. Level 3 provides additional useful data insights to inform policy and other behaviour change interventions, including causes of waste and food waste disposed of down the drain, home composted or fed to pets.
National Indicator Framework
The NIF uses two indicators—Indicator 12.3.1—Per capita food availability (on the consumption side) and Indicator 12.3.2: Post harvest storage and distribution losses of Central/States Pool stocks of wheat and rice (on the production side focussing on harvest and post-harvest waste).
Indicator 12.3.1 measures availability of food per capita. Availability of food is computed as
To arrive at per capita figure, the net availability is divided by the population.
Indicator 12.3.2 for post-harvest ‘distribution’ loss is calculated only for rice and wheat now.
Food Corporation of India (FCI) under Ministry of Consumer Affairs, Food & Public Distribution (MoCAF&PD) reports post-harvest storage and distribution loss (in percentage terms) in stocks of wheat and rice on an annual basis.
Food here includes food grains comprising rice, wheat, other cereals and all pulses. The Directorate of Economics and Statistics, Department of Agriculture Cooperation and Farmers Welfare (DAC&FW), Ministry of Agriculture and Farmers Welfare (MoAFW) provides annual data on per capita net availability of food grains (per annum) in India (kilograms/year).
Indicator 12.3.2 aims to measure reduction in food losses along production and supply chains, including post-harvest losses. National Indicator 12.3.2 measures post-harvest storage and distribution losses of central/states pool stocks of wheat and rice.
Indicator 12.3.2 for post-harvest ‘storage’ loss is calculated only for rice and wheat now.
Net Availability = Domestic production – (seed, feed & wastage) – exports + imports + change in stocks
Post-harvest storage loss = Post-harvest storage losses in central/states pool stocks of rice and wheat
Post-harvest distribution loss = Post-harvest distribution losses in central/states pool stocks of rice and wheat
“Per capita net availability = (Net availability)/Population”
44SUPPORTING INDIA ON SDG 12 MONITORING AND REPORTINGA Critical Appraisal
Critique
The National Indicator Framework (NIF) uses “per capita food availability” in lieu of “Food Loss Index” and “Food Waste Index” under the GIF. A source of measurement error is that in the present approach, informal trade is not captured. The other aspect is changes in the stock; moreover, the present changes in the policy space including in the Essential Commodity Act and changes in marketing laws will have implications for food stocks in aspects such as composition, level and private ownership of stocks. Post-harvest loss is greater for perishable food items. Here for wheat and rice, the emphasis only on public stock may be inadequate and insufficient in terms of measurement. Rather than net availability of food, it is the consumption of food grains, which would help to obtain an estimate from the demand side. Post-harvest loss is greater for perishable food items. Reporting under this indicator should include other food items such as fruits and vegetables, fish and animal products and not just food grains.
The National Sample Survey Office (NSSO) under the Ministry of Statistics and programme Implementation conducts household consumer expenditure surveys from which data on monthly consumption of various goods by households can be obtained. However, this data is not collected periodically. Moreover, NSSO does not capture processed items very well, which is a significant part of consumption; hence, this aspect can lead to mismeasurement of consumption and mismeasurement of waste. The aspect of eating out is also not well captured in NSSO data; hence, NSSO data needs to be supplemented with other data sources possibly with CMIE data, which is of a higher frequency and has expenditure data on processed food and eating out. To conduct a full baseline, NSSO may choose to undertake direct measurement (separate collection, weighing and analysis) from a representative sample of households, food service establishments and retailers. Prospectively, and having a progressive outlook, say ten years ahead, there should be a system for collecting high frequency data on food waste through an annual survey of the retail (including the food) sector. Similar to the annual survey of industries, there is a need to collect retail data on an annual basis.
Methodology and Data
The existing national indicators can be retained for now but reporting systems need to be strengthened to capture ‘consumption’, ‘loss’ and ‘waste’ more clearly. The present national indicator on availability does not capture the essence of SDG 12, which emphasizes on not only production but also consumption and reduction of loss and waste. Although the present indicators can be retained, additional national indicator on Food Loss (FL) can seek to capture food loss at the national level by considering availability and consumption aspects.
where,FL = Food Loss A = Net Availability = Domestic production – (Seed, feed & wastage) – Exports + Imports + Change in stocksC = Consumption (Quantity consumed per annum)
FL= A – C
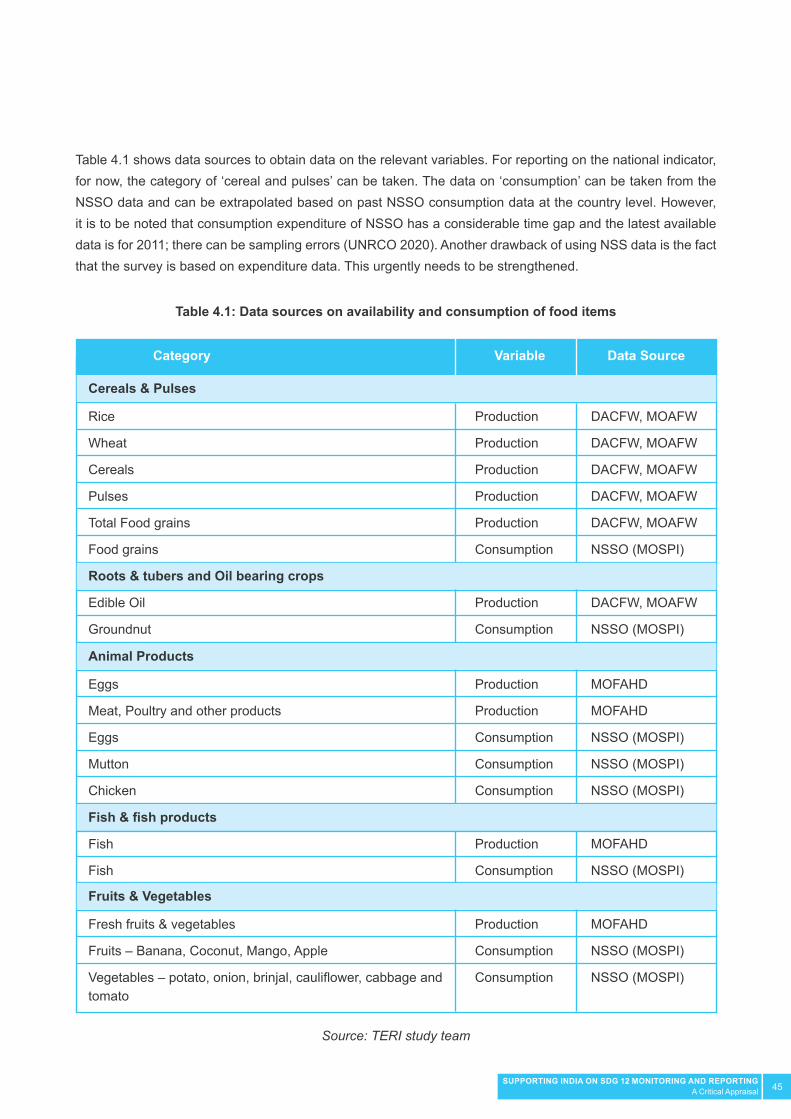
45SUPPORTING INDIA ON SDG 12 MONITORING AND REPORTINGA Critical Appraisal
Table 4.1 shows data sources to obtain data on the relevant variables. For reporting on the national indicator, for now, the category of ‘cereal and pulses’ can be taken. The data on ‘consumption’ can be taken from the NSSO data and can be extrapolated based on past NSSO consumption data at the country level. However, it is to be noted that consumption expenditure of NSSO has a considerable time gap and the latest available data is for 2011; there can be sampling errors (UNRCO 2020). Another drawback of using NSS data is the fact that the survey is based on expenditure data. This urgently needs to be strengthened.
Table 4.1: Data sources on availability and consumption of food items
Source: TERI study team
Rice
Wheat
Cereals
Pulses
Total Food grains
Food grains
Eggs
Meat, Poultry and other products
Eggs
Mutton
Chicken
Fresh fruits & vegetables
Fruits – Banana, Coconut, Mango, Apple
Vegetables – potato, onion, brinjal, cauliflower, cabbage andtomato
Edible Oil
Groundnut
Fish
Fish
Production
Production
Production
Production
Production
Consumption
Production
Production
Consumption
Consumption
Consumption
Production
Consumption
Consumption
Production
Consumption
Production
Consumption
DACFW, MOAFW
DACFW, MOAFW
DACFW, MOAFW
DACFW, MOAFW
DACFW, MOAFW
NSSO (MOSPI)
MOFAHD
MOFAHD
NSSO (MOSPI)
NSSO (MOSPI)
NSSO (MOSPI)
MOFAHD
NSSO (MOSPI)
NSSO (MOSPI)
DACFW, MOAFW
NSSO (MOSPI)
MOFAHD
NSSO (MOSPI)
Category Data SourceVariable
Cereals & Pulses
Animal Products
Fruits & Vegetables
Roots & tubers and Oil bearing crops
Fish & fish products

46SUPPORTING INDIA ON SDG 12 MONITORING AND REPORTINGA Critical Appraisal
Recommendations
To summarize, the study team recommends retaining the existing national indicators 12.3.1 and 12.3.2. The team also suggests an additional indicator that takes the difference between per capita food availability and per capita consumption of food to denote food wastage. The additional indicator suggested is 12.3.3: Food Loss. This data may have drawbacks, but is needed to start the discussion around strengthening data systems for food consumption. A reporting framework for indicator 12.3.3 is suggested in Figure 4.1. It is possible to report data at national as well as state levels for the indicator as disaggregated data is available for states from the same data sources.
The team also suggests that the existing national indicators 12.3.1 and 12.3.2 could be eventually expanding the food items beyond food grains to include perishable food items such as vegetables, fruits, fish and animal products (including meat, dairy and poultry). For this, the monitoring of data availability needs to be strengthened.
Figure 4.1: Proposed data flow for Indicator 12.3.3
Source: TERI study team
Nodal Ministry for SDG 12 (MOEFCC)
MOSPI
NITI
Ministry of Agriculture and Farmers Welfare (availability)
Ministry of Statistics and Program Implementation (consumption)
Data sources
National StateAggregator for Indicator 12.3.3 Monitoring and
Reporting

47SUPPORTING INDIA ON SDG 12 MONITORING AND REPORTINGA Critical Appraisal
References
FAO (Food and Agriculture Organization) (2012), Towards the Future We Want: End Hunger and Make the Transition to Sustainable Agricultural and Food Systems, Rome: FAO.
FAO (Food and Agriculture Organization) (2013), Food Wastage Footprint: Impact on Natural Resources (Summary Report), Rome: FAO.
FAO (Food and Agriculture Organization) (2017), State of Food Security and Nutrition in the World 2017, Rome: FAO.
FCI (Food Corporation of India) (2018), Annual Report 2017-18, Food Corporation of India, Ministry of Consumer Affairs, Food & Public Distribution, New Delhi: MOCAF&PD, Government of India.
Flor, Rafael, and Annmarie Isler (2017), The Pathway to Zero Hunger Requires Food Loss Reduction: Reflections from UNGA, November 13, 2017, The Rockefeller Foundation
Gustavsson et al. (2011), Global Food Losses and Food Waste; FAO: Rome, Italy, 2011.
ICAR (Indian Council of Agricultural Research) (2015), Assessment of Quantitative Harvest and Post-Harvest Losses of Major Crops and Commodities in India, ICAR-All India Coordinated Research Project on Post-Har-vest Technology, ICAR-CIPHET, Punjab, ICAR, Government of India.
MOSPI (Ministry of Statistics and Programme Implementation) (2014), Household Consumption of Various Goods and Services in India 2011-12, NSS 68th Round, July 2011 – June 2012 (June, 2014), New Delhi: MOSPI, Government of India.
MOSPI (Ministry of Statistics and Programme Implementation) (2018), Sustainable Development Goals: National Indicator Framework (November, 2018), New Delhi: MOSPI, Government of India.
MOSPI (Ministry of Statistics and Programme Implementation) (2019), Sustainable Development Goals National Indicator Framework Baseline Report 2015-16, New Delhi: MOSPI, Government of India.
MOSPI (Ministry of Statistics and Programme Implementation) (2020a), Sustainable Development Goals: National Indicator Framework (March 2020), New Delhi: MOSPI, Government of India.
MOSPI (Ministry of Statistics and Programme Implementation) (2020b), Sustainable Development Goals Progress Report, New Delhi: MOSPI, Government of India.
MOSPI (Ministry of Statistics and Programme Implementation) (2021), Sustainable Development Goals National Indicator Progress Report (Version 3), New Delhi: MOSPI, Government of India.
UN (United Nations) (2019a), Meta-data for Indicator 12.3.1 Food loss index, New York: UN.

48SUPPORTING INDIA ON SDG 12 MONITORING AND REPORTINGA Critical Appraisal
UN (United Nations) (2019b), Working Document for Tier III Indicators (Goal 12, Target number: 12.3, Indicator Number and Name: 12.3.1 Global Food Loss Index), New York: UN.
UN (United Nations) (2020a), Tier Classification for Global SDG Indicators (Version 17 April 2020), New York: UN.
UN (United Nations) (2020b), Global SDG Indicators Database, New York: UN.
UN (United Nations) (2021), Tier Classification for Global SDG Indicators (Version 29 March 2021), New York: UN.
UNRCO (United Nations Resident Coordinator’s Office, India) (2020), Comments on Present Report, New Delhi: UNRCO.

49SUPPORTING INDIA ON SDG 12 MONITORING AND REPORTINGA Critical Appraisal
Target 12.4 (Hazardous Waste and Chemicals)Snapshot of Target 12.4
Target 12.4: By 2020, achieve the environmentally sound management of chemicals and all wastes throughout their life cycle, in accordance with agreed international frameworks, and significantly reduce their release to air, water and soil in order to minimize their adverse impacts on human health and the environment
Indicator
Suggested
Indicator
12.4.1 Number of parties to international multilateral environmental agreements on hazardous waste, and other chemicals that meet their commitments and obligations in transmitting information as required by each relevant agreement
12.4.2 Hazardous waste generated per capita; and (b) proportion of hazardous waste treated by type of treatment
12.4.1 National compliance with international multilateral environmental agreements on hazardous waste, and other chemicals (replace Indicator 12.4.1)
12.4.2: (a) Hazardous waste generated per capita (in MT/ person); and (b) proportion of hazardous waste treated by type of treatment (retain as it is)
12.4.1: Whether the country has ratified international multilateral environmental agreements on hazardous waste and other chemicals
12.4.2: (a) Hazardous waste generated per capita (in MT/ person); and (b) proportion of hazardous waste treated by type of treatment
Yes
No
In sync with global indicator framework
Yes
Yes
Tier I
Tier II
Hazardous Substance Management Division, MOEFCC
MOEFCC
MOEFCC
Data Availability for India
Note
Baseline Data Availability for India
Tier Classification
Data Sources
Data source
Global Indicator Framework (UN 2021, 2020a, 2020b)
Recommendations by Study Team
National Indicator Framework (MOSPI 2021, 2020a; MOSPI 2020b)

50SUPPORTING INDIA ON SDG 12 MONITORING AND REPORTINGA Critical Appraisal
Policy Relevance
Constitutional provisions for environment protection are implemented through various environment protection laws of the country as well as through ratification by multilateral environmental agreements. In terms of ratification by multilateral environmental agreements (MEA), according to the Transaction of Business Rules (MEA undated), all international agreements or treaties require Cabinet Approval before they are signed and ratified, except those which are specifically exempted as they are related to culture and science and technology. The agreement is put up for approval by the Cabinet for signing and ratification after the text of the treaty is cleared by the Ministry of External Affairs from the legal and drafting point of view by the Legal and Treaties Division. The Legal and Treaties Division is also required to be consulted during the negotiations for advice and guidance on the legal aspects. All the five conventions listed as MEAs under Target 12.4 by UNEP (UNEP 2017) have been ratified by India. The dates of ratifications/ similar instruments are listed in Table 5.1.
The management of hazardous and chemical wastes in India is governed by rules that are notified by the MOEFCC from time to time. The rules lay down corresponding duties of various authorities such as MOEFCC, CPCB, State/UT Governments, and SPCBs/PCCs, Directorate General of Foreign Trade, Port Authority and Custom Authority. State Pollution Control Boards/ Pollution Control Committees have been designated with wider responsibilities encompassing almost every aspect of hazardous wastes generation, handling and their disposal. Hazardous waste and chemicals related rules came into effect in the year 1989 and have been amended later in the years 2000, 2003, with final notification of the Hazardous Waste (Management, Handling and Transboundary Movement) Rules, 2008 in supersession of the former notification.
Table 5.1: Ratification by India to MEAs falling under Target 12.4
Source: Compiled from brsmeas.org; ozone.unep.org; mercuryconvention.org
1
2
3
4
5
6
24-06-1992
24-05-2005
13-01-2006
18-03-1991
19-06-1992
18-06-2018
22-09-1992
22-08-2005
13-04-2006
16-06-1991
19-09-1992
16-08-2017
Basel Convention (on the Control of Transboundary Movements of Hazardous Wastes and their Disposal)
Rotterdam Convention (on the Prior Informed Consent Procedure for Certain Hazardous Chemicals and Pesticides in International Trade)
Stockholm Convention (on Persistent Organic Pollutants)
Vienna Convention for the Protection of the Ozone Layer
Montreal Protocol on Substances that Deplete the Ozone Layer
Minamata Convention on Mercury
# Multilateral Environmental Agreement Entry into forceRatifications (or similar) by India
51SUPPORTING INDIA ON SDG 12 MONITORING AND REPORTINGA Critical Appraisal
Hazardous Waste (Management, Handling and Transboundary Movement) Rules, 2008 were revised and Hazardous and Other Wastes (Management & Transboundary Movement) Rules, 2016 has been put into place by MOEFCC. This has been revised four times since then (amendment rules were issued by MOEFCC in 2016, 2017, 2018 and 2019). There are also various guidelines10 available for hazardous waste and chemicals management. Other important rules include E-Waste Management Rules, 2016, 2018; Batteries (Management & Handling ) Rules, 2001; Biomedical Waste (Management and Handling) Rules, 2016; Solid Waste Management Rules, 2016; Plastic Waste (Management and Handling) Rules, 2011; Manufacture, Storage and Import of Hazardous Chemicals (MSIHC) Rules, 1989; Chemical Accidents (Emergency Planning, Preparedness and Response) Rules, 1996; Regulation of Persistent Organic Pollutants Rules, 2018; and Ozone Depleting Substances (Regulation and Control) Rules, 2000.
Conceptualization
Global Indicator Framework
Target 12.4 sets a global mandate, which states “By 2020, achieve environmentally sound management of chemicals and all wastes throughout their life cycle, in accordance with agreed international frameworks, and significantly reduce their release to air, water and soil in order to minimize their adverse impacts on human health and the environment”.
The first global indicator under this target is 12.4.1, which is on the “Number of parties to international multilateral environmental agreements on hazardous waste, and other chemicals that meet their commitments and obligations in transmitting information as required by each relevant agreement” (UN 2017). The United Nations Environment Programme (UNEP) is the custodian agency for 12.4.1. According to the concept laid down by UNEP (2017), which hosts the five conventions, the indicator refers to the number of parties/ countries that have ratified, accepted, approved or accessed the following five multilateral environmental agreements (MEAs):
1. The Basel Convention on the Control of Transboundary Movements of Hazardous Wastes and their Disposal (Basel Convention) 2. The Rotterdam Convention on the prior informed consent procedure for certain hazardous chemicals and pesticides in international trade (Rotterdam Convention) 3. The Stockholm Convention on Persistent Organic Pollutants (Stockholm Convention) 4. The Montreal Protocol on Substances that Deplete the Ozone Layer (Montreal Protocol) 5. Minamata Convention on Mercury (Minamata Convention)
10 Guidelines on Framework on Identification of Materials Generated from Industrial Processes as Wastes or By-products; Enforcement Framework for Effective Implementation of Hazardous and Other Wastes (Management and Transboundary Movement) Rules, 2016; Guidelines for Preparation of Inventories on Hazardous and Other Waste Generation and their Management; Guidelines for Environmentally Sound Facilities for Handling, Processing and Recycling of End-of- Life Vehicles (ELV); Revised Guidelines for Pre-Processing and Co-Processing of Hazardous and Other Wastes in Cement Plant as per H&OW
52SUPPORTING INDIA ON SDG 12 MONITORING AND REPORTINGA Critical Appraisal
Reporting in 2017 is for the period 2010–2014, in 2020 for the period 2015–2019, in 2025 for the period 2020–2024 and in 2030 for the period 2025–2029. For the purpose of reporting, UNEP directly collects the data from the convention secretariats. According to UNSD (2017), reporting parameters along with methods for scoring are as follows.
Basel Convention 1. Designation of the Focal Point and one or more Competent Authorities (1 point) 2. Submission of the annual national reports during the reporting period (1 point per report)
Rotterdam Convention 1. Designation of the Designated National Authority(-ies) and Official contact point (1 point) 2. Submission of the import responses during the reporting period (1 point per import response)
Stockholm Convention 1. Designation of the Stockholm Convention official contact point and national focal point (1 point) 2. Submission of the national implementation plan (1 point) 3. Submission of the revised national implementation plan(s) addressing the amendments adopted by the Conference of the Parties within the reporting period (1 point per revised and updated plan)
Montreal Protocol 1. Compliance with reporting requirements for production and consumption of ozone-depleting substances under (Article 7 of) the Montreal Protocol (15 points) 2. Submission of information on Licensing systems under (Article 4B of) the Montreal Protocol (5 points)
Minamata Convention 1. Designation of a national focal point (Article 17) (5 points) 2. Submission of national report (Article 21) (15 points)
According to UNSD (2017), the final indicator will be a number expressed as per cent, where 100 per cent is the maximum degree of compliance with the reporting obligations of the MEAs to which a country is a party, and 0 per cent is the least degree of compliance with those obligations.
(M & TBM) Rules, 2016; Guidelines on Implementing Liabilities for Environmental Damages due to Handling & Disposal of Hazardous Waste and Penalty; Guidelines for Common Hazardous Waste Incineration; Criteria for Hazardous Waste Landfills; Guidelines for Management, Handling, Utilisation and Disposal of Phosphogypsum Generated from Phosphoric Acid Plants; Protocol for Performance Evaluation and Monitoring of Common Hazardous Waste Treatment Storage and Disposal Facilities including Common Hazardous Waste Incinerators; Guidelines for Setting up of Operating Facility: Hazardous Waste Management; Guidelines for Proper Functioning and Upkeep of Disposal Sites; Guidelines for Environmental Sound Recycling of Hazardous Waste as per Schedule-V of Hazardous Waste (Management Handling and Transboundary Movement) Rules, 2008; Guidelines for the Selection of Site for Landfilling; Guidelines for Transportation of Hazardous Wastes; Guidelines for Storage of Incinerable Hazardous Wastes by the Operators of Common Hazardous Waste Treatment, Storage and Disposal Facilities and Captive HW Incinerators; Guidelines for Conducting Environmental Impact Assessment : Site Selection for Common Hazardous Waste Management Facility; Manual for ‘Sampling, Analysis and Characterization of Hazardous Wastes’; Manufacture Storage and Import of Hazardous Chemical Rules, 1989; Chemical Accidents (Emergency Planning, Preparedness and Response) Rules, 1996; and Chemicals which fall under Public Liability Act, 1991.

53SUPPORTING INDIA ON SDG 12 MONITORING AND REPORTINGA Critical Appraisal
The second indicator under Target 12.4 as per the global indicator framework is Indicator 12.4.2 on “Hazardous waste generated per capita; and (b) proportion of hazardous waste treated by type of treatment”. UNEP and UNSD (2018) proposed to use the definition of hazardous waste as provided in the Basel Convention. Furthermore, parties have specific obligations to transmit notifications of national definitions of “hazardous wastes” that are additional to the wastes listed in the Annexes of the Convention. The Basel Convention does not provide a definition of the term “treatment” but provides, in Annex IV to the Convention, a list of operations for the disposal and recovery of hazardous wastes. For the global indicator, data on the generation of hazardous waste has been collected by the BRS Secretariat but the revised reporting format used from 2016 makes submission of data on waste generation optional.
Indicator 12.4.2 has two parts: • Part 1: Hazardous waste generated per capita • Part 2: Proportion of hazardous waste treated by type of treatment
For the first part, which is on hazardous waste generated per capita, there is a need to obtain population data from another database. Calculation for the first part of the indicator is as follows.
The indicator 12.4.2 also uses the terms “waste treated” and “type of treatment”, which are not defined in the Basel Convention. UNSD (2018), in a working document for global indicator 12.4.2 proposes two indicators for hazardous waste treatment.
UNSD (2018) also flags the issue that as hazardous waste can be difficult to be treated, it is sometimes exported to another country/ies for treatment. Therefore, it is important to calculate the proportion that is treated in a country. This is not a perfect indicator, as exporting hazardous waste to have it landfilled in another country would increase the proportion of hazardous waste treated in the country where it was generated.
Hazardous waste generated per capita =
Hazardous waste recycled =
Hazardous waste incinerated =
(Hazardous waste generated)
Hazardous waste recycled during the year
Hazardous waste incinerated during the year
Population
Hazardous waste treated or disposed during the year
Hazardous waste treated or disposed during the year

54SUPPORTING INDIA ON SDG 12 MONITORING AND REPORTINGA Critical Appraisal
National Indicator Framework
In the third progress report by MOSPI (MOSPI 2021), some of the issues raised by the team has already been addressed and the national indicator framework is synchronised with the global indicator framework as well as SDG Index by NITI Aayog. There is still scope for improvement on reporting on Indicator 12.4.1. This will be discussed in this section.
The Hazardous Substances Management Division (HSMD) and the Ozone Cell of MOEFCC (MOEFCC 2019a) are the nodal points within the Ministry for the respective MEAs. The main objective of HSMD is to promote safe management and use of hazardous substances including hazardous chemicals and hazardous wastes, in order to avoid damage to health and environment. The Division is also the nodal point for four International Conventions: Basel Convention, Rotterdam Convention, Stockholm Convention, and Minamata Convention. During the consultations on the national indicator framework, HSMD kindly provided descriptions of the various conventions.
For Basel Convention, transboundary movement of hazardous and other wastes is mainly regulated in accordance with the provisions of the Hazardous and Other Wastes (Management and Transboundary Movement) Rules, 2016 which has been notified under the Environment (Protection) Act, 1986 in April 2016. As per the rules, import of hazardous and other wastes for final disposal from any country to India is prohibited. The rules came into force in April 2016 and were amended thrice since. According to the Hazardous and Other Wastes (Management and Transboundary Movement) Rules, 2016, the Central Pollution Control Board (CPCB) is required to issue guidelines or standard operating procedures for environmentally sound management of hazardous and other wastes. In addition, the guidelines are on various aspects of waste management including management, storage, handling, utilization and disposal of hazardous wastes. The National Hazardous Waste Management Strategy has been formulated with one of the objectives being to promote the use of cleaner technologies for effective management of hazardous wastes. It aims to facilitate implementation of the action plan stated in the National Environment Policy 2006, which focuses on developing and implementing viable models of public–private partnerships for setting up and operating secure landfills, incinerators and other appropriate techniques for the treatment and disposal of toxic and hazardous waste. The plan will aim to strengthen the informal sector systems of collection and recycling of various materials with particular emphasis on enhancing their access to institutional finance and relevant technologies. The Ministry of Environment, Forest and Climate Change (MOEFCC) is also implementing a funding/financing scheme, namely, Creation of Management Structure for Hazardous Substances, which aims to promote innovative technologies for the management of chemicals and waste. India submitted the National Report to the Basel Convention Secretariat in February 2019 (GOI 2019). At the national level, other relevant Rules and Notifications can be accessed from MOEFCC (2019a) and MOEFCC (2019b); and MOEFCC (2019c).
India ratified the Rotterdam convention11 on 24 May 2005. There are currently 161 parties to the Convention and a total of 50 chemicals listed in Annex III, including 34 pesticides, 15 industrial chemicals, and one chemical in both the pesticide and the industrial chemical categories.
11 The updated information for the Rotterdam Convention is based on the note provided by HSMD of MOEFCC.

55SUPPORTING INDIA ON SDG 12 MONITORING AND REPORTINGA Critical Appraisal
The Chemical Review Committee (CRC) is a subsidiary body of the Rotterdam Convention established to review chemicals and pesticide formulations according to the criteria set by the Convention in Annexes II and IV respectively and make recommendations to the Conference of the Parties for listing such chemicals in Annex III. It receives notifications of final regulatory action from the convention secretariat, after due examination in line with Annexure I provisions, for review and consider recommending the chemical for inclusion in Annex III of the Convention. India is a member of the CRC for the period 2020–2024. The MOEFCC is the nodal Ministry for implementation of the Rotterdam Convention on Prior Informed Consent (PIC) Procedure for Certain Hazardous Chemicals and Pesticides in International Trade. While MOEFCC is the nodal Ministry for implementation of Rotterdam Convention in India, Ministry of Chemicals and Fertilizers (MOCF) and Ministry of Agriculture and Farmers Welfare (MOAFW) are Designated National Authority (DNA) for Industrial Chemicals and Pesticides respectively.
For the Stockholm Convention12, in addition to the initial 12 persistent organic pollutants (POPs), which are chlorinated chemicals, 18 new chemicals have been so far listed in the Annexes to the Stockholm Convention. The list is now not limited to chlorinated chemicals, but also comprises brominated and fluorinated chemicals such as: (i) Alpha hexachlorocyclohexane, (ii) Beta hexachlorocyclohexane, (iii) Lindane, (iv) Chlordecone, (v) Hexabromobiphenyl, (vi) Hexabromodiphenyl ether and heptabromodiphenyl ether (commercial octa-BDE), (vii) Perfluorooctane sulfonic acid, its salts and perfluorooctane sulfonyl fluoride, (viii) Tetrabromodiphenyl ether and pentabromodiphenyl ether (commercial penta-BDE), (ix) Pentachlorobenzene (industrial + pesticide), (x) Technical endosulfan and its related isomers, (xi) Hexabromocyclododecane, (xii) Pentachlorophenol, its salts and esters (xiii) Hexachlorobutadine, (xiv) Polychlorinated napthalenes, (xv) PFOA, its salts, and PFOA related compounds, (xvi) Short chain chlorinated paraffins and (xvii) Dicofol. The total number of chemicals listed under Stockholm Convention is 30.
MOEFCC has taken various actions to regulate the POPs within India. It had prepared the National Implementation Plan on POPs in year 2011. During the NIP preparation stage, the ground level situation of all initial 12 POPs was assessed through proper inventorization, sample collection, analysis and interpretation. Polychlorinated biphenyls (PCBs) are one of the 12 POPs slated for elimination under the Stockholm Convention on Persistent Organic Pollutants. As per the provision of the Convention, parties are required to make determined efforts to identify, label and remove PCB-containing equipment from use by 2025, and manage those wastes in an environmentally sound manner, not later than 2028. Because of their insulating and non-flammable properties, PCBs have been used in transformer oils, capacitor oils etc. in a wide range of industrial applications including cutting oils, sealants, inks and additives. The MOEFCC is coordinating the implementation of a project entitled ‘Environmentally Sound Management (ESM) and Final Disposal of Polychlorinated Biphenyls in India’ funded by the Global Environmental Facility (GEF). The project aims to phase out and dispose PCBs in the country through promotion of measures that include introduction to ESM of PCBs disposal to the tune of 7700 MT (approx.) through four facilities with three stationary facilities at Bhilai Steel Plant (BSP) and one mobile facility at Central Power Research Institute (CPRI). The facilities include (i) plasma technology (BSP); (ii) indirect thermal desorption unit (BSP); (iii) de-chlorination technology (BSP) and (iv) mobile de-chlorination treatment facility (CPRI). Regulation of the Polychlorinated Biphenyls (PCBs) Order, 2016 prohibits manufacture, import, use of
12 The updated information for Stockholm Convention is based on the note that was provided by HSMD of MOEFCC.

56SUPPORTING INDIA ON SDG 12 MONITORING AND REPORTINGA Critical Appraisal
PCBs, PCB contained equipment and PCB contaminated equipment (April 2016). The Central Government in the Ministry of Environment Forest and Climate Change has issued a notification on the Regulation of Polychlorinated Biphenyls (PCBs) Order, 2016 vide dated 6 April, 2016. As per the notification, manufacture, import, use of PCBs, PCB contained equipment and PCB contaminated equipment is banned.
MOEFCC had issued notification on the Regulation on Persistent Organic Pollutants Rules, 2018. The purpose of the said rule is to prohibit the manufacture, trade, use, import and export of the seven POPs viz. (i) Chlordecone, (ii) Hexabromobiphenyl, (iii) Hexabromodiphenyl ether and heptabromodiphenyl ether (commercial octa-BDE), (iv) Tetrabromodiphenyl ether and pentabromodiphenyl ether (commercial penta-BDE), (v) Pentachlorobenzene, (vi) Hexabromocyclododecane and (vii) Hexachlorobutadine. MOEFCC is working on the development and promotion of non-POPs alternatives to dichlorodiphenyltrichloroethane (DDT), a colourless, crystalline, tasteless and almost odourless organochloride known for its insecticidal properties. It is one of the initial 12 POPs listed under Annex B of the Stockholm Convention for restricted use for disease vector control due to the unavailability of locally appropriate and cost-effective alternatives. India is the only country that produces, uses and exports DDT. The country has obtained exemption for use of DDT under the provisions of the Stockholm Convention for specific use in vector disease control until 2024. India has taken up the project entitled ‘Development and promotion of non-POPs alternatives to DDT’. The project is aimed at combating vulnerable stages of the life cycle of malaria mosquito vectors using physical, chemical and biological control strategies viz. (a) reducing /eliminating larvae at breeding sites in the water bodies to reduce its population using Bt-based bio-pesticides; (b) promoting effective larvicide, adulticide and repellents using Neem based pesticides; (c) using long lasting insecticidal nets (LLIN) in the mosquito endemic areas to provide an effective barrier to prevent bites by adult mosquitoes; and (d) developing and promoting integrated vector pest management (IVPM) approach.
The Ozone Cell of MOEFCC had prepared a detailed country program (CP) in 1993 (updated in 2006) for the phase out of ozone depleting substances in accordance with its National Industrial Development Strategy by accessing funds from the financial mechanism of the Montreal Protocol. India has proactively phased out the production and consumption of chlorofluorocarbons (CFCs) except for its use in metered dose inhalers (MDIs) in the treatment of asthma and chronic obstructive pulmonary disease (COPD). The use of CFCs in MDIs has been phased out from December, 2012. India has also completely phased out production and consumption of carbon tetrachloride (CTC) and halons as of 1 January, 2010. Currently, the Ozone Cell is engaged in phasing out production and consumption of the next category of chemicals, hydrochlorofluorocarbons (HCFCs) with an accelerated phase-out schedule as per the Montreal Protocol. Rules related to the Vienna Convention can be accessed from MOEFCC (2019e).
For the Minamata Convention13, MOEFCC is implementing a Minamata Initial Assessment (MIA) study through financial support from GEF wherein UNDP India is an executing agency. The study involves development of countrywide comprehensive inventory of emissions, releases, imports, exports and storage of mercury in compliance with Articles 4 and 5 of the Convention. The study would evolve a national mercury profile and ‘National Mercury Action Plan’ and a mercury mainstreaming roadmap.
13 The updated information for Minamata Convention is based on the note that was provided by HSMD of MOEFCC.

57SUPPORTING INDIA ON SDG 12 MONITORING AND REPORTINGA Critical Appraisal
Critique
The latest national indicator by MOSPI (2021) has already removed, “Developing national secondary resource policy framework”. The team is in agreement with this change. The existing National Indicators 12.4.1, “Wheth-er the country has ratified international multilateral environmental agreements on hazardous waste and other chemicals”, is also not adequate; it needs further refinement and can be aligned with the global indicator. The scoring system can be followed instead of a Yes/No indicator. The Yes/No aspect will have to be further disaggregated to give a holistic picture of the national compliance and steer a public debate on the topic of hazardous waste and chemicals.
Methodology and Data
The team recommends replacing 12.4.1 with the following indicator • 12.4.1: National compliance rate with international multilateral environmental agreements on hazardous waste and other chemicals - 12.4.1 (i): National compliance rate for Basel Convention - 12.4.1 (ii): National compliance rate for Rotterdam Convention - 12.4.1 (iii): National compliance rate for Stockholm Convention - 12.4.1 (iv): National compliance rate for Montreal Protocol - 12.4.1 (v): National compliance rate for Minamata Convention
For monitoring and reporting of the proposed indicator, information can be collected from HSMD and scoring can be done based on Table 5.2. While the data for some variables will remain the same for a few years, the team recommends reporting on an annual basis.
Table 5.2: Suggested reporting for national compliance
1 Basel
Has the designation of the focal point/ country contact been listed correctly on the Convention and MOEFCC website?
Has India submitted the annual national reports for the particular year and has the same been updated on MOEFCC website?
HSMD
1
1
# Reference for scoringConvention Score Maximum score
Data Source

58SUPPORTING INDIA ON SDG 12 MONITORING AND REPORTINGA Critical Appraisal
2
3
4
5
Rotterdam
Stockholm
Montreal Protocol
Minamata
Has the designation of the focal point/ country contact been listed correctly on the Convention and MOEFCC website?
How many import responses has India submitted until now and the same been updated on MOEFCC website?
Has the designation of the focal point/ country contact been listed correctly on the Convention and MOEFCC website?
Has India submitted a national implementation plan for the reporting period and the same been updated on MOEFCC website?
Has India submitted any revisions to the national implementation plan for the reporting period and the same been updated on MOEFCC website? (if applicable)
Has the designation of the focal point/ country contact been listed correctly on the Convention and MOEFCC website?
Has India submitted information on licensing systems under (Article 4B of) the Montreal Protocol and the same been updated on MOEFCC website?
Has the designation of the focal point/ country contact been listed correctly on the Convention and MOEFCC website?
Has India submitted any national reports/ plans required for the particular year and the same been updated on MOEFCC website?
HSMD
HSMD
Ozone Cell
HSMD
1
Will vary14
1
1
1
1
1
1
1
# Reference for scoringConvention Score Maximum score
Data Source
The compliance rate can be calculated for individual conventions as per the following formula.
National Compliance Rate = ×100Total score for that convention
Maximum score possible for that convention
14 Will include the number of import responses for which India was required to respond to.
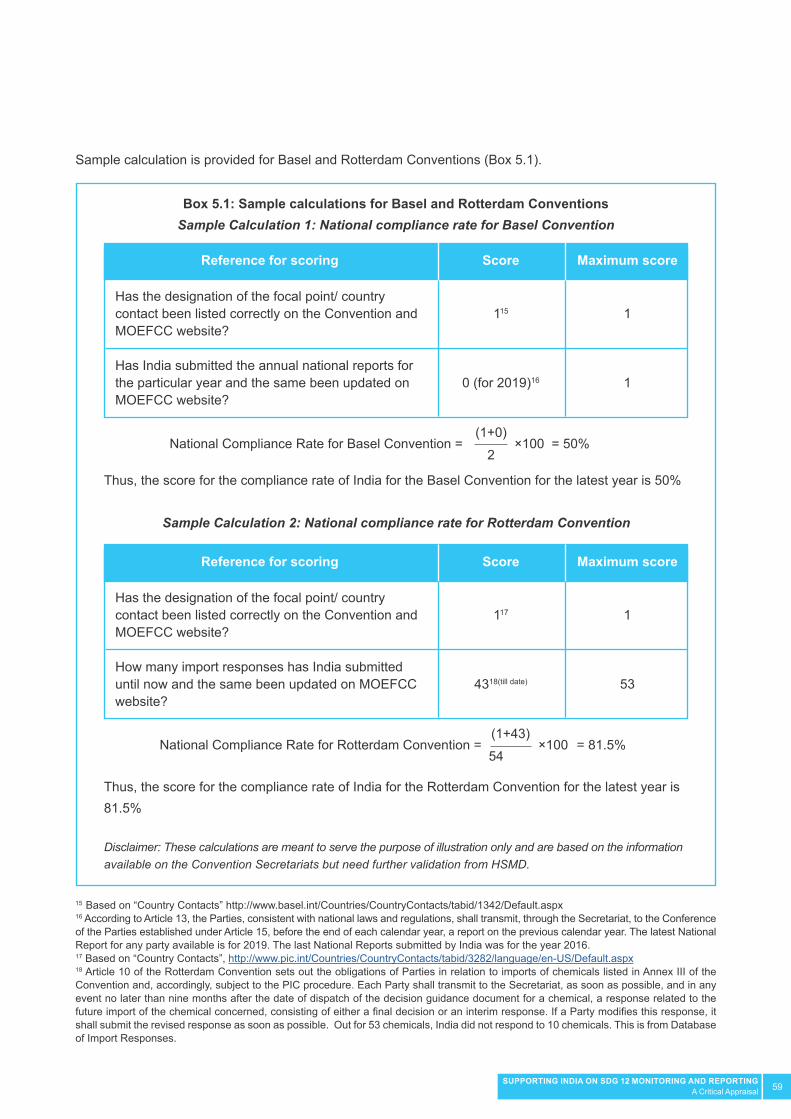
59SUPPORTING INDIA ON SDG 12 MONITORING AND REPORTINGA Critical Appraisal
Sample calculation is provided for Basel and Rotterdam Conventions (Box 5.1).
Thus, the score for the compliance rate of India for the Basel Convention for the latest year is 50%
Sample Calculation 2: National compliance rate for Rotterdam Convention
Thus, the score for the compliance rate of India for the Rotterdam Convention for the latest year is 81.5%
Disclaimer: These calculations are meant to serve the purpose of illustration only and are based on the information available on the Convention Secretariats but need further validation from HSMD.
Box 5.1: Sample calculations for Basel and Rotterdam ConventionsSample Calculation 1: National compliance rate for Basel Convention
Has the designation of the focal point/ country contact been listed correctly on the Convention and MOEFCC website?
Has India submitted the annual national reports for the particular year and the same been updated on MOEFCC website?
Has the designation of the focal point/ country contact been listed correctly on the Convention and MOEFCC website?
How many import responses has India submitted until now and the same been updated on MOEFCC website?
1
1
1
53
115
0 (for 2019)16
117
4318(till date)
Maximum score
Maximum score
Reference for scoring
Reference for scoring
Score
Score
National Compliance Rate for Basel Convention =
National Compliance Rate for Rotterdam Convention =
= 50%
= 81.5%
×100
×100
(1+0)
(1+43)
2
54
15 Based on “Country Contacts” http://www.basel.int/Countries/CountryContacts/tabid/1342/Default.aspx16 According to Article 13, the Parties, consistent with national laws and regulations, shall transmit, through the Secretariat, to the Conference of the Parties established under Article 15, before the end of each calendar year, a report on the previous calendar year. The latest National Report for any party available is for 2019. The last National Reports submitted by India was for the year 2016.17 Based on “Country Contacts”, http://www.pic.int/Countries/CountryContacts/tabid/3282/language/en-US/Default.aspx18 Article 10 of the Rotterdam Convention sets out the obligations of Parties in relation to imports of chemicals listed in Annex III of the Convention and, accordingly, subject to the PIC procedure. Each Party shall transmit to the Secretariat, as soon as possible, and in any event no later than nine months after the date of dispatch of the decision guidance document for a chemical, a response related to the future import of the chemical concerned, consisting of either a final decision or an interim response. If a Party modifies this response, it shall submit the revised response as soon as possible. Out for 53 chemicals, India did not respond to 10 chemicals. This is from Database of Import Responses.

60SUPPORTING INDIA ON SDG 12 MONITORING AND REPORTINGA Critical Appraisal
At the moment, there is no publication by HSMD or the Ozone Cell for the reporting of information discussed in this section. HSMD and the Ozone Cell themselves can be sources of information and can make available the information required for this indicator through a questionnaire. The data reporting can have a lag of two years or four years. The team suggests reporting on this data annually. For conventions, some aspects there may not be updated annually (for example, national reporting for the Stockholm Convention is every four years) in which case, reporting can be done on the last reporting period.
National Indicator 12.4.2 is already aligned with the global indicator as per MOSPI (2021). This has been recently adopted and reported in MOSPI (2021). According to the National Inventory on Hazardous Waste Generation and its Management 2016–2017 (CPCB 2019: 11), there were 56,350 hazardous waste generating industries in the country authorized to generate about 25.46 million metric tonnes (MT) of hazardous wastes. Information that can be used for computation of values for 12.4.2 can be found from PCB (2018) and RGI (2006). The data source is the National Inventory on Hazardous Waste Generation and their Management (2016–2017) and ORGCC (2006). The periodicity for the same will be annual according to the CPCB official interviewed.
Recommendations
The National Indicator 12.4.2 is now already aligned with the global indicator. The team recommends that the existing national indicators for Indicator 12.4.1 be replaced with the indicator as discussed. India already has a dedicated division/ cell within MOEFCC that deals with hazardous wastes and ozone. Moreover, CPCB, on an annual basis, will also regularly come out with a National Inventory on Hazardous Wastes. Similar to the aforementioned methodology, the study team suggests replacing 12.4.1 with the following.
• 12.4.1: National compliance rate with international multilateral environmental agreements on hazardous waste and other chemicals - 12.4.1 (i): National compliance rate for Basel Convention - 12.4.1 (ii): National compliance rate for Rotterdam Convention - 12.4.1 (iii): National compliance rate for Stockholm Convention - 12.4.1 (iv): National compliance rate for Montreal Protocol - 12.4.1 (v): National compliance rate for Minamata Convention
The reporting of Indicator 12.4.1 (national compliance) can possibly follow data/ information flow process as depicted in Figure 5.1. This indicator can only be reported at the national level.
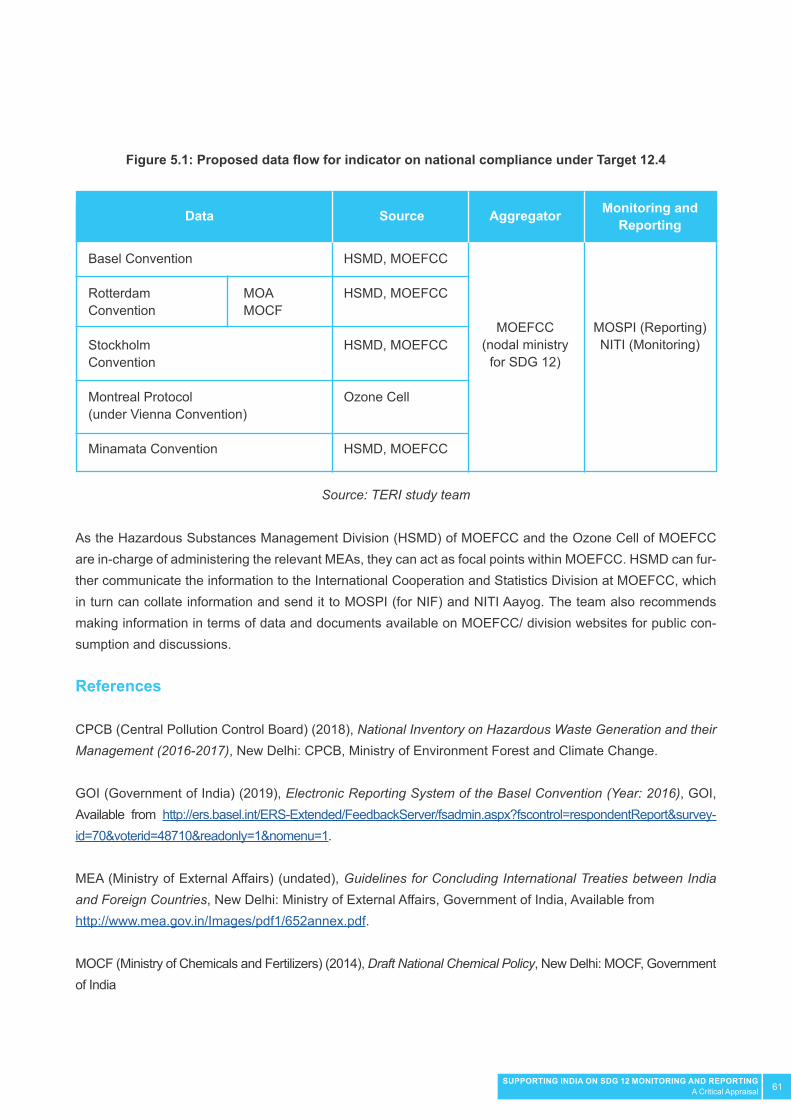
61SUPPORTING INDIA ON SDG 12 MONITORING AND REPORTINGA Critical Appraisal
As the Hazardous Substances Management Division (HSMD) of MOEFCC and the Ozone Cell of MOEFCC are in-charge of administering the relevant MEAs, they can act as focal points within MOEFCC. HSMD can fur-ther communicate the information to the International Cooperation and Statistics Division at MOEFCC, which in turn can collate information and send it to MOSPI (for NIF) and NITI Aayog. The team also recommends making information in terms of data and documents available on MOEFCC/ division websites for public con-sumption and discussions.
References
CPCB (Central Pollution Control Board) (2018), National Inventory on Hazardous Waste Generation and their Management (2016-2017), New Delhi: CPCB, Ministry of Environment Forest and Climate Change.
GOI (Government of India) (2019), Electronic Reporting System of the Basel Convention (Year: 2016), GOI, Available from http://ers.basel.int/ERS-Extended/FeedbackServer/fsadmin.aspx?fscontrol=respondentReport&survey-id=70&voterid=48710&readonly=1&nomenu=1.
MEA (Ministry of External Affairs) (undated), Guidelines for Concluding International Treaties between India and Foreign Countries, New Delhi: Ministry of External Affairs, Government of India, Available from http://www.mea.gov.in/Images/pdf1/652annex.pdf.
MOCF (Ministry of Chemicals and Fertilizers) (2014), Draft National Chemical Policy, New Delhi: MOCF, Government of India
Figure 5.1: Proposed data flow for indicator on national compliance under Target 12.4
Source: TERI study team
MOEFCC(nodal ministry
for SDG 12)
MOSPI (Reporting)NITI (Monitoring)
Basel Convention
Rotterdam Convention
Stockholm Convention
Montreal Protocol (under Vienna Convention)
Minamata Convention
MOAMOCF
HSMD, MOEFCC
HSMD, MOEFCC
HSMD, MOEFCC
Ozone Cell
HSMD, MOEFCC
Data Source Aggregator Monitoring and Reporting

62SUPPORTING INDIA ON SDG 12 MONITORING AND REPORTINGA Critical Appraisal
MOEF (Ministry of Environment and Forests) (undated), National Hazardous Waste Management Strategy (Draft), New Delhi: MOEF, Government of India.
MOEFCC (Ministry of Environment Forest and Climate Change) (2016), Hazardous and Other Wastes (Management and Transboundary Movement) Rules, 2016, New Delhi: MOEFCC.
MOEFCC (Ministry of Environment Forest and Climate Change) (2019a), Hazardous Substances Management (HSM) Division, New Delhi: MOEFCC, Government of India, Available from http://moef.gov.in/division/environ-ment-divisions/hazardous-substances-management-hsm/introduction/.
MOEFCC (Ministry of Environment Forest and Climate Change) (2019b), Ozone Cell of the Ministry of Environment, Forest and Climate Change, New Delhi: MOEFCC, Government of India, Available from http://www.ozonecell.com.
MOEFCC (Ministry of Environment Forest and Climate Change) (2019c), Hazardous Substances Management (Rules and Notifications), New Delhi: MOEFCC, Government of India, Available from http://moef.gov.in/rules-and-regulations/environment-protection/hazardous-substances-management/
MOEFCC (Ministry of Environment Forest and Climate Change) (2019d), Legislations Related to Hazardous Substances Management, New Delhi: MOEFCC, Government of India, Available from http://moef.gov.in/15058-2/.
MOEFCC (Ministry of Environment Forest and Climate Change) (2019e), Ozone Layer Depletion, New Delhi: MOEFCC, Government of India, Available from http://moef.gov.in/rules-and-regulations/environment-protection/ozone-layer-depletion/.
MOSPI (Ministry of Statistics and Programme Implementation) (2018), Sustainable Development Goals: National Indicator Framework (November, 2018), New Delhi: MOSPI, Government of India.
MOSPI (Ministry of Statistics and Programme Implementation) (2019), Sustainable Development Goals: National Indicator Framework (Baseline Report, 2015-16), New Delhi: MOSPI, Government of India.
MOSPI (Ministry of Statistics and Programme Implementation) (2020a), Sustainable Development Goals: National Indicator Framework (March 2020), New Delhi: MOSPI, Government of India.
MOSPI (Ministry of Statistics and Programme Implementation) (2020b), Sustainable Development Goals Progress Report, New Delhi: MOSPI, Government of India.
MOSPI (Ministry of Statistics and Programme Implementation) (2021), Sustainable Development Goals National Indicator Progress Report (Version 3), New Delhi: MOSPI, Government of India.
ORGCC (Office of the Registrar General and Census Commissioner) (2006), Population Projections for India and States (2001-2026), New Delhi: ORGCC.

63SUPPORTING INDIA ON SDG 12 MONITORING AND REPORTINGA Critical Appraisal
UN (United Nations) (2017), Global indicator framework adopted by the General Assembly (A/RES/71/313) including annual refinements contained in E/CN.3/2018/2 (Annex II) and E/CN.3/2019/2 (Annex II), New York: UN, Available from https://unstats.un.org/sdgs/indicators/indicators-list/.
UN (United Nations) (2019a), Tier Classification for Global SDG Indicators (Version 11 December 2019), New York: UN, Available from https://unstats.un.org/sdgs/files/Tier_Classification_of_SDG_Indicators_22_May_2019_web.pdf.
UN (United Nations) (2019b), Global SDG Indicators Database, New York: UN, Available from https://unstats.un.org/sdgs/indicators/database/
UN (United Nations) (2020a), Tier Classification for Global SDG Indicators (Version 17 April 2020), New York: UN.
UN (United Nations) (2020b), Global SDG Indicators Database, New York: UN.
UN (United Nations) (2021), Tier Classification for Global SDG Indicators (Version 29 March 2021), New York: UN.
UNEP (United Nations Environment Programme) (2017), Metadata for Target 12.4, New York: United Nations, Available from https://unstats.un.org/sdgs/metadata/files/Metadata-12-04-01.pdf.
UNEP and UNSD (United Nations Environment Programme and United Nations Statistics Division) (2018), Work-plan for Tier III Indicator 12.4.2, New York: UNSD.
UNSD (United Nations Statistics Division) (2017), Meta-data for Indicator 12.4.1, New York: UNSD.
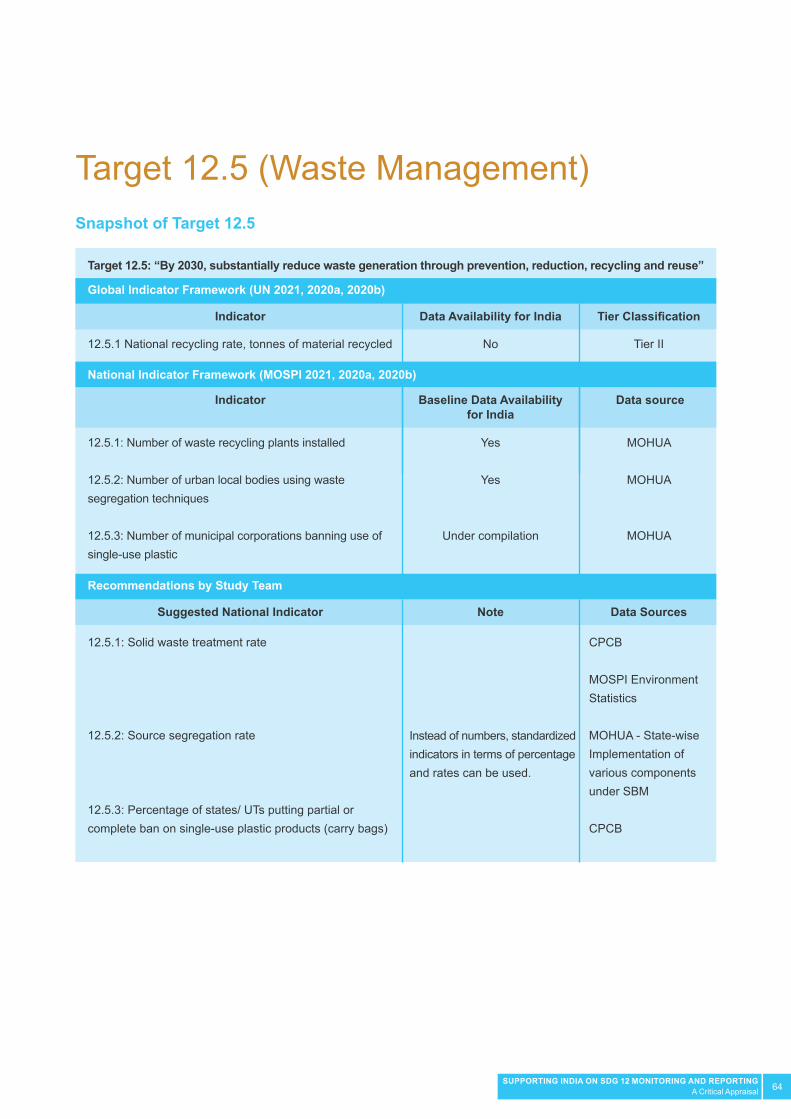
64SUPPORTING INDIA ON SDG 12 MONITORING AND REPORTINGA Critical Appraisal
Target 12.5 (Waste Management)Snapshot of Target 12.5
Target 12.5: “By 2030, substantially reduce waste generation through prevention, reduction, recycling and reuse”
Indicator
Suggested National Indicator
Indicator
12.5.1 National recycling rate, tonnes of material recycled
12.5.1: Solid waste treatment rate
12.5.2: Source segregation rate
12.5.3: Percentage of states/ UTs putting partial or complete ban on single-use plastic products (carry bags)
12.5.1: Number of waste recycling plants installed
12.5.2: Number of urban local bodies using waste segregation techniques
12.5.3: Number of municipal corporations banning use of single-use plastic
No
Instead of numbers, standardized indicators in terms of percentage and rates can be used.
Yes
Yes
Under compilation
Tier II
CPCB
MOSPI Environment Statistics
MOHUA - State-wise Implementation of various components under SBM
CPCB
MOHUA
MOHUA
MOHUA
Data Availability for India
Note
Baseline Data Availability for India
Tier Classification
Data Sources
Data source
Global Indicator Framework (UN 2021, 2020a, 2020b)
Recommendations by Study Team
National Indicator Framework (MOSPI 2021, 2020a, 2020b)
65SUPPORTING INDIA ON SDG 12 MONITORING AND REPORTINGA Critical Appraisal
Policy Relevance
Visvanathan (2012) mentions three commonly used waste management indicators – amount of municipal waste generated per capita, amount sent to landfill or to the incineration plant and recycling rate. According to the categorization by the CPCB, waste in India comprises solid waste, plastic waste, biomedical waste19, hazardous waste20 (including industrial waste), construction and demolition waste, and e-waste21. The Government of India has several schemes in operation on waste management for urban and rural areas. The Central Pollution Control Board has notified various waste management rules in this regard. The Ministry of Housing and Urban Affairs, under Swachh Bharat Mission – Urban, provides assistance for municipal solid waste management. Its rural counterpart aims to achieve Open Defecation Free (ODF) status for all villages through solid and liquid waste management. The status on collection and treatment of waste are not very encouraging; most of the waste ends up in landfills or in water bodies. From the data reported in the global indicator framework and on the basis of national policy approaches, three categories of waste become important: solid waste, e-waste and plastic waste.
According to MOEFCC (2016), about 75–80 per cent of the municipal solid waste gets collected and only 22–28 per cent of this waste is processed and treated. CPCB has notified the Solid Waste Management (SWM) Rules in 2016. SWM Rules prescribe that no waste generator shall throw, burn or bury the solid waste generated by him, on streets, open public spaces outside his premises or in the drain or water bodies. According to SWM Rules, waste generators have to segregate the waste at source and hand over the segregated waste to authorized waste pickers or waste collectors. As far as scientific technique is concerned, the Rules prescribes setting up material recovery facilities with sufficient space for sorting of recyclable materials. As per the E-Waste (Management) Rules, 2016, Central Pollution Control Board (CPCB) issues Extended Producer Responsibility (EPR) authorization to the producers of Electrical and Electronic Equipments (EEE) listed in the Schedule-I of rules along with e-waste collection targets on annual basis. In India, 40 per cent of the plastic waste that is generated remains untreated and ends up in landfills or polluting water and land resources (MOHUA 2019). The Government has notified Plastic Waste Management Rules (PWM), 2016, which prohibit the use of carry bag made of virgin or recycled plastic less than fifty microns in thickness. Sachets made of plastic material for storing, packing or selling gutkha, tobacco and pan masala is also prohibited. Further, considering the high environmental cost associated with the use of single-use plastic, particularly the adverse effect on soil, water bodies and on marine environment, on World Environment Day 2018, India’s Prime Minister announced India’s pledge to phase out single-use plastic by 2022.
19 As per CPCB, bio medical waste is the waste generated by hospitals, nursing homes, clinics, dispensaries, veterinary institutions, ani-mal houses, pathological laboratories, blood banks, ayush hospitals, clinical establishments, research or educational institutions, health camps, medical or surgical camps, vaccination camps, blood donation camps, first aid rooms of schools, forensic laboratories and re-search labs.20 As per Hazardous Waste (Management & Handling) Rules 1989,’hazardous waste’ includes any waste which by reason of any of its physical, chemical, reactive, toxic, flammable, explosive or corrosive characteristics causes danger or is likely to cause danger to health or environment, whether alone or when in contact with other wastes or substances. As per the Rules, there were 18 categories of hazardous waste specified, which were further amended in 2000 and 2003. 21 As per CPCB (2008), e-waste comprises products that are both ‘hazardous’ and ‘non-hazardous’ in nature. Broadly, it consists of ferrous and non-ferrous metals, plastics, glass, wood & plywood, printed circuit boards, concrete and ceramics, rubber and other items. Iron and steel constitutes about 50 per cent of the e-waste followed by plastics (21%), non-ferrous metals (13%) and other constituents. Non-ferrous metals consist of metals like copper, aluminium and precious metals like silver, gold, platinum, palladium etc. The presence of elements like lead, mercury, arsenic, cadmium, selenium, and hexavalent chromium and flame retardants beyond threshold quantities in e-waste classifies them as hazardous waste.

66SUPPORTING INDIA ON SDG 12 MONITORING AND REPORTINGA Critical Appraisal
As per the PWM Rules 2016, the responsibility of using properly labeled plastic carry bags is on shopkeepers/retailers. Producers, importers and brand owners have now initiated steps to set up material recovery facilities on their own or through Producers Responsibility Organizations (PRO) for collection of plastic waste including PVC; moreover, they are tying up with the registered recyclers for the recycling of plastic waste.
The concern on recycling is further intensified due to absence of technology for recycling or non-availability of feedstock of desired quality and quantity even if the technology is known. There is also lack of any market for recycled products as customer specifications do not permit use of materials recycled from waste (TIFAC 2001). Examples exist on municipalities providing information on PWM. The Aizawl Municipal Corporation (AMC) is one such ULB which provides information on ban on use of plastics (AMC 2019). However, most the States/UTs do not report regularly on the implementation of these three rules. Hence for this, monitoring of three rules on solid waste, e-waste and plastics is key. Transitioning from a linear (produce–consume–dispose) to a circular (reduce–recover–reuse–recycle–redesign–remanufacture) economy has become the need of the day (MOEFCC 2019; NITI 2017).
Conceptualization
Global Indicator Framework
Target 12.5 under SDG 12 sets the global mandate that by 2030, we need to achieve a substantial reduction in waste generation through prevention, reduction, recycling and reuse. The global indicator corresponding to this target is 12.5.1, ‘national recycling rate, tons of material recycled’ (UN 2019). National recycling rate is defined as quantity of material recycled in the country plus quantities exported for recycling out of the total waste generated in the country, minus material imported intended for recycling22. The indicator is the national recycling rate which is expressed as follows.
Data on waste generation is collected by UNSD through a biennial UNEP/UNSD questionnaire. However, data on waste recycled is only available as part of treatment of municipal and electronic waste.
National Indicator Framework
The latest progress report on the National Indicator Framework (NIF) reports on two of the three indicators suggested under Target 12.5 (MOSPI 2021). These indicators are on the number of waste recycling plants and on the number of urban local bodies using waste segregation techniques. Indicator 12.5.1 is on the number of waste recycling plants installed, Indicator 12.5.2 is on the number of urban local bodies using waste segregation techniques, and Indicator 12.5.3 is on the number of municipal corporations banning use of plastic. The emphasis on waste recycling in NIF is owing to the fact that waste recycling is one of the key sectors in terms of employment creation.
22 Global Chemicals and Waste Indicator Review Document; Goal 12, 12.5.1 National recycling Rate; Metadata 12.5.1_final resubmission document
National recycling rate = (Total waste recycled)/Total waste generated

67SUPPORTING INDIA ON SDG 12 MONITORING AND REPORTINGA Critical Appraisal
Recycling of waste has the potential to create additional jobs (almost six times), which will also enhance the gross domestic product (GDP) of the nation (Samaddar and Bandyopadhyay 2018). Waste recycling also converts waste into useful products and thus, helps in conservation of natural resources and achieves sustainable production. Waste segregation plays a significant role in waste management.
The third national indicator is based on municipal corporations banning the use of plastics. National Indicator 12.5.3 will help maintain a data repository for successful implementation and monitoring of plastic waste management rules. This indicator of NIF is yet to be reported on.
In terms of data, CPCB is the primary body that collates data on waste from State Pollution Control Boards/Pollution Control Committees (SPCBs/PCCs). The availability of data varies according to the different categories of waste. Data on plastic waste management is published in annual reports of CPCB; these data also include reports on the implementation of various waste management rules. Data on solid waste management (SMW) (in terms of generation, collection, and treatment) can be collected from the CPCB. Industries generating solid waste have to manage such waste by themselves and are required to seek authorisations from respective SPCBs. The SPCBs have to report this data to CPCB on an annual basis. For e-waste, CPCB provides a state-wise list of authorized dismantlers/recyclers according to which there are 312 dismantling/recycling units in India as of June 2019. The SPCBs have to send reports on an annual basis to CPCB to monitor the progress. Some municipal corporations have initiated certain steps towards environmentally sound management of e-waste. Similarly for plastic waste, all such plastic manufacturing/recycling units have to be registered with the SPCBs/PCCs which should then be reported to CPCB on an annual basis. The Ministry of Housing and Urban Affairs (MOHUA) has laid out standard operating procedures (SOPs) for urban local bodies (ULBs) to ensure proper storage and treatment of segregated waste. MOHUA (2018a) provides details on city level waste processing plants available in India. For some selected cities, city-wise MSW segregation data is available from their respective municipal corporations.
Critique
National Indicator 12.5.1, which includes a number of waste recycling plants installed, seems an incomplete indicator. In order to arrive at an estimate of quantum of total waste recycled, ‘number’ of waste recycling plants installed by itself would not help. Along with the number, the total quantum of recycled waste may be required as each plant would vary in its output of recycled waste depending upon its capacity. Further, data on recycled waste is not available owing to the fact that much of the recycling happens in the informal sector. Similarly, national indicators 12.5.2 and 12.5.3 on number of municipal corporations using waste segregation techniques and number of municipal corporations banning use of plastic also do not provide any information on waste quantum. Waste quantum is the first step for a holistic waste management strategy.
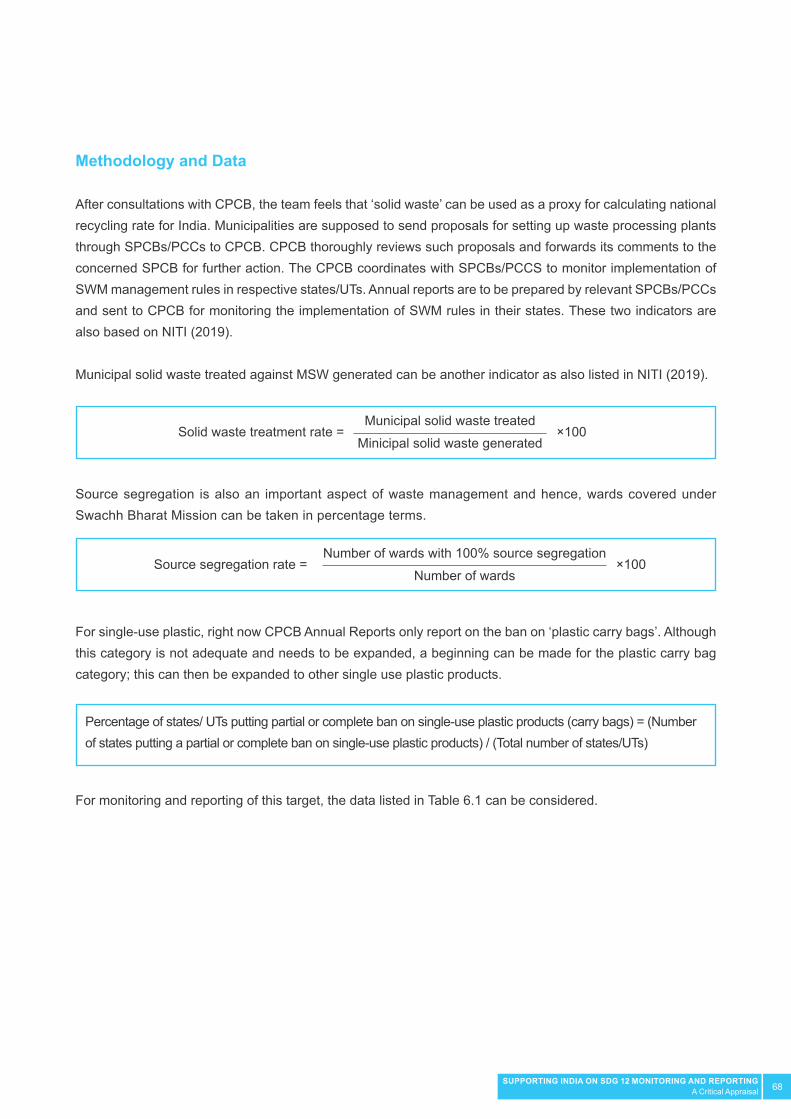
68SUPPORTING INDIA ON SDG 12 MONITORING AND REPORTINGA Critical Appraisal
Methodology and Data
After consultations with CPCB, the team feels that ‘solid waste’ can be used as a proxy for calculating national recycling rate for India. Municipalities are supposed to send proposals for setting up waste processing plants through SPCBs/PCCs to CPCB. CPCB thoroughly reviews such proposals and forwards its comments to the concerned SPCB for further action. The CPCB coordinates with SPCBs/PCCS to monitor implementation of SWM management rules in respective states/UTs. Annual reports are to be prepared by relevant SPCBs/PCCs and sent to CPCB for monitoring the implementation of SWM rules in their states. These two indicators are also based on NITI (2019).
Municipal solid waste treated against MSW generated can be another indicator as also listed in NITI (2019).
Source segregation is also an important aspect of waste management and hence, wards covered under Swachh Bharat Mission can be taken in percentage terms.
For single-use plastic, right now CPCB Annual Reports only report on the ban on ‘plastic carry bags’. Although this category is not adequate and needs to be expanded, a beginning can be made for the plastic carry bag category; this can then be expanded to other single use plastic products.
For monitoring and reporting of this target, the data listed in Table 6.1 can be considered.
Solid waste treatment rate =
Source segregation rate =
×100
×100
Municipal solid waste treated
Number of wards with 100% source segregation
Minicipal solid waste generated
Number of wards
Percentage of states/ UTs putting partial or complete ban on single-use plastic products (carry bags) = (Number of states putting a partial or complete ban on single-use plastic products) / (Total number of states/UTs)

69SUPPORTING INDIA ON SDG 12 MONITORING AND REPORTINGA Critical Appraisal
Table 6.1: Data sources for reporting on Target 12.5
Source: TERI study team
1
2
3
Municipal Solid Waste
Municipal Solid Waste
Plastic waste
Municipal solid waste (MSW) treated against MSW generated
Percentage of wards with 100% source segregation
Percentage of municipal corporations putting restrictions on single-use plastic in terms of partial/complete ban on use of plastic carry bags (through Executive Order)
CPCB - Annual Reports on MSW RulesMOSPI - EnviStats
MOHUA[State-wise Status of Implementation of various components under SBM]
CPCB - Annual Reports on PWM Rules
Annual
Annual
Annual
# Data SourceType of waste PeriodicityIndicator
Recommendations
The TERI team suggests replacing the current national indicators with the following two indicators used by NITI for the SDG Index.
The study team recommends two indicators for target 12.5: • 12.5.1: Solid waste treatment rate • 12.5.2: Source segregation rate • 12.5.3: Percentage of states/ UTs putting partial or complete ban on single-use plastic products (carry bags)
For Indicator 12.5.1 and 12.5.3, data flow is depicted in Figure 6.1.
Figure 6.1: Proposed data flow for reporting proposed Indicators 12.5.1 and 12.5.3
Source: TERI study team
Nodal Ministry for SDG 12 (MOEFCC)
MOSPI
NITICPCB
Data sources
NationalStateNational Indicator Monitoring and
Reporting
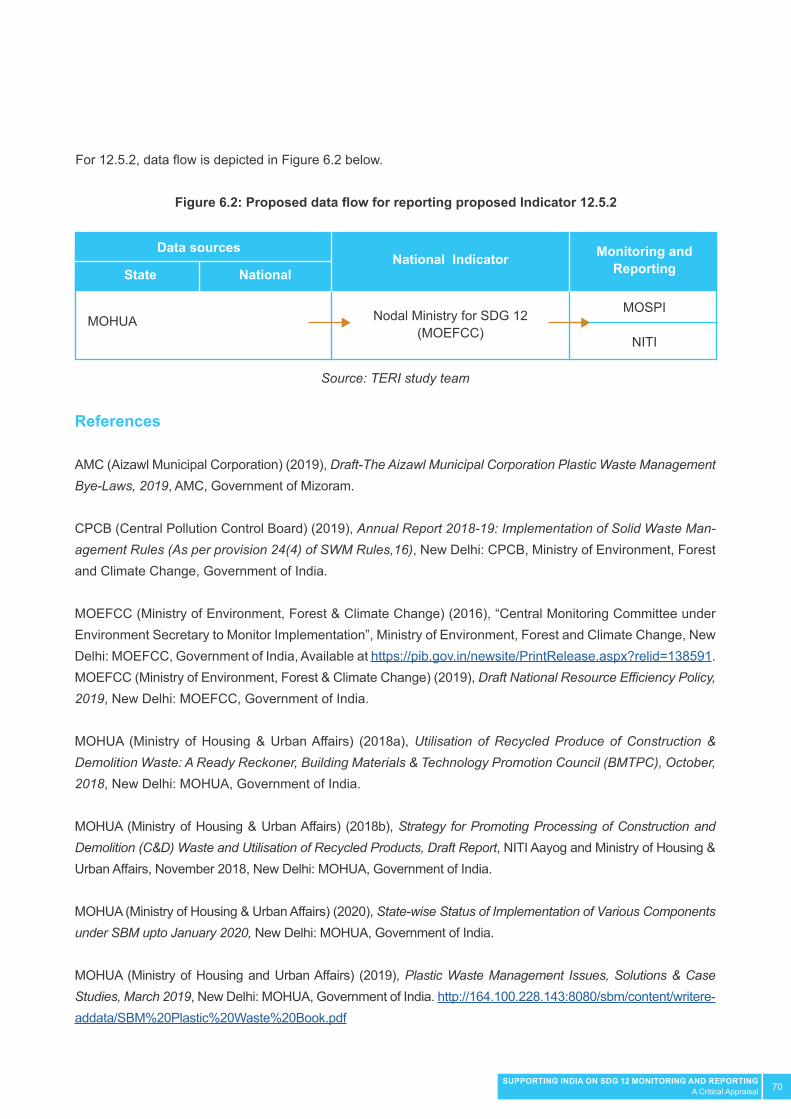
70SUPPORTING INDIA ON SDG 12 MONITORING AND REPORTINGA Critical Appraisal
For 12.5.2, data flow is depicted in Figure 6.2 below.
Figure 6.2: Proposed data flow for reporting proposed Indicator 12.5.2
References
AMC (Aizawl Municipal Corporation) (2019), Draft-The Aizawl Municipal Corporation Plastic Waste Management Bye-Laws, 2019, AMC, Government of Mizoram.
CPCB (Central Pollution Control Board) (2019), Annual Report 2018-19: Implementation of Solid Waste Man-agement Rules (As per provision 24(4) of SWM Rules,16), New Delhi: CPCB, Ministry of Environment, Forest and Climate Change, Government of India.
MOEFCC (Ministry of Environment, Forest & Climate Change) (2016), “Central Monitoring Committee under Environment Secretary to Monitor Implementation”, Ministry of Environment, Forest and Climate Change, New Delhi: MOEFCC, Government of India, Available at https://pib.gov.in/newsite/PrintRelease.aspx?relid=138591.MOEFCC (Ministry of Environment, Forest & Climate Change) (2019), Draft National Resource Efficiency Policy, 2019, New Delhi: MOEFCC, Government of India.
MOHUA (Ministry of Housing & Urban Affairs) (2018a), Utilisation of Recycled Produce of Construction & Demolition Waste: A Ready Reckoner, Building Materials & Technology Promotion Council (BMTPC), October, 2018, New Delhi: MOHUA, Government of India.
MOHUA (Ministry of Housing & Urban Affairs) (2018b), Strategy for Promoting Processing of Construction and Demolition (C&D) Waste and Utilisation of Recycled Products, Draft Report, NITI Aayog and Ministry of Housing & Urban Affairs, November 2018, New Delhi: MOHUA, Government of India.
MOHUA (Ministry of Housing & Urban Affairs) (2020), State-wise Status of Implementation of Various Components under SBM upto January 2020, New Delhi: MOHUA, Government of India.
MOHUA (Ministry of Housing and Urban Affairs) (2019), Plastic Waste Management Issues, Solutions & Case Studies, March 2019, New Delhi: MOHUA, Government of India. http://164.100.228.143:8080/sbm/content/writere-addata/SBM%20Plastic%20Waste%20Book.pdf
Source: TERI study team
Nodal Ministry for SDG 12 (MOEFCC)
MOSPI
NITIMOHUA
Data sources
NationalStateNational Indicator Monitoring and
Reporting

71SUPPORTING INDIA ON SDG 12 MONITORING AND REPORTINGA Critical Appraisal
MOSPI (Ministry of Statistics and Programme Implementation) (2019), EnviStats India 2019, New Delhi: MOSPI, Government of India.
MOSPI (Ministry of Statistics and Programme Implementation) (2020a), Sustainable Development Goals: National Indicator Framework (March 2020), New Delhi: MOSPI, Government of India.
MOSPI (Ministry of Statistics and Programme Implementation) (2020b), Sustainable Development Goals National Indicator Progress Report, New Delhi: MOSPI, Government of India.
MOSPI (Ministry of Statistics and Programme Implementation) (2021), Sustainable Development Goals National Indicator Progress Report (Version 3), New Delhi: MOSPI, Government of India.
NITI (National Institution for Transforming India) Aayog (2017), Strategy Paper on Resource Efficiency, New Delhi: NITI Aayog, Government of India.
NITI (National Institution for Transforming India) Aayog (2019), SDG India Index 2.0, New Delhi: NITI Aayog, Government of India.
Samaddar, S. and A. Bandyopadhyay (2018, August 28), “There’s Much to Gain from Recycling of Waste”, Business Line, The Hindu, New Delhi. Retrieved from https://www.thehindubusinessline.com/
TIFAC (Technology Information Forecasting and Assessment Council) (2001), Utilisation of Waste from Construction Industry, TIFAC Report TMS 150, New Delhi.
UN (United Nations) (2019), Tier Classification for Global SDG Indicators (Version 27 September 2019), New York: UN, Available from
UN (United Nations) (2020a), Tier Classification for Global SDG Indicators (Version 17 April 2020), New York: UN.
UN (United Nations) (2020b), Global SDG Indicators Database, New York: UN.
UN (United Nations) (2021), Tier Classification for Global SDG Indicators (Version 29 March 2021), New York: UN.
Visvanathan C. (2012), Waste Management Indicators - Priority and Challenges (Presentation at Asia Resource Circulation Policy Research Workshop, 12-14 December 2012), Available at https://archive.iges.or.jp/en/archive/wmr/pdf/activity20121213/1-3_Visu_WM.pdf.
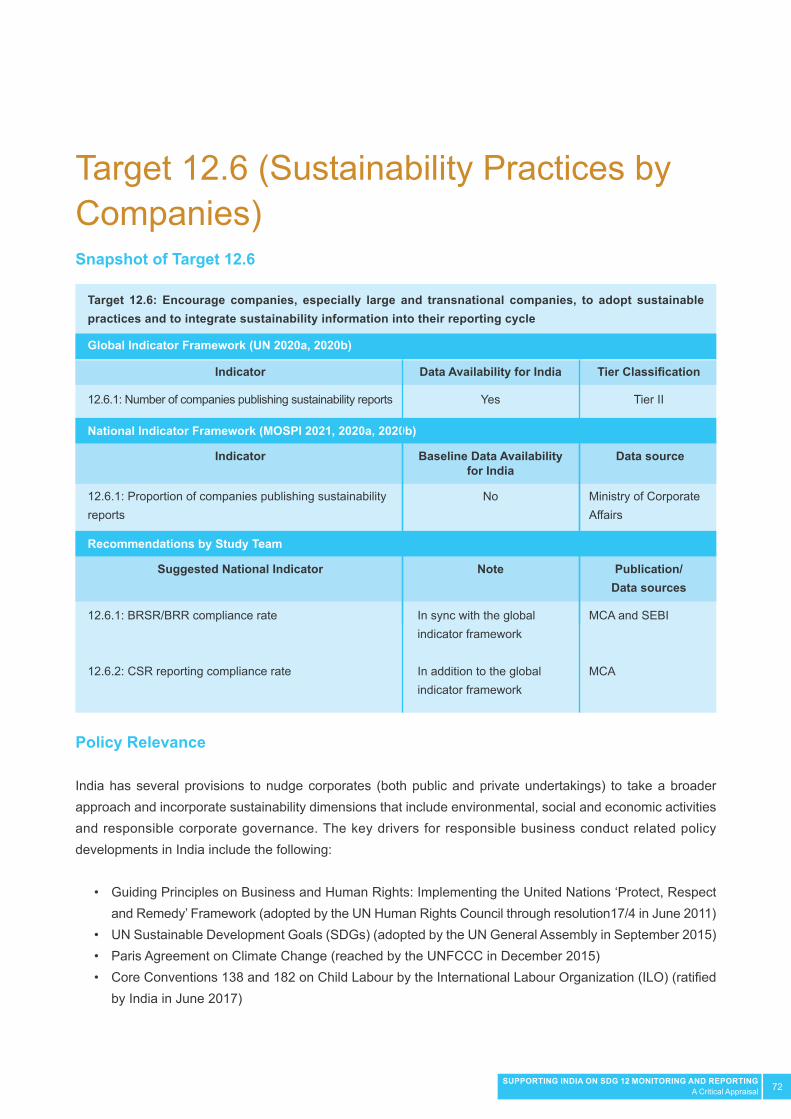
72SUPPORTING INDIA ON SDG 12 MONITORING AND REPORTINGA Critical Appraisal
Target 12.6 (Sustainability Practices by Companies)Snapshot of Target 12.6
Target 12.6: Encourage companies, especially large and transnational companies, to adopt sustainable practices and to integrate sustainability information into their reporting cycle
Indicator
Suggested National Indicator
Indicator
12.6.1: Number of companies publishing sustainability reports
12.6.1: BRSR/BRR compliance rate
12.6.2: CSR reporting compliance rate
12.6.1: Proportion of companies publishing sustainability reports
Yes
In sync with the global indicator framework
In addition to the global indicator framework
No
Tier II
MCA and SEBI
MCA
Ministry of Corporate Affairs
Data Availability for India
Note
Baseline Data Availability for India
Tier Classification
Publication/ Data sources
Data source
Global Indicator Framework (UN 2020a, 2020b)
Recommendations by Study Team
National Indicator Framework (MOSPI 2021, 2020a, 2020b)
Policy Relevance
India has several provisions to nudge corporates (both public and private undertakings) to take a broader approach and incorporate sustainability dimensions that include environmental, social and economic activities and responsible corporate governance. The key drivers for responsible business conduct related policy developments in India include the following:
• Guiding Principles on Business and Human Rights: Implementing the United Nations ‘Protect, Respect and Remedy’ Framework (adopted by the UN Human Rights Council through resolution17/4 in June 2011) • UN Sustainable Development Goals (SDGs) (adopted by the UN General Assembly in September 2015) • Paris Agreement on Climate Change (reached by the UNFCCC in December 2015) • Core Conventions 138 and 182 on Child Labour by the International Labour Organization (ILO) (ratified by India in June 2017)
73SUPPORTING INDIA ON SDG 12 MONITORING AND REPORTINGA Critical Appraisal
• Business Responsibility and Sustainability Reporting (BRSR) requirements: The National Guidelines on Responsible Business Conduct (NGRBC) form the basis of sustainability reporting by businesses in India (MCA 2019a). As of 2019, the board of SEBI approved a proposal to extend the applicability of the 2015 regulation to 1000 listed companies. • Companies’ Act 2013: Notified in the Gazette of India on 30 August 2013, Section 135 of the Companies Act 2013 requires companies to undertake Corporate Social Responsibility (CSR) initiatives. • Proliferation of international reporting frameworks, standards and principles: These include the Global Reporting Initiative (GRI), Carbon Disclosure Project (CDP), International Organization for Standardization, UN Global Compact (UNGC) Ten Principles and UN Guiding Principles on Business and Human Rights.
In 2013, India changed its Companies Act to introduce Section 135, which requires companies to establish a Corporate Social Responsibility (CSR) cell, spend two per cent of profits on these policies and report on these activities. Companies are recommended to focus their CSR activities on eradicating poverty, hunger and malnutrition, improving education, promoting gender equality and female empowerment, as well as environmental sustainability. In addition, the top 1000 listed companies (by market capitalization) on the National and the Bombay Stock Exchanges are required to produce Business Responsibility Reports, which are to be included in their annual reports. The regulation by the Securities and Exchange Board of India (SEBI) in 2015 that made it mandatory for specific companies to voluntarily adopt the integrated reporting framework is a positive recent development that should encourage the disclosure of non-financial information alongside financial information. According to the latest memorandum by SEBI, the regulatory body has sought approval of the Board for amending SEBI (Listing Obligations and Disclosure Requirements) Regulations, 2015 (SEBI LODR Regulations) to increase the applicability of Business Responsibility Reporting (BRR) to the top 1000 listed entities based on market capitalization from the present requirement of the top 500 listed entities (MCA 2020; SEBI 2019). The regulation requires India’s largest public companies to disclose information against a wide and diverse set of sustainability criteria – from greenhouse gas emissions and sexual harassment to stakeholder engagement. Publishing such environmental, social and economic governance (ESG) information and data in the mainstream report brings it to the attention of investors and shareholders and allows a wider, more sustainable conception of value to foster responsible investment. Listed companies are required to submit an annual report to the recognized stock exchange where it has listed its specified securities and also to publish it on the company’s website. SEBI does not maintain such information in its normal course of business. In 2020, the Report of the Committee on Business Responsibility Reporting (CBRR) suggested two formats (comprehensive and lite) for Business Responsibility and Sustainability Reporting (BRSR). The comprehensive version is for bigger companies and the lite version is for smaller companies.
The basis of sustainability reporting in the context of responsible business conduct is rooted in international developments in the sustainable development agenda and business responsibility field that occurred since the release of the National Voluntary Guidelines (NVGs) for responsible business conduct in 2011 (MCA 2019a).
74SUPPORTING INDIA ON SDG 12 MONITORING AND REPORTINGA Critical Appraisal
Conceptualization
Global Indicator Framework
‘Sustainability reports’ are defined for the purpose of this target according to the Global Indicator Framework Metadata. A ‘sustainability report’ will not be limited to stand-alone sustainability reports produced by companies, but will be considered as ‘reporting sustainability information’ and expanded to other forms of reporting sustainability information, such as publishing sustainability information as part of the company’s annual reports or reporting sustainability information to the national government. This is to ensure that the focus of the indicator is on tracking the publishing of sustainability information, rather than on the practice of publishing stand-alone sustainability reports. It also ensures that the indicator interpretation is aligned with the wording of Target 12.6, which refers to promoting ‘the integration of sustainability information into the annual reporting cycle of companies’. Not every report called ‘Sustainability Report’ will be counted towards the indicator. In order to be counted, the report will have to comply with a ‘minimum requirement’ in terms of sustainability disclosures reported, including (but not limited to) information on the company’s sustainability strategy, disclosure on greenhouse gas (GHG) emissions, energy consumption and information on occupational health and safety (UN 2019b). The minimum disclosure requirements include a core set of economic, environmental, social and governance information. On environmental parameters, these disclosure requirements include energy management, GHG emissions, water management, waste-water management, waste and hazardous materials management and air quality.
National Indicator Framework
The present national indicator 12.6.1 is ‘Proportion of companies publishing sustainability reports’. This indicator would need to further reflect the latest policy developments in India and thus needs to be suitably refined. The National Guidelines on Responsible Business Conduct (NGRBC) form the basis of sustainability reporting by businesses in India (MCA 2019a). The NGRBC is built on the National Voluntary Guidelines on Social, Environmental & Economic Responsibilities of Business, 2011 (NVGs) (MCA 2011). It defines sustainability in the context of business responsibility (Box 7.1). In the context of indicator 12.6.1, there are international (GRI-NGC-WBCSD 2019) and national frameworks (MCA 2011; MCA 2019a) that are relevant for its conceptualization.
Box 7.1: Definition of sustainability in the context of business responsibilitySustainability: The outcome achieved by balancing the social, environmental and economic impacts of business. It is the process that ensures that business goals are pursued without compromising any of the three elements.Source: MCA (2019a)

75SUPPORTING INDIA ON SDG 12 MONITORING AND REPORTINGA Critical Appraisal
The NGRBC lays down nine principles for reporting by businesses. These are depicted in Table 7.1. Apart from the nine principles that is suggested for reporting by businesses according to NGRBC and NVGs, global standards for business sustainability reporting are encouraged. Good practices and international norms and frameworks such as ISO 26000, UNGC, GRI, OECD Guidelines can be followed in as much as they help to address Indian particularities as well as national resources such as the BIS standard 16000 and PSU CSR Guidelines (MCA 2011). The Report of the Committee on Business Responsibility Reporting (CBRR) suggested two formats (comprehensive and lite) for Business Responsibility and Sustainability Reports (BRSR) and also maps SDGs with the nine NGRBC principles (MCA 2020). The Committee recommended that the implementation of the comprehensive reporting requirements should be done in a gradual and phased manner. For now the reporting has to be by the top 1000 listed companies (by market capitalisation) as applicable presently, or as prescribed by SEBI. Reporting requirement would be extended by MCA to include other companies above specified thresholds of turnover and/or paid-up capital. Smaller unlisted companies can opt to adopt a lite version of the format, on a voluntary basis. The CBRR also recommended that BRSR be integrated with the MCA21 portal.
CSR has become an integral part of business philosophy after its introduction as a statutory obligation under Section 135 of the Companies Act, 2013. Section 135 of the Act, Schedule VII and Companies (CSR) Policy Rules, 2014, provide a robust framework for companies to partner in contributing to the country’s development challenges through its managerial skills, technology and innovation. As per the Act, companies with a net worth of Rs 500 crore or more, or a turnover of Rs 1000 crore or more, or a net profit of Rs 5 crore or more in the immediately preceding financial year are required to spend 2 per cent of their average net profit of the preceding three years on CSR. The companies must disclose CSR related details in the Director’s Report in the format prescribed in the Act. The liable companies include those that are mandated to fulfil CSR obligation and can be bifurcated into companies reporting on CSR and not reporting on CSR.
Table 7.1: Nine principles of NGRBC
Source: MCA (2019a: 9)
Principle 1.
Principle 2.
Principle 3.
Principle 4.
Principle 5.
Principle 6.
Principle 7.
Principle 8.
Principle 9.
Integrity, ethics, transparency, accountability
Safe and sustainable goods and services
Well-being of employees
Respect and responsiveness to all stakeholders
Respect and promote human rights
Respect, protect and restore the environment
Responsible and transparent policy advocacy
Promote inclusive growth and equitable development
Provide value to consumer responsibly
Number Principle

76SUPPORTING INDIA ON SDG 12 MONITORING AND REPORTINGA Critical Appraisal
Figure 7.1 highlights the trend of the companies that are mandated for CSR expenditure and reporting on CSR. For the year 2014–15, 63 per cent of the companies that were liable to do CSR have reported the same to MCA. This percentage witnessed an increase to 71 per cent in 2016–17. Thereafter it declined marginally to 67 per cent in 2016–17. For the year 2017–18, a dip in the percentage has been observed, which may improve as new filings made for this year is accounted.
Despite having a comprehensive regulatory framework for Corporate Social Responsibility (CSR), the existing national indicator framework fails to incorporate CSR legislation compliance in India.
Critique
The main critique for reporting under Target 12.6 is that there is presently no ownership or mechanism to ensure compliance with SEBI (Listing Obligations and Disclosure Requirements) Regulations, 2015. There are also many international formats of sustainability reporting, which include ISO 26000, UNGC, GRI, and OECD Guidelines. In this scenario, the best approach would be to get the data from SEBI (who in turn could procure the data from NSE and BSE). Moreover, despite having a comprehensive regulatory framework for CSR, the existing national indicator framework fails to incorporate CSR legislation compliance in India.
Figure 7.1: Percentage of liable companies reporting on CSR
Source: MCA (2019b)
FY 2017-18
FY 2016-17
FY 2015-16
FY 2014-15
FY 2014-15
63
37
FY 2015-16
71
29
FY 2016-17
67
33
FY 2017-18
54
46
0% 10%
Companies liable for CSR and reporting (%)
Companies liable for CSR but not reporting (%)
Companies liable for CSR and reporting (%)
Companies liable for CSR but not reporting (%)
20% 30% 40% 50% 60% 70% 80% 90% 100%

77SUPPORTING INDIA ON SDG 12 MONITORING AND REPORTINGA Critical Appraisal
Methodology and Data
The methodology document for SDG indicator 12.6.1. (UN 2019b)23 lists the following two sources of data availability.
• NSE Info-base Corporate Social Responsibility Database • NSE Info-base Annual Reports Database
Both these data sources are paid data sources. As the SEBI has mandated the submission of Annual Business Responsibility Reports (ABBRs) by the top 1000 listed companies, one source for the indicator should be SEBI itself. SEBI can also monitor the SEBI Listing Obligations and Disclosure Requirements by collecting data from the National Stock Exchange and Bombay Stock Exchange and ensure compliance with the 2015 regulation. Additionally, as the NGRBC has been brought out by the Ministry of Corporate Affairs (MCA), a data source for the indicator in the future should also be the MCA as was identified in MOSPI (2018, 2019). The CBRR also recommended that BRSR be integrated with the MCA21 portal. Thus, MCA could also be a source of data for BRSR or BRRs.
The indicator can be the compliance rate of BRSR/ BRR and the computation of the indicator can be done by taking the average value of BRSR/ BRR compliance at BSE and NSE. The same is BRSR/ BRR submitted to NSE and BSE as a percentage of companies required to submit BRSR/ BRR to NSE and BSE (and the present requirement is the top 1000 listed companies).
The reports from the aforementioned data sources can be further categorised based on the standards followed in reporting. In India, international practices of reporting such as ISO 26000, the UNGC and the GRI are encouraged as they help to address Indian particularities as well as national resources like the Bureau of Indian Standards 16000 and Guidelines on Corporate Social Responsibility and Sustainability for Central Public Sector Enterprises (MCA 2011) (revised in 2014). According to UN (2019b), sustainability reporting can follow frameworks like UNCTAD Core indicators towards reporting on the SDGs, UNGC Principles, IIRC, GRI, and Sustainability Accounting Standards Board (SASB) Sector Specific Frameworks.
BRSR/ BRR compliance rate at NSE =
BRSR/ BRR compliance rate at NSE =
BRSR/ BRR compliance rate = Average of BRSR/BRR Compliance Rate at NSE and BRR Compliance Rate at BSE
Number of BRSRs/BRRs Submitted to NSE
Number of BRSRs/BRRs Submitted to BSE
Number of BRSRs/ BRRs to be Submitted to NSE
Number of BRSRs/ BRRs to be Submitted to BSE
23 See annex 2 of the methodology document: Global and national repositories to mine for global 12.6.1 Database available under https://environmentlive.unep.org/indicator/index/12_6_1

78SUPPORTING INDIA ON SDG 12 MONITORING AND REPORTINGA Critical Appraisal
In the context of India, the format for BRSR suggested by MCA (2020) can also be included. To begin with, India can monitor the compliance rate for the top listed companies as mandated by SEBI. This can eventually be expanded to include other listed and unlisted companies (including MSMEs).
Another indicator is the CSR reporting compliance rate. The computation of the indicator can be easily done, taking the data from the National CSR Data Portal and from the Annual Report of the Ministry of Corporate Affairs.
The data must also be reported by the Ministry of Corporate Affairs in the ‘Annual Reports on Working & Ad-ministration of Companies Act, 2013 and 1956’; moreover, it should be made available in the National CSR Data Portal. Presently, the data for 2018–19 can be collected from the report of the High Level Committee on Corporate Social Responsibility 2018.
Availability of data sources for the two indicators is suggested in Table 7.2.
Recommendations
The team suggests that the following indicators be considered for monitoring and reporting of target 12.6:
• 12.6.1: BRSR/ BRR compliance rate • 12.6.2: CSR reporting compliance rate
Data flow for the two proposed targets is suggested in Figure 7.2. The indicator can be based on BRSR/BRR submitted to NSE and BSE, which should be made available by MCA and also from SEBI.
Table 7.2: Data sources for proposed reporting on Target 12.6
CSR reporting compliance rate =Number of liable companies who are actually reporting on CSR
Number of total liable companies who are supposed to report on CSR
Source: TERI study team
1
2
BRSR/ BRR compliance rate
CSR reporting compliance rate
Ministry of Corporate Affairs and Securities
Exchange Board of India
Ministry of Corporate Affairs
Annual
Annual
# Indicator Source Periodicity

79SUPPORTING INDIA ON SDG 12 MONITORING AND REPORTINGA Critical Appraisal
At a later stage, apart from compliance on reporting, the national indicator should cover aspects linked to business practices and implementation. The use of machine learning can also be explored to go in-depth into the sustainability reports to analyse the quality and comprehensiveness of reporting in terms of implementation and coverage of all international conventions. In future, this indicator can also be expanded to cover smaller size companies including MSMEs. Reporting on certification such as Zero Defect Zero Effect (ZED) can be explored.
References
GRI-UNGC-WBCSD (Global Reporting Initiative, United Nations Global Compact and the World Business Council for Sustainable Development) (2019), SDG Compass: The Guide for Business Action on the SDGs, Version 29, GRI-UNGC-WBCSD.MCA (Ministry of Corporate Affairs) (2011), National Voluntary Guidelines on Social, Environmental and Economic Responsibilities of Business, New Delhi: MOC, Government of India.
MCA (Ministry of Corporate Affairs) (2019a), National Guidelines on Responsible Business Conduct, New Delhi: MOC, Government of India.
MCA (Ministry of Corporate Affairs) (2019b), Report of The High Level Committee on Corporate Social Responsibility 2018, New Delhi: MOC, Government of India.
MCA (Ministry of Corporate Affairs) (2020), Report of the Committee on Business Responsibility Reporting, New Delhi: MCA, Government of India.
MOSPI (Ministry of Statistics and Programme Implementation) (2018), Sustainable Development Goals: National Indicator Framework (November, 2018), New Delhi: MOSPI, Government of India.
MOSPI (Ministry of Statistics and Programme Implementation) (2019), Sustainable Development Goals National Indicator Framework Baseline Report 2015-16, New Delhi: MOSPI, Government of India.
Figure 7.2: Proposed data flow for reporting on Target 12.6
Source: TERI study team
Nodal Ministry for SDG 12(MOEFCC)
MOSPI
NITI
Ministry of Corporate Affairs
Securities Exchange Board of India (for BRSR/ BRRs)
Data sources Aggregator for Indicator 12.6.1 Monitoring and Reporting

80SUPPORTING INDIA ON SDG 12 MONITORING AND REPORTINGA Critical Appraisal
MOSPI (Ministry of Statistics and Programme Implementation) (2020a), Sustainable Development Goals: National Indicator Framework (March 2020), New Delhi: MOSPI, Government of India.
MOSPI (Ministry of Statistics and Programme Implementation) (2020b), Sustainable Development Goals National Indicator Progress Report, New Delhi: MOSPI, Government of India.
MOSPI (Ministry of Statistics and Programme Implementation) (2021), Sustainable Development Goals National Indicator Progress Report (Version 3), New Delhi: MOSPI, Government of India.
SEBI (Securities and Exchange Board of India) (2019), Extension of applicability of Business Responsibility Reporting (BRRs) to top 1000 listed entities from present requirement to 500 listed entities, based on market capitalization, Mumbai: Securities and Exchange Board of India (Proposal to the Board), URL: https://www.sebi.gov.in/sebi_data/meetingfiles/dec-2019/1576469077048_1.pdf. UN (United Nations) (2019a), Tier Classification for Global SDG Indicators (Version 26 September 2019), New York: UN.
UN (United Nations) (2019b), Methodology for Indicator 12.6.1 Number of companies publishing sustainability reports, New York: UN.
UN (United Nations) (2020a), Tier Classification for Global SDG Indicators (Version 17 April 2020), New York: UN.
UN (United Nations) (2020b), Global SDG Indicators Database, New York: UN.

81SUPPORTING INDIA ON SDG 12 MONITORING AND REPORTINGA Critical Appraisal
Target 12.7 (Sustainable Public Procurement)Snapshot of Target 12.7
Target 12.7: Promote public procurement practices that are sustainable, in accordance with national policies and priorities
Indicator
Suggested National Indicator
Indicator
12.7.1: Number of countries implementing sustainable public procurement policies and action plans
12.7.1: Degree of SPP at the national level
12.7.2: Degree of SPP at state levels
12.7.3: Degree of SPP at municipal/ city levels
12.7.4: Degree of SPP in public enterprises
12.7.1: Green public procurement policy developed and adopted by the central ministries/states/UTs (numbers)
No24
In sync with GIF but further adapted to developments in national policies
No
Tier II
Ministry of Finance (MOF)
State departments of finance (SDOF)
Municipal Council/ Corporation
Department of Public Enterprises (DPE)
Ministry of Finance
Data Availability for India
Note
Baseline Data Availability for India
Tier Classification
Publication/ Data sources
Data source
Global Indicator Framework (UN 2021, 2020a, 2020b)
Recommendations by Study Team
National Indicator Framework (MOSPI 2021, 2020a, 2020b)
24 A pilot testing was done for the methodology developed by UNEP in which 31 different countries including India took part (UNEP 2020). However , this information is not available in the public domain.

82SUPPORTING INDIA ON SDG 12 MONITORING AND REPORTINGA Critical Appraisal
Policy Relevance
Global normative frameworks feature sustainable public procurement (SPP) as one of the five initial programmes of the 10-Year Framework of Programmes (10YFP) on Sustainable Consumption and Production (SCP), a global framework of action adopted by the Rio+20 Conference to accelerate the shift towards SCP worldwide (UN 2012). SDG 12.7 promotes public procurement practices that are sustainable, in accordance with national policies and priorities. As consumers, governments are responsible for large portions of national spending that exceed 30 per cent of the gross domestic product (GDP) in many countries (UNEP 2013). In the global indicator framework, Indicator 12.7.1 is a Tier II indicator (UN 2020). A country’s SPP action plan may focus on a single aspect of sustainability, being either environmental (e.g. “Green” public procurement action plan), social (e.g. reference to human rights, fair trade, focus on employment of minorities), or economic (e.g. promotion of SMEs’ participation in tenders) (UNEP 2020).
Public procurement in India is regulated to facilitate efficiency, legitimacy, transparency, accountability, and socially just outcomes. According to the Ministry of Finance (MOF) (2018), India spends around 25 per cent of the GDP on public procurement25. The public procurement process in India is to be framed within the federal framework as constitutional arrangements across the union and state governments, autonomous and statutory bodies, public sector undertakings, panchayats, and municipalities demand a broad range of requirements for providing public services. Some union ministries such as defence, railways, and telecommunications allocate about 50 per cent of their budgets for public procurement. In addition, public sector units such as Bharat Heavy Electricals Limited (BHEL), National Thermal Power Corporation (NTPC), Public Works Department, Government E-marketplace, and Indian Oil Corporation (IOC) have a significant component of their budgets dedicated to procurement. According to the National Institute of Public Finance and Policy (NIPFP), the public procurement framework in India has four broad components namely constitutional provisions, legislative provisions, administrative guidelines, and overseers.
SPP has a potential for transformative impact as it can enable policy makers to ‘lead by example’ and drive markets and supply chains consisting of both producers and consumers (MOEF 2011; TERI-IISD 2007; TERI 2012; TERI 2013; UNEP 2013). In 2006, the National Environment Policy of the Ministry of Environment and Forests explicitly mandated the public sector to encourage adoption of purchase preference for goods and services that meet international environmental standards (MOEF 2006: 44). Some government agencies including ministries and public sector enterprises have started internalising environmental and clean energy criteria in their procurement decisions. Examples include Indian Railways, BHEL, NTPC, and IOC, who are promoting sustainable public procurement in a decentralised way in project-specific sites with a major focus on procurement of energy conserving equipment in the procurement process of small items. Some states such as Karnataka, Tamil Nadu, Andhra Pradesh, Rajasthan, Assam have their own procurement acts as well.
25 The procurement percentage is between 20 to 25 per cent. The 25 per cent of GDP for public procurement in India fixes the value of procurement at nearly USD 550 billion. This procurement is inclusive of central government ministries/ departments/subordinate offices/ autonomous bodies/ public sector undertakings/ state governments and their related bodies. The procurement is not just the expenditure of the funds allocated to the Ministries through the declaration of the budget. Public private partnerships (PPP) under various sectors like power, road and highway constructions amount to a huge volume of procurements, wherein the money is brought in by the concessionaire (the party winning the contract).
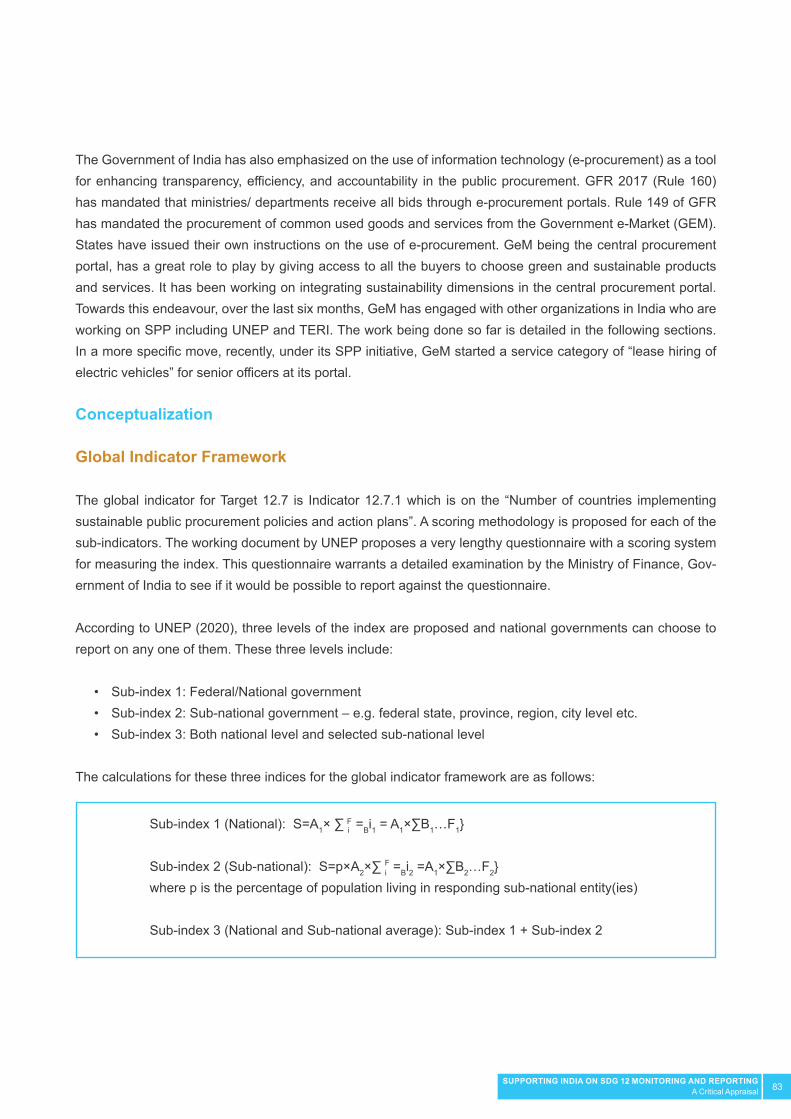
83SUPPORTING INDIA ON SDG 12 MONITORING AND REPORTINGA Critical Appraisal
The Government of India has also emphasized on the use of information technology (e-procurement) as a tool for enhancing transparency, efficiency, and accountability in the public procurement. GFR 2017 (Rule 160) has mandated that ministries/ departments receive all bids through e-procurement portals. Rule 149 of GFR has mandated the procurement of common used goods and services from the Government e-Market (GEM). States have issued their own instructions on the use of e-procurement. GeM being the central procurement portal, has a great role to play by giving access to all the buyers to choose green and sustainable products and services. It has been working on integrating sustainability dimensions in the central procurement portal. Towards this endeavour, over the last six months, GeM has engaged with other organizations in India who are working on SPP including UNEP and TERI. The work being done so far is detailed in the following sections. In a more specific move, recently, under its SPP initiative, GeM started a service category of “lease hiring of electric vehicles” for senior officers at its portal.
Conceptualization
Global Indicator Framework
The global indicator for Target 12.7 is Indicator 12.7.1 which is on the “Number of countries implementing sustainable public procurement policies and action plans”. A scoring methodology is proposed for each of the sub-indicators. The working document by UNEP proposes a very lengthy questionnaire with a scoring system for measuring the index. This questionnaire warrants a detailed examination by the Ministry of Finance, Gov-ernment of India to see if it would be possible to report against the questionnaire.
According to UNEP (2020), three levels of the index are proposed and national governments can choose to report on any one of them. These three levels include:
• Sub-index 1: Federal/National government • Sub-index 2: Sub-national government – e.g. federal state, province, region, city level etc. • Sub-index 3: Both national level and selected sub-national level
The calculations for these three indices for the global indicator framework are as follows:
Sub-index 1 (National): S=A1× ∑ i =Bi1 = A1×∑B1…F1}
Sub-index 2 (Sub-national): S=p×A2×∑ i =Bi2 =A1×∑B2…F2}where p is the percentage of population living in responding sub-national entity(ies)
Sub-index 3 (National and Sub-national average): Sub-index 1 + Sub-index 2
F
F
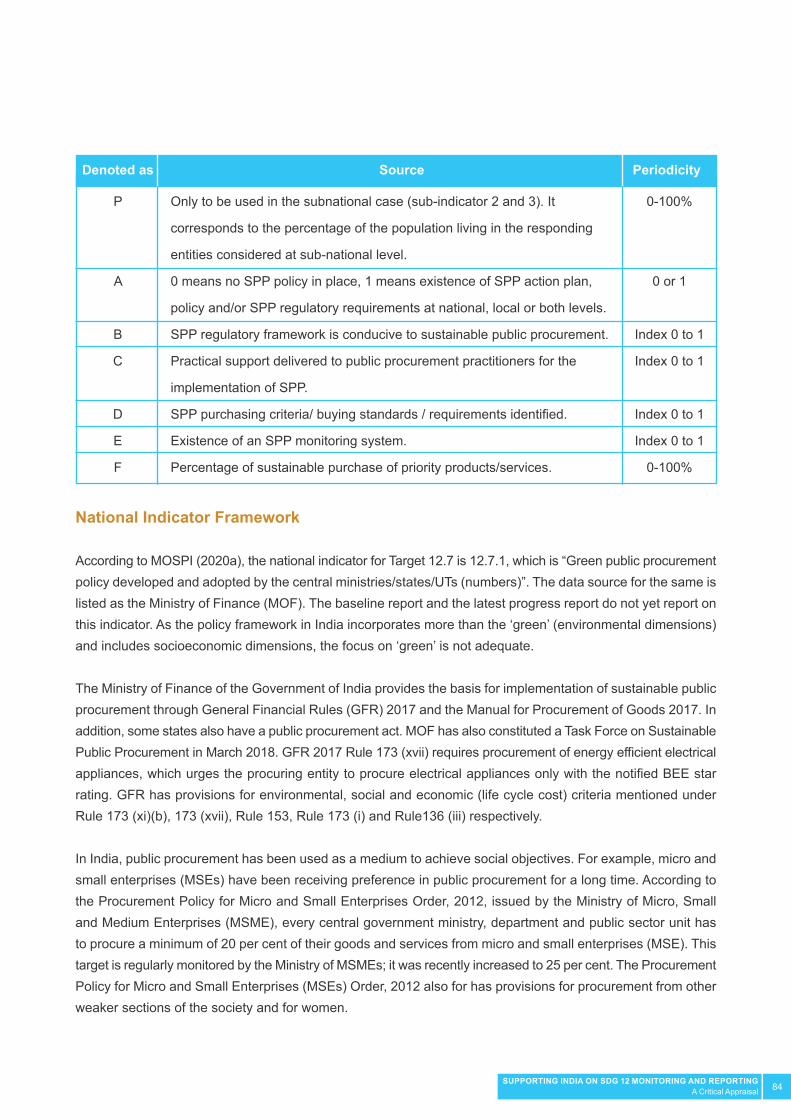
84SUPPORTING INDIA ON SDG 12 MONITORING AND REPORTINGA Critical Appraisal
National Indicator Framework
According to MOSPI (2020a), the national indicator for Target 12.7 is 12.7.1, which is “Green public procurement policy developed and adopted by the central ministries/states/UTs (numbers)”. The data source for the same is listed as the Ministry of Finance (MOF). The baseline report and the latest progress report do not yet report on this indicator. As the policy framework in India incorporates more than the ‘green’ (environmental dimensions) and includes socioeconomic dimensions, the focus on ‘green’ is not adequate.
The Ministry of Finance of the Government of India provides the basis for implementation of sustainable public procurement through General Financial Rules (GFR) 2017 and the Manual for Procurement of Goods 2017. In addition, some states also have a public procurement act. MOF has also constituted a Task Force on Sustainable Public Procurement in March 2018. GFR 2017 Rule 173 (xvii) requires procurement of energy efficient electrical appliances, which urges the procuring entity to procure electrical appliances only with the notified BEE star rating. GFR has provisions for environmental, social and economic (life cycle cost) criteria mentioned under Rule 173 (xi)(b), 173 (xvii), Rule 153, Rule 173 (i) and Rule136 (iii) respectively.
In India, public procurement has been used as a medium to achieve social objectives. For example, micro and small enterprises (MSEs) have been receiving preference in public procurement for a long time. According to the Procurement Policy for Micro and Small Enterprises Order, 2012, issued by the Ministry of Micro, Small and Medium Enterprises (MSME), every central government ministry, department and public sector unit has to procure a minimum of 20 per cent of their goods and services from micro and small enterprises (MSE). This target is regularly monitored by the Ministry of MSMEs; it was recently increased to 25 per cent. The Procurement Policy for Micro and Small Enterprises (MSEs) Order, 2012 also for has provisions for procurement from other weaker sections of the society and for women.
P
A
B
C
D
E
F
Only to be used in the subnational case (sub-indicator 2 and 3). It
corresponds to the percentage of the population living in the responding
entities considered at sub-national level.
0 means no SPP policy in place, 1 means existence of SPP action plan,
policy and/or SPP regulatory requirements at national, local or both levels.
SPP regulatory framework is conducive to sustainable public procurement.
Practical support delivered to public procurement practitioners for the
implementation of SPP.
SPP purchasing criteria/ buying standards / requirements identified.
Existence of an SPP monitoring system.
Percentage of sustainable purchase of priority products/services.
0-100%
0 or 1
Index 0 to 1
Index 0 to 1
Index 0 to 1
Index 0 to 1
0-100%
Denoted as Source Periodicity
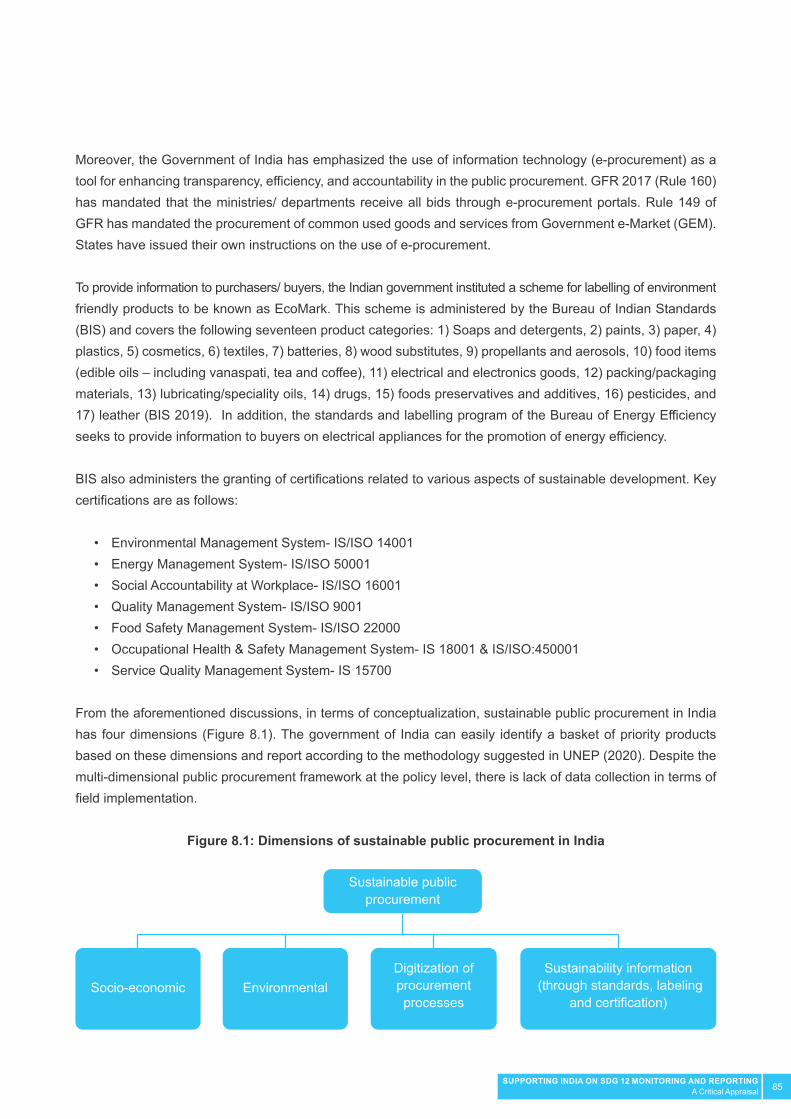
85SUPPORTING INDIA ON SDG 12 MONITORING AND REPORTINGA Critical Appraisal
Moreover, the Government of India has emphasized the use of information technology (e-procurement) as a tool for enhancing transparency, efficiency, and accountability in the public procurement. GFR 2017 (Rule 160) has mandated that the ministries/ departments receive all bids through e-procurement portals. Rule 149 of GFR has mandated the procurement of common used goods and services from Government e-Market (GEM). States have issued their own instructions on the use of e-procurement.
To provide information to purchasers/ buyers, the Indian government instituted a scheme for labelling of environment friendly products to be known as EcoMark. This scheme is administered by the Bureau of Indian Standards (BIS) and covers the following seventeen product categories: 1) Soaps and detergents, 2) paints, 3) paper, 4) plastics, 5) cosmetics, 6) textiles, 7) batteries, 8) wood substitutes, 9) propellants and aerosols, 10) food items (edible oils – including vanaspati, tea and coffee), 11) electrical and electronics goods, 12) packing/packaging materials, 13) lubricating/speciality oils, 14) drugs, 15) foods preservatives and additives, 16) pesticides, and 17) leather (BIS 2019). In addition, the standards and labelling program of the Bureau of Energy Efficiency seeks to provide information to buyers on electrical appliances for the promotion of energy efficiency.
BIS also administers the granting of certifications related to various aspects of sustainable development. Key certifications are as follows:
• Environmental Management System- IS/ISO 14001 • Energy Management System- IS/ISO 50001 • Social Accountability at Workplace- IS/ISO 16001 • Quality Management System- IS/ISO 9001 • Food Safety Management System- IS/ISO 22000 • Occupational Health & Safety Management System- IS 18001 & IS/ISO:450001 • Service Quality Management System- IS 15700
From the aforementioned discussions, in terms of conceptualization, sustainable public procurement in India has four dimensions (Figure 8.1). The government of India can easily identify a basket of priority products based on these dimensions and report according to the methodology suggested in UNEP (2020). Despite the multi-dimensional public procurement framework at the policy level, there is lack of data collection in terms of field implementation.
Figure 8.1: Dimensions of sustainable public procurement in India
Sustainable public procurement
Socio-economicDigitization of procurement processes
EnvironmentalSustainability information
(through standards, labeling and certification)

86SUPPORTING INDIA ON SDG 12 MONITORING AND REPORTINGA Critical Appraisal
In terms of levels or units of reporting, the following can be considered: national level reporting, state level reporting, municipal/ city26 level reporting, and public enterprises. All these levels are important from the point of view of products and services procured.
Critique
The proposed indicator by UNEP (2020) is comprehensive. For developing countries like India who have prioritized social outcomes, product categories can be considered accordingly. The present national indicator in MOSPI (2020a) does not adequately capture the aspects related to implementation of the policies. Having a policy is a necessary but not a sufficient condition for ensuring implementation. Both UNEP (2020) and MOSPI (2020a) does not consider organizations as units. In India, public sector units are an important player for SPP and need to be considered.
Methodology and Data
From a desktop review, apart from policy documents, there is no availability of quantitative information. The national indicators for India should be reported at four levels: national, state, municipal/city levels, and public enterprises. The formula is as follows.
where,
12.7.1: Degree of SPP at the national level: Sn= An×∑{Bn+Cn+Dn+En+Fn}
An = SPP related policy in place at the national level
Bn = SPP regulatory framework is conducive to sustainable public procurement at the national level
Cn = Practical support delivered to public procurement practitioners for the implementation of SPP at the national level
Dn = SPP purchasing criteria/ buying standards / requirements identified at the national level
En = Existence of an SPP monitoring system at the national level
Fn = Percentage of sustainable purchase of priority products/services at the national level
12.7.3: Degree of SPP at municipal/ city levels: Sm= Am×∑{Bm+Cm+Dm+Em+Fm}
12.7.2: Degree of SPP at state levels: Ss= Ass × ∑{Bs+Cs+Ds+Es+Fs}
12.7.4: Degree of SPP in public enterprises: Sp= Ap×∑{Bp+Cp+Dp+Ep+Fp}
26 Municipal corporation/ councils

87SUPPORTING INDIA ON SDG 12 MONITORING AND REPORTINGA Critical Appraisal
Data from various sources on the various parameters at the three levels is suggested in Table 8.1.
As = SPP related policy in place at the state level
Bs = SPP regulatory framework is conducive to sustainable public procurement at the state level
Cs = Practical support delivered to public procurement practitioners for the implementation of SPP at the state level
Ds = SPP purchasing criteria/ buying standards / requirements identified at the state level
Es = Existence of an SPP monitoring system at the state level
Fs = Percentage of sustainable purchase of priority products/services at the state level
Am = SPP related policy in place at the municipal/ city level
Bm = SPP regulatory framework is conducive to sustainable public procurement at the municipal/ city level
Cm = Practical support delivered to public procurement practitioners for the implementation of SPP at the municipal/ city level
Dm = SPP purchasing criteria/ buying standards / requirements identified at the municipal/ city level
Em = Existence of an SPP monitoring system at the municipal/ city level
Fm = Percentage of sustainable purchase of priority products/services at the municipal/ city level
Ap = SPP related policy in place in public enterprises
Bp = SPP regulatory framework is conducive to sustainable public procurement in public enterprises
Cp = Practical support delivered to public procurement practitioners for the implementation of SPP in public enterprises
Dp = SPP purchasing criteria/ buying standards / requirements identified in public enterprises
Ep = Existence of an SPP monitoring system in public enterprises
Fp = Percentage of sustainable purchase of priority products/services in public enterprises

88SUPPORTING INDIA ON SDG 12 MONITORING AND REPORTINGA Critical Appraisal
Recommendations
From the analysis, the team recommends that India can easily report on the global indicator while fulfilling dimensions of socio-economic, environmental and transparency that are embedded in the national policy framework. In addition to MOF, line ministries, state departments of finance, DPE, MOMSME, DPE, MOEFCC and BIS will be crucial agencies. 2015–2016 can be taken as the base year as suggested by MOSPI (2019) and progress can be monitored accordingly. Hence the existing national indicator in MOSPI (2020a) can be replaced with the following:
12.7.1: Degree of SPP at the national level 12.7.2: Degree of SPP at state levels 12.7.3: Degree of SPP at municipal/ city levels 12.7.4: Degree of SPP in public enterprises
Reporting can be done at four levels: national, state, municipal/city levels, and public enterprises. These are all crucial as these levels have their own procurement systems. A reporting framework is suggested in Figure 8.2.
A
B
C
D
E
F
SPP related policy in place
SPP regulatory framework is conducive to sustainable public procurement.
Practical support delivered to public procurement practitioners for the implementation of SPP.
SPP purchasing criteria/ buying standards / requirementsidentified.
Existence of an SPP monitoring system.
Percentage of sustainable purchase of priority products/services.
MOF
MOF
MOFCPPPGEM
MOFBIS
MOF
MOFMOMSMEMOEFCC
Municipal Council/ Corporation
Municipal Council/ Corporation
Municipal Council/ Corporation
Municipal Council/ Corporation
Municipal Council/ Corporation
Municipal Council/ Corporation
DPE
DPE
DPE
DPE
DPE
DPE
SDOF
SDOF
SDOF
SDOF
SDOF
SDOF
Annual
Annual
Annual
Annual
Annual
Annual
Annual
Annual
Annual
Annual
Annual
Annual
Annual
Annual
Annual
Annual
Annual
Annual
Annual
Annual
Annual
Annual
Annual
Annual
Table 8.1: Data sources for Target 12.7
# ParameterSource SourceSourceSourcePeriodicity Periodicity PeriodicityPeriodicity
National level PSUsMunicipal/ cityState level

89SUPPORTING INDIA ON SDG 12 MONITORING AND REPORTINGA Critical Appraisal
At the national level, reporting can be undertaken by line ministries; they can be asked to report on SPP measures and these can be aggregated. Reporting on policies and initiatives may not be sufficient and, in future, there is a need to further understand impacts related to SPP. For this, data systems and research can be strengthened on the impacts of SPP on environmental quality, socio-economic dimensions and on markets for new products.
References
BIS (Bureau of Indian Standards) (2019), Ecomark Scheme, Delhi: BIS.
MOEF (Ministry of Environment and Forests) (2006), National Environment Policy 2006, New Delhi: MOEF, Government of India.
MOEF (Ministry of Environment and Forests) (2011), Sustainable Development in India: Stocktaking in the Run up to Rio+20 (undertaken by The Energy and Resources Institute), New Delhi: MOEF, Government of India.
MOF (Ministry of Finance) (2018), “Minutes of the 1st Meeting of Task Force on Sustainable Public Procurement (SPP)”, Office Memorandum, New Delhi: MOR, Government of India.
MOSPI (Ministry of Statistics and Programme Implementation) (2018), Sustainable Development Goals: National Indicator Framework (November, 2018), New Delhi: MOSPI, Government of India.
MOSPI (Ministry of Statistics and Programme Implementation) (2019), Sustainable Development Goals National Indicator Framework Baseline Report 2015-16, New Delhi: MOSPI, Government of India.
Figure 8.2: Proposed data flow for reporting on Target 12.7
Source: TERI study team
Ministry of Finance
State Departments of Finance
Municipal Council/ Corporation
Ministry of Finance
Line ministriesBISMOMSMEMOEFCC
State level line departments
Municipaities
DPE
MOSPI
NITI
Ministry of Environment Forest and Climate Change
(nodal ministry for SDG 12)
12.7.1
12.7.2
12.7.3
12.7.4
Data sourcesIndicator Sub-aggregator Aggregator for Indicator 12.7.1
Monitoring and Reporting

90SUPPORTING INDIA ON SDG 12 MONITORING AND REPORTINGA Critical Appraisal
MOSPI (Ministry of Statistics and Programme Implementation) (2020a), Sustainable Development Goals: National Indicator Framework (March 2020), New Delhi: MOSPI, Government of India.
MOSPI (Ministry of Statistics and Programme Implementation) (2020b), Sustainable Development Goals Progress Report, New Delhi: MOSPI, Government of India.
MOSPI (Ministry of Statistics and Programme Implementation) (2021), Sustainable Development Goals National Indicator Progress Report (Version 3), New Delhi: MOSPI, Government of India.
TERI (The Energy and Resources Institute) (2012), Public Procurement Policy in India and Competition Issues, New Delhi: TERI Press.
TERI (The Energy and Resources Institute) (2013), Engagement with Sustainability Concerns in Public Procurement in India: Why and How, New Delhi: TERI.
TERI-IISD (The Energy and Resources Institute and International Institute for Sustainable Development) (2007), State of Play in Sustainable Public Procurement, New Delhi and Manitoba: TERI and IISD.
UN (United Nations) (2012), Future We Want: Outcome Document of the United Nations Conference on Sustainable Development, New York: UN.
UN (United Nations) (2020a), Tier Classification for Global SDG Indicators (Version 17 April 2020), New York: UN.
UN (United Nations) (2020b), Global SDG Indicators Database, New York: UN.
UN (United Nations) (2021), Tier Classification for Global SDG Indicators (Version 29 March 2021), New York: UN.
UNEP (United Nations Environment Programme) (2013), Sustainable Public Procurement: A Global Review, Nairobi: UNEP.
UNEP (United Nations Environment Programme) (2020), SPP Index Methodology: SDG indicator 12.7.1 (Version 4.0 - 15 November 2019 March 2020), Nairobi: UNEP.

91SUPPORTING INDIA ON SDG 12 MONITORING AND REPORTINGA Critical Appraisal
Target 12.8 (Awareness and Education on Sustainable Development and Lifestyles)Snapshot of Target 12.8
Target 12.8: By 2030, ensure that people everywhere have the relevant information and awareness for sustainable development and lifestyles in harmony with nature
Indicator
Suggested National Indicator
Indicator
12.8.1 Extent to which (i) global citizenship education and (ii) education for sustainable development are mainstreamed in (a) national education policies; (b) curricula; (c) teacher education; and (d) student assessment
12.8.1: Extent to which (i) global citizenship education and (ii) education for sustainable development are mainstreamed in (a) national and state education policies; (b) curricula; (c) teacher education; and (d) student assessment
12.8.2: Expenditure on awareness activities for sustainable development and lifestyles by the Ministry of Information and Broadcasting and Ministry of Environment, Forest and Climate Change
12.8.1 Extent to which (i) global citizenship education and (ii) education for sustainable development are mainstreamed in (a) national education policies; (b) curricula; (c) teacher education; and (d) student assessment
No
The proposed indicator is in sync with the global indicator framework
Yes (for 2020)
Tier II
MHRD
State education departments
Department of School Education and Literacy, Ministry of Education
Data Availability for India
Note
Baseline Data Availability for India
Tier Classification
Data source/ publication
Data source
Global Indicator Framework (UN 2021, 2020a, 2020b)
Recommendations by Study Team
National Indicator Framework (MOSPI 2021, 2020a, 2020b)

92SUPPORTING INDIA ON SDG 12 MONITORING AND REPORTINGA Critical Appraisal
Policy Relevance
In India, the Ministry of Human Resource Development (MHRD) is the key ministry in charge of education policies, curricula, teacher education and student assessment. So far, education policy in India has focused on access, affordability and the right to education. According to the National Policy on Education of 1986, the national system of education will be based on a national curricular framework that includes subjects related to the history of India’s freedom movement, constitutional obligations and content to nurture national identity. The policy specifically refers to the curricular containing provisions for the protection of the environment. The latest National Education Policy 2020 of India explicitly refers to alignment with the global sustainable development goals and specifically refers to SDG 4. Apart from these, government agencies also have awareness raising activities focusing on information, education and communication (IEC) related activities for which formal budget allocations have been made. The Ministry of Information and Broadcasting (MIB) is a key agency that represents the face of the government in reaching out to the masses.
Conceptualization
Global Indicator Framework
There is no agreed global methodology for indicator 12.8.1 and the methodology is currently under development by the United Nations. The working document for the indicator suggests a questionnaire based approach but does not yet list the parameters (UN 2019b). Definitional aspects for the indicator are however clearly established by United Nations Educational, Scientific and Cultural Organization (UNESCO). According to UNESCO (2019), Global Citizenship Education (GCED) is the ‘education which empowers learners of all ages to assume active roles, both locally and globally, in building more peaceful, tolerant, inclusive and secure societies. It can be summarised as “learning to live together”’. Education for sustainable development includes ‘education that empowers learners to take informed decisions and responsible actions for environmental integrity, economic viability and a just society for present and future generations. It can be summarised as “learning to live sustainably”’ (UNESCO 2019). Climate change education is ‘education to help people, in particular youth, understand, address, mitigate, and adapt to the impacts of climate change. It encourages changes in attitudes and behaviours needed to put the world on a more sustainable development path, and build a new generation of climate change-aware citizens’ (UNESCO 2019). According to an office memorandum (MOEFCC 2019), the listed indicators for Target 12.8 (12.8.1: Develop icon on sustainable development; 12.8.2: Government to celebrate year on Sustainable development) in the past NIF document (MOSPI 2018) was listed to be deleted in keeping with further developments on global indicators.

93SUPPORTING INDIA ON SDG 12 MONITORING AND REPORTINGA Critical Appraisal
National Indicator Framework
According to MHRD (MHRD 2019a, 2019b), steps will be taken for educating teachers through qualitative changes in their education programmes. The model curriculum prepared for this, the bachelor of education programme, includes crucial aspects like gender, inclusive education, ICT, Yoga, GCED and health & sanitation. However, there are no performance indicators reported as such in the annual reports of MHRD or the Results Framework Document (RFD).
The National Education Policy 2020 (NEP 2020) envisages the ‘entire education system to be reconfigured to support and foster learning, so that all of the critical targets and goals (SDGs) of the 2030 Agenda for Sustainable Development can be achieved’ (MHRD 2020). The policy is clear about alignment with the global sustainable development goals. According to NEP 2020, the ‘vision of the Policy is to instil among the learners a deep-rooted pride in being Indian, not only in thought, but also in spirit, intellect, and deeds, as well as to develop knowledge, skills, values, and dispositions that support responsible commitment to human rights, sustainable development and living, and global well-being, thereby reflecting a truly global citizen” (emphasis added). The policy calls for measures beyond curriculum development and pedagogy and includes aspects of the entire educational ecosystem such as leadership of teachers, educational administrators, supportive organisations, resources, and sound policies. The policy is clear that pedagogical innovations alone will not succeed. The national indicator under this target has already been aligned with the global indicator. In future, indicators under this target can be reported for different levels of educations: pre-primary, primary, secondary and tertiary education (non-degree, bachelor degree, master degree, and research degree).
Target 12.8 will promote policies and practices to ‘ensure that people everywhere have the relevant information and awareness for sustainable development and lifestyles in harmony with nature’. In line with the target, the national indicator framework can evolve to include other awareness raising aspects in policies apart from formal education, for example, focusing on information, education and communication (IEC) related activities for which formal budget allocations have also been made. To supplement the existing national indicator, some indicators on activities of MIB and IEC related activities of MOEFCC can be included.
Critique
In analysing the global indicator framework, although policies or strategies are necessary, they are by no means sufficient to ensure implementation or actual outcomes in terms of sustainable development. However, in the absence of a monitoring and evaluation framework in India, the only indicator that can be reported is the policy developments. Until the time, there are monitoring and evaluation frameworks in place, state level and national level policy developments on GCED and Education for Sustainable Development (ESD) can be reported.

94SUPPORTING INDIA ON SDG 12 MONITORING AND REPORTINGA Critical Appraisal
Methodology and Data
The extent of GCED and ESD are mainstreamed in (a) education policies, frameworks or strategic objectives, (b) curricula (c) teacher education and (d) student assessment in our country. Policies can be monitored on a scoring basis based on UN (2019b) and explained in this section. The indicator is already being reported on at the national level. This exercise can be replicated at the state level. To supplement the existing national indicator, some indicators on activities of MIB and IEC related activities of MOEFCC could be included.
The proposed indicator for target 12.8 is as follows: • 12.8.1: Extent to which (i) global citizenship education and (ii) education for sustainable development are mainstreamed in (a) national and state education policies; (b) curricula; (c) teacher education; and (d) student assessment. • 12.8.2: Expenditure on awareness activities for sustainable development and lifestyles by the Ministry of Information and Broadcasting and Ministry of Environment, Forest and Climate Change.
For reporting on 12.8.1, the policy-monitoring matrix, along with data sources, is listed in Table 9.1. Data for the same can be collected by sending a questionnaire to state education departments and MHRD. Scoring can be done in accordance with Table 9.1. The highest score at both the national and state level would be 32. If there are different curriculums (example: CBSE, ICSE, State Boards), the average value can be considered.
0 = GCED and ESD are not mainstreamed or Data are not available1 = One of GCED or ESD is mainstreamed 2 = Both GCED or ESD are mainstreamed
Source: TERI study team
Table 9.1: Policy scoring matrix for proposed indicator on education under Target 12.8
1
2
3
4
1
2
3
4
Education policies, frameworks or strategic objectives
Curricula
Teacher education
Student assessment
Education policies, frameworks or strategic objectives
Curricula
Teacher education
Student assessment
MHRD
State Education Departments
#Level
National level
National level
Pre-primary
Na
Sa
Tertiary
Nc
Sc
Non-formal education
Nd
Sd
Data sourcePrimary and secondary
Nb
Sb

95SUPPORTING INDIA ON SDG 12 MONITORING AND REPORTINGA Critical Appraisal
The computation of the indicator can be as follows.
The state values are to be calculated for individual states.
For reporting on 12.8.1, information can be collected on expenditure on awareness activities related to sustainable development and lifestyles from MIB and MOEFCC. Table 9.2 depicts a reporting format.
Recommendations
The national indicator for Indicator 12.8.1 is already reported at the national level (MOSPI 2021). This can be reported at the state level too. The existing national indicator can be supplemented by indicators on awareness raising activities for sustainable development and lifestyles. The proposed indicators for reporting are as follows; Figure 9.1 shows the proposed data flow.
• 12.8.1: Extent to which (i) global citizenship education and (ii) education for sustainable development are mainstreamed in (a) national and state education policies; (b) curricula; (c) teacher education; and (d) student assessment • 12.8.2: Expenditure on awareness activities for sustainable development and lifestyles by the Ministry of Information and Broadcasting and Ministry of Environment, Forest and Climate Change
Table 9.2: Reporting format suggested for reporting on awareness and IEC related activities
Extent to which policies are mainstreamed for GCED and ESD at national level =
Extent to which policies are mainstreamed for GCED and ESD at state level =
(∑ i=1 Na+Nb+ Nc+ Nd)32
×1004
(∑ i=1 Sa+Sb+ Sc+ Sd)32
×1004
1
2
3
Expenditure on awareness activities for sustainable development and lifestyles by Ministry of Information and Broadcasting
Expenditure on awareness activities for sustainable development
Expenditure on awareness activities on for sustainable development and lifestyles by the Ministry of Environment, Forest and Climate Change
# Data Value (INR crores)
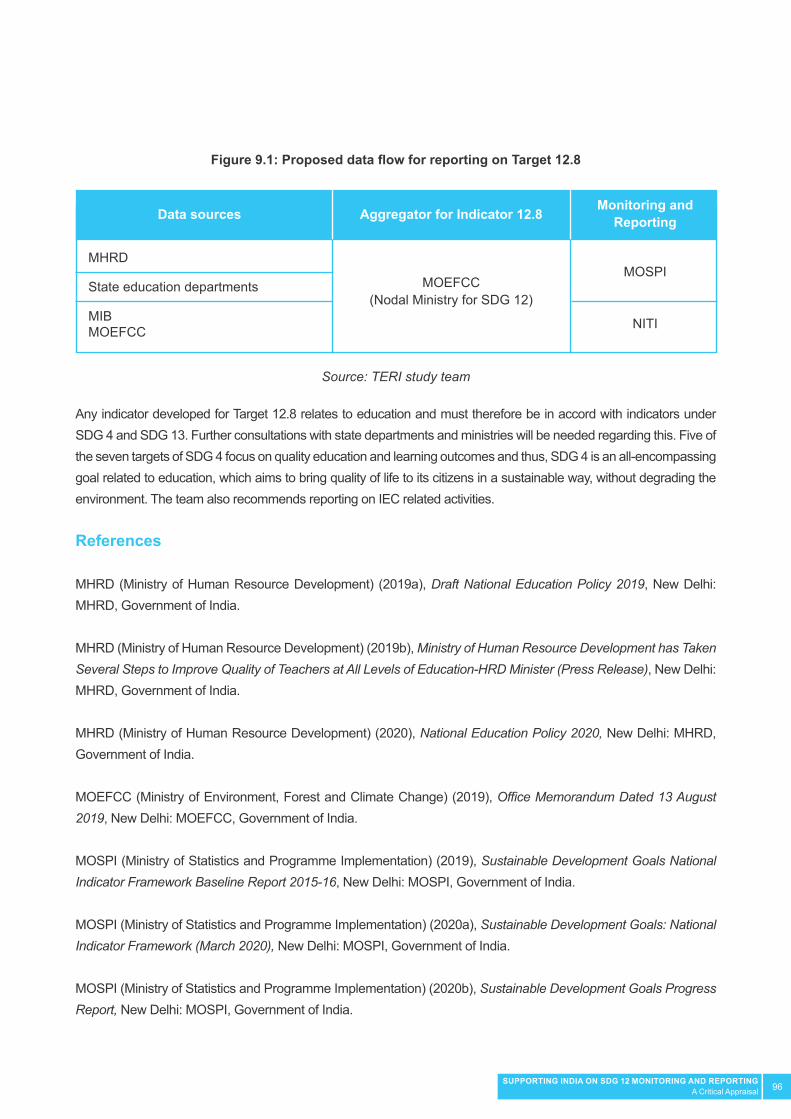
96SUPPORTING INDIA ON SDG 12 MONITORING AND REPORTINGA Critical Appraisal
Any indicator developed for Target 12.8 relates to education and must therefore be in accord with indicators under SDG 4 and SDG 13. Further consultations with state departments and ministries will be needed regarding this. Five of the seven targets of SDG 4 focus on quality education and learning outcomes and thus, SDG 4 is an all-encompassing goal related to education, which aims to bring quality of life to its citizens in a sustainable way, without degrading the environment. The team also recommends reporting on IEC related activities.
References
MHRD (Ministry of Human Resource Development) (2019a), Draft National Education Policy 2019, New Delhi: MHRD, Government of India.
MHRD (Ministry of Human Resource Development) (2019b), Ministry of Human Resource Development has Taken Several Steps to Improve Quality of Teachers at All Levels of Education-HRD Minister (Press Release), New Delhi: MHRD, Government of India.
MHRD (Ministry of Human Resource Development) (2020), National Education Policy 2020, New Delhi: MHRD, Government of India.
MOEFCC (Ministry of Environment, Forest and Climate Change) (2019), Office Memorandum Dated 13 August 2019, New Delhi: MOEFCC, Government of India.
MOSPI (Ministry of Statistics and Programme Implementation) (2019), Sustainable Development Goals National Indicator Framework Baseline Report 2015-16, New Delhi: MOSPI, Government of India.
MOSPI (Ministry of Statistics and Programme Implementation) (2020a), Sustainable Development Goals: National Indicator Framework (March 2020), New Delhi: MOSPI, Government of India.
MOSPI (Ministry of Statistics and Programme Implementation) (2020b), Sustainable Development Goals Progress Report, New Delhi: MOSPI, Government of India.
Figure 9.1: Proposed data flow for reporting on Target 12.8
Source: TERI study team
MOEFCC (Nodal Ministry for SDG 12)
MOSPI
NITI
MHRD
State education departments
MIBMOEFCC
Data sources Aggregator for Indicator 12.8 Monitoring and Reporting

97SUPPORTING INDIA ON SDG 12 MONITORING AND REPORTINGA Critical Appraisal
MOSPI (Ministry of Statistics and Programme Implementation) (2021), Sustainable Development Goals National Indicator Progress Report (Version 3), New Delhi: MOSPI, Government of India.
UN (United Nations) (2019a), Tier Classification for Global SDG Indicators (Version 20 November 2019), New York: United Nations.
UN (United Nations) (2019b), Working document for Tier III (Goal 12, Target 8, Indicator 12.8.1), New York: United Nations.
UN (United Nations) (2020a), Tier Classification for Global SDG Indicators (Version 17 April 2020), New York: UN.
UN (United Nations) (2020b), Global SDG Indicators Database, New York: UN.
UN (United Nations) (2021), Tier Classification for Global SDG Indicators (Version 29 March 2021), New York: UN.
UNESCO (United Nations Educational, Scientific and Cultural Organization) (2019), Definitions, Paris: UNESCO, URL: https://en.unesco.org/themes/gced/definition.

98SUPPORTING INDIA ON SDG 12 MONITORING AND REPORTINGA Critical Appraisal
Target 12.a (Strengthening Scientific and Technological Capacity on SCP)Snapshot of Target 12.a
Target 12.a: Support developing countries to strengthen their scientific and technological capacity to move towards more sustainable patterns of consumption and production
Indicator
Suggested National Indicator
Indicator
12.a.1 Installed renewable energy-generating capacity in developing countries (in watts per capita)
12.a.1: Amount allocated for SCP related ITEC/ SCAAP programmes of MEA
12.a.2: Value of SCP related international cooperation projects on-going at MOST
12.a.3: Union budget allocation for expenditure on SCP related research and development as a percentage of total budget
12.a.4: State budget allocation for expenditure on SCP related research and development as a percentage of total budget
12.a.1: Installed renewable energy generating capacity in the country (in watts per capita) (Similar to 7.b.1)
No
The national indicator can consider the actual support received by developing countries instead of using the global indicator which is narrow and does not actually indicate international cooperation.
Yes
Pending data availability review
Ministry of External Affairs
Ministry of Science and Technology
Union Budget, Ministry of Finance
State Budgets, State Department of Finance
MNRE
Data Availability for India
Note
Baseline Data Availability for India
Tier Classification
Data source
Data source
Global Indicator Framework UN (2021, 2020a, 2020b)
Recommendations by Study Team
National Indicator Framework (MOSPI 2021, 2020a, 2020b)
99SUPPORTING INDIA ON SDG 12 MONITORING AND REPORTINGA Critical Appraisal
Policy Relevance
Technology will play an important role in enabling application of sustainable consumption and production by improving access to information, management, tracking and logistics, transparency and accountability. Making consumption and production sustainable would mean efficient use of natural resources, minimising use of hazardous substances and reducing pollution and waste over the life cycle of products and services.
Although India is not obligated as a developing country to support others, India has actually been providing both financial and technical assistance to other developing and least developed countries through training and capacity building, sharing technical expertise, and collaborating in research and development under the framework of South–South Cooperation.
It is equally important and critical that India also receives assistance from developed nations in strengthening scientific and technological capabilities. This assistance can be classified into two parts: financial assistance and technological assistance. Measuring financial assistance can be relatively easy; however, quantifying technological assistance is a difficult proposition. India may have acquired certain technologies but this might have been purely through market mechanisms; the element of assistance may not be visible. Although the Department of Science and Technology, Ministry of Science and Technology is promoting R&D related to waste management, there is a need to further enhance R&D funding for resource efficiency (RE) and secondary raw materials (SRM).
Conceptualization
Global Indicator Framework
The global indicator under this target is “Indicator 12.a.1: Installed renewable energy-generating capacity in developing countries (in watts per capita)”, However no information is currently available under this indicator and its methodology is still under development. Moreover, there is no working document in the webpage for Tier III indicators. According to the information provided in UNSD (2020), the proposed custodian agency under this indicator is International Renewable Energy Agency (IRENA). The latest metadata document informs of the rationale behind selecting this target as data availability and the emphasis on electricity generation from renewable sources as being a high priority for countries (especially developing countries) (UNSD 2020).
According to UNCTAD, developing countries accounted for about 3 per cent of total global expenditure on research and development in the 1970s, but this increased to around 24 per cent in 2007 (UNCTAD 2019). Another commonly used indicator to monitor resources devoted to research and development worldwide is “gross domestic expenditure on research and development (GERD)”. Although there are no comparable data available on research and development support given to developing countries, a measure of the outcome of research support given to developing countries can be derived from the number of patents and intellectual property held by developing countries.
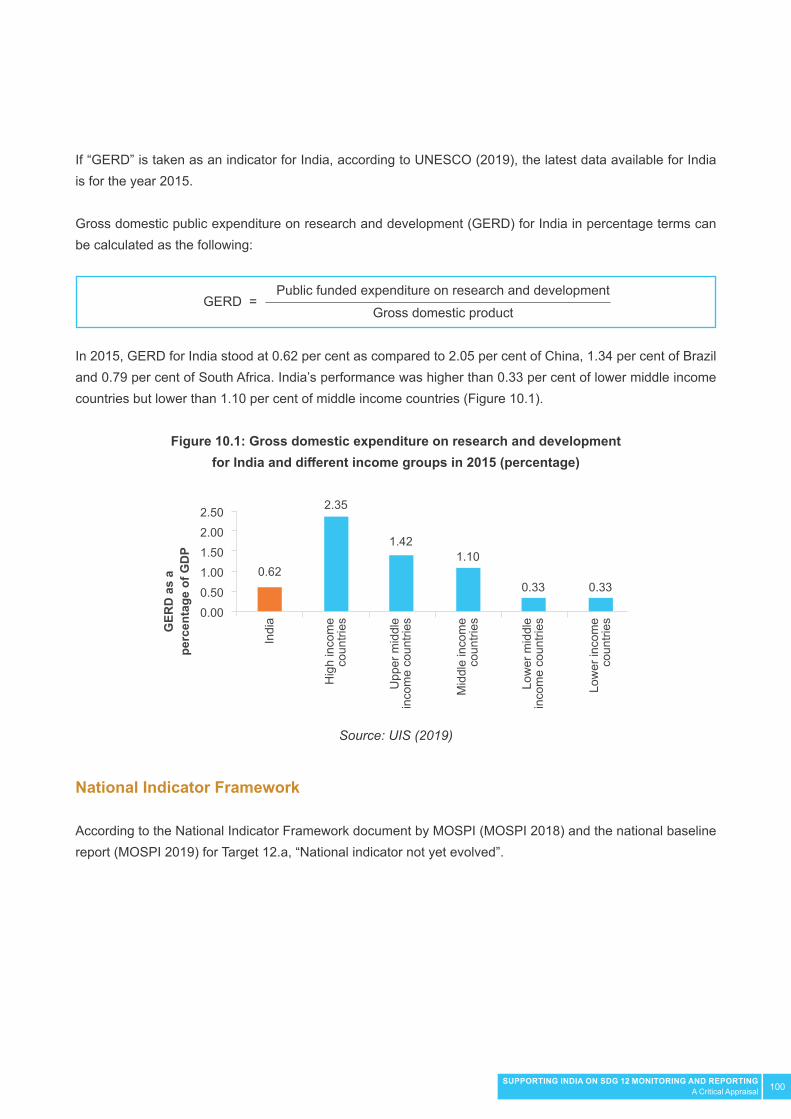
100SUPPORTING INDIA ON SDG 12 MONITORING AND REPORTINGA Critical Appraisal
If “GERD” is taken as an indicator for India, according to UNESCO (2019), the latest data available for India is for the year 2015.
Gross domestic public expenditure on research and development (GERD) for India in percentage terms can be calculated as the following:
Source: UIS (2019)
In 2015, GERD for India stood at 0.62 per cent as compared to 2.05 per cent of China, 1.34 per cent of Brazil and 0.79 per cent of South Africa. India’s performance was higher than 0.33 per cent of lower middle income countries but lower than 1.10 per cent of middle income countries (Figure 10.1).
Figure 10.1: Gross domestic expenditure on research and development for India and different income groups in 2015 (percentage)
GERD =Public funded expenditure on research and development
Gross domestic product
0.62
2.502.001.501.000.500.00
GER
D a
s a
perc
enta
ge o
f GD
P
Indi
a
Hig
h in
com
eco
untri
es
Upp
er m
iddl
ein
com
e co
untri
es
Low
er m
iddl
ein
com
e co
untri
es
Low
er in
com
eco
untri
es
Mid
dle
inco
me
coun
tries
2.35
1.421.10
0.33 0.33
National Indicator Framework
According to the National Indicator Framework document by MOSPI (MOSPI 2018) and the national baseline report (MOSPI 2019) for Target 12.a, “National indicator not yet evolved”.
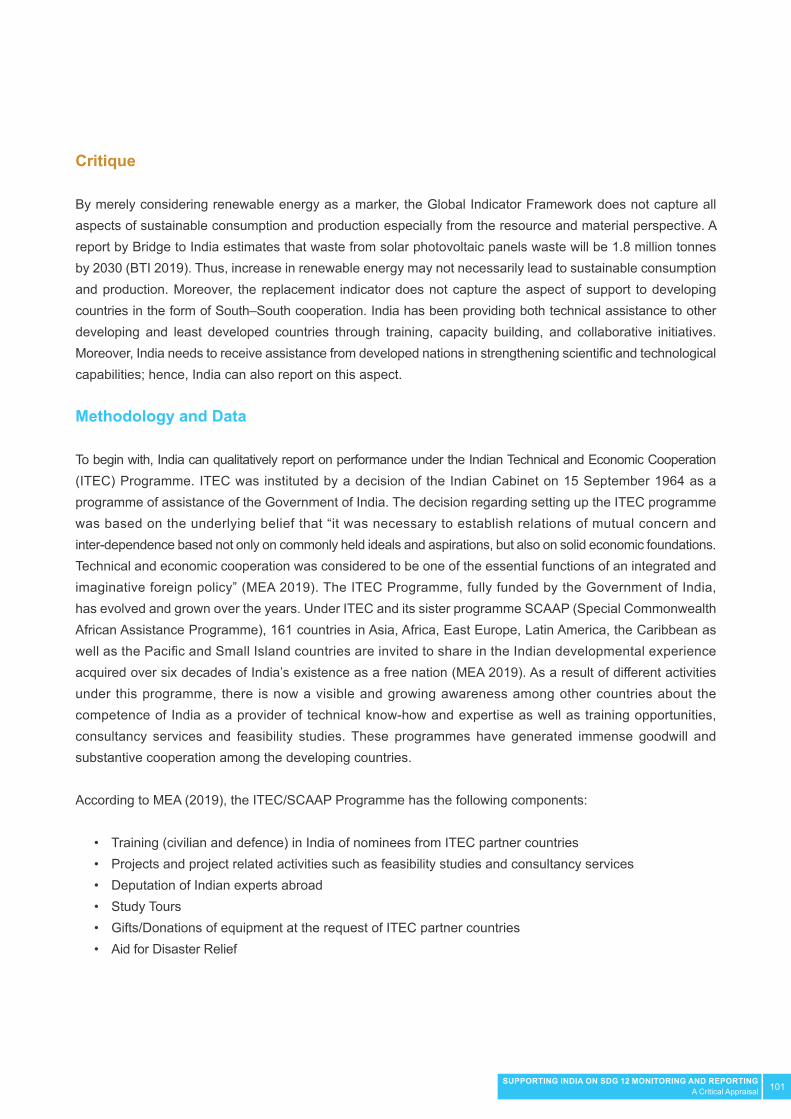
101SUPPORTING INDIA ON SDG 12 MONITORING AND REPORTINGA Critical Appraisal
Critique
By merely considering renewable energy as a marker, the Global Indicator Framework does not capture all aspects of sustainable consumption and production especially from the resource and material perspective. A report by Bridge to India estimates that waste from solar photovoltaic panels waste will be 1.8 million tonnes by 2030 (BTI 2019). Thus, increase in renewable energy may not necessarily lead to sustainable consumption and production. Moreover, the replacement indicator does not capture the aspect of support to developing countries in the form of South–South cooperation. India has been providing both technical assistance to other developing and least developed countries through training, capacity building, and collaborative initiatives. Moreover, India needs to receive assistance from developed nations in strengthening scientific and technological capabilities; hence, India can also report on this aspect.
Methodology and Data
To begin with, India can qualitatively report on performance under the Indian Technical and Economic Cooperation (ITEC) Programme. ITEC was instituted by a decision of the Indian Cabinet on 15 September 1964 as a programme of assistance of the Government of India. The decision regarding setting up the ITEC programme was based on the underlying belief that “it was necessary to establish relations of mutual concern and inter-dependence based not only on commonly held ideals and aspirations, but also on solid economic foundations. Technical and economic cooperation was considered to be one of the essential functions of an integrated and imaginative foreign policy” (MEA 2019). The ITEC Programme, fully funded by the Government of India, has evolved and grown over the years. Under ITEC and its sister programme SCAAP (Special Commonwealth African Assistance Programme), 161 countries in Asia, Africa, East Europe, Latin America, the Caribbean as well as the Pacific and Small Island countries are invited to share in the Indian developmental experience acquired over six decades of India’s existence as a free nation (MEA 2019). As a result of different activities under this programme, there is now a visible and growing awareness among other countries about the competence of India as a provider of technical know-how and expertise as well as training opportunities, consultancy services and feasibility studies. These programmes have generated immense goodwill and substantive cooperation among the developing countries.
According to MEA (2019), the ITEC/SCAAP Programme has the following components:
• Training (civilian and defence) in India of nominees from ITEC partner countries • Projects and project related activities such as feasibility studies and consultancy services • Deputation of Indian experts abroad • Study Tours • Gifts/Donations of equipment at the request of ITEC partner countries • Aid for Disaster Relief

102SUPPORTING INDIA ON SDG 12 MONITORING AND REPORTINGA Critical Appraisal
Similarly, the Science & Technology International Cooperation Division of the Department of Science and Technolo-gy under the Ministry of Science and Technology has the mandated responsibility of (i) negotiating, concluding and implementing S&T Agreements between India and other countries; (ii) providing interventions on S&T aspects in international forums (DST 2019). This responsibility is carried out by the Division in close consultation on the Indian side with the Ministry of External Affairs, Indian Missions Abroad, S&T Counsellors at Germany, Japan, Russia and USA, stakeholders in scientific, technological & academic institutions, concerned governmental agencies and with various industry associations in India. According to DST (2019), international science & technology cooperation is realized at two levels, (i) bilateral cooperation with developed and developing countries, (ii) multilateral & regional cooperation. Presently India has bilateral S&T cooperation agreements with 83 countries and active cooperation with 44 countries. During the recent years, the cooperation has strengthened significantly with Australia, Canada, EU, France, Germany, Israel, Japan, Russia, UK and USA. Cooperation with African countries has also been strengthened through the India–Africa S&T Initiative. India can qualitatively report about the performance of ITEC-SCAAP programmes and Science & Technology International Cooperation. Components of the programmes specific to the environment can be reported on.
In terms of indicators for India, India can report on the following indicators:
• 12.a.1: Amount allocated for SCP related ITEC/ SCAAP programmes of MEA • 12.a.2: Value of SCP related international cooperation projects on-going at MOST • 12.a.3: Union budget allocation for expenditure on SCP related research and development as a percentage of the total budget • 12.a.4: State budget allocation for expenditure on SCP related research and development as a percentage of the total budget
Computation can be done as follows:
12.a.1: Amount allocated for SCP related ITEC/ SCAAP programmes of MEA(Report data in INR crores)
12.a.2: Value of SCP related international cooperation projects on-going at MOST(Report data in INR crores)
12.a.3: Union budget allocation for expenditure on SCP related research and development as a percentage of total budget = ((Allocation to MHRD for research programmes + Allocation to the Ministry of Science and Technology) )/(Total Union Budget)×100
12.a.4: State budget allocation for expenditure on SCP related research and development as a percentage of total budget = ((Allocation to state education department for research programmes + Allocation to the department of science and technology) )/(Total Union Budget)× 100

103SUPPORTING INDIA ON SDG 12 MONITORING AND REPORTINGA Critical Appraisal
Recommendations
For reporting under Target 12.a, the International Cooperation Division of MOEFCC being the nodal agency can act as an aggregator.
In terms of indicators for India, India can report on the following indicators:
• 12.a.1: Amount allocated for SCP related ITEC/ SCAAP programmes of MEA • 12.a.2: Value of SCP related international cooperation projects on-going at MOST • 12.a.3: Union budget allocation for expenditure on SCP related research and development as a percentage of total budget • 12.a.4: State budget allocation for expenditure on SCP related research and development as a percentage of total budget
The data can flow from Ministry of External Affairs, Ministry of Science and Technology, and Ministry of Finance, which can then be compiled by the International Cooperation Division of MOEFCC for further transmission to MOSPI and NITI Aayog (Figure 10.2).
The data sources are listed in Table 10.1.
Table 10.1: Possible indicators and data sources for reporting under Target 12.a
Source: TERI study team
Amount allocated for SCP related ITEC/ SCAAP programme of MEA
Value of international cooperation for SCP related projects on-going at MOST
Union budget allocation for expenditure on SCP related research and development as a percentage of total budget
State budget allocation for expenditure on SCP related research and development as a percentage of total budget
Ministry of External Affairs
DST, MOST
Union Budget, Ministry of Finance
State Budgets, State Department of Finance
Annual
Annual
Annual
Annual
Data Data sources Periodicity
104SUPPORTING INDIA ON SDG 12 MONITORING AND REPORTINGA Critical Appraisal
For future, both quantity and quality aspects of collaboration of India with other developing countries needs to be evaluated. India should also voice the shortfalls of the global indicator. By merely considering renewable energy as a marker, the Global Indicator Framework does not capture the aspects of sustainable consumption and production especially from the resource and material aspect. The aspect of waste from solar photovoltaic panels needs to be considered and mere increase in renewable energy may not necessarily lead to sustainable consumption and production. Moreover, the replacement indicator does not capture the aspect of support to developing countries in the form of South-South cooperation.
References
BTI (Bridge to India) (2019), Managing India’s PV Module Waste, Gurugram: Bridge to India.
DST (Department of Science and Technology) (2019), International S&T Cooperation, New Delhi: DST, Ministry of Science and Technology, Government of India, URL: https://dst.gov.in/international-st-cooperation.
MEA (Ministry of External Affairs) (2019), About ITEC, New Delhi: MEA, Government of India, URL: https://www.itecgoi.in/about.php.
MOSPI (Ministry of Statistics and Programme Implementation) (2018), Sustainable Development Goals: National Indicator Framework (November, 2018), New Delhi: MOSPI, Government of India.
MOSPI (Ministry of Statistics and Programme Implementation) (2019), Sustainable Development Goals Na-tional Indicator Framework Baseline Report 2015-16, New Delhi: MOSPI, Government of India.
MOSPI (Ministry of Statistics and Programme Implementation) (2020a), Sustainable Development Goals: National Indicator Framework (March 2020), New Delhi: MOSPI, Government of India.
Figure 10.2: Proposed data flow for reporting on Target 12.a
Source: TERI study team
Ministry of External Affairs
Ministry of Science and Technology
Ministry of Finance
State department of finance
National
State
MOSPI
NITI
International Cooperation Division of MOEFCC
(nodal agency)
Data sources Aggregator for Indicator 12.a Monitoring and Reporting
105SUPPORTING INDIA ON SDG 12 MONITORING AND REPORTINGA Critical Appraisal
MOSPI (Ministry of Statistics and Programme Implementation) (2020b), Sustainable Development Goals Progress Report, New Delhi: MOSPI, Government of India.
MOSPI (Ministry of Statistics and Programme Implementation) (2021), Sustainable Development Goals National Indicator Progress Report (Version 3), New Delhi: MOSPI, Government of India.
UIS (UNESCO Institute for Statistics) (2019), UIS.Stat, Paris: UIS.
UN (United Nations) (2019), Tier Classification for Global SDG Indicators (Version 11 December 2019), New York: UN.
UN (United Nations) (2020a), Tier Classification for Global SDG Indicators (Version 17 April 2020), New York: UN.
UN (United Nations) (2020b), Global SDG Indicators Database, New York: UN.
UN (United Nations) (2021), Tier Classification for Global SDG Indicators (Version 29 March 2021), New York: UN.
UNCTAD (United Nations Conference on Trade and Development) (2019), Target 12.a: Scientific and Technological Capacity, Geneva: UNCTAD, URL: https://stats.unctad.org/Dgff2016/planet/goal12/target_12_a.html.
UNSD (United Nations Statistics Division) (2019), Work Plans for Tier III Indicators, New York: United Nations, URL: https://unstats.un.org/sdgs/tierIII-indicators/.
UNSD (United Nations) (2020), Indicator Narrative: Indicator Number and Name: 7.b.1, New York: UN.

106SUPPORTING INDIA ON SDG 12 MONITORING AND REPORTINGA Critical Appraisal
Target 12.b (Sustainable Tourism)Snapshot of Target 12.b
Target 12.b: Develop and implement tools to monitor sustainable development impacts for sustainable tourism that creates jobs and promotes local culture and products
Indicator
Suggested National Indicator
Indicator
12.b.1: Implementation of standard accounting tools to monitor the economic and environmental aspects of tourism sustainability
12.b.1: Sustainable tourism policy index at national and state levels
12.b.1: Number of sustainable tourism strategies orpolicies and action plans implemented with agreed monitoring and evaluation tools
Yes
This will give a better understanding of policy approach by state governments.
No(Ministry of tourism is compiling
tourism satellite accounts)
Tier I
Ministries of Tourism and MOEFCC (national)Departments of Tourism and Environment/ Forests (state level)
Ministry of Tourism
Data Availability for India
Note
Baseline Data Availability for India
Tier Classification
Data Sources
Data source
Global Indicator Framework (UN 2021, 2020a, 2020b)
Recommendations by Study Team
National Indicator Framework (MOSPI 2021, 2020a, 2020b)

107SUPPORTING INDIA ON SDG 12 MONITORING AND REPORTINGA Critical Appraisal
Policy Relevance
With regard to India, tourism sector’s capability as a sustainable and inclusive development driver, especially for livelihoods, was renewed with the 10th Five Year Plan, the National Tourism Policy, the global Incredible India campaign and the Millennium Development Goals. Tourism is one of the world’s fastest growing industries and an important source of foreign exchange and employment, while being closely linked to the social, economic, and environmental well-being of many countries, especially developing countries. It has many characteristics that make it especially valuable as an agent for development. As a cross cutting sector, it stimulates productive capacities in trade and the provision of jobs linked to the tourism value chain. In particular, it thrives on assets, such as the natural environment, a warm climate, rich cultural heritage, natural sacred sites and plentiful human resources, in which developing countries have a comparative advantage. However, tourism can also be a source of environmental damage and pollution, a heavy user of scarce resources and a cause of negative change in society. For these reasons, it is imperative for it to be well planned and managed. Table 11.1 shows existing policies in India related to this target.
Table 11.1: Existing policies in India on Target 12.b
Enabling frameworks and policies
Programmes and implementation
National Tourism Policy, 2002
Sustainable Tourism Criteria for India (STCI)
Indian Adventure Tourism Guidelines, 2018 (MOT 2018b)
Scheme for Organizing Fair & Festival and Tourism related events (DPPH)
Swadesh Darshan Scheme
Scheme of Rural Tourism
Pilgrimage Rejuvenation and Spiritual, Heritage Augmentation Drive (PRASAD) scheme
Special tourism zones; Eco-sensitive zones
Adopt a Heritage Site Scheme
Scheme for support of Public Private Partnership in Infrastructure Development (viability gap funding)
Scheme for Assistance for Large Revenue Generating Projects
Assistance to Central Agencies for Tourism Infrastructure Development
Category Initiatives

108SUPPORTING INDIA ON SDG 12 MONITORING AND REPORTINGA Critical Appraisal
Conceptualization
Global Indicator Framework
The concept of ‘sustainable tourism’ was established in the 1990s and a number of streams of work have taken place to develop the concept from both a policy and a measurement perspective. In the context of the SDGs, sustainable tourism is clearly a relevant concept and in principle seeks to consider tourism activity through the various sustainability perspectives – economy, society and the environment. The 2030 Agenda for Sustainable Development SDG target 12.b. highlights the importance of sustainable tourism that aims to ‘develop and implement tools to monitor sustainable development impacts for sustainable tourism that creates jobs and promotes local culture and products’. According to UN (2020), the replacement indicator for the global indicator is based on tourism satellite accounts that are based on the System of National Accounts 2008.
In the Rio+20 outcome document The Future We want, sustainable tourism is defined in paragraph 130 as a significant contributor ‘to the three dimensions of sustainable development’ because of its close linkages to other sectors and its ability to create decent jobs and generate trade opportunities. Therefore, Member States recognize ‘the need to support sustainable tourism activities and relevant capacity-building that promote environmental awareness, conserve and protect the environment, respect wildlife, flora, biodiversity, ecosystems and cultural diversity, and improve the welfare and livelihoods of local communities by supporting their local economies and the human and natural environment as a whole. In paragraph 130, Member States also “call for enhanced support for sustainable tourism activities and relevant capacity-building in developing countries in order to contribute to the achievement of sustainable development”.
In paragraph 131, Member States ‘encourage the promotion of investment in sustainable tourism, including eco-tourism and cultural tourism, which may include creating small and medium-sized enterprises and facilitating access to finance, including through microcredit initiatives for the poor, indigenous peoples and local communities in areas with high eco-tourism potential’. In this regard, Member States also ‘underline the importance of establishing, where necessary, appropriate guidelines and regulations in accordance with national priorities and legislation for promoting and supporting sustainable tourism’. Thus, the United Nations World Tourism Organization (UNWTO) defines Sustainable Tourism as ‘Tourism that takes full account of its current and future economic, social and environmental impacts, addressing the needs of visitors, the industry, the environment and host communities’. Based on the definition of sustainable tourism, UNEP and UNWTO specify criteria for sustainable tourism (Table 11.2).
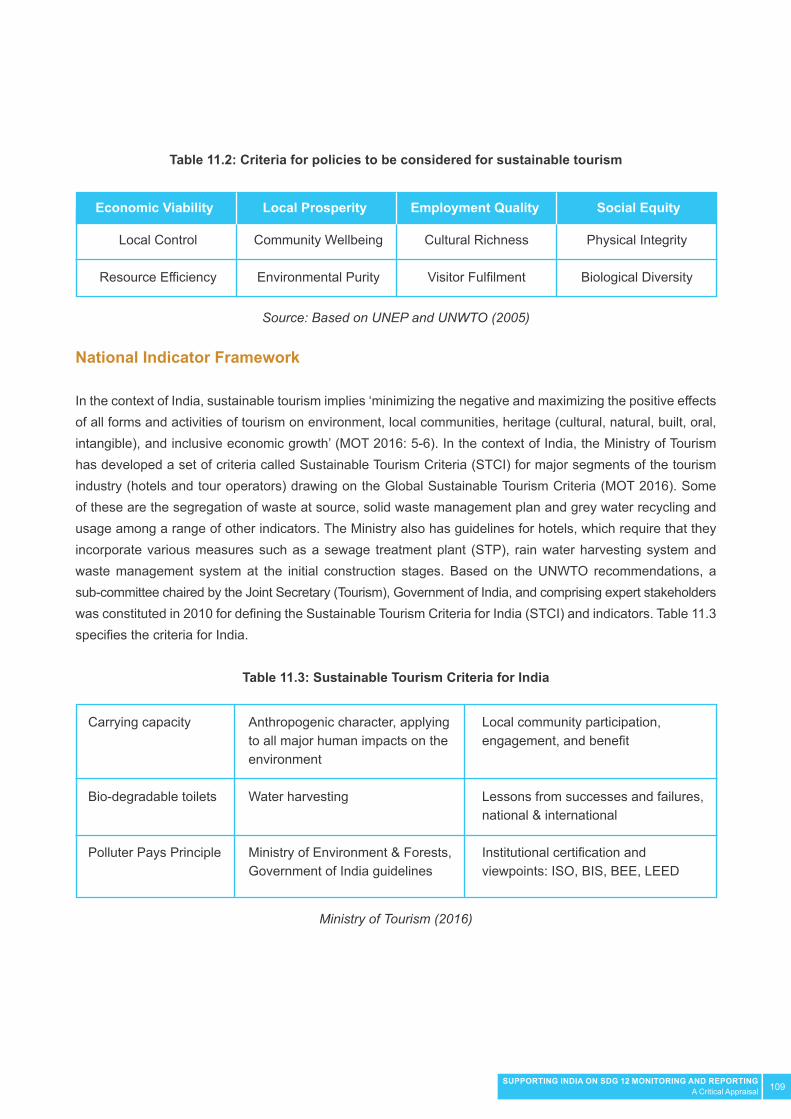
109SUPPORTING INDIA ON SDG 12 MONITORING AND REPORTINGA Critical Appraisal
Table 11.2: Criteria for policies to be considered for sustainable tourism
Source: Based on UNEP and UNWTO (2005)
Community Wellbeing
Environmental Purity
Anthropogenic character, applying to all major human impacts on the environment
Water harvesting
Ministry of Environment & Forests, Government of India guidelines
Local community participation, engagement, and benefit
Lessons from successes and failures, national & international
Institutional certification and viewpoints: ISO, BIS, BEE, LEED
Physical Integrity
Biological Diversity
Local Control
Resource Efficiency
Carrying capacity
Bio-degradable toilets
Polluter Pays Principle
Cultural Richness
Visitor Fulfilment
Economic Viability Local Prosperity Employment Quality Social Equity
National Indicator Framework
In the context of India, sustainable tourism implies ‘minimizing the negative and maximizing the positive effects of all forms and activities of tourism on environment, local communities, heritage (cultural, natural, built, oral, intangible), and inclusive economic growth’ (MOT 2016: 5-6). In the context of India, the Ministry of Tourism has developed a set of criteria called Sustainable Tourism Criteria (STCI) for major segments of the tourism industry (hotels and tour operators) drawing on the Global Sustainable Tourism Criteria (MOT 2016). Some of these are the segregation of waste at source, solid waste management plan and grey water recycling and usage among a range of other indicators. The Ministry also has guidelines for hotels, which require that they incorporate various measures such as a sewage treatment plant (STP), rain water harvesting system and waste management system at the initial construction stages. Based on the UNWTO recommendations, a sub-committee chaired by the Joint Secretary (Tourism), Government of India, and comprising expert stakeholders was constituted in 2010 for defining the Sustainable Tourism Criteria for India (STCI) and indicators. Table 11.3 specifies the criteria for India.
Table 11.3: Sustainable Tourism Criteria for India
Ministry of Tourism (2016)
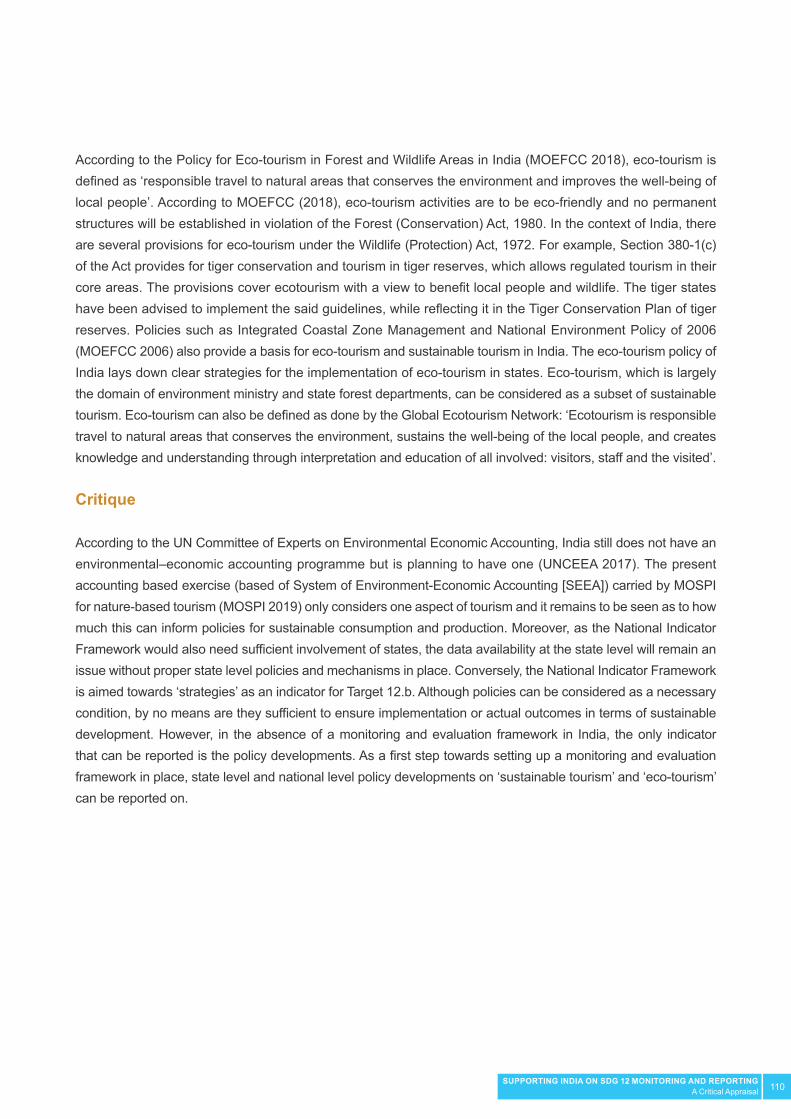
110SUPPORTING INDIA ON SDG 12 MONITORING AND REPORTINGA Critical Appraisal
According to the Policy for Eco-tourism in Forest and Wildlife Areas in India (MOEFCC 2018), eco-tourism is defined as ‘responsible travel to natural areas that conserves the environment and improves the well-being of local people’. According to MOEFCC (2018), eco-tourism activities are to be eco-friendly and no permanent structures will be established in violation of the Forest (Conservation) Act, 1980. In the context of India, there are several provisions for eco-tourism under the Wildlife (Protection) Act, 1972. For example, Section 380-1(c) of the Act provides for tiger conservation and tourism in tiger reserves, which allows regulated tourism in their core areas. The provisions cover ecotourism with a view to benefit local people and wildlife. The tiger states have been advised to implement the said guidelines, while reflecting it in the Tiger Conservation Plan of tiger reserves. Policies such as Integrated Coastal Zone Management and National Environment Policy of 2006 (MOEFCC 2006) also provide a basis for eco-tourism and sustainable tourism in India. The eco-tourism policy of India lays down clear strategies for the implementation of eco-tourism in states. Eco-tourism, which is largely the domain of environment ministry and state forest departments, can be considered as a subset of sustainable tourism. Eco-tourism can also be defined as done by the Global Ecotourism Network: ‘Ecotourism is responsible travel to natural areas that conserves the environment, sustains the well-being of the local people, and creates knowledge and understanding through interpretation and education of all involved: visitors, staff and the visited’.
Critique
According to the UN Committee of Experts on Environmental Economic Accounting, India still does not have an environmental–economic accounting programme but is planning to have one (UNCEEA 2017). The present accounting based exercise (based of System of Environment-Economic Accounting [SEEA]) carried by MOSPI for nature-based tourism (MOSPI 2019) only considers one aspect of tourism and it remains to be seen as to how much this can inform policies for sustainable consumption and production. Moreover, as the National Indicator Framework would also need sufficient involvement of states, the data availability at the state level will remain an issue without proper state level policies and mechanisms in place. Conversely, the National Indicator Framework is aimed towards ‘strategies’ as an indicator for Target 12.b. Although policies can be considered as a necessary condition, by no means are they sufficient to ensure implementation or actual outcomes in terms of sustainable development. However, in the absence of a monitoring and evaluation framework in India, the only indicator that can be reported is the policy developments. As a first step towards setting up a monitoring and evaluation framework in place, state level and national level policy developments on ‘sustainable tourism’ and ‘eco-tourism’ can be reported on.
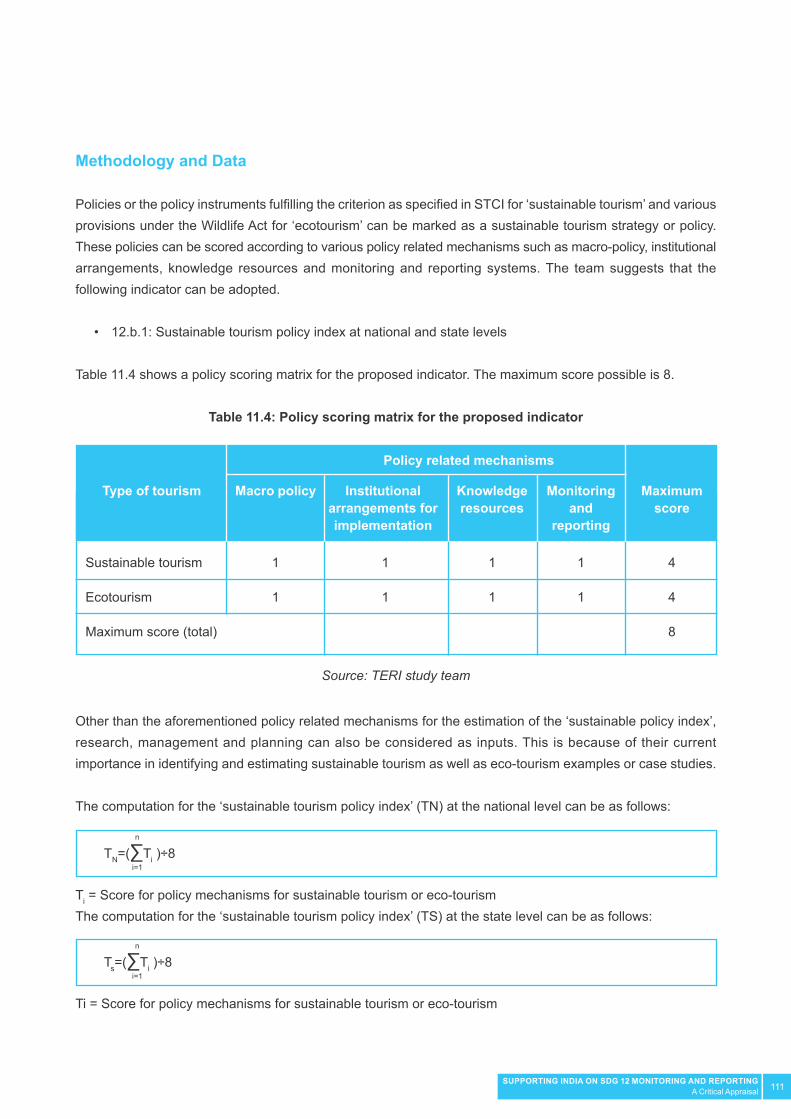
111SUPPORTING INDIA ON SDG 12 MONITORING AND REPORTINGA Critical Appraisal
Methodology and Data
Policies or the policy instruments fulfilling the criterion as specified in STCI for ‘sustainable tourism’ and various provisions under the Wildlife Act for ‘ecotourism’ can be marked as a sustainable tourism strategy or policy. These policies can be scored according to various policy related mechanisms such as macro-policy, institutional arrangements, knowledge resources and monitoring and reporting systems. The team suggests that the following indicator can be adopted.
• 12.b.1: Sustainable tourism policy index at national and state levels
Table 11.4 shows a policy scoring matrix for the proposed indicator. The maximum score possible is 8.
Table 11.4: Policy scoring matrix for the proposed indicator
Other than the aforementioned policy related mechanisms for the estimation of the ‘sustainable policy index’, research, management and planning can also be considered as inputs. This is because of their current importance in identifying and estimating sustainable tourism as well as eco-tourism examples or case studies.
The computation for the ‘sustainable tourism policy index’ (TN) at the national level can be as follows:
Ti = Score for policy mechanisms for sustainable tourism or eco-tourism The computation for the ‘sustainable tourism policy index’ (TS) at the state level can be as follows:
Ti = Score for policy mechanisms for sustainable tourism or eco-tourism
TN=(∑Ti )÷8n
i=1
Ts=(∑Ti )÷8n
i=1
Source: TERI study team
Sustainable tourism
Ecotourism
Maximum score (total)
1
1
1
1
1
1
1
1
4
4
8
Type of tourism
Policy related mechanisms
Macro policy Knowledge resources
Monitoring and
reporting
Maximum score
Institutional arrangements for implementation
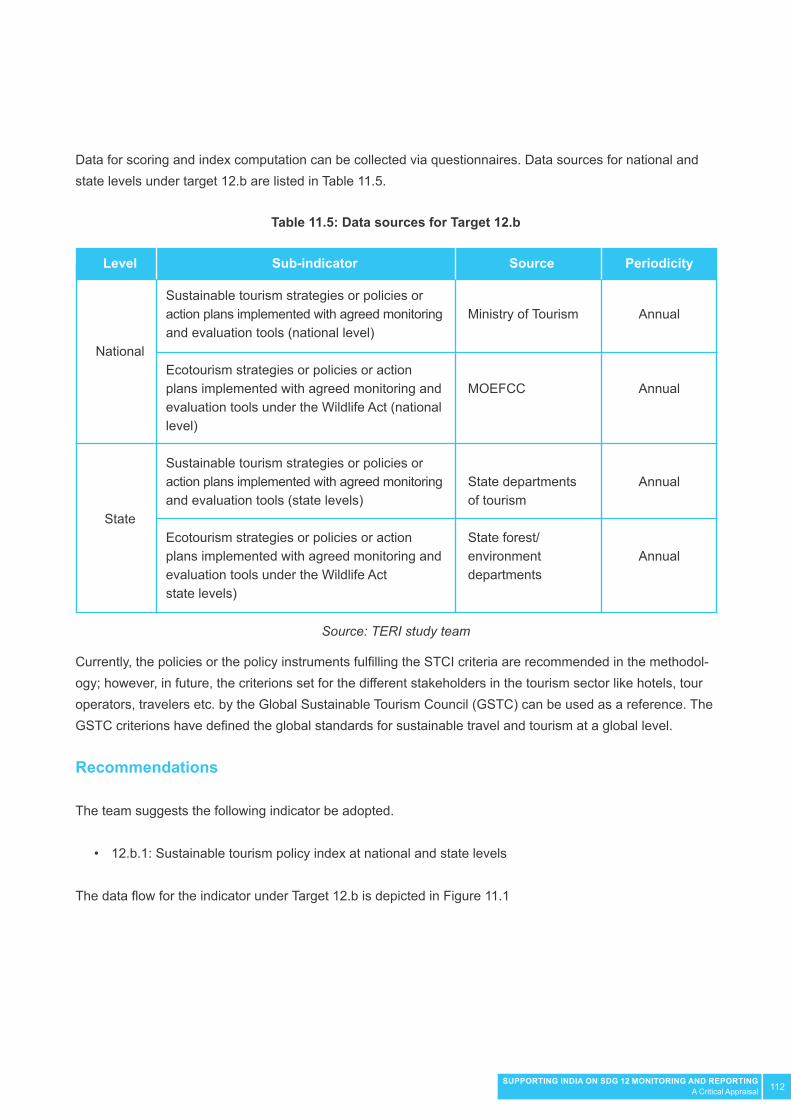
112SUPPORTING INDIA ON SDG 12 MONITORING AND REPORTINGA Critical Appraisal
Table 11.5: Data sources for Target 12.b
Source: TERI study team
Sustainable tourism strategies or policies or action plans implemented with agreed monitoring and evaluation tools (national level)
Ecotourism strategies or policies or action plans implemented with agreed monitoring and evaluation tools under the Wildlife Act (national level)
Sustainable tourism strategies or policies or action plans implemented with agreed monitoring and evaluation tools (state levels)
Ecotourism strategies or policies or action plans implemented with agreed monitoring and evaluation tools under the Wildlife Actstate levels)
National
State
Ministry of Tourism
MOEFCC
State departments of tourism
State forest/ environment departments
Annual
Annual
Annual
Annual
Level Sub-indicator Source Periodicity
Data for scoring and index computation can be collected via questionnaires. Data sources for national and state levels under target 12.b are listed in Table 11.5.
Currently, the policies or the policy instruments fulfilling the STCI criteria are recommended in the methodol-ogy; however, in future, the criterions set for the different stakeholders in the tourism sector like hotels, tour operators, travelers etc. by the Global Sustainable Tourism Council (GSTC) can be used as a reference. The GSTC criterions have defined the global standards for sustainable travel and tourism at a global level.
Recommendations
The team suggests the following indicator be adopted.
• 12.b.1: Sustainable tourism policy index at national and state levels
The data flow for the indicator under Target 12.b is depicted in Figure 11.1

113SUPPORTING INDIA ON SDG 12 MONITORING AND REPORTINGA Critical Appraisal
References
CII (Confederation of Indian Industry) (2017), Sustainable Tourism in India: Initiatives and Opportunities, New Delhi: CII
MOEFCC (Ministry of Environment Forest and Climate Change) (2006), National Environment Policy, 2006, New Delhi: MOEFCC, Government of India.
MOEFCC (Ministry of Environment Forest and Climate Change) (2018), Policy for Eco-tourism in Forest and Wildlife Areas, New Delhi: MOEFCC, Government of India.
MOSPI (Ministry of Statistics and Programme Implementation) (2019), EnviStats India 2019 (Vol.II-Environment Accounts), New Delhi: MOSPI.
MOSPI (Ministry of Statistics and Programme Implementation) (2020a), Sustainable Development Goals: National Indicator Framework (March 2020), New Delhi: MOSPI, Government of India.
MOSPI (Ministry of Statistics and Programme Implementation) (2020b), Sustainable Development Goals Progress Report, New Delhi: MOSPI, Government of India.
MOSPI (Ministry of Statistics and Programme Implementation) (2021), Sustainable Development Goals National Indicator Progress Report (Version 3), New Delhi: MOSPI, Government of India.
MOT (Ministry of Tourism) (2016), Sustainable Tourism for India: Criteria and Indicators, New Delhi: MOT
NITI Aayog (2018), Report of Working Group II: Sustainable Tourism in the Indian Himalayan Region, New Delhi: Government of India.
Figure 11.1: Proposed data flow for Indicator 12.b.1
Source: TERI study team
Ministry of Tourism
State departments of tourism
Forest division of MOEFCC
State forest departments
MOT
MOEFCC
MOSPI
NITI
MOEFCC(Nodal Ministry for
SDG 12)
Data sources Aggregator for Indicator 12.aSub-aggregator Monitoring and
Reporting

114SUPPORTING INDIA ON SDG 12 MONITORING AND REPORTINGA Critical Appraisal
UN (United Nations) (2020), Indicator Proposal Summary Template for 12.b.1, New York: UN.
UN (United Nations) (2020a), Tier Classification for Global SDG Indicators (Version 17 April 2020), New York: UN.
UN (United Nations) (2020b), Global SDG Indicators Database, New York: UN.
UN (United Nations) (2021), Tier Classification for Global SDG Indicators (Version 29 March 2021), New York: UN.
UNCEEA (UN Committee of Experts on Environmental Economic Accounting) (2017), ‘Global Assessment of Environmental-Economic Accounting’, New York: UNCEEA.
UNSD (United Nations Statistical Division) (2017), Global Metadata on Indicator 12.b.1, United States: UNSD.
UNWTO (UN World Tourism Organization) (2016), SDG Indicators for ‘Sustainable tourism’ A UNWTO contribution to the IAEG-SDG, Spain: UNWTO.
UNWTO (UN World Tourism Organization) (2016), Summary Statement from the World Tourism Organization’s (UNWTO) Committee on Statistics and Tourism Satellite Account, Spain: UNWTO.
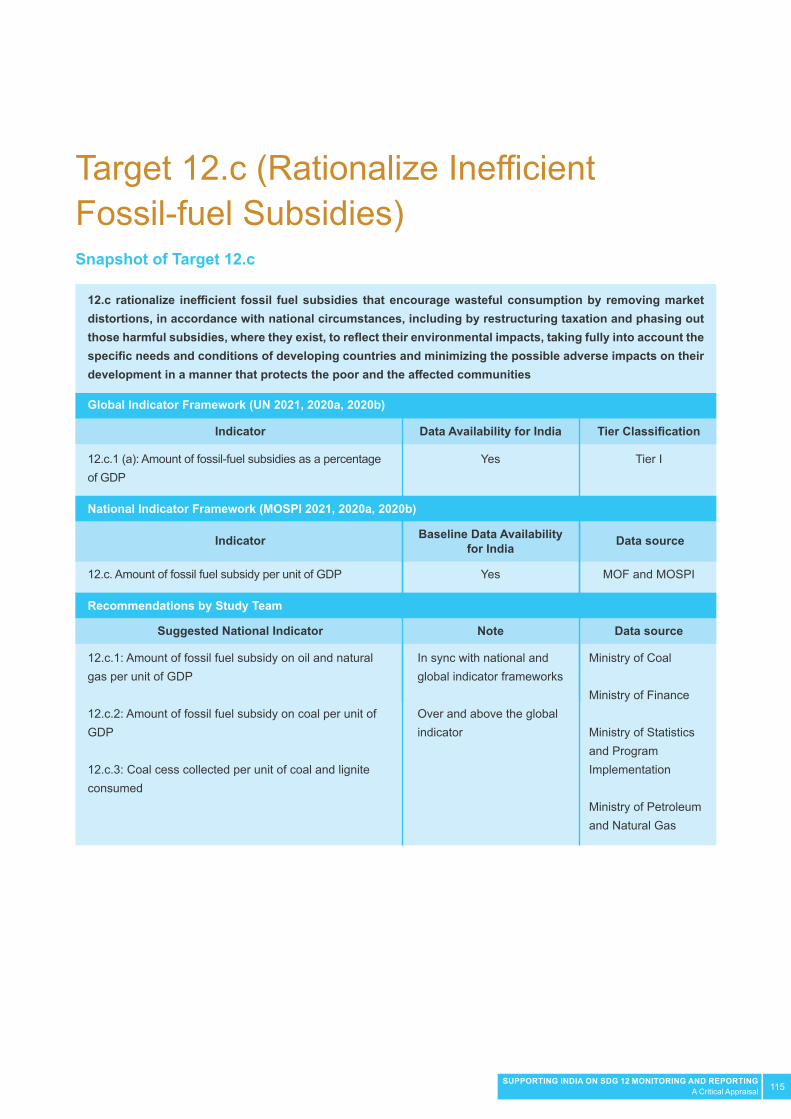
115SUPPORTING INDIA ON SDG 12 MONITORING AND REPORTINGA Critical Appraisal
Target 12.c (Rationalize Inefficient Fossil-fuel Subsidies)Snapshot of Target 12.c
12.c rationalize inefficient fossil fuel subsidies that encourage wasteful consumption by removing market distortions, in accordance with national circumstances, including by restructuring taxation and phasing out those harmful subsidies, where they exist, to reflect their environmental impacts, taking fully into account the specific needs and conditions of developing countries and minimizing the possible adverse impacts on their development in a manner that protects the poor and the affected communities
Indicator
Suggested National Indicator
Indicator
12.c.1 (a): Amount of fossil-fuel subsidies as a percentage of GDP
12.c.1: Amount of fossil fuel subsidy on oil and natural gas per unit of GDP
12.c.2: Amount of fossil fuel subsidy on coal per unit of GDP
12.c.3: Coal cess collected per unit of coal and lignite consumed
12.c. Amount of fossil fuel subsidy per unit of GDP
Yes
In sync with national and global indicator frameworks
Over and above the global indicator
Yes
Tier I
Ministry of Coal
Ministry of Finance
Ministry of Statistics and Program Implementation
Ministry of Petroleum and Natural Gas
MOF and MOSPI
Data Availability for India
Note
Baseline Data Availability for India
Tier Classification
Data source
Data source
Global Indicator Framework (UN 2021, 2020a, 2020b)
Recommendations by Study Team
National Indicator Framework (MOSPI 2021, 2020a, 2020b)
116SUPPORTING INDIA ON SDG 12 MONITORING AND REPORTINGA Critical Appraisal
Policy Relevance
Due to unequal distribution of fossil fuel resources, most countries are net importers of fossil fuels like oil and coal. Combustion of fossil fuels leads to global emissions and local pollution with significant health impacts (Garg et al. 2020; TERI 2015). Subsidies on fossil fuels may fail to reflect the true cost of a resource and may lead to over exploitation thereby leading to local and global emissions. Although fossil fuel subsidies are often advocated as a measure to fight poverty (SDG 1) and protect the poor from rising oil prices and inflation, studies however show that a large share of subsidies does not reach the poorest households. According to the latest estimates from the International Energy Agency (IEA), annual global fossil fuel subsidies was estimated at USD 120 billion in 2019 (IEA 2021). Studies show that rich households capture more benefits from fuel subsidies than the poorest households. An assessment by IMF in 2010 also revealed that across 20 developing countries, the poorest fifth of the population received on an average only 7 per cent of the overall subsidy benefit, whereas the richest fifth received almost 43 per cent (IMF 2010). According to a study on the impact of fuel subsidy reform on household welfare in developing countries, fuel subsidies are a costly approach to protecting the poor because of the substantial benefit leakage to higher income groups (Arze del Granado et al. 2012). In many cases, subsidies have failed to meet the desired objectives of benefitting the poor and marginalized from price shocks. Fossil fuel subsidies currently support both polluting fuels like kerosene, as well as cleaner fuels like liquefied petroleum gas (LPG) and electricity. WHO estimates that 4.3 million deaths annually are caused by solid fuel use for cooking (WHO, 2016). The International Energy Agency (IEA) has identified reform of fossil fuel subsidies as a key building block in their scenario to achieve the international goal of limiting global warming (IEA, 2015). Studies have also quantified benefits in terms of reduction of greenhouse emissions as a result of subsidies given for low carbon technologies (Gass et al. 2019).
The cost of fossil fuel subsidies reflect negative externalities that may not always be internalized in many countries. Energy based subsidies must be redesigned to not only benefit the poor but also contribute to SCP by incentivising resource efficiency and usage of greener and more sustainable alternatives including solar, wind and biomass, which may be available in abundance in developing and least developed countries. Further, recent technological advancements and economies of scale have reduced costs of many renewable energy technologies (e.g. solar energy) and energy generation now is much cheaper and cleaner that conventional sources. Therefore, it is pertinent, in this regard, to ensure that fossil fuel subsidy is rationalized and stream-lined so that it benefits the poor and marginalized while contributing to SDGs. Given that there may be taxes on fossil fuels, it may be important to learn whether there is cash outflow (subsidy) or cash inflow (tax) for the government. It is equally important that poor households that are particularly vulnerable to price increases obtain or retain access to energy and are elevated from a potential energy poverty trap. Any sudden withdrawal of support may also affect energy-dependent sectors of the economy. Hence, a successful reform calls for analysis and adoption of least cost mitigation measures. Along with benefits for the poor, co-benefits in terms of climate change mitigation when a share of resources are shifted into clean energy is important.
117SUPPORTING INDIA ON SDG 12 MONITORING AND REPORTINGA Critical Appraisal
In addition to subsidies, in line with the ‘polluter pays’ principle, levying taxes and cess is extremely important. The National Clean Energy Fund (later re-named as the National Clean Energy and Environment Fund, NCEEF) was announced in the Union Budget 2010–11 and was established for promoting clean energy initiatives and reducing dependence on conventional fuels. Cess is collected from coal, the proceeds of which go to the NCEEF. In 2017–18, the percentage share in terms of funds transferred to NCEEF vis-à-vis the coal cess amount collected was approximately 30 per cent (MOC 2018). However, the Goods and Services Tax (Compensation to States) Act, 2017 provides that coal cess, along with other cess on products such as pan masala, tobacco, and aerated water would constitute GST Compensation Fund and the same would be utilised to compensate the states for five years of potential losses on account of GST implementation. After five years, any amount left would be shared on a 50 per cent basis between centre and states.
Conceptualization
Global Indicator Framework
The global indicator for assessing distortions that encourage wasteful consumption has been proposed as the amount of fossil fuel subsidies per unit of GDP from both a consumption and production perspective. Improved rationalization of subsidy will get reflected in decrease in share of subsidy to GDP. In many countries, the share however may be very low and the incremental improvement might be too small to capture. The global metadata framework proposes measures of fossil fuel subsidies using three sub-indicators: 1) Direct transfer of government funds; 2) induced transfers (price support); and 3) tax expenditure, other revenue foregone, and under-pricing of goods and services. However, the metadata framework suggests the use of the third sub-indicator, tax expenditure, other revenue foregone, and under-pricing of goods and services as an optional owing to the lack of easy and transparent data availability for the all countries sub-indicator (UN 2019). The IISD team further validated with the study team that there was a good amount of data available on direct budget transfers; however, the induced transfers (price gap) was not measured and there was very little data available on tax expenditure and revenue foregone. It also proposes that the reporting countries need to take additional care if these countries aggregate across the three sub-indicators to avoid double counting; they also need to provide separate figures (if applicable) for the three sub-indicators for greater transparency.
National Indicator Framework
The indicators initially proposed under the National Indicator Framework were 12.c.1 (Subsidy per unit of fossil fuel consumption) and 12.c.2 (Tax per unit of fossil fuel consumption). However, the revised framework has updated the indicator to include only subsidy per unit of fossil fuel consumption. The study team strongly feels that the aspect of tax should be brought back in the national indicator framework as from the point of view of environmental economics, internalizing of externalities through taxes is important for correcting market distortions, which is the key objective of Target 12.c. India is the third largest consumer of primary energy in the world (after China and USA). In 2017, the total primary energy consumption was estimated at 750 million tonne of oil equivalent (MTOE), where 56 per cent of the energy came from electricity (largely coal based) and 29 per cent from oil.
118SUPPORTING INDIA ON SDG 12 MONITORING AND REPORTINGA Critical Appraisal
Although we have been largely self-sufficient with regard to coal availability till date, nearly three fourths of India’s annual oil requirement had been met through imports. For India where a significant share of the population still experiences energy poverty, the key policy challenge lies in safeguarding the interest of the millions, while creating future opportunities for cleaner fuels. In India, the prices of energy products and services have been historically determined by the government in view of socio-economic considerations (NITI 2017). Due to growing under-recoveries of the oil marketing companies, as reported by the Ministry of Petroleum and Natural Gas (MOPNG), and improving fiscal imbalances, the Government of India rationalized prices of many energy resources while introducing certain instruments to safeguard the poor.
Critique
As per the understanding arrived at based on review of the global indicator framework, review of literatures and discussion with stakeholders, Target 12.C needs to capture those subsidies that are defined by the World Trade Organization (WTO). The current national indictor framework does not mention explicitly whether the subsidy will be reported for the entire value chain or that for the consumption stage. This capacity needs to be built. The WTO recognizes four main types of subsidy mechanisms. These include (i) transfers of funds and/or liabilities (e.g. grants, credit support or paying for health, accident and environmental costs) (ii) revenue foregone (tax breaks or lower taxes than equivalent goods (iii) below-value goods or services (e.g. below-market access to government-owned energy resources, land and infrastructure) and (iv) income of price support (i.e. regulations that create transfers of financial benefits between market actors, such as fixed prices for motor fuels, feed-in tariffs or biofuel blending mandates). Moreover, the aspect of taxing fossil fuel subsidies needs to be brought back into the national indicator. In this regard, it is critical that when subsidies are assessed and reported it needs to be as holistic and comprehensible as possible to capture these four different categories wherever applicable along various stages of the production consumption value chains. Overall the team also feels, that many economic and fiscal measures can be considered for encouraging SCP. Moreover, since SCP is a cross-sectoral issue, coordination can be improved through policy measures such as green budgeting.
Methodology and Data
The following sections describe each resource and data availability in detail with estimation of subsidy for various resources.
119SUPPORTING INDIA ON SDG 12 MONITORING AND REPORTINGA Critical Appraisal
Oil and natural gas
Understanding oil subsidy in India is not easy. In the central government budget, there is allocation for energy subsidy but that may not be a true measure of subsidy as defined under the WTO. Energy commodities (petroleum products) are taxed (both at central and state levels) and yet public sector oil marketing companies (OMCs) are forced to sell at lower prices. However, with the abolishment of the administered pricing regime, where the government had control, the gap between market prices (inclusive of taxes) and the effective prices at which they are sold to consumers has come down significantly. Over the last decades, the government has been a contributor to under-recovery and burden sharing. In tandem with the increase in under-recoveries over the years, the assistance provided by the government to the oil marketing companies (OMCs) reached almost INR 1000 billion in 2012–13 (MOPNG 2016). It was in 2010, based on the recommendation and decision taken by the empowered group of ministers (EGOM), that the prices of petrol was deregulated, while other fuel prices like diesel (for non-bulk consumers) was deregulated in 2014. Domestic LPG, PDS kerosene are subsidized. Subsidized kerosene (domestic purpose) is provided through the public distribution system (PDS), a nationwide system of predominantly third-party run fair price shops or FPS (administered at the state level) through which the central and state governments distribute subsidized food, kerosene, and other commodities based on household ration card allocations. The states’ allocation of PDS kerosene are calculated by the Ministry of Petroleum and Natural Gas (MOPNG), Government of India, and released for delivery on a quarterly basis. The delivery is in co-ordination with the Department of Food and Civil Supplies within each state and union territory who is responsible for ensuring uplift of allotted quota and distribution to retailers. The concerned state government/UTs allocate the quantity of kerosene to individuals through a ration card system. However, in order to reduce the leakage and to target subsidy to the beneficiaries, the government is implementing direct benefit transfer schemes across India.
The under-recovery from diesel has also been brought to zero. With the dismantling of the administered mechanism of petrol, diesel and other petroleum products including consumption of petroleum commodities in bulk, the government has been able to garner considerable revenues to meet fiscal requirements. The central government increased excise duty on petrol and diesel almost nine times between 2014 and 2016. Since 2014, the central government collected around INR 11.9 lakh crore as taxes on petroleum products, which surpassed subsidies given out between 2004 and 2018, estimated at INR 11 lakh crores. The benefits reaped by the central government through increasing taxes on petroleum products exceeded the fuel subsidy bill of the last 15 years by over Rs 91,000 crore till 2018–19 (Dubey 2019). There are however quite a number of schemes being offered by the central and state governments that may be interpreted as subsidies along the oil production and consumption value chain. Some of the critical schemes and the stages of the production consumption value chain they offered at are presented in Table 12.1.

120SUPPORTING INDIA ON SDG 12 MONITORING AND REPORTINGA Critical Appraisal
Table 12.1: Types of support offered along different stages of the oil and gas value chains by the government
Note: Many of the categories in Table 12-1 is based on Garg et al. (2020) Source: TERI study team
Cash transfer under the DBTL scheme (including lower GST charged)
Cash transfer under DBTK scheme (including lower GST charged)
Natural gas subsidy scheme for North Eastern States
Diesel subsidy in drought and deficit rainfall affected areas
Customs duty exemption to power companies purchasing imported LNG
Oil Industry Development Board (OIDB) grants and subsidies on oil and gas
Expenditure towards ISPRL for strategic petroleum reserves
Customs duty exemption for import of specified goods required for petroleum operations
Others:• Differential taxes between Indian and foreign companies engaged in E&P• Capital Outlay on Petroleum• Income Tax exemption to foreign companies involved in storage and selling of crude oil in India• Special allowances to companies engaged in E&P• Special Allowance/Deduction for site restoration expenses• Accelerated Depreciation on specified assets for mineral oil exploration• Allowance for investment in new machinery • Allowance/incentives for investment in cross-country pipeline network for distribution and storage facilities• Allowance/Incentives for capital expenditure on research
1
2
3
4
5
6
7
8
9
Consumption
Consumption
Consumption
Consumption
Consumption
Production
Production
Production/Imports
Production/imports
# Support category Stage of the value chain
Direct benefit transfer for LPG (DBTL) consumer scheme, 2013 was launched with an objective to provide subsidy, up to the capped number of LPG cylinders to domestic LPG consumers having LPG connection, directly to their bank account on purchase of LPG (as per her/his entitlement) at market price. Under the DBTL scheme, eligible consumers can also receive a one-time cash payment provided to each existing/ new cash transfer.

121SUPPORTING INDIA ON SDG 12 MONITORING AND REPORTINGA Critical Appraisal
MOPNG has formulated a scheme for administering a subsidy related to sale of natural gas in the North East region of India. The scheme is known as the “Natural Gas Subsidy Scheme”. The participating companies currently under the scheme are Oil India Ltd and ONGC Ltd. These participating companies sell natural gas from the nominated gas fields to the consumers at the administered pricing mechanism (APM) rate decided by the government from time to time. Customers to whom gas is sold are in the power and fertilizer sectors. Allocations of supply to the customers are given as per various orders of MOPNG. Subsidy on natural gas is provided from the budgetary grant of MOPNG. Pradhan Mantri Ujjwala Yojna (PMUY) was launched on 1 May, 2016, wherein Oil Marketing Companies (OMCs) provide free LPG connections to women belonging to the below poverty line (BPL) households. Under the scheme, 5 crore BPL households would be covered over a period of 3 years. The objective of the scheme is to provide clean fuel to all poor households. The government is providing cash assistance to cover the initial cost of Rs.1600 for providing LPG connection to women belonging to BPL families. MOPNG launched the direct benefit transfer for the PDS kerosene (DBTK) scheme. The DBTK Scheme is being implemented with an objective to bring reforms in the allocation and distribution of PDS kerosene. Under the DBTK Scheme, as a part of distribution reforms, PDS kerosene is sold to the identified beneficiaries at the non-subsidized rate and the applicable subsidy is directly transferred into the bank account of the beneficiaries.
Although these are largely consumption-based subsidies, there are also production-based subsidies, which among others include Oil Industry Development Board (OIDB) grants and subsidies on oil and gas, expenditure towards ISPRL for strategic petroleum reserves, customs duty exemption for import of specified goods required for petroleum operations.
Coal
Coal is an important source of energy that helps in electricity generation thus powering the Indian economy. However, combustion of coal leads to global and local pollution. India has a total coal based electricity generation installed capacity of 54 per cent; share of electricity generation from coal is more than 70 per cent. Unlike oil, coal does not have an import parity price and hence, domestic price of coal cannot be compared and therefore, the pre-tax subsidies cannot be assessed. What can be assessed are the various incentives/implicit and/or direct subsidies that are provided along the coal value chain. The subsequent analysis of assessing subsidies in coal captures the understanding based on review of literature, opinions of subject matter experts, and information that can be used for future reporting under SDG 12.c. There are however various forms of direct and indirect subsidies enjoyed by the coal sector. Another study argues that under the GST, the tax on coal stands at 5 per cent. This is much lower than other products in the “mineral” taxation category, with the highest tax rate being 18 per cent (Soman et al. 2019). Therefore, if 18 per cent GST is used as the benchmark, then 13 per cent (18%–5%) of the value of coal consumed is revenue foregone and constitutes a tax subsidy.
It is also argued that the inherent difference in domestic and imported coal can be interpreted as a form of subsidy. For example, coal sold in India by Coal India Limited (CIL) has a lower average GCV (gross calorific value) and a higher ash content (average 34 per cent) compared with international coal: 3400–6400 kcal compared to 5,550–6,500 kcal of imported coal.

122SUPPORTING INDIA ON SDG 12 MONITORING AND REPORTINGA Critical Appraisal
On average, calorific value of domestic coal is lower by about 25 per cent. Because of lower ash content, transport cost of imported coal (for a unit of MW generated) is also cheaper by about 20–25 per cent, which might result in reducing the implicit subsidy to nil.
There are also other exemptions provided for coal exploration, production, transportation and generation of electricity. A summary of the various support provided by the government in the coal sector is presented in Table 12.2.
Table 12.2: Areas where central government is providing support to the sector
Note: Many of the categories in Table 12-2 is based on Garg et al. (2020) Source: TERI study team
Conservation and Safety in Coal Mines and Development of Transport Infrastructure under Coal Conservation and Development advisory Committee (CCDA)
Ministry of Coal’s Plan scheme of “Detailed Drilling in Non-CIL Blocks
Promotional (Regional) Exploration in Coal and Lignite
Coal Mines Pension Scheme
Research and Development (R&D) Programs in the Coal Sector
Environmental Measures and Subsidence Control
Concessional Custom Duty Rates on import of Coal
Income Tax exemption for the generation of power
Concessional rates of railway freight for long distance Coal Transportation
Compensation for land acquired for coal mining purposes
State government to state owned distribution company
Central government to various DISCOM under the UDAY scheme
Concessional GST (@5%) charged on coal
1
2
3
4
5
6
7
8
9
10
11
12
13
Coal production
Coal exploration and production
Coal exploration and production
Coal exploration and production
Coal exploration and production
Coal exploration and production
Consumption
Power Generation
Coal Transportation
Production
Distribution
Distribution
Production
# Support category Stage of the value chain

123SUPPORTING INDIA ON SDG 12 MONITORING AND REPORTINGA Critical Appraisal
Electricity distribution companies (DISCOMs) are the key entities for retail electricity supply, primarily connect-ing end users and generators. They purchase electricity from a wholesale market and sell it to consumers at retail tariffs determined by the state electricity regulatory agencies. Over the last five decades, state electricity boards (SEBs), (the government run DISCOMs) have been incurring losses due to poor revenue collection, billing issues, mismanagement of resources, etc. As a result, SEBs rely heavily on budget allocations from the state government for their survival. It has been reported that nearly 10–30 per cent of DISCOM’s aggregate revenue requirement (ARR) are subsidized and has been rising at a rate of 11 per cent per annum in five states. These states include Tamil Nadu, Uttar Pradesh, Gujarat, Punjab, Haryana and Bihar (Prayas 2019). Further there are subsidies provided under the UDAY scheme to ailing state DISCOMs for improving their fi-nancial position. It may be possible to obtain the extent of subsidy provided to the various ailing DISCOM and that apportioned to the conventional energy electricity supplied by the DISCOM concerned from the Ministry of Power.
Based on the aforementioned discussion, the metadata table has been prepared for estimating and reporting subsidy in the coal production and consumption value chain (Figure 12.1). Finally, the total subsidy on account of oil, natural gas and coal is essentially the sum total of all the support enjoyed by these sectors along the consumption production value chain.
Figure 12.1: Estimation of fossil fuel subsidy per unit of GDP
Source: TERI study team
Coal subsidies
Oil and natural gas subsidies
Total subsidies at current prices
Total fossil fuel subsidy/GDP at current prices
GDP at current prices

124SUPPORTING INDIA ON SDG 12 MONITORING AND REPORTINGA Critical Appraisal
Computation of the recommended indicators is given here:For computation of 12.c.1:
where Soni represents various components of subsidies on oil and natural gas.For computation of 12.c.2,
The numerator can be INR crores and the denominator can be in million tonnes. Sample data is provided in Table 12.3 and Table 12.4.
Amount of fossil fuel subsidy on oil and natural gas per unit of GDP =
Amount of fossil fuel subsidy on coal per unit of GDP =
Where Sci represents various components of subsidies on coal.
Apart from subsidies along the value chain in all the four categories mentioned by WTO, the team strongly rec-ommends bringing back the component of coal cess. The first version of the National Indicator Framework has the indicator listed as “12.c.2: Tax per unit of fossil fuel consumption” (MOSPI 2018). This should be brought back in with a few modifications as suggested by the team.
Cell on Coal and Lignite
The rates of GST compensation cess, which is levied on coal and lignite, are notified on the recommendation of the GST Council, which has representation from all states. Presently, coal and lignite attract a GST compen-sation cess of Rs. 400 per tonne (MOF 2021). The team recommends that a second indicator can be added, which can be as follows:
• 12.c.3: Coal cess collected per unit of coal and lignite consumed
The formula for this is given here.
Coal cess collected per unit of coal and lignite consumed = Cess collected on coal and lignite in that yearCoal and lignite consumed that year
∑ i=1 Soni ÷ GDP at current prices n
∑ i=1 Sci ÷ GDP at current prices n

125SUPPORTING INDIA ON SDG 12 MONITORING AND REPORTINGA Critical Appraisal
Table 12.3: Coal cess collected (INR crores)
Table 12.4: Consumption of coal and lignite (Million tonnes)
Source: MOC (2018)
Source: MOSPI (2020)
2013-14
2014-15
2015-16
2016-17 (RE)
2017-18 (BE)
2013-14
2014-15
2015-16
2016-17
2017-18
739.34
822.13
836.73
837.22
898.52
43.90
46.95
42.21
43.16
46.32
3471.98
5393.46
12675.60
28,500.00
29,700.00
783.24
869.09
878.94
880.38
944.84
Collection of Cess
Total
Year
Year Coal Lignite
Recommendations
This chapter has presented the relevance of fossil based energy resources that fuel economic growth. For decades, countries have resorted to subsidies to protect the poor from retail inflations; however, subsidies in many cases has failed to meet the desired objectives of benefitting the poor and marginalized from price shocks. At the same time, subsidies have led to over-exploitation and unsustainable use of resources leading to global and local pollutions. There are however more effective means of bringing reforms which can not only benefit the poor but also contribute to SCP by incentivising resource efficiency and usage of greener and more sustainable alternatives including solar, wind and biomass energy, which may be available in abundance in developing and least developed countries. Coal is an important source of energy that helps in electricity generation thus powering the Indian economy. However, combustion of coal leads to global and local pollution. India has a total coal based electricity generation installed capacity of 54 per cent; share of electricity generation from coal is more than 70 per cent. The coal sector too enjoys various forms of direct and indirect subsidies that have been listed in the chapter. Based on various categories of the subsidies/support provided to oil, natural gas and coal sector, a detailed metadata table has been presented for these sectors that will help in estimating the fossil fuel subsidy per unit of GDP.

126SUPPORTING INDIA ON SDG 12 MONITORING AND REPORTINGA Critical Appraisal
Figure 12.2: Proposed data flow for proposed Indicators 12.c.1 and 12.c.2
Figure 12.3: Proposed data flow for proposed Indicator 12.c.3
Source: TERI study team
Source: TERI study team
The global indicator for assessing distortions that encourage wasteful consumption has been proposed as the amount of fossil fuel subsidies per unit of GDP from both a consumption and production perspective. Improved rationalization of subsidy will get reflected in decrease in share of subsidy to GDP. The indicators initially proposed by India under the National Indicator Framework were 12.c.1 (Subsidy per unit of fossil fuel consumption) and 12.c.2 (Tax per unit of fossil fuel consumption). However, the revised National indicator framework has updated the indicator to subsidy per unit of fossil fuel consumption.
The recommended indicators are the following:
• 12.c.1: Amount of fossil fuel subsidy on oil and natural gas per unit of GDP • 12.c.2: Amount of fossil fuel subsidy on coal per unit of GDP • 12.c.3: Coal cess collected per unit of coal and lignite consumed
The team suggests that the indicators proposed in the latest NIF be retained; however, they can be improvised to capture subsidies along the value chain for oil, natural gas, and coal. Data flow for suggested indicators is depicted in Figure 12.2 and Figure 12.3.
NITI
MOSPI
NITI
MOSPI
MOEFCC (nodal ministry of SDG 12)
MOEFCC (nodal ministry of SDG 12)
Ministry of Petroleum and Natural Gas
Ministry of Finance
Ministry of Statistics and Program Implementation
Ministry of Coal
Ministry of Finance (for coal cess collected)
Ministry of Coal (for coal cess collected; coal and lignite consumed)
Ministry of Statistics and Program Implementation (for coal and lignite consumed)
National
Data sources for national/ state levels
Data sources
StateAggregator for Indicator 12.7.1
Aggregator for Indicator 12.7.1
Monitoring and Reporting
Monitoring and Reporting

127SUPPORTING INDIA ON SDG 12 MONITORING AND REPORTINGA Critical Appraisal
Indian has recently dismantled the earlier administrative pricing mechanism. However to benefit the poor and marginalized, the government had introduced the DBTL and DBTK schemes for which the subsidy amount is transferred to the accounts of the beneficiaries. This has significantly reduced India’s petroleum based subsidy burden. MOPNG has formulated a scheme for administering subsidy related to sale of natural gas in the North East region of India. The scheme is known as the “Natural Gas Subsidy Scheme”. Pradhan Mantri Ujjwala Yojna (PMUY) was launched on 1 May, 2016 by which Oil Marketing Companies (OMCs) provide free LPG connections to women belonging to the below poverty line (BPL) households. The chapter has also presented other support provided to oil and natural gas sector.
While the national indicator framework only suggests reporting of fossil fuel subsidies, it is important to acknowledge the fact that the sectors are also taxed. For example, in order to promote clean energy solutions, the government of India had launched clean energy cess in 2010 that was later rechristened as clean environment cess and now the GST compensation cess. Oil not only fetches excise duty (including transportation cess) but also fetches state level VAT. At the same time, revenue is collected through import duty, corporate taxes and dividends as provided by the PSU. Although secondary data is not analyzed and is beyond the scope of analysis to undertake estimation of subsidies, TERI recommends that such collection of revenue be also reported in public domain.
India’s situation is widespread among many countries across the world – there is some information available within government and some of it is reported, from other sources and there is a need to gradually build up a comprehensive database that captures all the relevant incentives and subsidies provided across the fossil based energy value chain. The key challenge to India will be in making the data set comprehensive. Separating the national indicator into Oil & Natural Gas and Coal may be helpful. Effort in the short run should be towards capturing the direct benefits transfer but gradually, it has to be expanded by including the induced benefits provided based on available and published data. Periodicity of availability of such data can be increased by undertaking similar assessments by the nodal ministries in association with organizations concerned. A possible step forward would be to assess whether they are “inefficient” or “leading to wasteful consumption”. In other words, the efficiency and effectiveness of such incentives need to be evaluated based on evidences and in relation to cleaner energy sources. It is recommended that reporting should be done in three different areas: first, subsidies; second tax revenues; third social costs. This information is required to enable meaningful discussion on whether the tax burden is right and how revenues should be reallocated.

128SUPPORTING INDIA ON SDG 12 MONITORING AND REPORTINGA Critical Appraisal
References
Arze del Granado, F. J., D. Coady, and R. Gillingham (2012), “The Unequal Benefits of Fuel Subsidies: A Review of Evidence for Developing Countries”, World Development, 40(11): 2234-2248, doi: https://doi.org/10.1016/j.worlddev.2012.05.005.
CIL (Coal India Limited) (2019), Annual Report and Accounts: 2018-19, Coal India Limited.
Dubey, J. (16 July 2019), “Repeated Hike in Excise Duty On Petro Products Surpasses Fuel Subsidy of 15 Years”, India Today, URL: https://www.indiatoday.in/diu/story/hike-excise-duty-petro-products-surpasses-fu-el-subsidy-1569784-2019-07-16.
Garg, V., B. Viswanathan, D. Narayanaswamy, C. Beaton, K. Ganesan, S. Sharma and R. Bridle (2020), “Mapping India’s Energy Subsidies 2020: Fossil Fuels, Renewables, and Electric Vehicles”, Global Subsidies Initiative, International Institute for Sustainable Development and Council on Energy, Environment and Water.
Gass, P., I. Gerasimchuk, P. Wooders, V. Garg, A. Bassi, B. Viswanathan and A. Geddes (2019), Raising Ambition Through Fossil Fuel Subsidy Reform: Greenhouse Gas Emissions Modelling Results from 26 Countries, Winnipeg: International Institute for Sustainable Development.
Hafeneth, T. (2017), “Reforming Fossil Fuel Subsides for a Cleaner Future”, URL: https://www.worldbank.org/en/news/feature/2017/11/21/reforming-fossil-fuel-subsidies-for-a-cleaner-future (Last accessed 21 June 2020).
IEA (International Energy Agency) (2015), WEO 2015 Special Report on Energy and Climate Change - Executive Summary - UK version, France: IEA.
IEA (International Energy Agency) (2021), “Energy Subsidies: Tracking the Impact of Fossil-fuel Subsidies”, [Online: web] Accessed 19 April 2021, URL: https://www.iea.org/topics/energy-subsidies.
IMF (International Monetary Fund) (2010), The Unequal Benefits of Fuel Subsidies: A Review of Evidence for Developing Countries, IMF Working Paper Number. WP/10/202, Washington, DC: IMF.
Lierop, W. (2019), “Yes, Fossil Fuel Subsidies Are Real, Destructive And Protected By Lobbying”, URL: https://www.forbes.com/sites/walvanlierop/2019/12/06/yes-fossil-fuel-subsidies-are-real-destructive-and-protect-ed-by-lobbying/#79c06dd8417e (Last accessed 21 June 2020).
MOC (Ministry of Coal) (2018), “Coal Cess”, Response to Lok Sabha Unstarred Question 102, New Delhi: MOC, Government of India.
MOC (Ministry of Coal) (2018), “Coal Cess”, Response to Lok Sabha Unstarred Question 102, New Delhi: MOC, Government of India.

129SUPPORTING INDIA ON SDG 12 MONITORING AND REPORTINGA Critical Appraisal
MOF (Ministry of Finance) (2016), Letter to the Principal Chief Commissioner, dated 29th February 2016, New Delhi: MOF.
MOF (Ministry of Finance) (2018), National Clean Energy & Environment Fund (NCEEF), New Delhi, Department of Expenditure, Ministry of Finance.
MOF (Ministry of Finance) (2021), “Cess on Coal and Lignite”, Response to Lok Sabha Unstarred Question 2079, New Delhi: MOF, Government of India.
MOF (Ministry of Finance) (2021), “Cess on Coal and Lignite”, Response to Lok Sabha Unstarred Question 2079, New Delhi: MOF, Government of India.
MOPNG (Ministry of Petroleum and Natural Gas) (2016), Indian Petroleum and Natural Gas Statistics 2015-16, New Delhi: MOPNG
MOSPI (Ministry of Statistics and Programme Implementation) (2018), Sustainable Development Goals: National Indicator Framework (Version 1), New Delhi: MOSPI, Government of India.
MOSPI (Ministry of Statistics and Programme Implementation) (2020a), Sustainable Development Goals: National Indicator Framework (March 2020), New Delhi: MOSPI, Government of India.
MOSPI (Ministry of Statistics and Programme Implementation) (2020b), Sustainable Development Goals Progress Report, New Delhi: MOSPI, Government of India.
MOSPI (Ministry of Statistics and Programme Implementation) (2020), Energy Statistics 2020, New Delhi: MOSPI, Government of India.
MOSPI (Ministry of Statistics and Programme Implementation) (2020), Energy Statistics 2020, New Delhi: MOSPI, Government of India.
PPAC (Petroleum Planning and Analysis Cell) (2020), Crude Oil Price (Indian Basket), New Delhi: PPAC.
Prayas (2019), Electricity Subsidies in India and its Impact on Distribution Company Finances, Pune, Prayas.
Press Trust of India (2019), Auto LPG body Seeks GST Cut, Level Playing Field to Spur Usage, The Economic Times, 27th August 2019.
Soman, A., N. McCulloch, H. Kaur and C. Beaton (2019), India’s Energy Transition: The Impact of the Goods and Services Tax on Solar Photovoltaic and Coal Power Costs, Global Subsidies Initiative, International Institute for Sustainable Development and Council on Energy, Environment and Water.

130SUPPORTING INDIA ON SDG 12 MONITORING AND REPORTINGA Critical Appraisal
TERI (The Energy and Resources Institite) 2015, Air Pollution and Health, Discussion Paper, New Delhi: The Energy and Resources Institute.
UN (United Nations) (2020a), Tier Classification for Global SDG Indicators (Version 17 April 2020), New York: UN.
UN (United Nations) (2020b), Global SDG Indicators Database, New York: UN.
United Nations (2019), SDG Indicators Metadata Repository, New York: United Nations.
United Nations Statistics Division (2019), Contribution to Central and State Exchequer, New York: United Nations.
WHO (World Health Organisation) (2016), Burning Opportunity: Clean Household Energy for Health, Sustainable Development, and Wellbeing of Women and Children, Geneva: WHO.

131SUPPORTING INDIA ON SDG 12 MONITORING AND REPORTINGA Critical Appraisal
The Way ForwardWe are already in the year 2021; the 2030 Agenda with the SDGs have to be realized in less than a decade. For India to contribute to global progress, reporting on each SDG target is crucial. This study aims to provide target-wise recommendations for reporting on indicators. In the following, we summarise the findings from the study. Meta-data for all the proposed indicators is provided in Annexure. The suggested indicators for monitoring and reporting are based on practical aspects such as data availability. The TERI study team acknowledges that for monitoring and reporting of sustainable consumption and production, statistical capacities in India will have to be further developed for data collection on consumption, value chains as well as natural resources. The study team also recommends that indicators for SDGs as suggested in the MOSPI NIF and the NITI SDG Index can be better harmonised. There is also some scope for harmonisation of national and global indicators. Recommendations for target-wise reporting on indicators are provided.
Target 12.1: Implement the 10-Year Framework of Programmes on Sustainable Consumption and Production Patterns, all countries taking action, with developed countries taking the lead, taking into account the development and capabilities of developing countries
For monitoring and reporting of the indicator, existing policies fulfilling the SCP criteria can be considered for reporting of data. It is proposed that the National Focal Point (NFP) aggregates data from various ministries/ departments as well as state governments. For monitoring and reporting of the indicator, information on this can be collected through surveys/ questionnaires.
• 12.1.1: Sustainable consumption and production action plan or framework at national and state level
For monitoring and reporting under this target, a qualitative framework based on types of policy instruments, SDG 12, life-cycle stage and policy cycle can be developed.
Capacity building activities on the themes of SDG 12 can be described and reported on.
Sectoral roadmaps can be reported on; this can be encouraged at national and state levels.
Performance of programmes in terms of impact and outcomes can be reported on.
The current/agreed targets and indicators risk limiting the discussion to resource and waste management. We also need to examine, through micro studies, how to achieve SCP through life style changes and examine dimensions of affluence and rich–poor and urban–rural divides.
Sustainable consumption and production action plan or framework at national and state levels.
Areas for immediate reporting Areas for further capacity development on data
reporting and research

132SUPPORTING INDIA ON SDG 12 MONITORING AND REPORTINGA Critical Appraisal
Target 12.2: By 2030, achieve the sustainable management and efficient use of natural resources
Presently, data for calculating environmental footprint at the national level is not available. Detailed disaggregation of resources according to the SEEA framework is not presently available for India. For the purpose of monitoring and reporting, abiotic materials as well as groundwater can be considered as a starting point; data for these material are available. India’s National Indicator Framework has proposed percentage variation in per-capita use of natural resources for measuring and monitoring sustainable management and efficient use of natural resources. As a starting point, the study team recommends to report the following two indicators:
• 12.2.1: Percentage variation in per capita use of natural resources - 12.2.1 (i): Percentage variation in per capita use of metallic ores - 12.2.1 (ii): Percentage variation in per capita use of non-metallic minerals - 12.2.1 (iii): Percentage variation in per capita use of oil - 12.2.1 (iv): Percentage variation in per capita use of coal - 12.2.1 (v): Percentage variation in per capita use of natural gas - 12.2.1 (vi): Per capita variation in groundwater use
The aforementioned indicators can be immediately reported on but there is a substantial source of improvement for strengthening data systems as well as conduction micro-studies to understand impact on sustainable management and efficient use of natural resources.
Exercises for aggregate score can consider weight assignments through principal component analysis rather than using mere simple average methods.
Biomass consumption and land related data systems can be strengthened.
Environmental footprint at the national level can be reported on along with a comprehensive coverage of all resources such as minerals, water, land and biomass.
The quantity of resources consumed during each stage of the value chain along with amount of environmental externalities and resources wasted or lost and embodiment of these resources in the final products.
Percentage variation in per capita use of natural resources (six categories of resources can be reported on and then this can be expanded over time
Areas for immediate reporting Areas for further capacity development on data
reporting and research
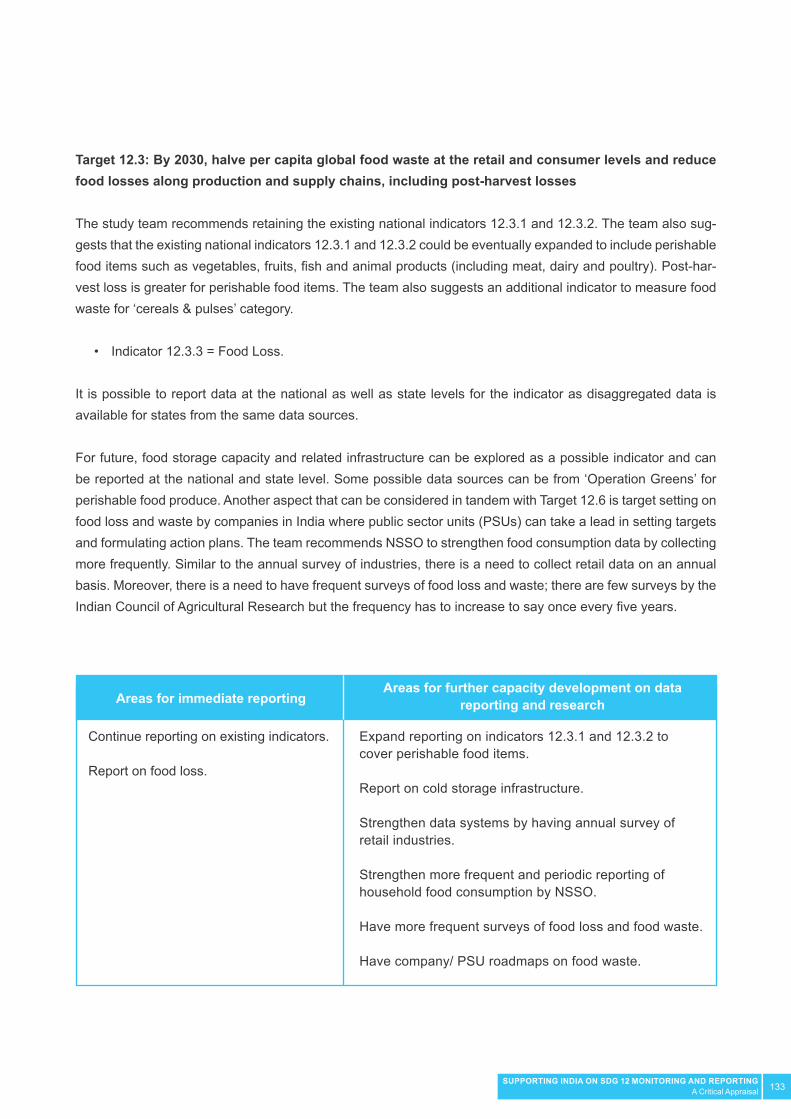
133SUPPORTING INDIA ON SDG 12 MONITORING AND REPORTINGA Critical Appraisal
Target 12.3: By 2030, halve per capita global food waste at the retail and consumer levels and reduce food losses along production and supply chains, including post-harvest losses
The study team recommends retaining the existing national indicators 12.3.1 and 12.3.2. The team also sug-gests that the existing national indicators 12.3.1 and 12.3.2 could be eventually expanded to include perishable food items such as vegetables, fruits, fish and animal products (including meat, dairy and poultry). Post-har-vest loss is greater for perishable food items. The team also suggests an additional indicator to measure food waste for ‘cereals & pulses’ category.
• Indicator 12.3.3 = Food Loss.
It is possible to report data at the national as well as state levels for the indicator as disaggregated data is available for states from the same data sources.
For future, food storage capacity and related infrastructure can be explored as a possible indicator and can be reported at the national and state level. Some possible data sources can be from ‘Operation Greens’ for perishable food produce. Another aspect that can be considered in tandem with Target 12.6 is target setting on food loss and waste by companies in India where public sector units (PSUs) can take a lead in setting targets and formulating action plans. The team recommends NSSO to strengthen food consumption data by collecting more frequently. Similar to the annual survey of industries, there is a need to collect retail data on an annual basis. Moreover, there is a need to have frequent surveys of food loss and waste; there are few surveys by the Indian Council of Agricultural Research but the frequency has to increase to say once every five years.
Expand reporting on indicators 12.3.1 and 12.3.2 to cover perishable food items.
Report on cold storage infrastructure.
Strengthen data systems by having annual survey of retail industries.
Strengthen more frequent and periodic reporting of household food consumption by NSSO.
Have more frequent surveys of food loss and food waste.
Have company/ PSU roadmaps on food waste.
Continue reporting on existing indicators.
Report on food loss.
Areas for immediate reporting Areas for further capacity development on data
reporting and research

134SUPPORTING INDIA ON SDG 12 MONITORING AND REPORTINGA Critical Appraisal
Target 12.4: By 2020, achieve the environmentally sound management of chemicals and all wastes throughout their life cycle, in accordance with agreed international frameworks, and significantly re-duce their release to air, water and soil in order to minimize their adverse impacts on human health and the environment
Some comments made by the team in earlier interactions with MOSPI has already been taken into account by MOSPI as reflected in the latest progress report. The team recommends that the existing national indicator under Target 12.4 (Indicator 12.4.1) be replaced with the following indicator: • 12.4.1: National compliance rate with international multilateral environmental agreements on hazardous waste and other chemicals - 12.4.1 (i): National compliance rate for Basel Convention - 12.4.1 (ii): National compliance rate for Rotterdam Convention - 12.4.1 (iii): National compliance rate for Stockholm Convention - 12.4.1 (iv): National compliance rate for Montreal Protocol - 12.4.1 (v): National compliance rate for Minamata Convention
As the Hazardous Substances Management Division (HSMD) of MOEFCC and the Ozone Cell of MOEFCC are in charge of administering the relevant MEAs, they provide data. This indicator can be further aligned with the global indicator framework.
Target 12.5: By 2030, substantially reduce waste generation through prevention, reduction, recycling and reuse
The study team feels that mere reporting on the number of units of recyclers and source segregation is insufficient and suggests replacing the current national indicators with the following three indicators:
• 12.5.1: Solid waste treatment rate • 12.5.2: Source segregation rate • 12.5.3: Percentage of states/ UTs putting partial or complete ban on single-use plastic products (carry bags)
More aspects on hazardous waste at the industry and sector level can be reported in the integrated waste management system of India.
Link between secondary resource policy and international conventions can be further strengthened.
Conduct micro-studies on impact of hazardous waste management policies on human health.
Replace 12.4.1 and report on national compliance with international multilateral environmental agreements on hazardous waste and other chemicals.
Areas for immediate reporting Areas for further capacity development on data
reporting and research
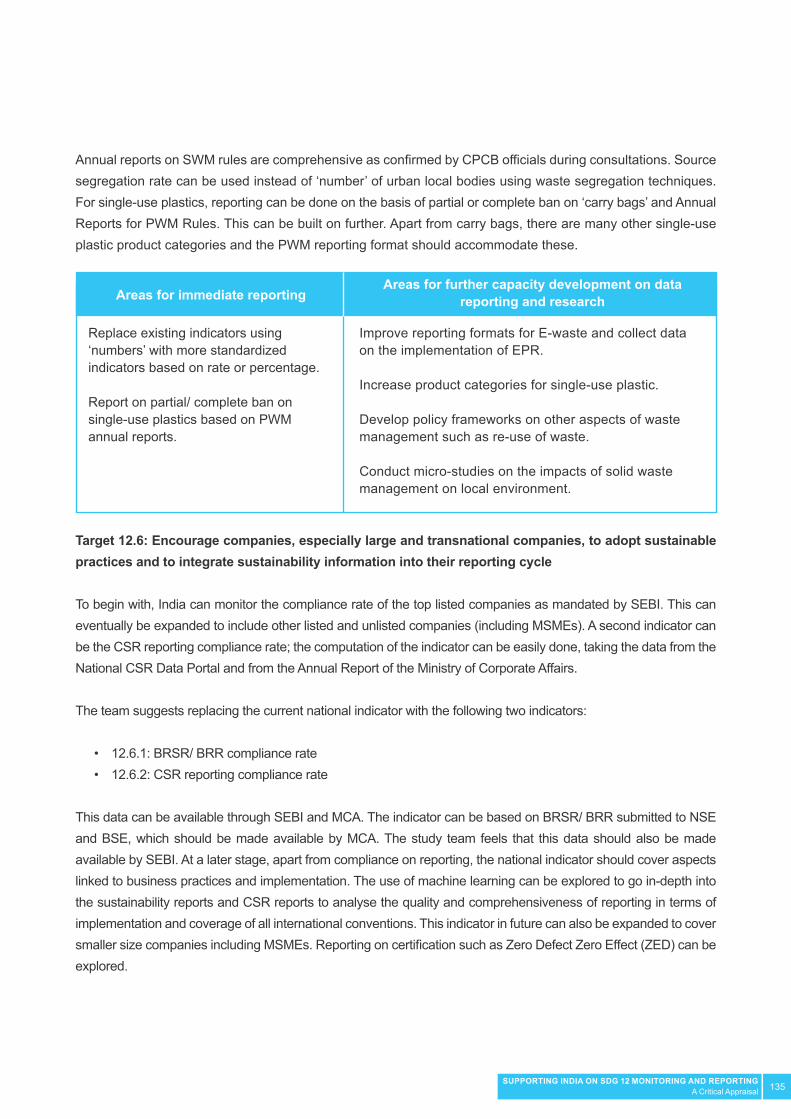
135SUPPORTING INDIA ON SDG 12 MONITORING AND REPORTINGA Critical Appraisal
Annual reports on SWM rules are comprehensive as confirmed by CPCB officials during consultations. Source segregation rate can be used instead of ‘number’ of urban local bodies using waste segregation techniques. For single-use plastics, reporting can be done on the basis of partial or complete ban on ‘carry bags’ and Annual Reports for PWM Rules. This can be built on further. Apart from carry bags, there are many other single-use plastic product categories and the PWM reporting format should accommodate these.
Target 12.6: Encourage companies, especially large and transnational companies, to adopt sustainable practices and to integrate sustainability information into their reporting cycle
To begin with, India can monitor the compliance rate of the top listed companies as mandated by SEBI. This can eventually be expanded to include other listed and unlisted companies (including MSMEs). A second indicator can be the CSR reporting compliance rate; the computation of the indicator can be easily done, taking the data from the National CSR Data Portal and from the Annual Report of the Ministry of Corporate Affairs.
The team suggests replacing the current national indicator with the following two indicators:
• 12.6.1: BRSR/ BRR compliance rate • 12.6.2: CSR reporting compliance rate
This data can be available through SEBI and MCA. The indicator can be based on BRSR/ BRR submitted to NSE and BSE, which should be made available by MCA. The study team feels that this data should also be made available by SEBI. At a later stage, apart from compliance on reporting, the national indicator should cover aspects linked to business practices and implementation. The use of machine learning can be explored to go in-depth into the sustainability reports and CSR reports to analyse the quality and comprehensiveness of reporting in terms of implementation and coverage of all international conventions. This indicator in future can also be expanded to cover smaller size companies including MSMEs. Reporting on certification such as Zero Defect Zero Effect (ZED) can be explored.
Improve reporting formats for E-waste and collect data on the implementation of EPR.
Increase product categories for single-use plastic.
Develop policy frameworks on other aspects of waste management such as re-use of waste.
Conduct micro-studies on the impacts of solid waste management on local environment.
Replace existing indicators using ‘numbers’ with more standardized indicators based on rate or percentage.
Report on partial/ complete ban on single-use plastics based on PWM annual reports.
Areas for immediate reporting Areas for further capacity development on data
reporting and research
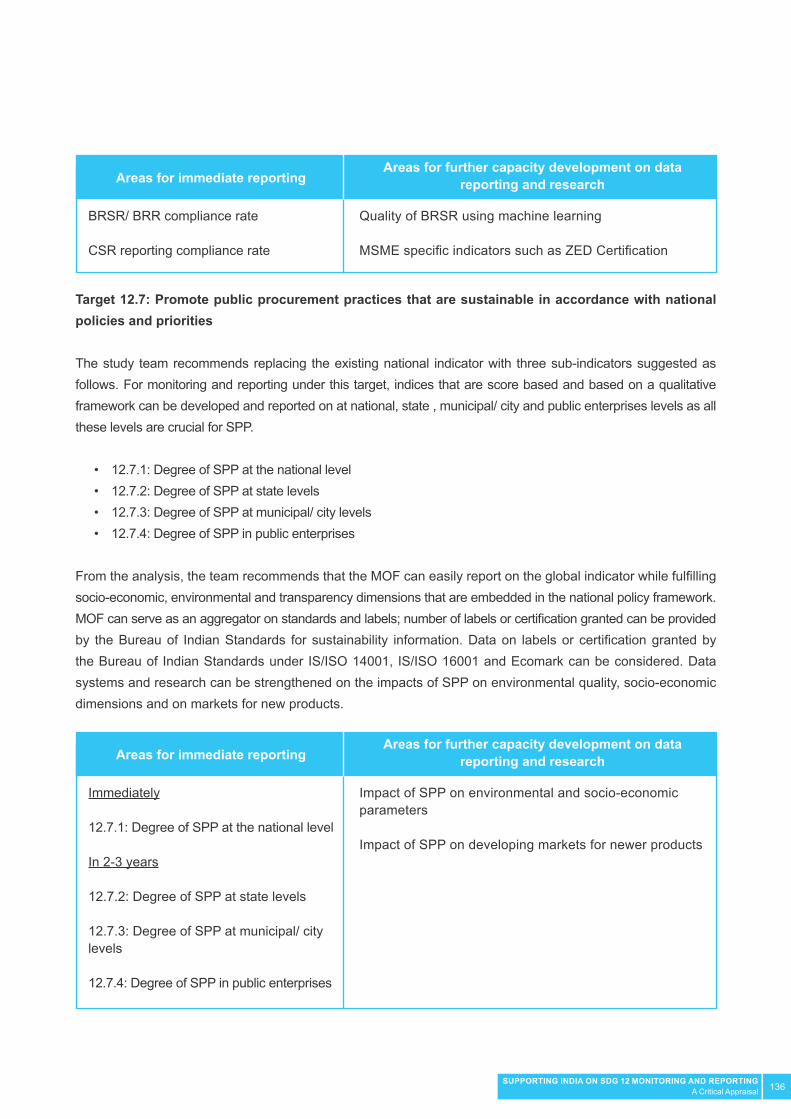
136SUPPORTING INDIA ON SDG 12 MONITORING AND REPORTINGA Critical Appraisal
Target 12.7: Promote public procurement practices that are sustainable in accordance with national policies and priorities
The study team recommends replacing the existing national indicator with three sub-indicators suggested as follows. For monitoring and reporting under this target, indices that are score based and based on a qualitative framework can be developed and reported on at national, state , municipal/ city and public enterprises levels as all these levels are crucial for SPP.
• 12.7.1: Degree of SPP at the national level • 12.7.2: Degree of SPP at state levels • 12.7.3: Degree of SPP at municipal/ city levels • 12.7.4: Degree of SPP in public enterprises
From the analysis, the team recommends that the MOF can easily report on the global indicator while fulfilling socio-economic, environmental and transparency dimensions that are embedded in the national policy framework. MOF can serve as an aggregator on standards and labels; number of labels or certification granted can be provided by the Bureau of Indian Standards for sustainability information. Data on labels or certification granted by the Bureau of Indian Standards under IS/ISO 14001, IS/ISO 16001 and Ecomark can be considered. Data systems and research can be strengthened on the impacts of SPP on environmental quality, socio-economic dimensions and on markets for new products.
Quality of BRSR using machine learning
MSME specific indicators such as ZED Certification
Impact of SPP on environmental and socio-economic parameters
Impact of SPP on developing markets for newer products
BRSR/ BRR compliance rate
CSR reporting compliance rate
Immediately
12.7.1: Degree of SPP at the national level
In 2-3 years
12.7.2: Degree of SPP at state levels
12.7.3: Degree of SPP at municipal/ city levels
12.7.4: Degree of SPP in public enterprises
Areas for immediate reporting
Areas for immediate reporting
Areas for further capacity development on data reporting and research
Areas for further capacity development on data reporting and research
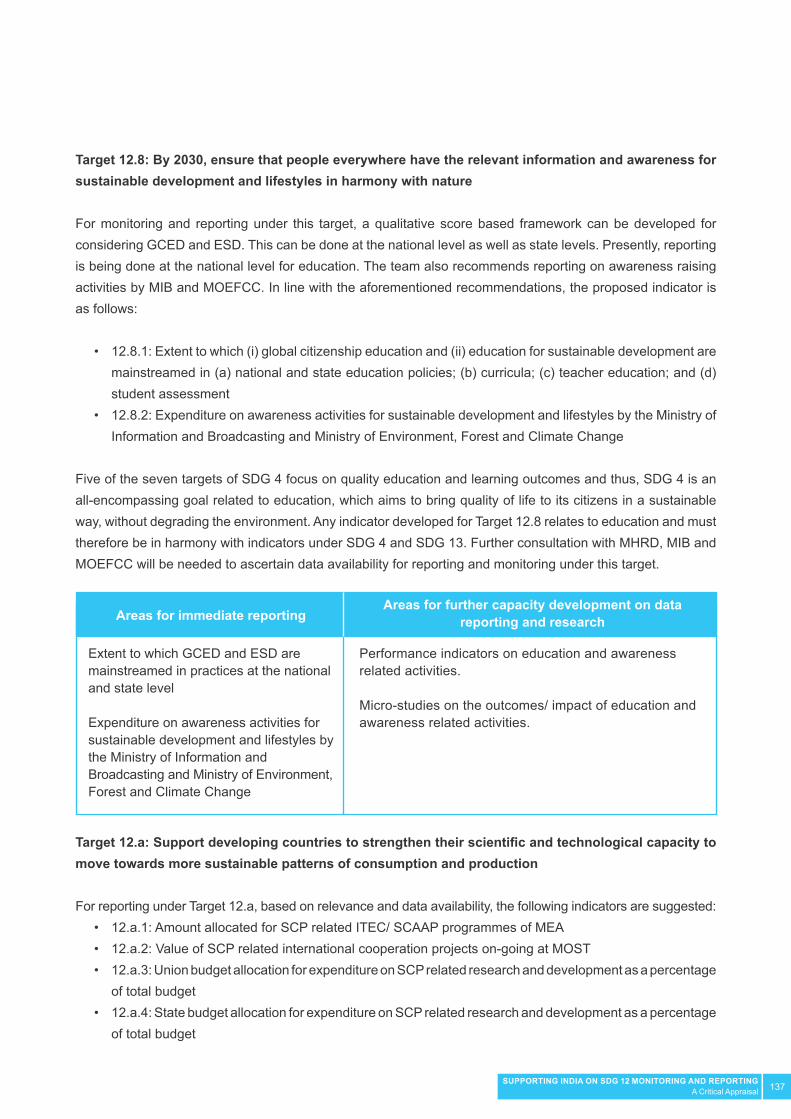
137SUPPORTING INDIA ON SDG 12 MONITORING AND REPORTINGA Critical Appraisal
Target 12.8: By 2030, ensure that people everywhere have the relevant information and awareness for sustainable development and lifestyles in harmony with nature
For monitoring and reporting under this target, a qualitative score based framework can be developed for considering GCED and ESD. This can be done at the national level as well as state levels. Presently, reporting is being done at the national level for education. The team also recommends reporting on awareness raising activities by MIB and MOEFCC. In line with the aforementioned recommendations, the proposed indicator is as follows:
• 12.8.1: Extent to which (i) global citizenship education and (ii) education for sustainable development are mainstreamed in (a) national and state education policies; (b) curricula; (c) teacher education; and (d) student assessment • 12.8.2: Expenditure on awareness activities for sustainable development and lifestyles by the Ministry of Information and Broadcasting and Ministry of Environment, Forest and Climate Change
Five of the seven targets of SDG 4 focus on quality education and learning outcomes and thus, SDG 4 is an all-encompassing goal related to education, which aims to bring quality of life to its citizens in a sustainable way, without degrading the environment. Any indicator developed for Target 12.8 relates to education and must therefore be in harmony with indicators under SDG 4 and SDG 13. Further consultation with MHRD, MIB and MOEFCC will be needed to ascertain data availability for reporting and monitoring under this target.
Target 12.a: Support developing countries to strengthen their scientific and technological capacity to move towards more sustainable patterns of consumption and production
For reporting under Target 12.a, based on relevance and data availability, the following indicators are suggested: • 12.a.1: Amount allocated for SCP related ITEC/ SCAAP programmes of MEA • 12.a.2: Value of SCP related international cooperation projects on-going at MOST • 12.a.3: Union budget allocation for expenditure on SCP related research and development as a percentage of total budget • 12.a.4: State budget allocation for expenditure on SCP related research and development as a percentage of total budget
Performance indicators on education and awareness related activities.
Micro-studies on the outcomes/ impact of education and awareness related activities.
Extent to which GCED and ESD are mainstreamed in practices at the national and state level
Expenditure on awareness activities for sustainable development and lifestyles by the Ministry of Information and Broadcasting and Ministry of Environment, Forest and Climate Change
Areas for immediate reporting Areas for further capacity development on data
reporting and research

138SUPPORTING INDIA ON SDG 12 MONITORING AND REPORTINGA Critical Appraisal
The International Cooperation Division of MOEFCC being the nodal agency can act as an aggregator. The data can flow from the Ministry of External Affairs, Ministry of Science and Technology, and Ministry of Finance, which can then be compiled by the International Cooperation Division of MOEFCC for further transmission to MOSPI and NITI Aayog. India should also make known the limitations of the global indicator, which does not adequately capture the aspects of sustainable consumption and production especially from the resource and material aspect. Moreover, the replacement indicator in the global indicator framework does not capture the aspect of support to developing countries in the form of South–South cooperation.
Target 12.b: Develop and implement tools to monitor sustainable development impacts for sustainable tourism that creates jobs and promotes local culture and products
As a first step, state level and national level policy developments on ‘sustainable tourism’ and ‘eco-tourism’ can be reported on. The team suggests the following indicator be adopted.
• 12.b.1: Sustainable tourism policy index at national and state levels
Information on various aspects of policies related to sustainable tourism and eco-tourism can collected through a questionnaire. These policy related mechanisms can include macro-policy, institutional arrangements, knowledge resources and monitoring and reporting systems.
For future, both quantity and quality aspects of collaboration of India with other developing countries needs to be evaluated.
Immediately
12.a.1: Amount allocated for SCP related ITEC/ SCAAP programmes of MEA
12.a.2: Value of SCP related international cooperation projects on-going at MOST
12.a.3: Union budget allocation for expenditure on SCP related research and development as a percentage of total budget
Next 1–2 years
12.a.4: State budget allocation for expenditure on SCP related research and development as a percentage of total budget
Areas for immediate reporting Areas for further capacity development
on data reporting and research
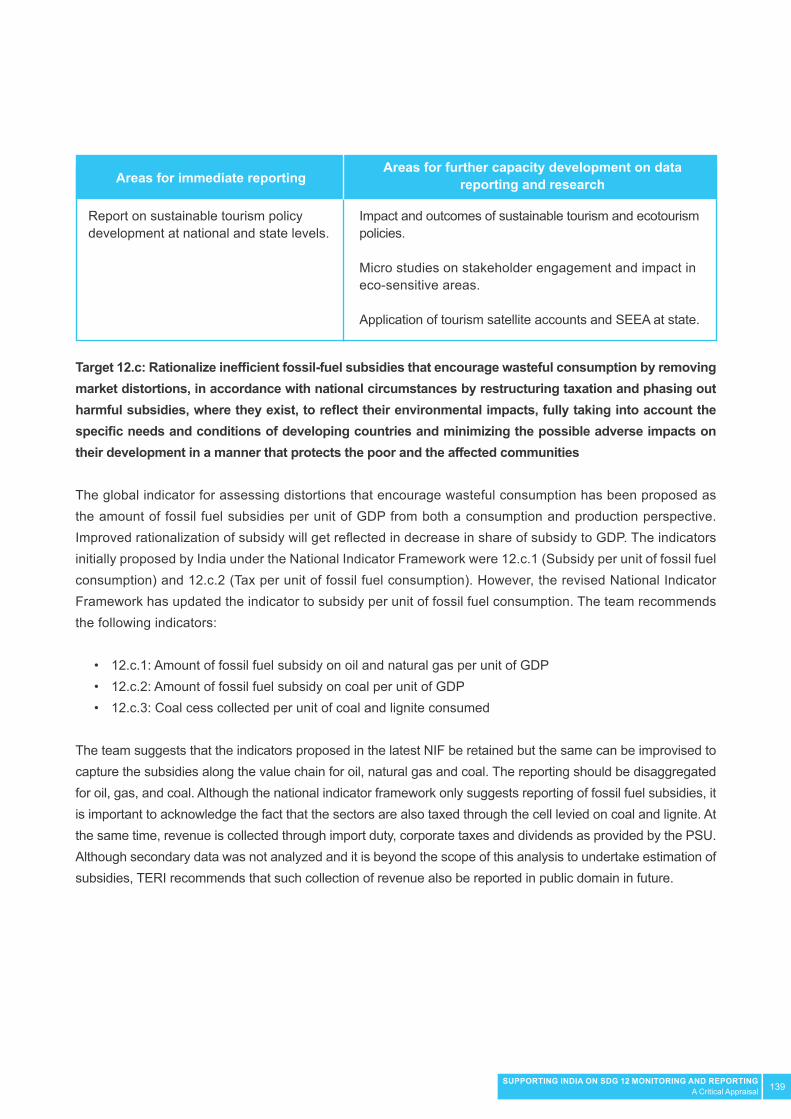
139SUPPORTING INDIA ON SDG 12 MONITORING AND REPORTINGA Critical Appraisal
Target 12.c: Rationalize inefficient fossil-fuel subsidies that encourage wasteful consumption by removing market distortions, in accordance with national circumstances by restructuring taxation and phasing out harmful subsidies, where they exist, to reflect their environmental impacts, fully taking into account the specific needs and conditions of developing countries and minimizing the possible adverse impacts on their development in a manner that protects the poor and the affected communities
The global indicator for assessing distortions that encourage wasteful consumption has been proposed as the amount of fossil fuel subsidies per unit of GDP from both a consumption and production perspective. Improved rationalization of subsidy will get reflected in decrease in share of subsidy to GDP. The indicators initially proposed by India under the National Indicator Framework were 12.c.1 (Subsidy per unit of fossil fuel consumption) and 12.c.2 (Tax per unit of fossil fuel consumption). However, the revised National Indicator Framework has updated the indicator to subsidy per unit of fossil fuel consumption. The team recommends the following indicators:
• 12.c.1: Amount of fossil fuel subsidy on oil and natural gas per unit of GDP • 12.c.2: Amount of fossil fuel subsidy on coal per unit of GDP • 12.c.3: Coal cess collected per unit of coal and lignite consumed
The team suggests that the indicators proposed in the latest NIF be retained but the same can be improvised to capture the subsidies along the value chain for oil, natural gas and coal. The reporting should be disaggregated for oil, gas, and coal. Although the national indicator framework only suggests reporting of fossil fuel subsidies, it is important to acknowledge the fact that the sectors are also taxed through the cell levied on coal and lignite. At the same time, revenue is collected through import duty, corporate taxes and dividends as provided by the PSU. Although secondary data was not analyzed and it is beyond the scope of this analysis to undertake estimation of subsidies, TERI recommends that such collection of revenue also be reported in public domain in future.
Impact and outcomes of sustainable tourism and ecotourism policies.
Micro studies on stakeholder engagement and impact in eco-sensitive areas.
Application of tourism satellite accounts and SEEA at state.
Report on sustainable tourism policy development at national and state levels.
Areas for immediate reporting Areas for further capacity development on data
reporting and research

140SUPPORTING INDIA ON SDG 12 MONITORING AND REPORTINGA Critical Appraisal
Micro-studies on impact of subsidies on other SDGs.
Detailed disaggregation on revenues and fees collected on fossil fuels at national and state levels.
Baselines for indicators under target 12. c.
Immediately
Report on subsidies disaggregated by coal, oil and natural gas.
Report on cess collected on coal and lignite.
In the next 2–3 years
Value chain stage disaggregation of fossil fuel subsidies at national and state levels.
Subsidies given for sustainable consumption and production such as for clean energy, water savings and resource efficiency.
Areas for immediate reporting Areas for further capacity development
on data reporting and research
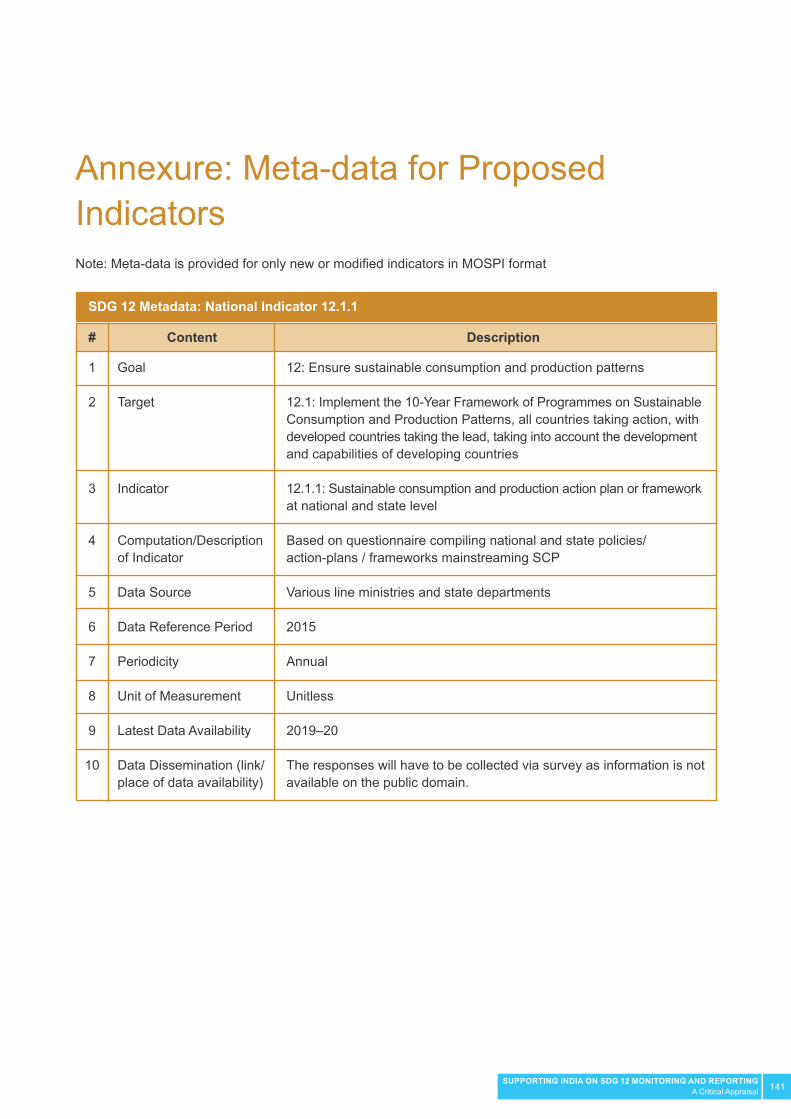
141SUPPORTING INDIA ON SDG 12 MONITORING AND REPORTINGA Critical Appraisal
Annexure: Meta-data for Proposed IndicatorsNote: Meta-data is provided for only new or modified indicators in MOSPI format
12: Ensure sustainable consumption and production patterns
12.1: Implement the 10-Year Framework of Programmes on Sustainable Consumption and Production Patterns, all countries taking action, with developed countries taking the lead, taking into account the development and capabilities of developing countries
12.1.1: Sustainable consumption and production action plan or framework at national and state level
Based on questionnaire compiling national and state policies/ action-plans / frameworks mainstreaming SCP
Various line ministries and state departments
2015
Annual
Unitless
2019–20
The responses will have to be collected via survey as information is not available on the public domain.
Goal
Target
Indicator
Computation/Description of Indicator
Data Source
Data Reference Period
Periodicity
Unit of Measurement
Latest Data Availability
Data Dissemination (link/place of data availability)
1
2
3
4
5
6
7
8
9
10
# Content
SDG 12 Metadata: National Indicator 12.1.1
Description

142SUPPORTING INDIA ON SDG 12 MONITORING AND REPORTINGA Critical Appraisal
12: Ensure sustainable consumption and production patterns
12.2: By 2030, achieve the sustainable management and efficient use of natural resources
12.2.1: Percentage variation in per capita use of natural resources12.2.1 (i): Percentage variation in per capita use of metallic ores12.2.1 (ii): Percentage variation in per capita use of non-metallic minerals12.2.1 (iii): Percentage variation in per capita use of oil12.2.1 (iv): Percentage variation in per capita use of coal12.2.1 (v): Percentage variation in per capita use of natural gas12.2.1 (vi): Per capita variation in groundwater use
categories proposed)
For metal ores Numerator: Difference in total domestic extraction of metallic resources, plus imports minus exports in the current year and that of the previous yearDenominator: Total population in the current yearMultiplier:100
For non-metallic mineralsNumerator: Difference in total domestic extraction of non-metallic mineral resources, plus imports minus exports in the current year and that of the previous yearDenominator: Total population in the current yearMultiplier:100
For oilNumerator: Difference in total domestic extraction of crude oil plus imports minus exports in the current year and that of the previous year Denominator: Total population in the current yearMultiplier:100
For coalNumerator: Difference in total domestic extraction of coal plus imports minus exports in the current year and that of the previous year Denominator: Total population in the current yearMultiplier:100
For natural gasNumerator: Difference in total domestic extraction of natural gas plus imports minus exports in the current year and that of the previous year Denominator: Total population in the current yearMultiplier:100
Goal
Target
Indicator
Computation/Description of Indicator
1
2
3
4
# Content
SDG 12 Metadata: National Indicator 12.2.1
Description

143SUPPORTING INDIA ON SDG 12 MONITORING AND REPORTINGA Critical Appraisal
For groundwater Numerator: Difference in total ground water draft in the current year and that of the previous yearDenominator: Total population in the current yearMultiplier:100
(i) Metallic mineral resources – Indian Mineral Yearbook (Ministry of Mines)(ii) Non-metallic mineral resources – Indian Mineral Yearbook (Ministry of Mines)(iii) Oil – Indian PNG Statistics for the Year (Ministry of Petroleum and Natural Gas)(iv) Coal - Coal Directory of India: Coal Statistics (Coal Controller’s Organization, Ministry of Coal)(v) Natural gas – Indian PNG Statistics for the year (Ministry of Petroleum and Natural Gas)(vi) Central Ground Water Board; Ministry of Jal Shakti
2015-16
Annual
Percentage
2018-19 (Minerals)2019-20 (Oil, natural gas, coal)2017-2018 (for groundwater)
(i) Metallic minerals https://ibm.gov.in/index.php?c=pages&m=index&id=1471(ii) Non-metallic minerals https://ibm.gov.in/index.php?c=pages&m=in-dex&id=1471(iii) Oil - http://petroleum.nic.in/sites/default/files/arep2020.pdf(iv) Coal - http://www.coalcontroller.gov.in/writereaddata/files/download/coaldirectory/CoalDirectory2017-18.pdf(v) Gas - http://petroleum.nic.in/sites/default/files/arep2020.pdf(vi) Groundwater - http://cgwb.gov.in/Ground-Water/Groundwater%20Year%20Book%202017-18.pdf
Data Source
Data Reference Period
Periodicity
Unit of Measurement
Latest Data Availability
Data Dissemination (link/place of data availability)
5
6
7
8
9
10
# Content
SDG 12 Metadata: National Indicator 12.2.1
Description
http://www.coalcontroller.gov.in/writereaddata/files/download/coaldirectory/CoalDirectory2017-18.pdf
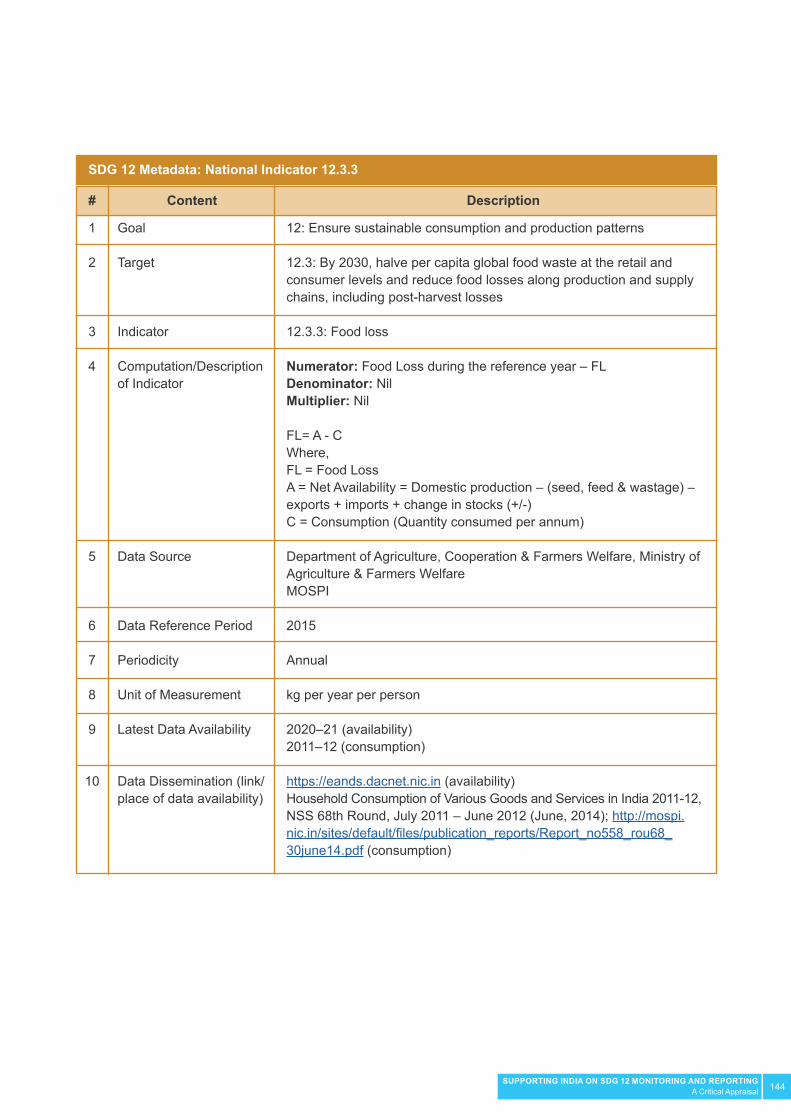
144SUPPORTING INDIA ON SDG 12 MONITORING AND REPORTINGA Critical Appraisal
12: Ensure sustainable consumption and production patterns
12.3: By 2030, halve per capita global food waste at the retail and consumer levels and reduce food losses along production and supply chains, including post-harvest losses
12.3.3: Food loss
Numerator: Food Loss during the reference year – FLDenominator: NilMultiplier: Nil
FL= A - CWhere,FL = Food Loss A = Net Availability = Domestic production – (seed, feed & wastage) – exports + imports + change in stocks (+/-)C = Consumption (Quantity consumed per annum)
Department of Agriculture, Cooperation & Farmers Welfare, Ministry of Agriculture & Farmers WelfareMOSPI
2015
Annual
kg per year per person
2020–21 (availability)2011–12 (consumption)
https://eands.dacnet.nic.in (availability)Household Consumption of Various Goods and Services in India 2011-12, NSS 68th Round, July 2011 – June 2012 (June, 2014); http://mospi.nic.in/sites/default/files/publication_reports/Report_no558_rou68_30june14.pdf (consumption)
Goal
Target
Indicator
Computation/Description of Indicator
Data Source
Data Reference Period
Periodicity
Unit of Measurement
Latest Data Availability
Data Dissemination (link/place of data availability)
1
2
3
4
5
6
7
8
9
10
# Content
SDG 12 Metadata: National Indicator 12.3.3
Description

145SUPPORTING INDIA ON SDG 12 MONITORING AND REPORTINGA Critical Appraisal
12: Ensure sustainable consumption and production patterns
12.4: By 2020, achieve the environmentally sound management of chemicals and all wastes throughout their life cycle, in accordance with agreed international frameworks, and significantly reduce their release to air, water and soil in order to minimize their adverse impacts on human health and the environment t
12.4.1: National compliance rate with international multilateral environmental agreements on hazardous waste and other chemicals12.4.1 (i): National compliance rate for Basel Convention12.4.1 (ii): National compliance rate for Rotterdam Convention12.4.1 (iii): National compliance rate for Stockholm Convention12.4.1 (iv): National compliance rate for Montreal Protocol 12.4.1 (v): National compliance rate for Minamata Convention
Numerator: Total score for that ConventionDenominator: Maximum score possible for that ConventionMultiplier: 100
Hazardous Substance Management Division (HSMD)Ozone Cell
2015
Annual
Unitless
2020
To be collected via questionnaire from HSMD and Ozone Cell. In an ideal state, this data should be available on MOEFCC website.
Goal
Target
Indicator
Computation/Description of Indicator
Data Source
Data Reference Period
Periodicity
Unit of Measurement
Latest Data Availability
Data Dissemination (link/place of data availability)
1
2
3
4
5
6
7
8
9
10
# Content
SDG 12 Metadata: National Indicator 12.4.1
Description

146SUPPORTING INDIA ON SDG 12 MONITORING AND REPORTINGA Critical Appraisal
12: Ensure sustainable consumption and production patterns
12.5: By 2030, substantially reduce waste generation through prevention, reduction, recycling and reuse
12.5.1: Solid waste treatment rate
Numerator: Solid Waste TreatedDenominator: Solid Waste Treated Multiplier: 100
Central Pollution Control Board
2015
Annual
Percentage
2018–19
CPCB Annual Report on SWM - https://cpcb.nic.in/uploads/MSW/MSW_AnnualReport_2018-19.pdf
Goal
Target
Indicator
Computation/Description of Indicator
Data Source
Data Reference Period
Periodicity
Unit of Measurement
Latest Data Availability
Data Dissemination (link/place of data availability)
1
2
3
4
5
6
7
8
9
10
# Content
SDG 12 Metadata: National Indicator 12.5.1
Description
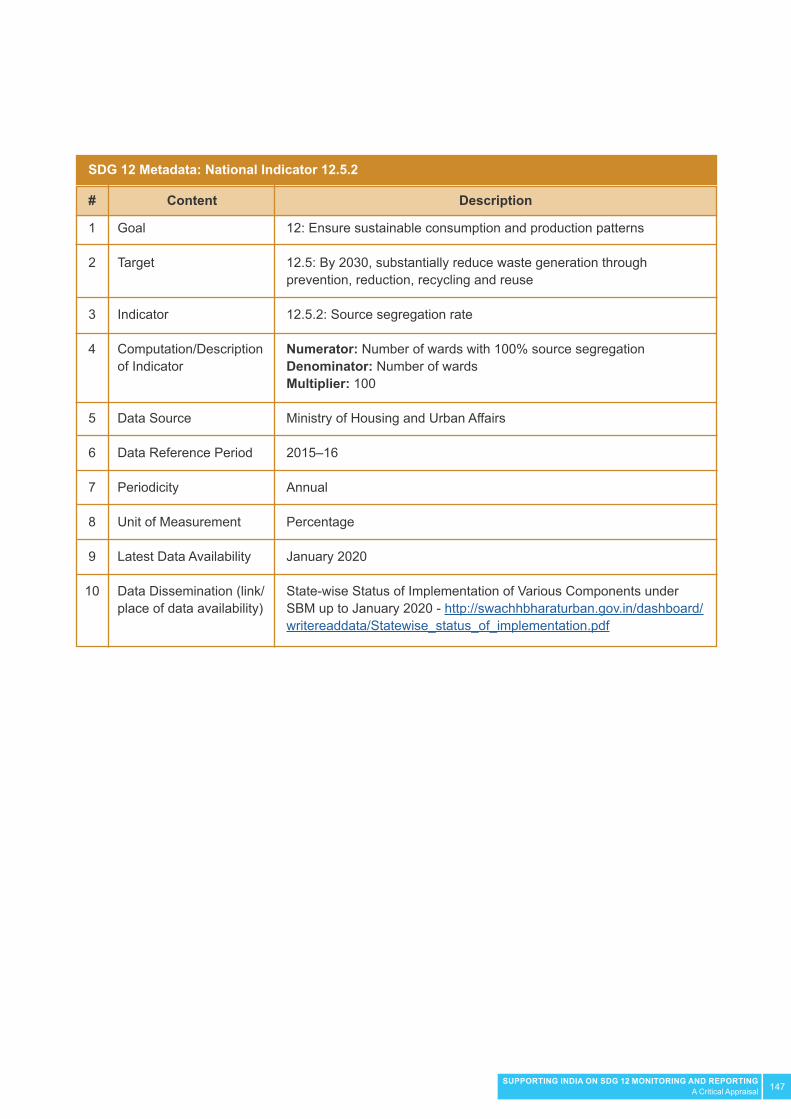
147SUPPORTING INDIA ON SDG 12 MONITORING AND REPORTINGA Critical Appraisal
12: Ensure sustainable consumption and production patterns
12.5: By 2030, substantially reduce waste generation through prevention, reduction, recycling and reuse
12.5.2: Source segregation rate
Numerator: Number of wards with 100% source segregationDenominator: Number of wards Multiplier: 100
Ministry of Housing and Urban Affairs
2015–16
Annual
Percentage
January 2020
State-wise Status of Implementation of Various Components under SBM up to January 2020 - http://swachhbharaturban.gov.in/dashboard/writereaddata/Statewise_status_of_implementation.pdf
Goal
Target
Indicator
Computation/Description of Indicator
Data Source
Data Reference Period
Periodicity
Unit of Measurement
Latest Data Availability
Data Dissemination (link/place of data availability)
1
2
3
4
5
6
7
8
9
10
# Content
SDG 12 Metadata: National Indicator 12.5.2
Description
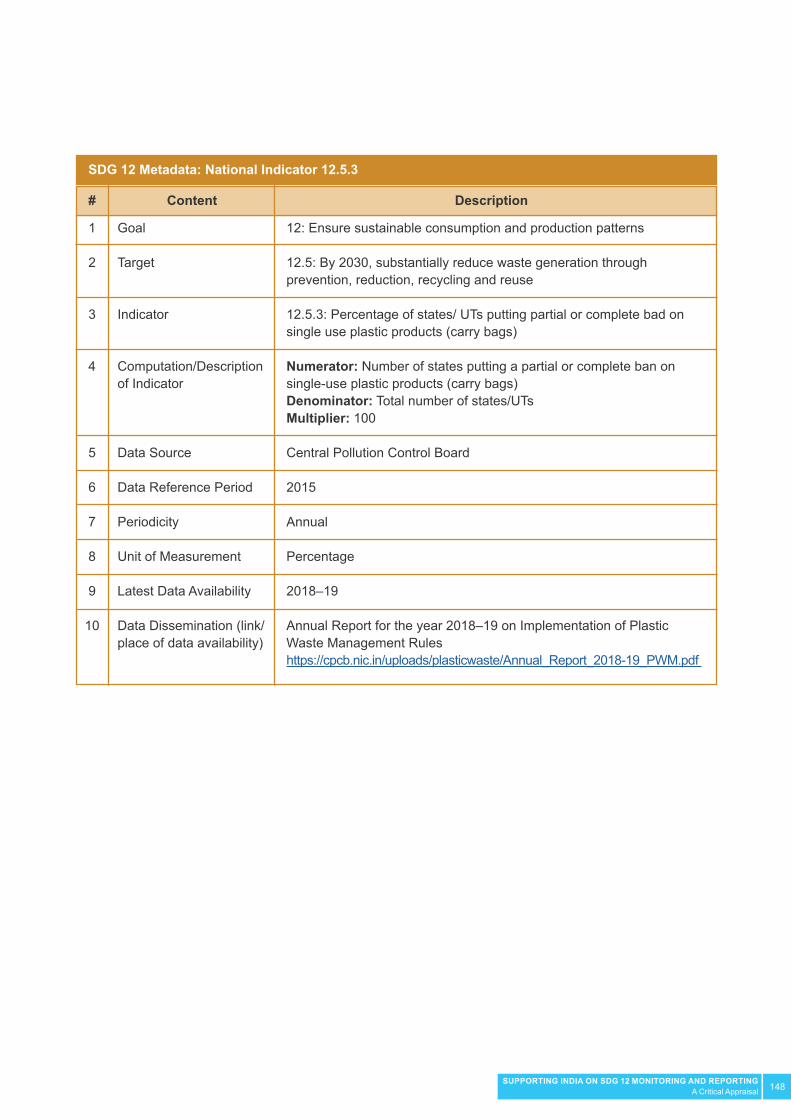
148SUPPORTING INDIA ON SDG 12 MONITORING AND REPORTINGA Critical Appraisal
12: Ensure sustainable consumption and production patterns
12.5: By 2030, substantially reduce waste generation through prevention, reduction, recycling and reuse
12.5.3: Percentage of states/ UTs putting partial or complete bad on single use plastic products (carry bags)
Numerator: Number of states putting a partial or complete ban on single-use plastic products (carry bags)Denominator: Total number of states/UTsMultiplier: 100
Central Pollution Control Board
2015
Annual
Percentage
2018–19
Annual Report for the year 2018–19 on Implementation of Plastic Waste Management Ruleshttps://cpcb.nic.in/uploads/plasticwaste/Annual_Report_2018-19_PWM.pdf
Goal
Target
Indicator
Computation/Description of Indicator
Data Source
Data Reference Period
Periodicity
Unit of Measurement
Latest Data Availability
Data Dissemination (link/place of data availability)
1
2
3
4
5
6
7
8
9
10
# Content
SDG 12 Metadata: National Indicator 12.5.3
Description

149SUPPORTING INDIA ON SDG 12 MONITORING AND REPORTINGA Critical Appraisal
12: Ensure sustainable consumption and production patterns
12.6: Encourage companies, especially large and transnational companies, to adopt sustainable practices and to integrate sustainability information into their reporting cycle
12.6.1: BRSR/ BRR compliance rate
Average of BRSR/ BRR compliance rate at NSE and BSE
For:BRSR/ BRR compliance rate at NSE:Numerator: Number of BRSRs/ BRRs Submitted to NSEDenominator: Number of BRSRs/ BRRs to be Submitted to NSEMultiplier: Nil
BRSR/ BRR compliance rate at BSE:Numerator: Number of BRSRs/ BRRs Submitted to BSEDenominator: Number of BRSRs/ BRRs to be Submitted to BSEMultiplier: Nil
MCA and SEBI
2015
Annual
Unitless
2019-20
The responses will have to be collected as the information is not yet available on public domain.
Goal
Target
Indicator
Computation/Description of Indicator
Data Source
Data Reference Period
Periodicity
Unit of Measurement
Latest Data Availability
Data Dissemination (link/place of data availability)
1
2
3
4
5
6
7
8
9
10
# Content
SDG 12 Metadata: National Indicator 12.6.1
Description
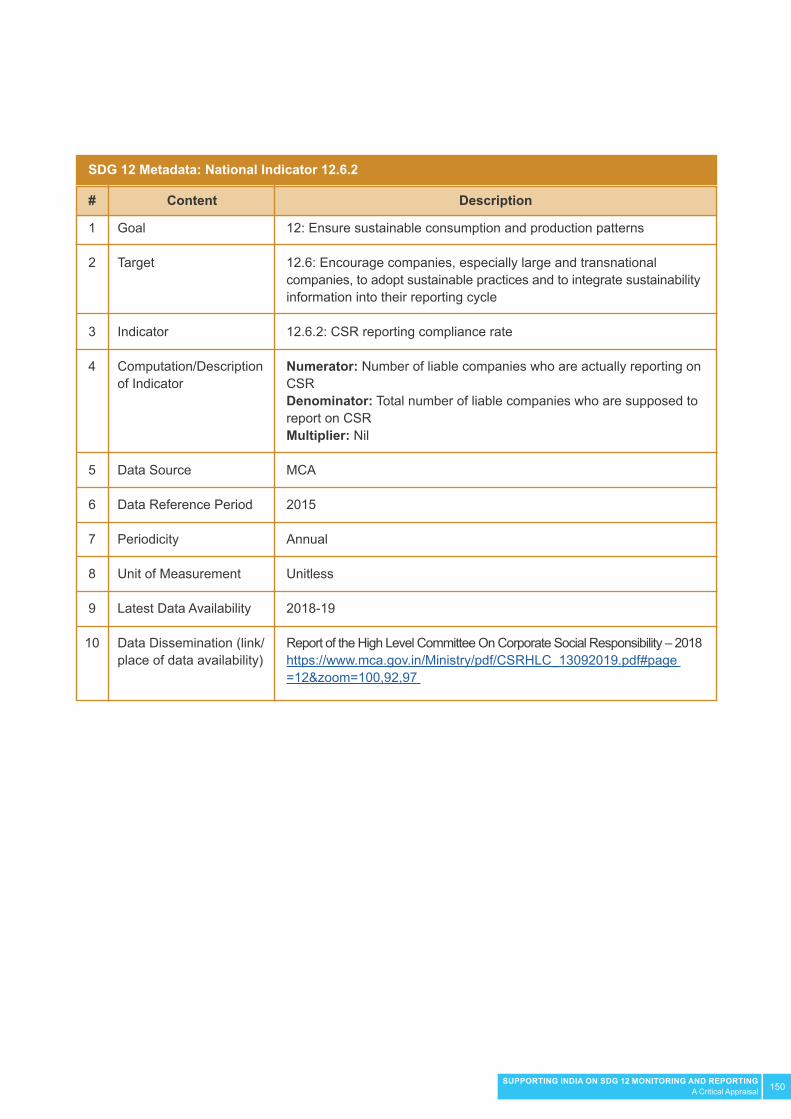
150SUPPORTING INDIA ON SDG 12 MONITORING AND REPORTINGA Critical Appraisal
12: Ensure sustainable consumption and production patterns
12.6: Encourage companies, especially large and transnational companies, to adopt sustainable practices and to integrate sustainability information into their reporting cycle
12.6.2: CSR reporting compliance rate
Numerator: Number of liable companies who are actually reporting on CSRDenominator: Total number of liable companies who are supposed to report on CSRMultiplier: Nil
MCA
2015
Annual
Unitless
2018-19
Report of the High Level Committee On Corporate Social Responsibility – 2018https://www.mca.gov.in/Ministry/pdf/CSRHLC_13092019.pdf#page =12&zoom=100,92,97
Goal
Target
Indicator
Computation/Description of Indicator
Data Source
Data Reference Period
Periodicity
Unit of Measurement
Latest Data Availability
Data Dissemination (link/place of data availability)
1
2
3
4
5
6
7
8
9
10
# Content
SDG 12 Metadata: National Indicator 12.6.2
Description

151SUPPORTING INDIA ON SDG 12 MONITORING AND REPORTINGA Critical Appraisal
12: Ensure sustainable consumption and production patterns
12.7: Promote public procurement practices that are sustainable, in accordance with national policies and priorities
12.7.1: Degree of SPP at the national levelNumerator: Sum of conducive regulatory framework, practical support, purchasing criteria, monitoring system and percentage of sustainable purchase of priority products/services
Denominator: NilMultiplier: 1 or 0 (depending on whether there is a national policy or not)
Ministry of Finance
2015–16
Annual
Unitless (index)
2019
To be collected by MOF through questionnaire
Goal
Target
Indicator
Computation/Description of Indicator
Data Source
Data Reference Period
Periodicity
Unit of Measurement
Latest Data Availability
Data Dissemination (link/place of data availability)
1
2
3
4
5
6
7
8
9
10
# Content
SDG 12 Metadata: National Indicator 12.7.1
Description

152SUPPORTING INDIA ON SDG 12 MONITORING AND REPORTINGA Critical Appraisal
12: Ensure sustainable consumption and production patterns
12.7: Promote public procurement practices that are sustainable in accordance with national policies and priorities
12.7.2: Degree of SPP at state levels(To be calculated for individual states)
Numerator: Sum of conducive regulatory framework, practical support, purchasing criteria, monitoring system and percentage of sustainable purchase of priority products/servicesDenominator: NilMultiplier: 1 or 0 (depending on whether there is a state policy or not)
State Finance Departments
2015–16
Annual
Unitless (index)
2019
To be collected by MOF through questionnaire
Goal
Target
Indicator
Computation/Description of Indicator
Data Source
Data Reference Period
Periodicity
Unit of Measurement
Latest Data Availability
Data Dissemination (link/place of data availability)
1
2
3
4
5
6
7
8
9
10
# Content
SDG 12 Metadata: National Indicator 12.7.2
Description
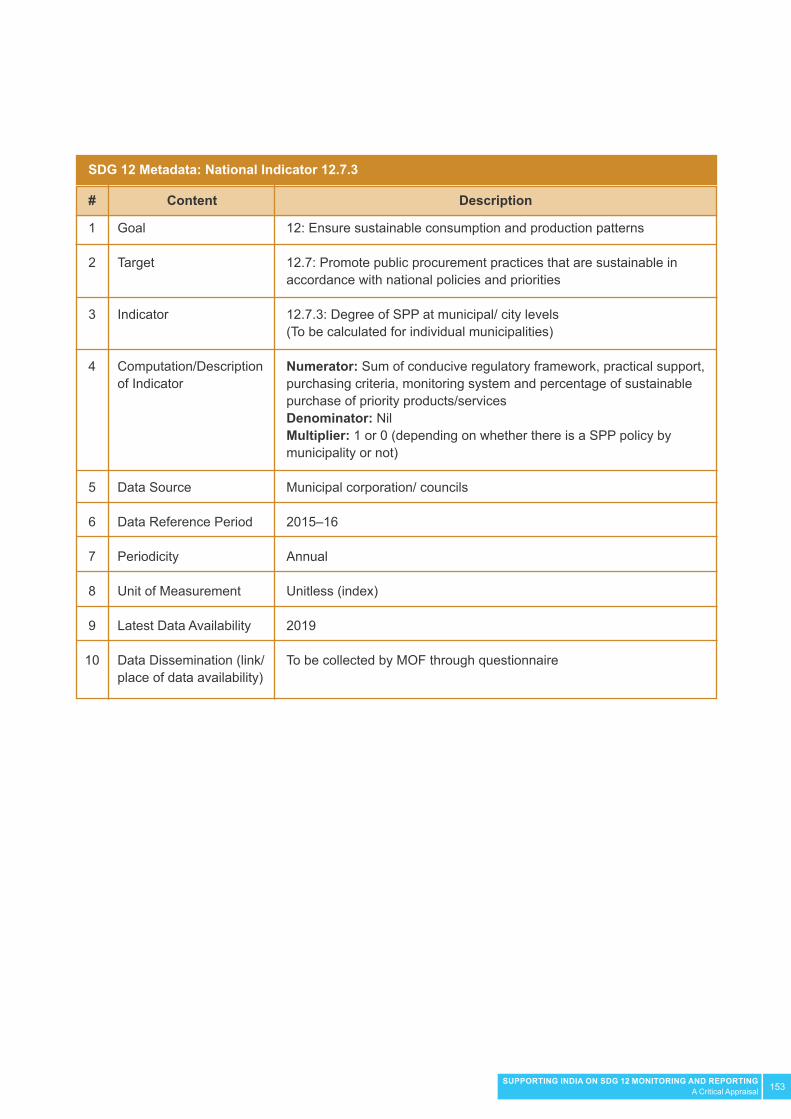
153SUPPORTING INDIA ON SDG 12 MONITORING AND REPORTINGA Critical Appraisal
12: Ensure sustainable consumption and production patterns
12.7: Promote public procurement practices that are sustainable in accordance with national policies and priorities
12.7.3: Degree of SPP at municipal/ city levels(To be calculated for individual municipalities)
Numerator: Sum of conducive regulatory framework, practical support, purchasing criteria, monitoring system and percentage of sustainable purchase of priority products/servicesDenominator: NilMultiplier: 1 or 0 (depending on whether there is a SPP policy by municipality or not)
Municipal corporation/ councils
2015–16
Annual
Unitless (index)
2019
To be collected by MOF through questionnaire
Goal
Target
Indicator
Computation/Description of Indicator
Data Source
Data Reference Period
Periodicity
Unit of Measurement
Latest Data Availability
Data Dissemination (link/place of data availability)
1
2
3
4
5
6
7
8
9
10
# Content
SDG 12 Metadata: National Indicator 12.7.3
Description
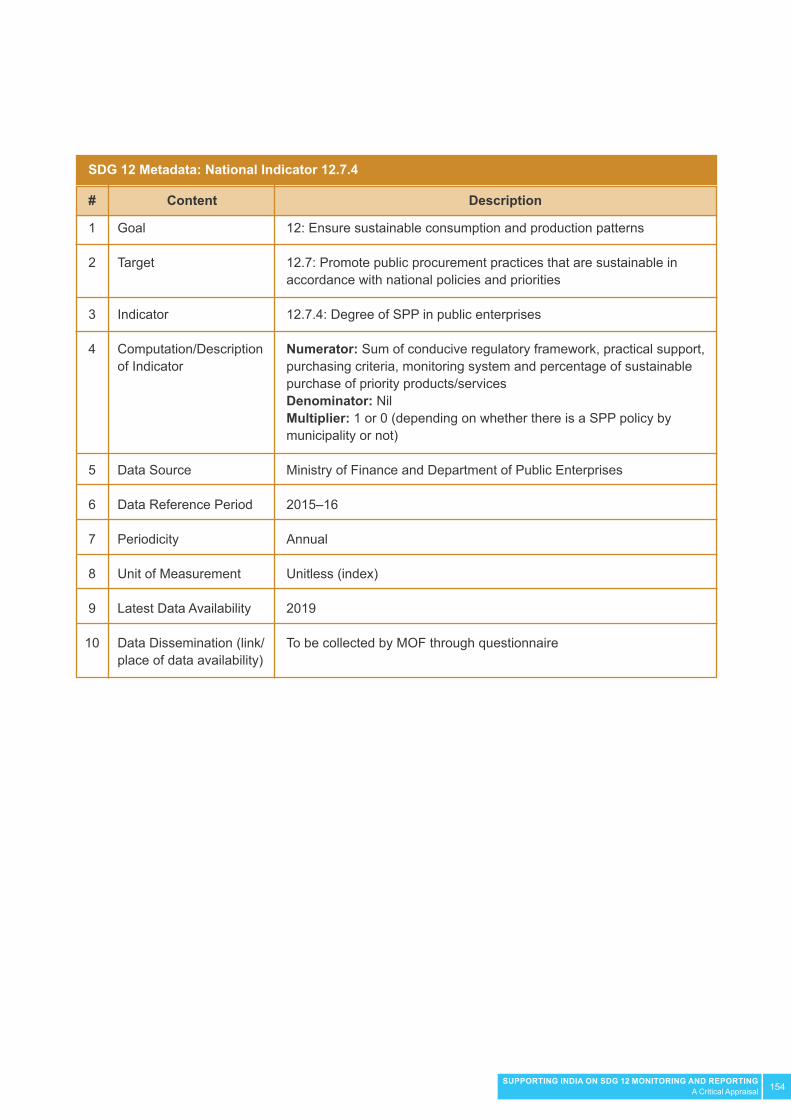
154SUPPORTING INDIA ON SDG 12 MONITORING AND REPORTINGA Critical Appraisal
12: Ensure sustainable consumption and production patterns
12.7: Promote public procurement practices that are sustainable in accordance with national policies and priorities
12.7.4: Degree of SPP in public enterprises
Numerator: Sum of conducive regulatory framework, practical support, purchasing criteria, monitoring system and percentage of sustainable purchase of priority products/servicesDenominator: NilMultiplier: 1 or 0 (depending on whether there is a SPP policy by municipality or not)
Ministry of Finance and Department of Public Enterprises
2015–16
Annual
Unitless (index)
2019
To be collected by MOF through questionnaire
Goal
Target
Indicator
Computation/Description of Indicator
Data Source
Data Reference Period
Periodicity
Unit of Measurement
Latest Data Availability
Data Dissemination (link/place of data availability)
1
2
3
4
5
6
7
8
9
10
# Content
SDG 12 Metadata: National Indicator 12.7.4
Description
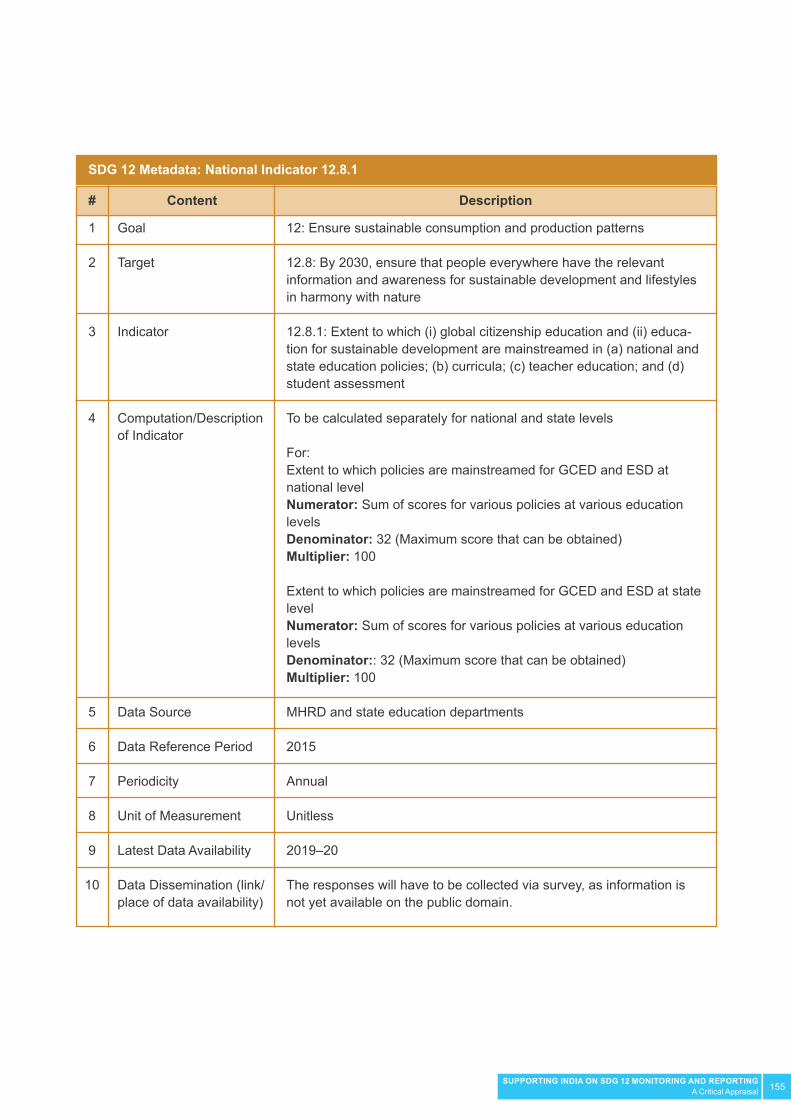
155SUPPORTING INDIA ON SDG 12 MONITORING AND REPORTINGA Critical Appraisal
12: Ensure sustainable consumption and production patterns
12.8: By 2030, ensure that people everywhere have the relevant information and awareness for sustainable development and lifestyles in harmony with nature
12.8.1: Extent to which (i) global citizenship education and (ii) educa-tion for sustainable development are mainstreamed in (a) national and state education policies; (b) curricula; (c) teacher education; and (d) student assessment
To be calculated separately for national and state levels
For:Extent to which policies are mainstreamed for GCED and ESD at national level Numerator: Sum of scores for various policies at various education levelsDenominator: 32 (Maximum score that can be obtained)Multiplier: 100
Extent to which policies are mainstreamed for GCED and ESD at state level Numerator: Sum of scores for various policies at various education levelsDenominator:: 32 (Maximum score that can be obtained)Multiplier: 100
MHRD and state education departments
2015
Annual
Unitless
2019–20
The responses will have to be collected via survey, as information is not yet available on the public domain.
Goal
Target
Indicator
Computation/Description of Indicator
Data Source
Data Reference Period
Periodicity
Unit of Measurement
Latest Data Availability
Data Dissemination (link/place of data availability)
1
2
3
4
5
6
7
8
9
10
# Content
SDG 12 Metadata: National Indicator 12.8.1
Description
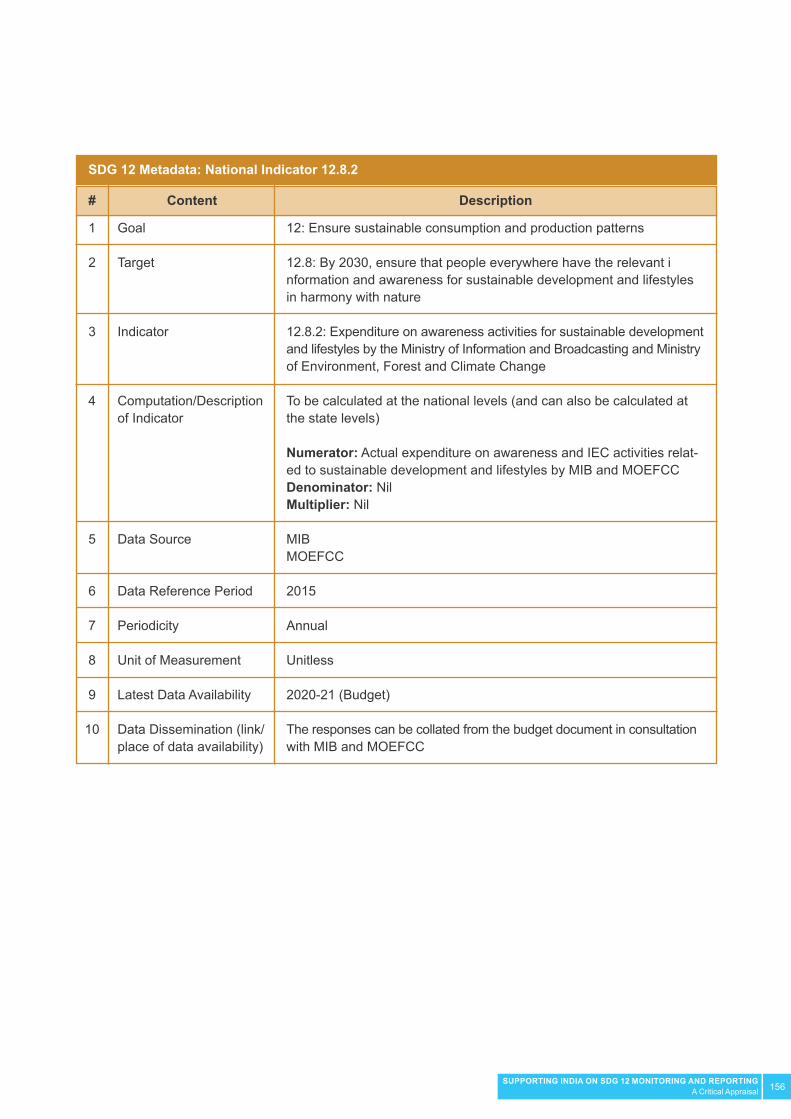
156SUPPORTING INDIA ON SDG 12 MONITORING AND REPORTINGA Critical Appraisal
12: Ensure sustainable consumption and production patterns
12.8: By 2030, ensure that people everywhere have the relevant information and awareness for sustainable development and lifestyles in harmony with nature
12.8.2: Expenditure on awareness activities for sustainable development and lifestyles by the Ministry of Information and Broadcasting and Ministry of Environment, Forest and Climate Change
To be calculated at the national levels (and can also be calculated at the state levels) Numerator: Actual expenditure on awareness and IEC activities relat-ed to sustainable development and lifestyles by MIB and MOEFCCDenominator: NilMultiplier: Nil
MIB MOEFCC
2015
Annual
Unitless
2020-21 (Budget)
The responses can be collated from the budget document in consultation with MIB and MOEFCC
Goal
Target
Indicator
Computation/Description of Indicator
Data Source
Data Reference Period
Periodicity
Unit of Measurement
Latest Data Availability
Data Dissemination (link/place of data availability)
1
2
3
4
5
6
7
8
9
10
# Content
SDG 12 Metadata: National Indicator 12.8.2
Description

157SUPPORTING INDIA ON SDG 12 MONITORING AND REPORTINGA Critical Appraisal
12: Ensure sustainable consumption and production patterns
12.a: Support developing countries to strengthen their scientific and technological capacity to move towards more sustainable patterns of consumption and production
12.a.1: Amount allocated for SCP related ITEC/ SCAAP programmes of MEA
Numerator: Amount allocated for SCP related ITEC/ SCAAP programmes of MEADenominator: NilMultiplier: Nil
Ministry of External Affairs
2015
Annual
INR Crores
2020–21
The responses will have to be collected via survey as information is not yet available in the public domain.
Goal
Target
Indicator
Computation/Description of Indicator
Data Source
Data Reference Period
Periodicity
Unit of Measurement
Latest Data Availability
Data Dissemination (link/place of data availability)
1
2
3
4
5
6
7
8
9
10
# Content
SDG 12 Metadata: National Indicator 12.a.1
Description
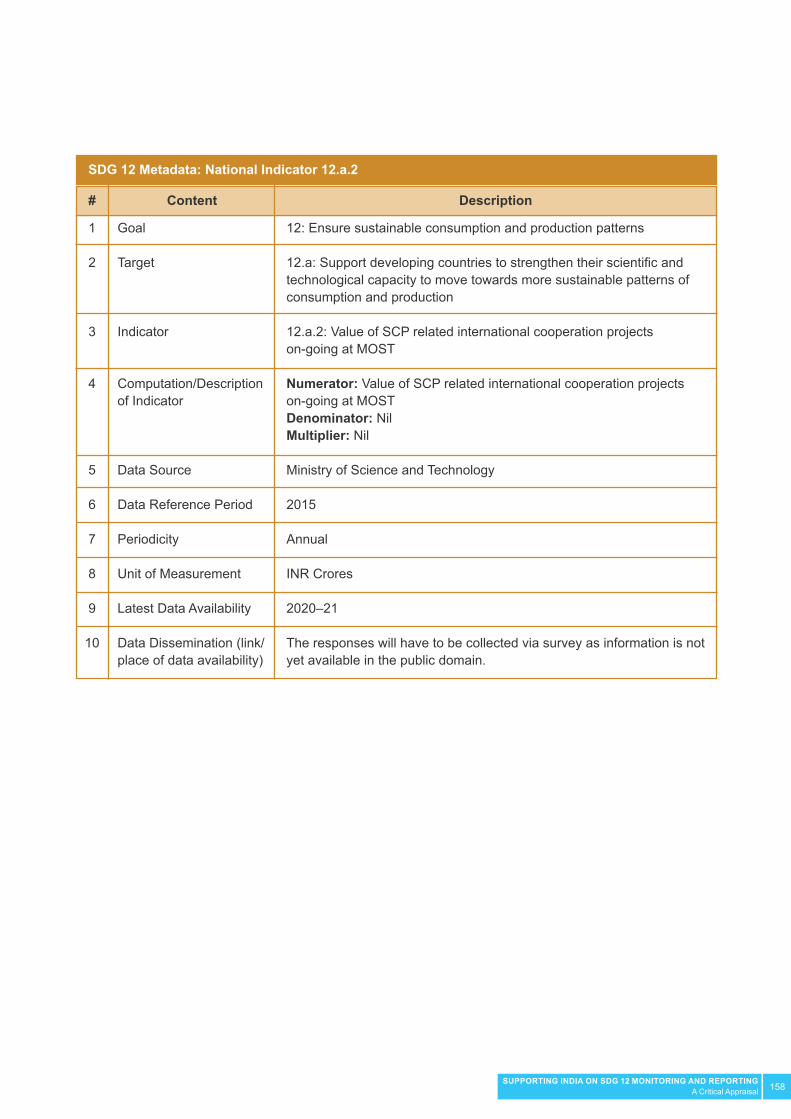
158SUPPORTING INDIA ON SDG 12 MONITORING AND REPORTINGA Critical Appraisal
12: Ensure sustainable consumption and production patterns
12.a: Support developing countries to strengthen their scientific and technological capacity to move towards more sustainable patterns of consumption and production
12.a.2: Value of SCP related international cooperation projects on-going at MOST
Numerator: Value of SCP related international cooperation projects on-going at MOSTDenominator: NilMultiplier: Nil
Ministry of Science and Technology
2015
Annual
INR Crores
2020–21
The responses will have to be collected via survey as information is not yet available in the public domain.
Goal
Target
Indicator
Computation/Description of Indicator
Data Source
Data Reference Period
Periodicity
Unit of Measurement
Latest Data Availability
Data Dissemination (link/place of data availability)
1
2
3
4
5
6
7
8
9
10
# Content
SDG 12 Metadata: National Indicator 12.a.2
Description

159SUPPORTING INDIA ON SDG 12 MONITORING AND REPORTINGA Critical Appraisal
12: Ensure sustainable consumption and production patterns
12.a: Support developing countries to strengthen their scientific and technological capacity to move towards more sustainable patterns of consumption and production
12.a.3: Union budget allocation for expenditure on research and development as a percentage of the total budget
Numerator: Allocation to MHRD for research programmes + Allocation to the Ministry of Science and TechnologyDenominator: Total Union BudgetMultiplier: 100
Ministry of Finance (national level)
2015
Annual
Percentage
2020–21
Union Budget
Goal
Target
Indicator
Computation/Description of Indicator
Data Source
Data Reference Period
Periodicity
Unit of Measurement
Latest Data Availability
Data Dissemination (link/place of data availability)
1
2
3
4
5
6
7
8
9
10
# Content
SDG 12 Metadata: National Indicator 12.a.3
Description

160SUPPORTING INDIA ON SDG 12 MONITORING AND REPORTINGA Critical Appraisal
12: Ensure sustainable consumption and production patterns
12.a: Support developing countries to strengthen their scientific and technological capacity to move towards more sustainable patterns of consumption and production
12.a.4: State budget allocation for expenditure on research and development as a percentage of total budget
Numerator: Allocation to state education department for research programmes + Allocation to the department of science and technologyDenominator: Total State BudgetMultiplier: 100
Department of Finance (state level)
2015
Annual
Percentage
2020–21
State Budgets
Goal
Target
Indicator
Computation/Description of Indicator
Data Source
Data Reference Period
Periodicity
Unit of Measurement
Latest Data Availability
Data Dissemination (link/place of data availability)
1
2
3
4
5
6
7
8
9
10
# Content
SDG 12 Metadata: National Indicator 12.a.4
Description

161SUPPORTING INDIA ON SDG 12 MONITORING AND REPORTINGA Critical Appraisal
12: Ensure sustainable consumption and production patterns
12.b: Develop and implement tools to monitor sustainable development impacts for sustainable tourism that creates jobs and promotes local culture and products
12.b.1: Sustainable tourism policy index at national and state levels
To be calculated separately for national and state levels
For:Sustainable tourism policy index at the national level: Numerator: Sum of scores for policy mechanisms for sustainable tourism or eco-tourismDenominator: 8 (Maximum score which can be obtained)Multiplier: Nil
Sustainable tourism policy index at the state level:Numerator: Sum of scores for policy mechanisms for sustainable tourism or eco-tourismDenominator: 8 (Maximum score which can be obtained)Multiplier: Nil
Ministry of Tourism MOEFCCState Departments of TourismState Forest/ Environment Departments
2015
Annual
Unitless
2020–21
The responses will have to be collected via survey as information is not available on public domain.
Goal
Target
Indicator
Computation/Description of Indicator
Data Source
Data Reference Period
Periodicity
Unit of Measurement
Latest Data Availability
Data Dissemination (link/place of data availability)
1
2
3
4
5
6
7
8
9
10
# Content
SDG 12 Metadata: National Indicator 12.b.1
Description

162SUPPORTING INDIA ON SDG 12 MONITORING AND REPORTINGA Critical Appraisal
12: Ensure sustainable consumption and production patterns
12.c: Rationalise inefficient fossil-fuel subsidies that encourage wasteful consumption by removing market distortions
12.c.1 Amount of fossil fuel subsidy on oil and natural gas per unit of GDP
12.c.1 Amount of subsidy* on oil and natural gas per unit of GDP
Numerator: Total subsidy on oil and natural gas in IndiaDenominator: Total GDP at current pricesMultiplier:1
*Key subsidy components to include• Cash transfer under the DBTL scheme (including lower GST charged)• Cash transfer under DBTK scheme (Including lower GST charged)• Natural gas subsidy scheme for North Eastern States• Diesel subsidy in drought and deficit rainfall affected areas• Customs duty exemption to power companies purchasing imported LNG• Oil Industry Development Board (OIDB) grants and subsidies on oil and gas• Expenditure towards ISPRL for strategic petroleum reserves• Customs duty exemption to import of specified goods required for petroleum operations• Differential taxes between Indian and foreign companies engaged in E&P• Capital outlay on petroleum• Income tax exemption to foreign companies involved in storage and selling of crude oil in India• Special allowances to companies engaged in E&P• Special allowance/deduction for site restoration expenses• Accelerated depreciation on specified assets for mineral oil exploration• Allowance for investment in new machinery • Allowance/Incentives for investment in cross-country pipeline network for distribution and storage facilities• Allowance/Incentives for capital expenditure on research
MOPNGMinistry of FinanceMinistry of Statistics and Program Implementation
2015–16
Annual
Share
Goal
Target
Indicator
Computation/Description of Indicator
Data Source
Data Reference Period
Periodicity
Unit of Measurement
1
2
3
4
5
6
7
8
# Content
SDG 12 Metadata: National Indicator 12.c.1
Description

163SUPPORTING INDIA ON SDG 12 MONITORING AND REPORTINGA Critical Appraisal
2020–21
http://petroleum.nic.in/sites/default/files/arep2020.pdfhttps://doe.gov.in/sites/default/files/OutcomeBudgetE2018_2019.pdf http://www.mospi.gov.in/sites/default/files/publication_reports/ES_2020_240420m.pdf
Latest Data Availability
Data Dissemination (link/place of data availability)
9
10
# Content
SDG 12 Metadata: National Indicator 12.c.1
Description

164SUPPORTING INDIA ON SDG 12 MONITORING AND REPORTINGA Critical Appraisal
12: Ensure sustainable consumption and production patterns
12.c: Rationalise inefficient fossil-fuel subsidies that encourage wasteful consumption by removing market distortions
12.c.2: Amount of fossil fuel subsidy on coal per unit of GDP
Amount of subsidy* on coal per unit of GDP
Numerator: Total subsidy on coalDenominator: Total GDP in current pricesMultiplier: 1
*Key subsidy components to include• Conservation and Safety in Coal Mines and Development of Transport Infrastructure under Coal Conservation and Development advisory Committee (CCDA)• Ministry of Coal’s Plan scheme of “Detailed Drilling in Non-CIL Blocks • Promotional (Regional) Exploration in Coal and Lignite• Coal Mines Pension Scheme • Research and Development (R&D) Programs in the Coal Sector• Environmental Measures and Subsidence Control• Concessional Custom Duty Rates on import of Coal • Income Tax exemption for the generation of power• Concessional rates Railway Freight for long distance Coal Transportation• Compensation for land acquired for coal mining purposes• State government to state owned distribution company• Concessional GST (@5%) charged on Coal
Ministry of CoalMinistry of FinanceMinistry of Statistics and Program Implementation
2015–16
Annual
Share
2017–2018
Ministry of Coal
Goal
Target
Indicator
Computation/Description of Indicator
Data Source
Data Reference Period
Periodicity
Unit of Measurement
Latest Data Availability
Data Dissemination (link/place of data availability)
1
2
3
4
5
6
7
8
9
10
# Content
SDG 12 Metadata: National Indicator 12.c.2
Description
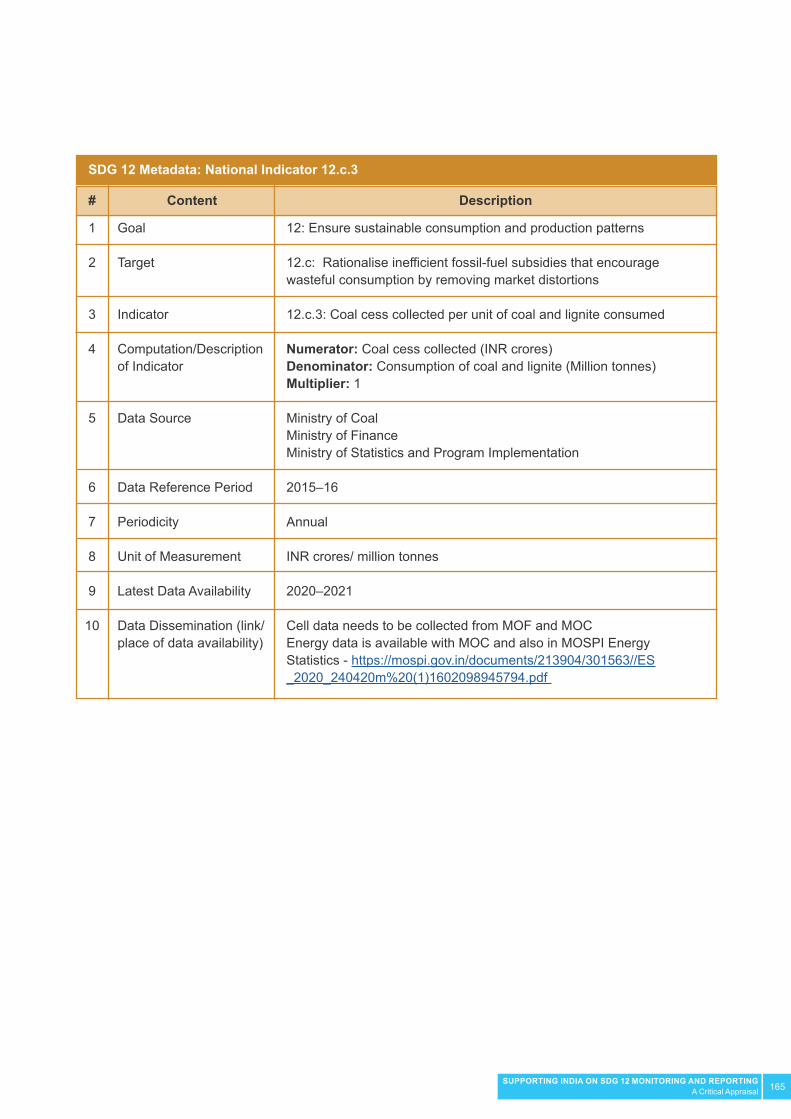
165SUPPORTING INDIA ON SDG 12 MONITORING AND REPORTINGA Critical Appraisal
12: Ensure sustainable consumption and production patterns
12.c: Rationalise inefficient fossil-fuel subsidies that encourage wasteful consumption by removing market distortions
12.c.3: Coal cess collected per unit of coal and lignite consumed
Numerator: Coal cess collected (INR crores)Denominator: Consumption of coal and lignite (Million tonnes)Multiplier: 1
Ministry of CoalMinistry of FinanceMinistry of Statistics and Program Implementation
2015–16
Annual
INR crores/ million tonnes
2020–2021
Cell data needs to be collected from MOF and MOCEnergy data is available with MOC and also in MOSPI Energy Statistics - https://mospi.gov.in/documents/213904/301563//ES_2020_240420m%20(1)1602098945794.pdf
Goal
Target
Indicator
Computation/Description of Indicator
Data Source
Data Reference Period
Periodicity
Unit of Measurement
Latest Data Availability
Data Dissemination (link/place of data availability)
1
2
3
4
5
6
7
8
9
10
# Content
SDG 12 Metadata: National Indicator 12.c.3
Description


SWITCHAsiaEUSWITCHAsiawww.switch-asia.eu