Supporting disadvantaged families...fulfilling their potential – can go as far as their talents...
64
Supporting disadvantaged families Troubled Families Programme 2015 – 2020: progress so far Presented to Parliament pursuant to Section (3) 6 of the Welfare Reform and Work Act 2016 April 2017
Transcript of Supporting disadvantaged families...fulfilling their potential – can go as far as their talents...

Supporting disadvantaged familiesTroubled Families Programme 2015 – 2020: progress so far
Presented to Parliament pursuant to Section (3) 6 of the Welfare Reform and Work Act 2016
April 2017
Supporting disadvantaged familiesTroubled Families Programme 2015 – 2020: progress so far
Presented to Parliament pursuant to Section (3) 6 of the Welfare Reform and Work Act 2016
April 2017

© Crown copyright 2017
This publication is licensed under the terms of the Open Government Licence v3.0 except where otherwise stated. To view this licence, visit nationalarchives.gov.uk/doc/open-government-licence/version/3 or write to the Information Policy Team, The National Archives, Kew, London TW9 4DU, or email: [email protected].
Where we have identified any third party copyright information you will need to obtain permission from the copyright holders concerned.
This publication is available at www.gov.uk/government/publications
Any enquiries regarding this publication should be sent to us at [email protected]
Print ISBN 9781474140751Web ISBN 9781474140768
ID P002860875 04/17
Printed on paper containing 75% recycled fibre content minimum
Printed in the UK by the Williams Lea Group on behalf of the Controller of Her Majesty’s Stationery Office

Table of contents
Foreword ..............................................................................................................................4
Introduction .........................................................................................................................6
How the government is supporting the most disadvantaged families ...........................10• Helping families........................................................................................................10
• Changing services ...................................................................................................16
• Benefiting taxpayers ................................................................................................20
The next phase of the programme ...................................................................................23
Who the families are, the problems they face and how services are helping them .......26• Key findings .............................................................................................................26
• The evaluation of the programme.............................................................................27
• Family characteristics...............................................................................................28
• Family problems ......................................................................................................29
• Service transformation .............................................................................................39
• Staff and families’ experiences of and feedback about the programme ....................44
Families on the programme and making progress ..........................................................46
Annex A: Overview of the 2015 - 2020 Troubled Families Programme evaluation .........57

4 Foreword
Foreword
This Government is determined to build a country that works for everyone. We want a fairer Britain in which everyone – even those who face huge barriers to
fulfilling their potential – can go as far as their talents and hard work will take them.
The Troubled Families Programme is at the very heart of this Government’s ambitious social reform programme. I am proud that my department will take this programme from strength to strength. I am also proud that it will play a central role in helping ensure that success in life is based on merit and not on birth or circumstance.
Local authorities and their partners through the Troubled Families Programme are already working with more than 185,000 of the most disadvantaged families in England. I have been heartened by the overwhelming support that local partnerships have continued to offer and I know they will continue to work hard to help families who need it. I want to thank them for the incredibly challenging and important work that they do with families every day.
This report demonstrates the overwhelming scale of the problems families in the programme face – worklessness, uncontrolled debt, abuse and conflict in the home, mental and physical health problems. It also shows how these families, with the help provided, are already making progress.
That includes thousands of families who have made significant and sustained progress on all of the problems they face.
The current Troubled Families Programme has learnt a lot from the strengths of the first programme which ran from 2012 to 2015. It is helping families with a much broader range of disadvantages and making sure that younger children are more likely to benefit from the whole family support on offer. This programme is also more transparent. Annual reports like this one will set out the programme’s progress and successes as well as where improvements might be needed.
However, as well as looking back on what has been achieved, it is also an opportune time for the programme to broaden its scope and seek to do more. The Government’s paper, Improving Lives: Helping Workless Families published today, sets out new and ground breaking evidence on the multiple and overlapping disadvantages experienced by workless families and the impact that this has on children and their chances later in life. It also makes the link between specific types of disadvantage – such as parental conflict and problem debt – and how they directly put children at greater risk of further problems.
The Troubled Families Programme is key to delivering better outcomes for these families and we must now ensure that it makes the most of this evidence to zero in on these priority areas in its next phase. The programme already has a focus on getting adults into work but, as the damaging effects of worklessness on families becomes more compellingly clear, it must now go further. Whilst I am pleased that, since 2015, the
5Foreword
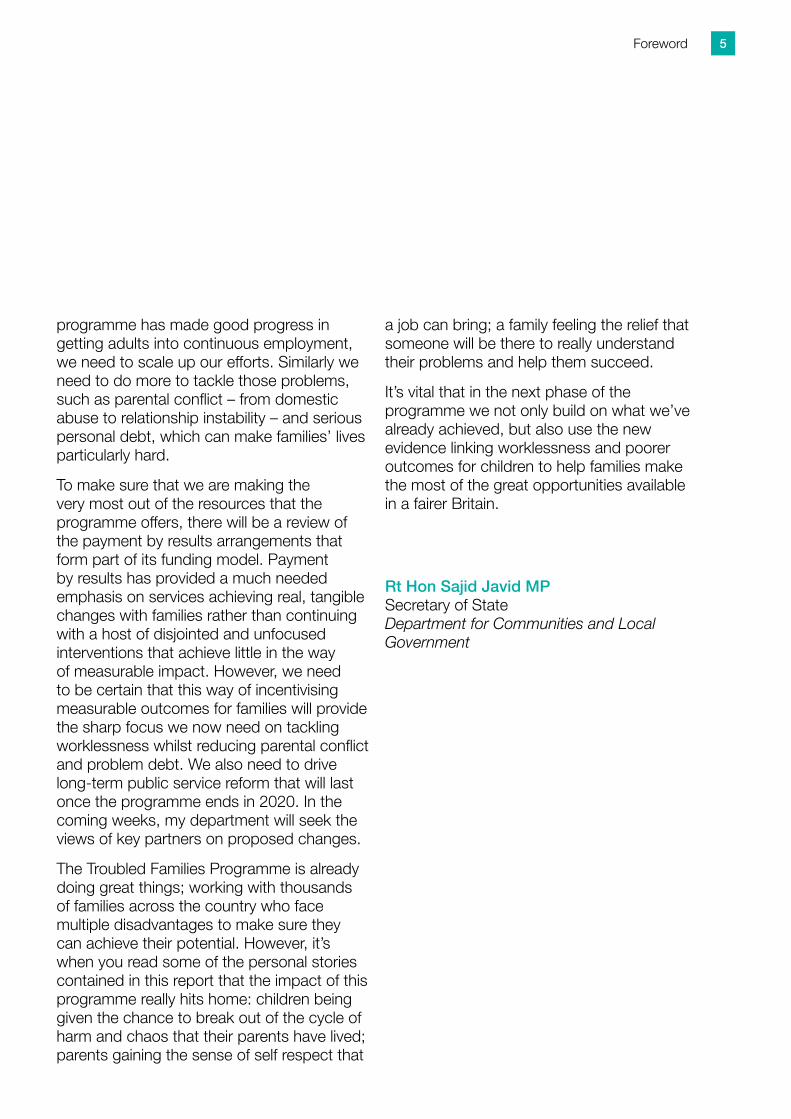
programme has made good progress in getting adults into continuous employment, we need to scale up our efforts. Similarly we need to do more to tackle those problems, such as parental conflict – from domestic abuse to relationship instability – and serious personal debt, which can make families’ lives particularly hard.
To make sure that we are making the very most out of the resources that the programme offers, there will be a review of the payment by results arrangements that form part of its funding model. Payment by results has provided a much needed emphasis on services achieving real, tangible changes with families rather than continuing with a host of disjointed and unfocused interventions that achieve little in the way of measurable impact. However, we need to be certain that this way of incentivising measurable outcomes for families will provide the sharp focus we now need on tackling worklessness whilst reducing parental conflict and problem debt. We also need to drive long-term public service reform that will last once the programme ends in 2020. In the coming weeks, my department will seek the views of key partners on proposed changes.
The Troubled Families Programme is already doing great things; working with thousands of families across the country who face multiple disadvantages to make sure they can achieve their potential. However, it’s when you read some of the personal stories contained in this report that the impact of this programme really hits home: children being given the chance to break out of the cycle of harm and chaos that their parents have lived; parents gaining the sense of self respect that
a job can bring; a family feeling the relief that someone will be there to really understand their problems and help them succeed.
It’s vital that in the next phase of the programme we not only build on what we’ve already achieved, but also use the new evidence linking worklessness and poorer outcomes for children to help families make the most of the great opportunities available in a fairer Britain.
Rt Hon Sajid Javid MP Secretary of State Department for Communities and Local Government

6 Introduction
Introduction
The Troubled Families Programme is reaching families with multiple and complex problems – including parents who do not see work as an achievable goal for them and children who are at serious risk of a lifetime of disadvantage, from cradle to grave. In the past, these families have often been failed by services which have tried to respond to the one problem that presented itself to that service at that particular time – whether it was truancy, domestic violence, anti-social behaviour or unemployment – but failed because they have been incapable of dealing with the many inter-related problems the family is facing.
Thanks to the Troubled Families Programme, these families’ lives are changing for the better. All across the country, workers are being trained in ‘whole family working’ and are using their skills, passion and commitment to support families to aspire to and achieve a better future. Services are coming together across organisational boundaries, overcoming operational and cultural barriers, and – despite the continued budgetary pressures – using this programme to achieve sustainable change for the most disadvantaged families in their communities.
This is the first annual report of the current Troubled Families Programme and meets our new statutory duty1 to report annually on performance. The current programme was rolled out across all upper tier local authorities in England in April 2015, and replaced the first programme which had been in place since 2012. The current programme has three main aims:
For families
• To achieve significant and sustained progress with up to 400,000 families with multiple, high-cost problems by 2020;
• To make work an ambition for all troubled families.
For local services
• To transform the way that public services work with families with multiple problems to take an integrated, ‘whole family approach’;
• To help reduce demand for reactive services.
For the taxpayer
• To demonstrate that this way of working results in lower costs and savings for the taxpayer.
1 As part of the Welfare Reform and Work Act 2016 <http://www.legislation.gov.uk/ukpga/2016/7/contents/enacted>

7Introduction
The first part of this report sets out how the current Troubled Families Programme operates, including how it has built on the strengths of the first programme and how it will continue to evolve and improve in the future. The latter part of the report looks at early data from the current programme’s ongoing evaluation. Although it is too early in the life of the current programme to report on its impact, the data available so far does describe the families on the programme, the problems they face, and how services are helping them. This report also includes the latest performance information on the number of families who have already made significant progress to resolve those problems.
The programme is funded until 2020, with the evaluation set to measure outcomes up to 2022, but this first report shows there is already evidence that the programme is having a positive effect on both families and services. In particular:
• in more than 9,100 families, one or more family members has come off out of work benefits and achieved continuous employment2;
• nearly 44,000 families have made significant and sustained progress on all of their problems;
• parents and carers report that keyworkers are giving them practical support and the confidence to tackle their problems;
• staff say the programme is delivering long-term change with families, as well as encouraging professionals from different agencies to work together and provide better support to families.
The first Troubled Families Programme – evaluationThe early achievements of the current programme very much build on the success of the first programme. Launched in 2012 and allocated £448 million funding, by May 2015 more than 116,000 families had seen significant improvements – children back into school, reduced youth crime and anti-social behaviour, and for more than 18,000 of those families, adults in work.
The first programme’s evaluation found that it had succeeded in positively changing the way local authorities help families with complex problems – expanding the ‘family intervention’ workforce, improving the way data is used locally to both identify and support families, and driving partnership working between different local services3.
2 26 weeks out of previous 30 weeks for Jobseeker’s Allowance claimants, 13 weeks for other out of work benefits. For more information see: Department for Communities and Local Government ‘The Financial Framework for the expanded Troubled Families Programme’ <https://www.gov.uk/government/publications/financial-framework-for-the-expanded-troubled-families-programme>
3 Clarissa White and Laurie Day ‘National Evaluation of the Troubled Families Programme – Process Evaluation Final Report’ (Department for Communities and Local Government, October 2016) <https://www.gov.uk/government/uploads/system/uploads/attachment_data/file/560500/Troubled_Families_Evaluation_Process_Evaluation.pdf>

8 Introduction
The first programme’s evaluation also found that the programme’s new approach to family intervention was appreciated by the families themselves – 76% of families said the difference their keyworker had made to their lives was more than the difference made by previous levels of support, and 72% of main carers said they felt better about the future than they had before the involvement of their keyworker4.
One of the evaluation’s strands was an impact study undertaken by the National Institute for Economic and Social Research (NIESR). Their study was unable to attribute positive outcomes achieved with families on the programme in employment, school attendance or youth crime to the Troubled Families Programme specifically. Regrettably the public commentary on the evaluation focused almost exclusively on this finding and glossed over important caveats. With what we know about the study it is perhaps unsurprising that it reached the conclusions it did.
The NIESR report concedes issues with data quality (“major limitations”) and with the characteristics of the comparison group of families not on the programme; no account could be taken of potential differing levels of domestic abuse or anti-social behaviour between the groups and the researchers acknowledged the risk of wider service reform engendered by the programme causing ‘contamination’ in the comparison group.
In retrospect we can also see that measurements of impact achieved with families for this study were taken too early and within too narrow time frames. As the full evaluation states, these were families with an average of 7 significant problems (e.g. mental and physical ill health, domestic abuse, debt) in addition to the problems triggering programme eligibility. It also reports that local areas prioritised their most needy families early on in the programme, recognising that they would take longer to achieve positive outcomes and including adult family members who were far from the labour market. The full evaluation also reports very favourably about the transformative impact that dedicated Employment Advisers placed into local troubled family teams from job centres had on the work with workless adults. These advisers were not in place and making an impact with families until after the periods in which NIESR measured benefit and employment outcomes.
Measurable improvements for such disadvantaged families can not be expected from day one of receiving support. The outcome the programme sought on education was that full attendance (average of fewer than 15% unauthorised absences) needed to be sustained for all school age children in a family for three full terms. It’s not surprising that measurements taken at a maximum of three terms from the date families were first engaged on the programme did not provide
4 Susan Purdon and Caroline Bryson ‘Evaluation of the Troubled Families Programme – Technical Report: impact evaluation using survey data’ (Department for Communities and Local Government, October 2016) <https://www.gov.uk/government/uploads/system/uploads/attachment_data/file/560503/Troubled_Families_Evaluation_Survey_Impact.pdf>

9Introduction
the significant attributable levels of impact which NIESR sought to detect.
Recognising that the assessment of impact may have occurred too early, our new evaluation provides an ongoing assessment of outcomes in the current Troubled Families Programme using national datasets at six monthly intervals throughout the course of the programme.
The current Troubled Families Programme – evaluationLessons from the first programme and evaluation have influenced the design of the current one. For example, the evaluation has been improved so that it measures outcomes for families for up to five years after intervention, rather than for just 18 months. In addition, the first evaluation reported only once and only after the programme had ended. For the current programme, the Government has committed to annual reports of progress – of which this is the first – and results will be regularly fed back to local authorities so the findings can influence how services develop and improve over the course of the programme and beyond.
This first annual report shows that the current Troubled Families Programme is reaching the families who most need help and that it is has built on the strengths and learning from the first programme. Looking ahead to the next phase of the programme, we plan to continue the evolution to ensure that the programme uses the newest evidence, set out in Improving Lives: Helping Workless Families, to support families most effectively.

10 How the Government is supporting the most disadvantaged families
How the Government is supporting the most disadvantaged families
The Government’s approach to supporting the most disadvantaged families has changed over the lifetime of both the first (2012 – 2015) and the current (2015 – 2020) Troubled Families Programmes. Such evolution is to be expected and should be encouraged – the world does not stand still and the programme should be constantly learning and improving.
However, while the programme is always adapting and improving, there are a number of core principles which are in place to make sure the programme delivers for families, for local services, and for the taxpayer.
Helping familiesThe current programme’s objective for families – to make significant and sustained progress against all their multiple problems and make work an ambition for all families – has been underpinned in practice by promoting both a ‘whole family approach’ and an unrelenting focus on outcomes.
Whole-family approach and family interventionBoth programmes have operated on the premise that public services have previously failed families who have multiple problems because they operate in a siloed and mostly reactive fashion. Services have tended to respond to a problem that individual family members exhibit, without either understanding or tackling underlying root causes or the inter-connectedness of other family members’ problems.
Instead, the Troubled Families Programmes have encouraged services to take a ‘whole family approach’, to work with families with multiple problems by identifying the underlying and interlinked problems that a family face, and dealing with them as a whole in order to achieve lasting change in that family.

11How the Government is supporting the most disadvantaged families
Co-ordinating support
In Sheffield, a couple were struggling to cope with the complex medical and behavioural needs of their disabled 5 year old daughter. This had an adverse effect on their relationship. Their mental and emotional wellbeing was suffering, as was that of their other daughter. The dad’s depression and anxiety meant he did not work, and the mum was unable to look for a job as she was called into school on a daily basis to help with the care of her disabled daughter. Additional stress was caused by problem debt, which meant the family were at risk of losing their tenancy.
Sheffield Council’s Troubled Families Team ensured that one keyworker co-ordinated a package of support for the whole family. This included liaising with medical professionals to help the school confidently meet the daughter’s needs. Specialist employment advice, delivered through a Troubled Families Employment Adviser, helped the mum to access training, secure a job, and ultimately, to start her own small business. Support was offered to the dad to address his mental health problems and he was also given advice on how he could move towards employment. Through debt advice and guidance around financial planning, the family’s debt has since been reduced and their home is now secure.

12 How the Government is supporting the most disadvantaged families
The programme encourages a ‘family intervention’ approach that has a positive evidence base from evaluations of earlier intensive family intervention projects5. The family intervention model is of a nominated keyworker being assigned to each family who gets an understanding of all the inter-connected problems and of the family dynamics. S/he adopts a persistent and assertive approach, establishing a relationship with the family and working closely with them to ‘grip’ the family and their problems, as well as the professionals or agencies that will typically have been dipping in and out of the family’s lives.
“The moment they stepped in all the pressure was off me as a mum of a teenage girl who was caught up in [child sexual exploitation]. So much had been happening in our lives for months – appointments and people judging – and with 3 other children to try to keep life as normal as possible for. This became easier with [keyworker’s] intervention and [keyworker] became my shoulder to cry on, my friend and advisor – always there no matter what time of day. I honestly don’t know where we would have been today without [the service] because the other agencies just seemed to battle against each other.
5 See, for example: Clarissa White et al ‘Family Intervention Projects – An evaluation of their Design, Set up and Early Outcomes’ (National Centre for Social Research, 2008) <http://dera.ioe.ac.uk/8578/1/acf44f.pdf>
At first I was reluctant for their help but I am so glad I did – they supported me 100% and I was very happy to get my daughters life back on track.”– Mum in Leeds
The keyworker agrees a plan of action, with clear outcomes, together with both the family and relevant services. S/he will offer both practical assistance in the home (routines, domestic tasks) and help the family address problems such as ill health, debt and addiction, bringing in specialist services where necessary.

13How the Government is supporting the most disadvantaged families
Tackling interconnected problems
In West Sussex, a couple were struggling with alcohol and drug addiction that led to their involvement in crime, anti-social behaviour and domestic violence. This ultimately resulted in the breakdown of the parental relationship and the son was put on a Child Protection Plan due to concerns about his welfare. A designated keyworker provided intensive support to the whole family to tackle the range of problems they faced, including bringing in specialist services to help with the parents’ addiction and mental health needs. Regular home visits gave practical assistance and helped to avoid the threat of relapse. Frequent contact with the keyworker ensured that the mum was attending alcohol and substance misuse appointments and not drinking at home.
By adopting a joined-up approach to the range of problems the family faced, the mum is no longer drinking and has cut ties with the people who were a negative influence. This has led to a reduction in the other associated problems. Appropriate care is now being provided for the son, who is thriving at nursery school. The mum is now keen to get back into employment, and one-to-one support is helping her to identify work and training opportunities.
Focus on outcomesIn the past, services have sometimes provided help to families but had little or no focus on achieving real change. In contrast, both the first and current Troubled Families Programmes have had a relentless focus on measurably improved outcomes for families. The first programme focused on three nationally set outcomes:
• reducing crime and anti-social behaviour;
• progressing adults along the path to work; and
• getting children back into school.
However, it emerged early on that this did not reflect the true complexity of families’ lives. In fact, Family Monitoring Data gathered as part of the evaluation of the first programme found that families had on average nine different serious problems before joining the programme6. These related to employment, education, crime, domestic abuse, housing, child protection, poor parenting, addiction or health.
6 Laurie Day et al ‘National Evaluation of the Troubled Families Programme – Final Synthesis Report’ (Department for Communities and Local Government, October 2016) <https://www.gov.uk/government/uploads/system/uploads/attachment_data/file/560499/Troubled_Families_Evaluation_Synthesis_Report.pdf>

14 How the Government is supporting the most disadvantaged families
To reflect this complexity, the current programme was designed alongside local authorities to bring families with a broader set of headline problems onto the programme. These include:
• Parents or children involved in crime or anti-social behaviour;
• Children who have not been attending school regularly;
• Children who need help: children of all ages, who need help, are identified as in need or are subject to a Child Protection Plan;
• Adults out of work or at risk of financial exclusion, or young people at risk of worklessness;
• Families affected by domestic violence and abuse; and
• Parents or children with a range of health problems (including drug or alcohol abuse).
The current programme has moved away from centrally prescribed outcomes which do not always recognise when families are ready to help themselves and be independent of support from services. Instead, it gives local authorities the flexibility to identify ambitious outcomes against which families must make significant and sustained progress. While based on the programme’s national principles as set out in the current programme’s Financial Framework7, these outcomes must reflect local priorities, be agreed with local partners and be set out in a local Troubled Families Outcomes Plan.
Sustaining better outcomes
Peterborough has established ‘Helping Hands’, a pilot project with a voluntary sector partner so that, once intensive keyworker support has helped the family to make progress, a volunteer will continue to work with the family for up to a year to help them sustain the improvements. Volunteers receive full training on subjects like child protection, and are equipped with techniques to be able to help families with ongoing problems, spanning areas such as mental health, domestic abuse, debt, parenting and unemployment.
7 Department for Communities and Local Government ‘The Financial Framework for the expanded Troubled Families Programme’ <https://www.gov.uk/government/publications/financial-framework-for-the-expanded-troubled-families-programme>

15How the Government is supporting the most disadvantaged families
Alongside these locally set outcomes, the programme has always placed a particular emphasis on employment, reflecting the transformative effect it can have on a family’s life. As well as setting a national outcome for continuous employment, the Department for Work and Pensions (DWP) and the Department for Communities and Local Government (DCLG) invested additional resource for the latter half of the first programme – seconding 150 Troubled Families Employment Advisers from Jobcentre Plus into local authority teams
to work directly with families and improve keyworkers’ own capacity to support families into employment.8
A key finding from the evaluation of the first programme was the importance of employment and how it can help to resolve a families other problems9. It also highlighted that the introduction of Troubled Families Employment Advisers – increased to more than 300 under the current programme – had provided a new and important dimension to family intervention10.
Overcoming barriers to employment
In Barking & Dagenham, an unemployed, single mum was suffering from depression following an abusive relationship, and living with her five year old child in temporary accommodation.
Her keyworker encouraged her to do a ‘better off calculation’, which compared her income on benefits with what she could earn by working. The mum, who was receiving Employment Support Allowance because of her mental health problems, discovered she could increase her income if she worked 16 hours per week. With support from her keyworker, the mum built her confidence, learned how to prepare a CV and complete application forms. She successfully applied for a part-time job at a local supermarket. Her keyworker also helped her create a payment plan so she could pay off her rent arrears and remain focused on the positives of staying in work.
8 ‘National evaluation of the Troubled Families Programme 2015 – 2020: service transformation – case study research: part 1’ (Ipsos MORI, February 2017) <https://www.gov.uk/government/publications/national-evaluation-of-the-troubled-families-programme-2015-to-2020>
9 Laurie Day et al ‘National Evaluation of the Troubled Families Programme – Final Synthesis Report’ (Department for Communities and Local Government, October 2016) <https://www.gov.uk/government/uploads/system/uploads/attachment_data/file/560499/Troubled_Families_Evaluation_Synthesis_Report.pdf>
10 Laurie Day et al ‘National Evaluation of the Troubled Families Programme – Final Synthesis Report’ (Department for Communities and Local Government, October 2016) <https://www.gov.uk/government/uploads/system/uploads/attachment_data/file/560499/Troubled_Families_Evaluation_Synthesis_Report.pdf>

16 How the Government is supporting the most disadvantaged families
Changing servicesBoth phases of the programme have set out to transform the way that public services work with families with multiple problems so they take an integrated whole family approach and reduce demand for reactive services. For the family, transforming services means there should no longer be a host of unconnected services and professionals circling them with their own assessments, thresholds, appointments and measures; nor that a family ends up in A&E rather than using routine GP services.
Investing in service transformationThe funding of both programmes has been structured to incentivise local authorities’ investment in transformed services for families. As well as payment for the results achieved with families, both programmes have also provided up-front funding per family11 to help local authorities invest in the workforce and systems changes needed to improve services for families.
There is an even more explicit focus on service transformation in the current programme. This reflects the fact that, at a time of significant cost pressures on public services, services cannot afford to continue to take a piecemeal, reactive approach to the most complex, and costly, families. Services need to invest now if an integrated, whole family approach to early intervention with
11 Department for Communities and Local Government ‘The Financial Framework for the expanded Troubled Families Programme’ <https://www.gov.uk/government/publications/financial-framework-for-the-expanded-troubled-families-programme>
12 Department for Communities and Local Government ‘The Financial Framework for the expanded Troubled Families Programme’ <https://www.gov.uk/government/publications/financial-framework-for-the-expanded-troubled-families-programme>
families is to be the norm by the time this programme comes to an end in 2020.
As a result, the current programme introduced an up-front annual Service Transformation Grant. For most areas this amounts to £200,000 a year for local authorities and their partners to invest in further workforce development, commissioning of services, and developing the information systems needed to deliver better outcomes for families.
Because the programme has not mandated a particular way that services should ‘transform’, instead setting out a broad framework co-designed with local authorities12, a huge array of innovative multi-agency practice has been developed to best fit local contexts.

17How the Government is supporting the most disadvantaged families
Data analysis and better commissioning
Hartlepool’s Troubled Families Team reviewed ‘looked after children’ cases to identify the common problems families faced and root causes. They found the same four featured in a significant proportion of families: domestic violence; grief and loss; substance misuse and mental health/emotional wellbeing. The local authority used this insight to ensure their staff received specialist training via commissioned services enabling them to identify and intervene with these problems at an early stage. As a result, they can offer targeted, early support to families and prevent the need for children to enter care.
By using predictive analytics tools alongside their comprehensive ‘Think Family’ database, Bristol is able to identify families who are at risk from a range of problems, and are therefore most likely to experience difficulties if early intervention is not provided. The local authority used its Troubled Families Service Transformation Grant to successfully launch a number of predictive models, for example, to help them identify children at risk of sexual exploitation.
18 How the Government is supporting the most disadvantaged families
Multi-agency working
Hackney has used the programme’s Service Transformation Grant to second specialist practitioners into family teams, including a clinical psychologist, a drugs and alcohol abuse worker, health and adult mental health practitioners and a probation worker. These practitioners are keyworkers who are also able to provide wider professional advice to other family teams. They help to develop stronger partnership working between the Troubled Families team as part of the Early Help Service and their home agency. In addition, hackney also fund a dedicated domestic abuse service, RISE, which is co-located with the family teams.
The Father Figures Programme is delivered by the Staffordshire Troubled Families Team in partnership with the National Offender Management Service and Brinsford Prison. The programme works with young fathers and fathers-to-be who are in custody. It provides bespoke one-to-one support for the fathers and their families, additional child development and behaviour sessions, and support both pre and post release. Father Figures helps families to improve their parenting as well as strengthen attachment and family links. Through the programme, many young men have been able to turn away from their previous involvement in crime, and access training or employment.
Barnet has created a new Emotional Wellbeing Team within its Family Services, which will identify young people with moderate mental health problems, such as self harm, anxiety or depression, and offer support at the earliest opportunity. The team was established following a consultation with young people that identified parental separation, serious illness and bullying as common triggers for mental ill health and will support the Troubled Families Programme through the Early Help Service. A Senior Practitioner, funded by Barnet’s Clinical Commissioning Group, will oversee four trainee Psychological Wellbeing Practitioners, following a successful bid for funding from Health Education England.
19How the Government is supporting the most disadvantaged families
The current programme evaluation, which sets out more detail of these local models, found that areas had embraced service transformation, but that they were at different levels of maturity and were finding some partners harder to engage than others13.
As a result, DCLG has worked with local authorities, police and other partners to develop a new tool which helps them assess where their transformation is in relation to others, engage new partners including academy schools and health providers, and identify where improvements need to be made. This Early Help Service Transformation Maturity Model was launched at the National Police Chief Council’s national conference in November 2016 and, in order to make it more widely available, has today been re-published alongside this report14.
“We cannot provide improved services to our communities without working with other agencies to share our different knowledge and expertise. The most important measure of whether a service is working well or needs reform is the experience of the individual or family using that service – which is why this is a key measure in the maturity model. The model means we can now work with partners to assess how well
we are doing, and where we need to improve further. It will also allow us to identify – and share – good practice from around the country.”– Deputy Chief Constable Simon Nickless, Cleveland Police and troubled families portfolio lead for the National Police Chiefs Council
Sharing good practiceAs well as providing funding for service transformation and the tools to identify where improvements are needed, the Troubled Families Programme is seeking to provide additional support by developing and sharing best practice in areas where local partnerships have indicated it is needed.
Information sharing, for example, can be challenging, but is absolutely necessary for whole family working. Not only does it allow the most complex and costly families to be identified, by using data to cross reference the demand they are placing on different services, information sharing also means problems can be tackled more effectively. For example, persistent truancy is easier to address when the keyworker knows that a parent has very poor mental health and is struggling to get out of the house themselves.
As the current programme’s evaluation is already showing, many areas have made great progress with data sharing, but others
13 See ‘Service Transformation’ p34
14 Department for Communities and Local Government ‘Troubled Families Early Help Service Transformation Maturity Model’ https://www.gov.uk/government/publications/troubled-families-early-help-service-transformation-maturity-model
20 How the Government is supporting the most disadvantaged families
still have a way to go15 and the evaluation has found that information sharing with health partners has been a problem for some16. For this reason, DCLG is working with the Department of Health, local authorities and health bodies in Staffordshire and Oldham to test new approaches to sharing health information. The learning from this work will be published later this year and, as with all best practice, shared via the programme’s peer network and monthly open days.
Workforce development and the promotion of whole family working across multiple workforces – including developing joint training and shared performance objectives – is another challenge with which multiple local partnerships are grappling. Building on the work the Core Cities have done to develop a consistent approach to training across workforces in multiple agencies, DCLG is working with the Early Intervention Foundation to develop a visual representation of the core activities undertaken by keyworkers. This will inform DCLG’s further work on workforce development which will be a priority over the next year.
Demand for good practice has also been identified through a series of policy and practice reviews carried out by DCLG into areas such as parenting and employment. The findings of these reviews have been used to develop improved support for local teams. For example, we have asked the Early Intervention Foundation to produce a guide which offers advice on how best to commission effective parenting support for families as part of the Troubled Families Programme.
Benefiting taxpayersBy delivering better services and better outcomes for families, the Troubled Families Programme can produce cost savings for the taxpayer. Demonstrating this value for money is therefore another important objective for the programme.
15 Evaluators found mixed progress on data sharing, see ‘Data sharing and monitoring’ p36
16 See ‘Multi agency working’ p35

21How the Government is supporting the most disadvantaged families
Providing value for money
A family from Wakefield was identified as a priority case by the local Troubled Families Team due to numerous concerns including reports of anti-social behaviour, poor school attendance and frequent domestic abuse related police call-outs. The family was struggling to manage debts and they were financially insecure as a result.
The keyworker agreed a robust and detailed action plan with the family, with clear timescales, actions and outcomes. This co-ordinated help led to a significant reduction in the number of costly interventions needed. The dad participated in a paid work placement and took steps to improve the family’s financial situation. There haven’t been any further incidents of anti-social behaviour and the children’s school attendance has improved. In turn, this has meant no further costly involvement from children’s social care, education welfare, or the police. Together, this represents a significant financial saving to the taxpayer; prior to them engaging with the programme, the cost of reacting to this family‘s problems was £13,000 over 6 months.
Newcastle is working closely with the voluntary and community sector to draw on expertise to deliver the Troubled Families Programme in their area. Voluntary sector partners (Barnardos, Action for Children and Children North East) provide over 50 hours of intensive training accredited at NVQ Level 2 to a network of Family Support Volunteers, who work alongside keyworkers to offer support to vulnerable families. Not only does this improve the support available and deliver better outcomes for families from within their own communities, the volunteers are also receiving valuable experience which can help them move towards sustainable employment. This builds overall community resilience and ensures families have on-going support post-intervention that draws on community resources, rather than on the taxpayer.
Demonstrating value for moneyIn order to assure taxpayers that the first programme’s budget was being spent as intended, payment by results claims were subject to internal audit by the claiming local authority and signed off by their Chief Executive. A further 10% of all claims were audited by DCLG who carried out a series of random spot checks across all authorities.
The current programme has built on and strengthened the audit process for payment by results claims. Each local authority is now subject to two spot checks during the lifetime of the programme. The spot checks now include a visit by a DCLG expert, as well as scrutiny of local authority data systems, and these visits include an interview of local authority keyworkers to assess local practice.

22 How the Government is supporting the most disadvantaged families
Calculating the costs and benefitsBoth programmes have aimed to provide taxpayers with an estimate of the fiscal costs and benefits provided and, since the first programme, DCLG has made improvements to this element of data collection and the evaluation.
In particular, the department has worked in collaboration with local authorities to develop a Troubled Families Information System. Using unit cost data developed by New Economy Manchester, this system links locally inputted programme costs and outcomes to nationally held administrative data sets and will produce estimates of the costs, for example of crime and truancy, as well as the benefits of the programme for each participating local authority.
The system allows local authorities to see how much they are spending on their services, and the outcomes and benefits associated with this spend. It also estimates how much public money was saved for each pound spent on interventions, and reports the estimates back to local authorities through an online tool.
To support the launch of this new system in early 2016, DCLG provided guidance and training so that all local authorities understand how to use the system and the importance of entering good quality data. Further good practice open days and support sessions are being developed to further improve the quality of data submitted by local authorities.

23The next phase of the programme
The next phase of the programme
The Government’s paper, Improving Lives: Helping Workless Families published today sets out new evidence on the multiple and overlapping disadvantages experienced by workless families and the significantly poorer outcomes faced by their children. The Government will pursue a programme of work that helps families into employment, supports families to maintain strong relationships and ensures that children can benefit from the greater stability and wellbeing a happy, working household offers.
The Troubled Families Programme is key to delivering better outcomes for complex and disadvantaged families, and is already achieving success with the families it works with. However, we must ensure that the programme makes the most of the new evidence on the impact of worklessness on a family and the multiple associated disadvantages, particularly family conflict and personal debt. This must be done without diminishing the other vital work the programme does across the many other problems that families experience. Ensuring alignment of the programme with Children’s Social Care reform will also continue to be a priority as we add to Government’s understanding of the type of support that is effective for families with complex needs, and which avoids the need for Children’s Social Care to get involved later down the line.
As part of the next phase of the programme, we will also conduct a review of the programme’s payment by results model. Payment by results has provided a much needed focus on real, tangible changes and outcomes being made in families rather
than an offer of help and sympathy with little long lasting impact. However, we need to be certain that it will provide the sharp focus we need on parental worklessness. We also need to be certain it will deliver long-term service reform after the programme ends in 2020. Over the coming months we will seek the views of local authorities delivering the Troubled Families Programme and the voluntary and community organisations whose role is also critical for future success on what changes should be made.
Review of the programme’s payment modelWe will conduct a review of the current payment by results funding model to ensure that the payment model supports the achievement of these objectives. We will seek the views of local authorities on the options for reform. Alternative funding models will be assessed against three reform principles:
1. Sustainable service reform and integration (beyond the lifetime of the programme) – this is crucial if we are to use the next phase of the Troubled Families Programme as a major delivery vehicle to drive improvements in joined up working and better use of evidence locally to achieve better outcomes for disadvantaged families;
2. Enhanced focus on parental worklessness – the Troubled Families Programme already aims to make work an ambition for all troubled families. But in the light of the new evidence set out in Improving Lives: Helping Workless Families,

24 The next phase of the programme
of the particularly adverse impacts that growing up in a workless family has on child outcomes, we want to ensure that the payment model enhances the programme’s focus on this area; and
3. Deliverability by local authorities – we want to design a payment model that is clear, practical and incentivises change and collaboration with the broader public sector without introducing new administrative burdens. This is crucial to securing continued buy-in from all local authorities and their participation in the next phase of the Troubled Families Programme.
Alongside this review of the payment model, we will also consider a number of further changes to the programme.
Strengthened funding requirements to drive service reformWe will seek the views of local authorities on new funding requirements to ensure that local Troubled Families Programmes use the programme’s investment to drive sustainable system change. The new funding requirements could, for example, require local authorities to:
• invest in key areas like data systems and workforce development;
• ensure optimum involvement of the voluntary and community sectors in delivering services to families;
• establish strategic partnerships with Jobcentre Plus in their area to improve employment outcomes for the most disadvantaged;
• commission evidence-based interventions in priority areas, such as parental conflict and parenting; and
• participate fully in our ongoing national evaluation, using our cost savings calculator to identify and monitor fiscal benefits.
We would seek to underpin any new funding requirements with a new approach to audit and monitoring that builds on our existing spot checks process.
Prioritisation of familiesAt present, every family has to have at least two of the following problems to be eligible for support under the Troubled Families Programme: worklessness and financial exclusion (including debt); truancy and poor school attendance; crime and anti-social behaviour; domestic abuse; children who need help (including Children in Need); mental and physical health issues. These will remain the entry criteria for the programme, but we will be encouraging local authorities to prioritise families experiencing worklessness, and two of the main disadvantages associated with worklessness: parental conflict (including domestic violence, which features in many cases of Children in Need), and serious personal debt, as set out in Improving Lives: Helping Workless Families. We will seek views on this as part of our review of the payment model.

25The next phase of the programme
Greater focus on worklessnessIn addition to identifying how the payment model can better incentivise local authorities to achieve employment outcome for workless families and ensuring that workless families are prioritised for support, we will improve existing operational partnerships with Jobcentre Plus which have already been made through dedicated Troubled Families Employment Advisers. This will include testing new approaches to improve access to employment and wider support for parents in troubled families who are claiming Employment and Support Allowance and who are in the ‘work related activity group’. As part of this, we will improve information sharing between Jobcentre Plus and local authorities so that these parents are able to benefit from earlier access to support from the programme.
We will seek the views of local authorities on the options for reform with a view to introducing changes to shape the next phase of the Troubled Families Programme by Autumn 2017.
26 Who the families are, the problems they face and how services are helping them
Who the families are, the problems they face and how services are helping them
The data from national administrative datasets, locally-collected data, survey data and findings from qualitative research gathered for the evaluation are included below to show the characteristics of troubled families, the problems they face and complexity of these problems, as well as how services are being delivered locally.
Key findings• The current Troubled Families
Programme is engaging with families who have very different characteristics to those nationally. Compared to nationally, families on the programme are typically:
- larger in size;
- contain more dependent children;
- more likely to be lone parent families;
- more likely to have had their first child at a younger age; and
- more likely to live in social housing, than those nationally.
• The programme is reaching families with a wide range of problems including education, health, domestic abuse, crime and anti-social behaviour, those experiencing financial exclusion and those with children who need help.
• Compared to national figures, findings from the National Impact Study and Family Progress Data show that:
- adults on the programme are six times more likely to be claiming benefits;
- children are twice as likely to be persistently absent in the last school year;
- a quarter of troubled families have had a family member involved in an incident of domestic abuse in the last year.
• Over two in five troubled families are workless, nearly a third of families have a child who is persistently absent from education and just over half of families have a child with a special educational need.
• Initial analysis looking at the interrelationships between each of the six headline problems showed that being a troubled family was strongly associated with financial exclusion, education and attendance strongly related to children needing help, and domestic abuse strongly related to crime and anti-social behaviour and children needing help.

27Who the families are, the problems they face and how services are helping them
The evaluation of the programmeThe evaluation of the first programme aimed to understand what difference the programme made to the outcomes and experiences of families, the impact it had on outcomes, how the programme changed local delivery approaches as well as measuring monetary savings. Whilst the objectives of the national evaluation of the current programme are similar, the current evaluation has been designed to learn the lessons from the evaluation of the first Troubled Families Programme.
The evaluation of the current programme aims to measure the changes in outcomes for families on the programme, understand how family intervention achieves such change for families, assess the level and form of service transformation in local authorities, and identify the fiscal benefits arising from the programme.
The evaluation comprises a large-scale tracking of family outcomes using multiple national government datasets and locally collected data, a longitudinal survey of 1,145 families on the programme, an annual survey of staff delivering the programme, and case study research in nine local authorities using a qualitative approach17.
Throughout the programme, family outcomes are tracked twice-yearly using national datasets and local data to understand the degree to which families have changed post-intervention. By Spring 2017, we will have our first reliable set of information about post-intervention outcomes for families on the
17 See Annex A from p49 for an overview of the Troubled Families Programme evaluation structure/design
programme, though it might be expected to take time before change is apparent. Future annual reports will include data on post-intervention outcomes.
Findings from the national evaluation of the current Troubled Families Programme (2015-2020) to date have been included in this report. These early findings show the characteristics of families on the programme, problems they experience on entry to the programme, and how the programme is being delivered locally, as well as how the programme is influencing services for families.
In order to provide national comparisons, indicative national prevalence estimates for the relevant reference population have been taken from national statistics produced by other Government departments including the Department for Education, Department for Work and Pensions and Ministry of Justice. These national comparison figures are for England unless otherwise stated.
Data gathered on familiesThe tracking of troubled families is carried out using nationally-held administrative data on offending, educational attendance and attainment, Children in Need and benefit and employment (the National Impact Study). This data is supplemented by local data gathered directly from local authorities which fills in the gaps in the administrative data and includes, for example, anti-social behaviour and domestic abuse (Family Progress Data). The majority of the data reported here includes incidents in the twelve month period

28 Who the families are, the problems they face and how services are helping them
prior to intervention, i.e. before they started on the Troubled Families Programme, and has been used to show the characteristics of families on the programme. Where the data relates to a different time period, this is stated. Alongside these datasets, data from the Family Survey has been used to show the prevalence of problems amongst troubled families prior to joining the programme which are not typically collected in national datasets. Each dataset contains the following:
• National Impact Study (NIS): Includes families who joined the programme between September 2014 and December 2015, data on 62,000 families (187,000 individuals)
• Family Progress Data (FPD): Includes families who joined the programme between September 2014 and December 2015, data on 59,000 families (231,000 individuals)18
• Family Survey: Includes families who joined the programme between October 2015 and July 2016, interviews conducted with 1,145 main carers in troubled families and 596 interviews conducted with a young person (aged 11-21) in the family19
18 See ‘National evaluation of the Troubled Families Programme 2015 – 2020: family outcomes – national and local datasets: part 1’ (Department for Communities and Local Government, March 2017) for the complete NIS and FPD baseline findings report <https://www.gov.uk/government/publications/national-evaluation-of-the-troubled-families-programme-2015-to-2020>
19 See ‘National evaluation of the Troubled Families Programme 2015 – 2020: family outcomes – family survey: part 1’ (Ipsos MORI, February 2017) for the complete family survey baseline report <https://www.gov.uk/government/publications/national-evaluation-of-the-troubled-families-programme-2015-to-2020>
Family characteristicsThe current Troubled Families Programme is engaging with families who have very different characteristics to those nationally. Table 1 shows key characteristics of troubled families compared to the national picture.Table 1: Characteristics of troubled families compared to the national population
Troubled Families
National Population
Ethnicity: White 81.3%* 85.4%Adults gender: Female 64.7%* 51.1%Children’s gender: Female 46.3%* 48.8%Proportion of families with at least one child aged under 5
40.1%* 17.4%
Average number of family members
4.0* 2.9
Average number of dependent children in a family
2.2* 1.7
Proportion of lone parent families
60.4%* 16.0%
Mother’s age at first child (yrs.) 22** 29***Living in social housing 60%** 18%
Source: Data sourced from the National Impact Study.
*The figures relate to the characteristics at the start of intervention, where indicated ** data is taken from the Family Survey
National prevalence figures refer to England, where indicated *** data refers to the UK
Note: National averages have been included to compare the families on the programme to families in the general population, but it should be noted that the programme is likely to include a higher proportion of lone parents because it targets families at risk of financial exclusion.

29Who the families are, the problems they face and how services are helping them
Troubled families are typically larger in size, contain more dependent children and are more likely to be lone parent families than families nationally. They are also more likely to have had their first child at a younger age and live in social housing than those nationally.
Family problemsTroubled families, on entry to the programme, generally have a higher prevalence of problems than families nationally. This indicates that the programme is targeting and engaging with those families it set out to help. The evaluation tracks these families on over sixty key measures within the six headline problems of the programme:
• Worklessness and financial exclusion
• Education and school attendance
• Children who need help
• Crime and anti-social behaviour
• Domestic abuse
• Health
Worklessness and financial exclusion20
Data from the National Impact Study in Table 2 shows how adults in troubled families are more likely to be unemployed, workless or claiming benefits than adults in the national population, in the year prior to intervention.
Table 2: Comparison of the prevalence of financial exclusion and worklessness between troubled families and the national population
Troubled Families
National Prevalence
% of families with one adult claiming benefits**
80.3% n/a****
% of families who are workless*
44.6% 14.9%***
% of adults claiming benefits
71.4% 11.8%
% of families with an adult claiming Employment and Support Allowance (ESA) or Incapacity Benefits (IB)*
34.9% n/a****
% of adults claiming ESA or IB
27.3% 5.8%
Source: Data soured from the National Impact Study
* This is a proxy figure for workless. Workless families are defined as those households where no adult is employed. The figure represents any family where all adults 18‑64 years‑old were on Jobseeker’s Allowance (JSA), Employment and Support Allowance (ESA)/Incapacity Benefit (IB) or Income Support (IS) in the year before intervention and matched to the Work and Pensions Longitudinal Study, all other troubled families figures based on all adults aged 18‑64 matched to the Work and Pensions Longitudinal Study.
**Benefits included in this measure are Jobseeker’s Allowance (JSA), Employment and Support Allowance (ESA)/Incapacity Benefit (IB), Income Support (IS), Disability Living Allowance (DLA) and Carer’s Allowance (CA).
***The National Prevalence figure here is household level and taken from the Family Resources Survey data.
****National Prevalence data is only available for individuals, not families.
Over three in five families have an adult who is claiming benefits and over two in five troubled families are workless. Adults in troubled families are six times more likely
20 Those at risk of financial exclusion include: those on out of work benefits; young adults with few or no qualifications and not in employment, education or training (NEET); and families with problematic forms and levels of debt.
30 Who the families are, the problems they face and how services are helping them
than adults in the general population to be claiming benefits than adults nationally, as well as being over four times more likely to be claiming Employment and Support Allowance or Incapacity Benefit than adults in the general population.
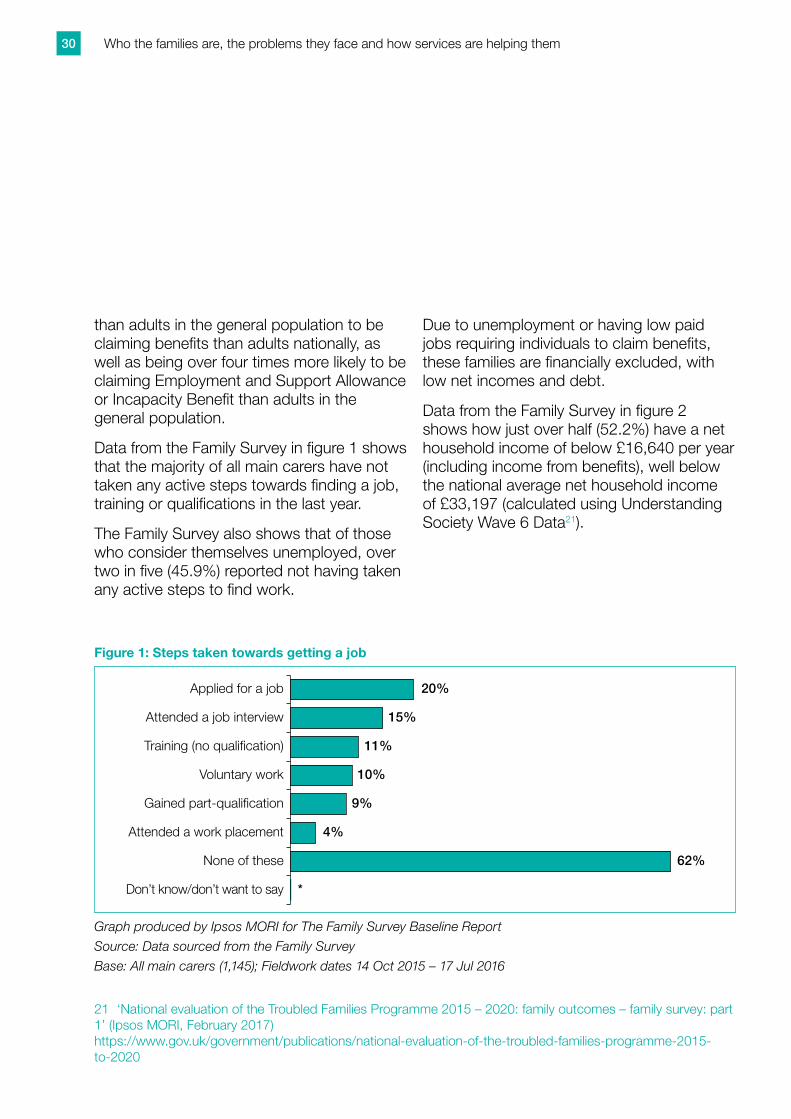
Data from the Family Survey in figure 1 shows that the majority of all main carers have not taken any active steps towards finding a job, training or qualifications in the last year.
The Family Survey also shows that of those who consider themselves unemployed, over two in five (45.9%) reported not having taken any active steps to find work.
Due to unemployment or having low paid jobs requiring individuals to claim benefits, these families are financially excluded, with low net incomes and debt.
Data from the Family Survey in figure 2 shows how just over half (52.2%) have a net household income of below £16,640 per year (including income from benefits), well below the national average net household income of £33,197 (calculated using Understanding Society Wave 6 Data21).
Figure 1: Steps taken towards getting a job
Applied for a job
Attended a job interview
Voluntary work
Attended a work placement
None of these
Don’t know/don’t want to say
20%
15%
11%
10%
9%
4%
62%
*
Graph produced by Ipsos MORI for The Family Survey Baseline Report
Source: Data sourced from the Family Survey
Base: All main carers (1,145); Fieldwork dates 14 Oct 2015 – 17 Jul 2016
21 ‘National evaluation of the Troubled Families Programme 2015 – 2020: family outcomes – family survey: part 1’ (Ipsos MORI, February 2017) https://www.gov.uk/government/publications/national-evaluation-of-the-troubled-families-programme-2015-to-2020

31Who the families are, the problems they face and how services are helping them
Figure 2: Households total take home income
Nothing Under£5,200
5%
1%
11%
18% 18%
10%
8%7% 7%
15%
£5,200–£7,799
£7,800–£12,479
£12,480–£16,639
£16,640–£19,759
£19,760–£23,919
£23,920–£29,119
£29,210–more
Don’t know/don’t want
to say
Graph produced by Ipsos MORI for The Family Survey Baseline Report
Source: Data sourced from the Family Survey
Base: All main carers (1,145); Fieldwork dates 14 Oct 2015 – 17 Jul 2016
Figure 3: How well main carers in troubled families are managing financially
National %
Doing alright
Living comfortably
Just about getting by
Don’t know/don’t want to say
6% 30
25% 35
42% 25
16% 7
11% 3
* *
Graph produced by Ipsos MORI for The Family Survey Baseline Report
Source: Data sourced from the Family Survey, National data from Understanding Society Wave 5 (Jan 2013 – Dec 2014)
Base: All main carers (1,145); Fieldwork dates 14 Oct 2015 – 17 Jul 2016

32 Who the families are, the problems they face and how services are helping them
Data from the Family Survey in figure 3 shows that over two in five families describe themselves as just about getting by financially (41.9%) compared to a quarter nationally, with over a quarter (26.3%) of troubled families saying they are finding it difficult to get by, compared to just 10% nationally.
Over half (57%) of main carers report having at least one loan or credit product, including credit cards, hire purchase, formal bank loans (mortgages and other loans) and informal family loans. Over a quarter (27.2%) of main carers in troubled families reported have at least one type of high interest loan, which includes loans from online payday loan providers, loans from shops on the high street, loans from other types of lenders and loans from family/friends (calculated by DCLG using data from the Family Survey).
Data from local datasets – known as Family Progress Data – show that a third of families are in rent arrears on joining the programme (32.9%).
With a large proportion of adults not in employment, claiming benefits or in debt, young people in these families are also at risk of becoming financially excluded. Around one in ten families (10.2%) have a young person aged 16-24 who is not in education, training or employment (NEET). However in the Family Survey two thirds of young people aged 15-21 report that they aspire to be in education or training in the next year, with only 2.4% expecting to be unemployed. Over one in five young people have already taken at least one step to find work in the last year.
Education and school attendanceData from the National Impact Study in table 3 shows how truancy is more prevalent amongst children in troubled families than amongst children in the general population in the year prior to intervention.
Table 3: Comparison of the prevalence of education and school attendance problems between troubled families and the national population
Troubled Families
National Prevalence
% of families with a child who is persistently absent from school
(missing 10% or more of school sessions)
30.6%* n/a**
% of children persistently absent from school
(missing 10% or more of school sessions)
26.4%* 11.0%
% of children permanently excluded
0.9% 0.07%
% of children achieving expected level of reading, writing and maths at Key Stage 2 (Year 6)
53.2% 58%
Source: Data sourced from the National Impact Study
Note: data on absence and exclusion for troubled families is for the 3 terms before intervention start. National Prevalence for Key Stage 2 is for 2016. The corresponding figure for troubled families covers achievement of expected levels at any point.
*Based on all families with at least one child aged 5‑15 matched to National Pupil Database, all other figures based on children aged 5‑17.
**National Prevalence data is only available for individuals, not families.

33Who the families are, the problems they face and how services are helping them
Figure 4: Educational attainment of main carers
National %
NVQ1+2 or equivalent
NVQ3 or equivalent
NVQ4–6 or equivalent
NVQ7–8 or equivalent
Don’t know/don’t want to say
Other
8
31
17
25%
45%
9%
17%
2%
1%
1%
37
7
–
Graph produced by Ipsos MORI for The Family Survey Baseline Report
Source: Data sourced from the Family Survey, National data from ONS annual population survey (2015), aged 16‑64
Base: All main carers (1,145); Fieldwork dates 14 Oct 2015 – 17 Jul 2016
Nearly a third of troubled families have a child who is persistently absent from education, with children twice as likely to be persistently absent in the last school year than nationally. The Family Survey shows that nearly two in five (39.7%) main carers in troubled families reported having been told about concerns with the attendance of at least one of their children at school.
Although only a small proportion of children are permanently excluded, children in troubled families are more than ten times more likely to be permanently excluded from school than children nationally.
Educational attainment is also significantly lower than attainment nationally, amongst both children in troubled families and their parents and carers. Data from the Family Survey in figure 4 shows that a quarter
(25.1%) of main carers in troubled families reported not having any formal qualifications, compared to 8% nationally, with the majority (45.6%) reporting having an NVQ1+2 or equivalent (GCSEs/Apprenticeships) as their highest educational achievement.
Despite poor school attendance and low educational attainment of main carers and those old enough to sit their GCSEs, young people have positive aspirations for the future. In the Family Survey, of those who are at school or college almost all (97.8%) think they are likely to be in education, work or training in five years’ time and over two in five (43.8%) of 11-15 year olds would like to stay at school or college to do A-Levels after they have completed their GCSEs.

34 Who the families are, the problems they face and how services are helping them
Children who need helpData from the National Impact Study in table 4 shows how the prevalence of child safeguarding problems in troubled families is far higher than in the national population in the year prior to intervention.
Table 4: Comparison of the prevalence of child safeguarding problems between troubled families and the national population
Troubled Families
National Prevalence
% of families with a Child In Need (CIN)*
45.1% n/a**
% of children classed as a CIN
41.3% 3.4%
% of children on a Child Protection Plan (CPP)
8.2% 0.4%
% of families with a child with a Special Educational Need (SEN) (with or without a statement)
51.4% 2.8%
% of children with a SEN (with or without a statement)
39.8% 14.4%
Source: Data sourced from the National Impact Study
Note: Special Educational Need figures relate to three terms before intervention start
*Based on all families with at least one child aged 4‑17 matched to National Pupil Database, all other troubled families figures based on all children matched to National Pupil Database.
Over two in five troubled families have a child who is classed as a Child in Need22. Children in troubled families are twelve times more likely to be a classified as a Child in Need and twenty one times more likely to be on a Child Protection Plan than children in the national population.
Family Survey data shows that just 5.9% of main carers in troubled families reported experiencing being in care themselves or having had a sibling in care when growing up, but over a third (35.4%) had a parent leave or experienced a family break up when they were growing up.
A large proportion of troubled families have a child with a Special Educational Need, with children in troubled families nearly three times as likely to have a special educational need, than children in the national population.
Crime and anti-social behaviourThe prevalence of crime and anti-social behaviour amongst troubled families is far higher than the prevalence of these problems in the national population in the year before intervention, as shown by data from the National Impact Study in table 5.
22 A child in need is defined under section 17(10) of the Children Act 1989 as a child who “is unlikely to achieve or maintain, or to have the opportunity of achieving or maintaining, a reasonable standard of health or development without the provision for him of services by a local authority under this Part; his health or development is likely to be significantly impaired, or further impaired, without the provisions for him of such series; or he is disabled”. The Children in Need data includes looked after children, children on a Child Protection Plan and those with a Special Educational Need.

35Who the families are, the problems they face and how services are helping them
Table 5: Comparison of the prevalence of crime problems between troubled families and the national population
Troubled Families
National Prevalence
% of families with an adult or a child with a caution or conviction*
10.0% n/a**
% adults with a caution or conviction
5.4% 1.2%
% children with a caution or conviction (aged 10–17)
5.1% 0.8%
Source: Data sourced from the National Impact Study
*Based on all families with at least one individual aged 10‑100 matched to National Police Computer, all other troubled families figures based on all adults aged 18‑100 or all children aged 10‑17 matched to Police National Computer
**National Prevalence data is only available for individuals, not families
One in ten troubled families has an individual who has been cautioned or convicted. Adults were found to be five times more likely to have been cautioned or convicted for a criminal offence in the year before intervention than adults nationally, and young people were found to be six times more likely to have been cautioned or convicted for a criminal offence in the previous year then children nationally. Locally collected Family Progress Data shows that over one in ten (15.8%) families had at least one parent or child involved in an anti-social behaviour incident in the last year.
These families generally have more contact with the police than families in the general population.
• Data from locally collected Family Progress Data shows that over two-in-five households (41.7%) had at least one police callout.
• Data from the Family Survey shows that in the last six months a third (31.7%) of young people aged 11-21 reported having contact with the police (not as a victim) themselves, with the majority reporting having been told off or asked to move on by the police (15.7%). Figure 5 shows how over one in five (22.3%) main carers reported that they or someone else in their household had any contact with the police (not as a victim) in the last six months.

36 Who the families are, the problems they face and how services are helping them
Figure 5: Police contact with someone in the household
Any contact (not as a victim)with police
Contact with police as victim
No contact with police
Don’t know/don’t want to say
22%
15%
62%
5%
Graph produced by Ipsos MORI for The Family Survey Baseline Report
Source: Data sourced from the Family Survey
Base: All main carers who accepted self‑completion (999); Fieldwork dates 14 Oct 2015 – 17 Jul 2016
Note: Proportions do not equal 100% as this was a multiple choice question where respondents could have had contact with the police as both a victim and not a victim
Domestic abuseThe prevalence of domestic abuse amongst troubled families is high. Locally collected Family Progress Data shows that a quarter of families have at least one police-recorded incident of domestic abuse in the year before starting the programme. This compares to a national figure of 6.1% for individual adults aged 18-59.
Data from the Family Survey shows that female main carers in troubled families report experiencing much higher levels of partner and family abuse than women in the general population.
• Over half (51.6%) have experienced non-sexual partner abuse at least
once since they were 16 compared to just 15% nationally.
• In the last six months 17.1% report having experienced partner abuse, much higher than nationally at just 4% in the last year.
• Over one in five (22.0%) have experienced non-sexual family abuse, since they were 16, compared to just 6% nationally
There is some evidence of inter-generational trends, with one in ten main carers in troubled families reporting having experienced domestic abuse in their home when growing up and then again in their home since becoming an adult.
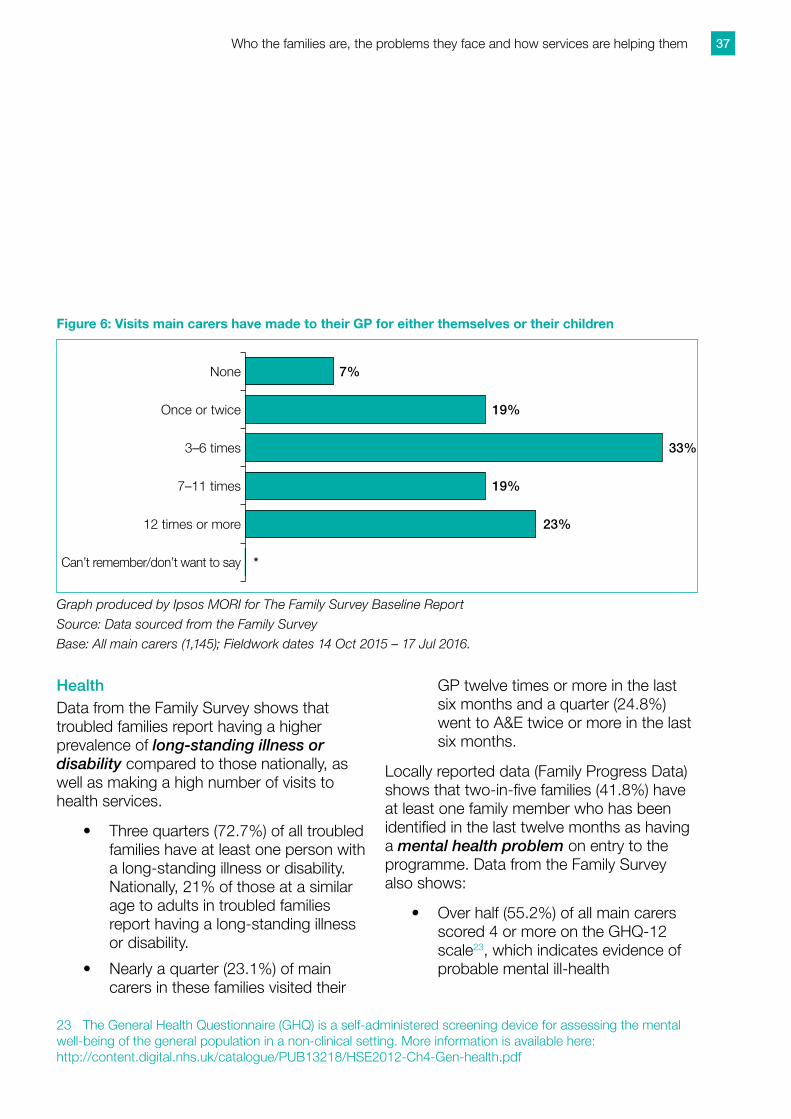
37Who the families are, the problems they face and how services are helping them
Figure 6: Visits main carers have made to their GP for either themselves or their children
None
Once or twice
3–6 times
7–11 times
12 times or more
Can’t remember/don’t want to say
7%
19%
33%
19%
23%
*
Graph produced by Ipsos MORI for The Family Survey Baseline Report
Source: Data sourced from the Family Survey
Base: All main carers (1,145); Fieldwork dates 14 Oct 2015 – 17 Jul 2016.
HealthData from the Family Survey shows that troubled families report having a higher prevalence of long-standing illness or disability compared to those nationally, as well as making a high number of visits to health services.
• Three quarters (72.7%) of all troubled families have at least one person with a long-standing illness or disability. Nationally, 21% of those at a similar age to adults in troubled families report having a long-standing illness or disability.
• Nearly a quarter (23.1%) of main carers in these families visited their
23 The General Health Questionnaire (GHQ) is a self-administered screening device for assessing the mental well-being of the general population in a non-clinical setting. More information is available here: http://content.digital.nhs.uk/catalogue/PUB13218/HSE2012-Ch4-Gen-health.pdf
GP twelve times or more in the last six months and a quarter (24.8%) went to A&E twice or more in the last six months.
Locally reported data (Family Progress Data) shows that two-in-five families (41.8%) have at least one family member who has been identified in the last twelve months as having a mental health problem on entry to the programme. Data from the Family Survey also shows:
• Over half (55.2%) of all main carers scored 4 or more on the GHQ-12 scale23, which indicates evidence of probable mental ill-health

38 Who the families are, the problems they face and how services are helping them
• Main carers were also found to have lower levels of wellbeing than nationally as measured by the short form of the Warwick-Edinburgh Mental Well-being scale (SWEMWBS)24
Using locally collected Family Progress Data, one in six (15.0%) troubled families have an individual who is dependent on drugs or alcohol. Data taken from the Family Survey shows that of those main carers who reported their alcohol consumption, the Alcohol Use Disorders Identification Test (AUDIT)25 indicates that half (51.6%) of main carers drink more than is considered safe and 16.3% exhibit signs of dependency.
Data from the Family Survey also shows that over half (51.5%) of main carers and 15.0% of young people smoke; both higher than nationally (19% and 8% respectively). But few main carers (7.4%) reported having taken any street drugs in the last six months, with just 14.3% of young people reporting to have ever tried cannabis.
Complexity of problemsTo be eligible for the current programme, each family must experience at least two of the six headline problems of the current programme.
Using data from the National Impact Study and Family Progress Data, initial analysis of the interrelationships between each of the six headline problems (i.e. interrelationships between two problems only, not the number of problems they faced) has shown that being a troubled family was associated with financial exclusion. Other findings include:
• Around three quarters of families were affected by financial exclusion and at least one other problem from each of the five headline problems.
• Education and attendance was strongly related to children needing help. Four in five families are affected by these two issues.
• Nearly two thirds of families affected by domestic abuse were affected by crime and anti-social behaviour (62.1%) with a similar proportion affected by children needing help (64.9%).
24 The Short form of the Warwick-Edinburgh Mental Well-being Scale (SWEMWBS) is a shortened form of the Warwick Edinburgh Mental Well-being Scale (WEBWMS) developed to enable monitoring of mental wellbeing in the general population. The shortened form comprises of seven rather than a 14-item scale, with the items relating more to functioning than to feeling, offering a slightly different perspective on mental well-being. More information is available here: http://www2.warwick.ac.uk/fac/med/research/platform/wemwbs/researchers/userguide/wemwbs_user_guide_jp_02.02.16.pdf
25 The Alcohol Use Disorders Identification Test (AUDIT) was developed by the World Health Organisation as a simple screening tool which is sensitive to early detection of risky and high risk drinking, but is also commonly used as an outcome measure. It comprises questions on alcohol consumption, drinking behaviour and dependence and the consequences or problems related to drinking. More information is available here: http://www.talkingalcohol.com/files/pdfs/WHO_audit.pdf

39Who the families are, the problems they face and how services are helping them
Service transformationKey findings:
• Evidence from in-depth interviews with staff delivering the programme show how local authorities identified strongly with the service transformation objective of the programme, although areas were at different levels of maturity towards service transformation.
• There was strong support for the whole family working approach and staff reported a focus on empowering families to make positive changes in their own lives, enabling them to access the support services they needed and to ultimately take ownership of their situation.
• The goal setting approach was described by families as being collaborative and responsive with the nature of keyworker support leading to families feeling they could deal with some of the challenges they faced by themselves.
• Overall the majority of staff delivering the programme said that it is achieving long-term change for families and that encouraging staff from multiple agencies to work together to support families is
contributing to the success of the programme in their local areas.
• The evidence suggests the programme is driving service transformation in local authorities, has strengthened partnership working, and is promoting whole-family working for all families with multiple and complex needs.
Findings from both the qualitative in-depth interviews with staff and families joining the programme, as well as findings from the annual Troubled Families Programme Staff Survey provide evidence of how the programme is being delivered to families.
The first phase of in-depth qualitative interviews by Ipsos MORI in nine local authorities between October 2015-March 2016 reports findings from interviews with staff delivering the programme, local stakeholders and partners, and families who have just started on the programme26.
The annual staff survey is an online survey sent to all Troubled Families Co-ordinators (leading and co-ordinating the delivery of the programme in local authorities), keyworkers (delivering the programme directly to families) and Troubled Families Employment Advisors (on secondment from local Jobcentre Plus to local troubled families’ teams), in all local authorities. The survey monitors how views on service delivery, workforce development
26 ‘National evaluation of the Troubled Families Programme 2015 – 2020: service transformation – case study research: part 1’ (Ipsos MORI, February 2017) <https://www.gov.uk/government/publications/national-evaluation-of-the-troubled-families-programme-2015-to-2020>

40 Who the families are, the problems they face and how services are helping them
and service transformation change over time. Findings are from the first wave conducted between October and November 201527.
Early evidence of services being transformedService transformation is one of the core objectives of the Troubled Families Programme. The aim, by the time the programme ends in 2020, is to mainstream the whole family, integrated way of working so that it is the norm for early help services for all families with multiple problems. This requires all relevant local services to join together and deliver timely and effective interventions to prevent families’ problems escalating.
Local authorities identified strongly with the service transformation objective of the programme, although areas were at different levels of maturity towards service transformation28.
“[Service transformation] is about the bringing of people together. Better communication. So for instance, obviously we’ve got the DWP employment advisers and I’m in discussions now with [the] police.”– Troubled Families Co-ordinator
There was widespread awareness of the importance of making cost savings through service transformation.
“It’s about working with families in a more holistic way, making sure that they’ve got joined up support…In doing so, saving services money, basically, that can then be used for other things.”– Troubled Families Co-ordinator
Some areas had begun to take their first steps towards restructuring, for example one local authority was responding to the programme’s requirement for better early intervention by setting up ‘early help’ hubs for the co-location of local authority staff and staff from partner agencies. Local authorities where the new Troubled Families Programme aligned strongly with existing strategic ambitions had started to make structural changes, with a view to fully embedding the key elements of the programme and moving towards integrated working and effective commissioning of services. But buy-in from senior leaders had a major impact on driving progress towards integrated working.
27 ‘National evaluation of the Troubled Families Programme 2015 – 2020: service transformation – staff survey: part 1’ (Ipsos MORI, February 2017) https://www.gov.uk/government/publications/national-evaluation-of-the-troubled-families-programme-2015-to-2020
Note: The first draft of findings from the second wave in November 2016 is due mid-February/early March 2017
28 DCLG has developed a new tool to help local partnerships identify areas for improvement, see ‘Changing services’ p13

41Who the families are, the problems they face and how services are helping them
Whole family workingThere was strong support for the whole family working approach; but the fact it is labour-intensive was noted by one case study area, alongside their concerns around the cost implications of rolling out this approach to a wider population and with new partners.
“It enables families to take control of their lives and feel that they have got hope for a future, really, and get control of their children, get their children to school and then think about work as an option for themselves.”– Troubled Families Co-ordinator
Multi agency workingData from the Staff Survey shows that the majority of Troubled Families Co-ordinators (98%) and keyworkers (96%) were extremely positive about the contribution of multi-agency working to the success of the programme in their local authority. Evidence from interviews with staff has showed that the current programme was found to have presented authorities with the opportunity to develop relationships with existing partners (such as the police) and engage new ones. For example, one local authority was expanding the programme’s reach to the prison service which they had not done as part of delivering the first programme.
“You have got to use this as an opportunity to re‑align the way your front‑line services operate with families……”– Troubled Families Co-ordinator
At this early stage in the programme some local authorities were found to be at early or under-developed stages of multi-agency working, evidence showed that these local authorities were taking steps to engage partners. This included developing new channels of communication and opportunities for discussion as well as innovative approaches such as running conferences for partners and creating and sharing videos of experiences of the programme, allowing partners to hear about the effectiveness of intervention from families themselves.
“We had had a Troubled Families conference where [the co‑ordinator] had some of her families who received help come and speak about how their lives had been turned around. It was a powerful message.”– Strategic Partner
But staff interviewed in local authorities noted that they faced some challenges in engaging with and developing effective working relationships with some partners, which included health and adult social care services (including mental health services), as well as housing and schools. Some of the reasons cited for difficulties in working more effectively with partners were the disparate and diverse

42 Who the families are, the problems they face and how services are helping them
nature of services/schools and ensuring consistency of whole family working, but in relation to health also extended to difficulties in reaching agreements on data sharing29. Although just over half (54.3%) of keyworkers responding to the Staff Survey and three in five (60.8%) Troubled Families Employment Advisers said they felt it was easy to get the support needed from partner organisations to deliver solutions to families; there is still some work to do in engaging partners30.
Data sharing and monitoringStaff interviewed reported that the programme had also helped local authorities improve data monitoring and data sharing with most partners and this was widely described as a critical success factor in identifying families, recording outcomes and providing support for families.
“Agencies are willing to give us the information… the education data has been amazing, really. They’ve been very helpful and cooperative and provide us what we need, as have the Children’s Centre people… it’s all starting to sort of join up.”– Strategic Partner
Data from the Staff Survey shows that there is still some work to do in establishing shared data systems. Just under a third (29.6%) of Troubled Families Co-ordinators agree shared IT systems are in place that local agencies working with troubled families can access,
29 DCLG and DH are working together to resolve these issues, see ‘Sharing good practice’ p15
30 See ‘Investing in service transformation’ p15
but over four in five (83.9%) agree effective protocols for sharing information on individual families are already in place.
Alongside this, the programme has created an impetus for the development of consistent cross-agency tools (for example for the assessment of families).
With the growing involvement of partner agencies and with the programme’s principles increasingly embedded in the way that practitioners support families, local authorities understood the necessity of building their capacity to make the programme sustainable in the long term, and of making cost savings.
Payment by resultsThe payment by results funding model was found to be more positively perceived under the current programme than in the first. Evidence from the case studies shows local authorities have been using the additional funding from the new programme to incentivise partners to deliver the troubled families model, giving them a strong practical reason to engage with the programme and helping grow the numbers of keyworkers.

43Who the families are, the problems they face and how services are helping them
“If you had asked me three years ago I would have said “Is it right?” I think they’ve been really good [under the new programme]. It’s focused the mind, it’s ensured that we genuinely work in an evidence‑based way for each family and it’s enabled us to make sure that we’re very prudent about how we spend our money.”– Troubled Families Co-ordinator
However, it was reported that the focus on outcomes, a result of the payment by results model, came with associated risks. Some were sceptical of whether it would help to improve outcomes and/or concerned that payment by results did not account for work which cannot be recorded or demonstrated through data.
Focus on employmentTroubled Families Employment Advisers were seen as a welcome enhancement to the programme and had helped to change the attitudes of frontline workers such that the issue of employability of their families was firmly on their agenda.
“They have changed or helped to change the culture of frontline workers, really, thinking about work and progress to work as a viable option right at the beginning, rather than as an add‑on at the end.”– Troubled Families Co-ordinator
In some local authorities the Troubled Families Employment Advisor role was seen as a way of bridging the gap between families/keyworkers and Jobcentre Plus/Department for Work and Pensions, acting as a ‘translator’ of Department for Work and Pensions’ practices.
“They did a quiz about the benefit system… it was a really good way of getting the [keyworkers] both to realise how much they had learnt about worklessness and employment and benefits and how much they didn’t know.”– Troubled Families Co-ordinator
Workforce developmentTroubled Families Co-ordinators responding to the survey were very positive about the skills of dedicated intervention workers and professionals delivering family interventions, with over four in five (83.1%) agreeing dedicated keyworkers have the skills which allow them to deliver effective services to families.
The majority of keyworkers and Troubled Families Employment Advisors agreed they had the right skills to allow them to deliver effective services to all or most of the families they work with. They reported feeling well supported in their role and ability to tackle a wide range of family problems. Although the majority of keyworkers (70.3%) and Troubled Families Employment Advisors (86.1%) responding to the survey reported there was a great deal, or a fair amount of opportunity

44 Who the families are, the problems they face and how services are helping them
to share and learn good practice locally within either their Jobcentre Plus or local authority, those interviewed acknowledged that bringing in more staff with a wider set of skills and experience presented challenges to future workforce development. Challenges included building capacity to make the programme sustainable in the longer term and successfully balancing the set of skills all agencies/staff involved in delivering the programme.
Staff and families experiences of and feedback about the programmeFamilies starting the programme welcomed the way that keyworkers took the time to understand the family, build trust, provide help with a wide range of different problems, and empower families to make positive changes in their lives.
“[It’s] having someone come to the house, someone to have a chat with about anything, feelings, how I cope, someone to give me advice on strategies to use with the kids.”– Mum
Goal setting with familiesFamilies reported the goal setting approach as being collaborative and responsive, consistent with the views of keyworkers who emphasised the importance of the goals and the service as a whole being family-led.
“It’s a mini‑assessment, she lets us know what’s changed since six weeks ago, how far we’ve come and stuff like that, then we sign it and it goes back to her manager.”– Mum
Working with familiesParents noticed how their keyworkers were not only interested in problems that related specifically to them or to their children, but also problems with their housing or practical support and direction on morning routines. Keyworkers focussed on practical problems such as housing and debt in the early stages of support, to build trust and help develop the rapport needed to talk about and help identify serious underlying problems such as domestic abuse.
The nature of keyworker support led to families feeling they could deal with some of the challenges they faced by themselves as they had the confidence to start tackling other problems which they had not felt capable of considering before. Staff also mentioned there was a focus on empowering families to make positive changes in their own lives, to enable them to access the support services they needed but to ultimately take ownership of their situation.
“It was like a weight had just been lifted off my shoulders. [I was] quite relieved and thankful that someone has actually started to help me and it is...it takes a lot of pressure off.”– Mum

45Who the families are, the problems they face and how services are helping them
Although there was hesitancy about looking for work, Troubled Families Employment Adviser support, where utilised, was described by staff as a resource that could help to address practical barriers to work for those who wanted to work but faced certain constraints. They helped families think about what they could do to make returning to work easier.
Overall, the majority of staff delivering the programme reported in the Staff Survey that it is achieving long-term change for families, and that encouraging staff from multiple agencies to work together to support families is contributing to the success of the programme in their local areas.

46 Families on the programme and making progress
Families on the programme and making progress
As part of the current programme, local authorities submit data on the number of eligible families receiving a whole family intervention, the number of families who have made significant and sustained progress against all their problems, and the number who have achieved continuous employment.
This chapter explains what this data means in relation to the experience of families and, in the table overleaf, provides a breakdown of the latest data by participating local authority.
Eligible families receiving a whole family interventionIn order to make sure the programme reaches the most complex families with multiple problems, families must have at least two of six headline problems (crime and anti-social behaviour, poor school attendance, children needing help, worklessness/debt, domestic violence, health problems) to be eligible for the programme. In addition, of all eligible families, local authorities must prioritise the families who are most likely to benefit from an integrated whole family approach and those who are the highest cost to the public purse.
For a family to be judged as receiving a whole family intervention, a local authority must ensure four things have taken place:
1. There is an assessment that takesinto account the needs of the wholefamily
2. There is an action plan that takesaccount of all (relevant) familymembers
3. There is a lead worker for the familythat is recognised by the family andother professionals involved with thefamily
4. The objectives in the family actionplan are aligned to those in the area’sTroubled Families Outcomes Plan
As set out in the table below, there are a total of 185,420 eligible families being worked with in a whole family way and for whom local authorities have received funding31.
Continuous employment and significant progress The current programme’s payment by results funding mechanism rewards local authorities when they have achieved and demonstrated significant and sustained progress with all the family’s problems, or an adult in the family has achieved continuous employment32.
31 Many local authorities work with more families than they receive funding for, and this trend is set to increase as whole family interventions are embedded in wider services and reach more families.
32 A period of continuous employment of 26 weeks out of previous 30 weeks for Jobseeker’s Allowance claimants. For other benefits see: Department for Communities and Local Government ‘The Financial Framework for the expanded Troubled Families Programme’ <https://www.gov.uk/government/publications/financial-framework-for-the-expanded-troubled-families-programme>

47Families on the programme and making progress
Each family’s achievement of ‘significant and sustained’ progress is assessed against a locally defined Troubled Family Outcomes Plan agreed with local partners, apart from the nationally set measures of school attendance33 and continuous employment. Funding for each family is paid in two parts: up-front funding of £1,000 per family and a results-based payment of £800 per family.
All results claims are subject to internal audit by the claiming local authority, signed off by their Chief Executive, and spot checks by DCLG – for more information see Benefiting taxpayers p15.
As set out in the table below, 43,813 families have achieved significant and sustained progress and 9,157 have achieved continuous employment.
While the results for which local authorities have been paid so far is a great achievement, they actually only represent the tip of the iceberg in terms of the progress local authorities and families are making. There are a few reasons for this: the complexity of families’ problems; the high bar set for success; and the time lag between the start of an intervention and both achieving and evidencing success.
33 All school age children must be receiving a suitable education and attend at least 90% of possible sessions on average across three consecutive school terms. This matches the Department for Education’s measure of persistent absence. For more information see: Department for Education ‘A guide to absence statistics’ (May 2016) <https://www.gov.uk/government/uploads/system/uploads/attachment_data/file/523637/Guide_to_absence_statistics_12052016.pdf> page 15

48 Families on the programme and making progress
Hillingdon started work with a family that included four school age children, three of whom were persistent truants with attendance of less than 70%. One of the three children had been attending less than 10% of the time and was subsequently permanently excluded from school. The mum was unemployed and suffering with mental health problems. The family were of concern to social services and therefore subject to a Child in Need Plan.
A full children and families assessment was conducted and a dedicated troubled families keyworker was allocated to the family to give the intensity of whole-family support that was required. After 7 months of twice weekly visits, the family is no longer a concern to social care. The mum has made progress to work, is writing a CV and researching training opportunities, while the eldest daughter who had previously been excluded is now enrolled at a mainstream school and is taking part in a targeted programme to help build skills and confidence.
The children’s attendance has also dramatically improved. The three children that were persistently truanting have now been attending school for more than 90% of the time for a full school year. The child that had been permanently excluded is now in school for 77% of the time. Despite the fantastic progress made, this family cannot yet attract a result payment from the Troubled Families Programme. This is because a claim can only be made when all school age children in the family are attending school at least 90% of the time.
The time lag in reporting results occurs because effective interventions take time, local authorities have to show that family progress is being sustained, and then the evidence needs to be collected. Take a typical example of a family with school age children: a 6 month intervention results in improved attendance; to qualify for a results payment, that good attendance must be sustained for at least three terms34, equivalent to a full school year; the hard data confirming that achievement is only available
34 For more information see: Department for Communities and Local Government ‘The Financial Framework for the expanded Troubled Families Programme’ <https://www.gov.uk/government/publications/financial-framework-for-the-expanded-troubled-families-programme>
two months after the end of any given term. As a result, the journey from the start of the intervention to submitting a valid claim can take 20 months in some cases.

49 Families on the programme and making progress
TROUBLED FAMILIES PROGRAMME 2015-2020: Families on the programme and making progress
Local authority Local Programme
Start Date
Maximum funded families up to 2020
Funded families on the programme as at December 2016
Number of families achieved significant
and sustained progress as at
28th March 2017
Number of families achieved
continuous employment as at
28th March 2017
Total claims for results as at
28th March 2017
Barking and Dagenham Sep-2014 2,470 1,238 447 50 497
Barnet Sep-2014 2,220 1,256 399 24 423
Barnsley Jan-2015 2,210 1,070 132 38 170
Bath and North East Somerset Sep-2014 700 452 122 45 167
Bedford Jan-2015 920 355 145 11 156
Bexley Jan-2015 1,410 805 272 11 283
Birmingham Apr-2015 14,300 6,328 835 88 923
Blackburn with Darwen Jan-2015 1,670 674 223 36 259
Blackpool Sep-2014 1,830 1,102 506 16 522
Bournemouth Apr-2015 1,330 727 8 10 18
Bracknell Forest Jan-2015 400 234 79 4 83
Bradford Sep-2014 6,070 1,509 251 82 333
Brent Jan-2015 3,210 1,385 511 113 624
Brighton and Hove Jan-2015 2,280 778 232 43 275
Bristol Sep-2014 4,100 2,283 943 121 1,064
Bromley Sep-2014 1,700 785 205 29 234
Buckinghamshire Jan-2015 1,860 1,016 251 18 269
Calderdale Sep-2014 1,650 676 305 68 373

50 Families on the programme and making progress
Local authority Local Programme
Start Date
Maximum funded families up to 2020
Funded families on the programme as at December 2016
Number of families achieved significant
and sustained progress as at
28th March 2017
Number of families achieved
continuous employment as at
28th March 2017
Total claims for results as at
28th March 2017
Cambridgeshire Jan-2015 2,840 1,347 340 65 405
Camden Apr-2015 2,100 1,030 172 2 174
Central Bedfordshire Apr-2015 1,120 398 41 16 57
Cheshire East Apr-2015 1,900 905 127 26 153
Cheshire West and Chester Jan-2015 1,820 829 326 65 391
Cornwall Apr-2015 4,010 1,575 249 94 343
Coventry Jan-2015 3,160 1,591 15 249 264
Croydon Jan-2015 3,050 1,383 435 87 522
Cumbria Apr-2015 3,380 1,625 274 24 298
Darlington Jan-2015 930 396 128 17 145
Derby Jan-2015 2,230 304 57 49 106
Derbyshire Sep-2014 4,510 2,374 349 179 528
Devon Apr-2015 4,280 2,187 165 8 173
Doncaster Apr-2015 2,950 744 94 65 159
Dorset Jan-2015 1,940 744 48 32 80
Dudley Sep-2014 2,440 895 1 28 29
Durham Sep-2014 4,360 2,340 623 104 727
Ealing Apr-2015 3,010 1,555 208 74 282
East Riding of Yorkshire Jan-2015 1,670 801 228 43 271
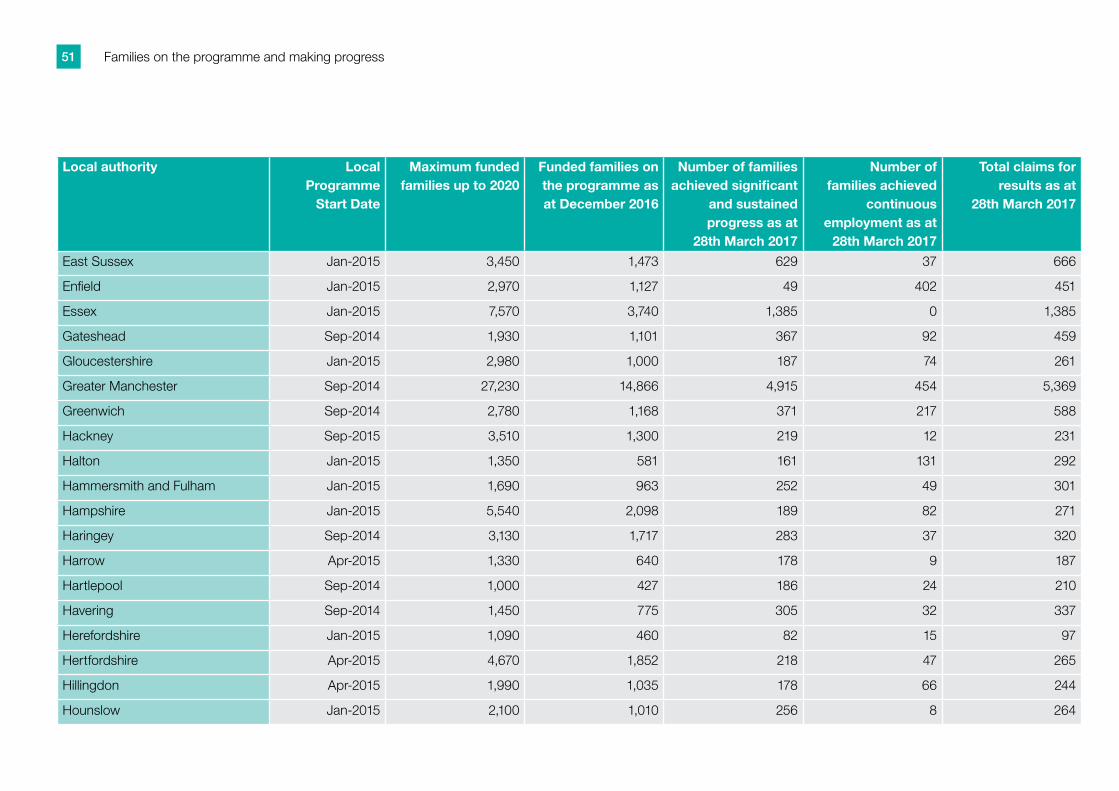
51 Families on the programme and making progress
Local authority Local Programme
Start Date
Maximum funded families up to 2020
Funded families on the programme as at December 2016
Number of families achieved significant
and sustained progress as at
28th March 2017
Number of families achieved
continuous employment as at
28th March 2017
Total claims for results as at
28th March 2017
East Sussex Jan-2015 3,450 1,473 629 37 666
Enfield Jan-2015 2,970 1,127 49 402 451
Essex Jan-2015 7,570 3,740 1,385 0 1,385
Gateshead Sep-2014 1,930 1,101 367 92 459
Gloucestershire Jan-2015 2,980 1,000 187 74 261
Greater Manchester Sep-2014 27,230 14,866 4,915 454 5,369
Greenwich Sep-2014 2,780 1,168 371 217 588
Hackney Sep-2015 3,510 1,300 219 12 231
Halton Jan-2015 1,350 581 161 131 292
Hammersmith and Fulham Jan-2015 1,690 963 252 49 301
Hampshire Jan-2015 5,540 2,098 189 82 271
Haringey Sep-2014 3,130 1,717 283 37 320
Harrow Apr-2015 1,330 640 178 9 187
Hartlepool Sep-2014 1,000 427 186 24 210
Havering Sep-2014 1,450 775 305 32 337
Herefordshire Jan-2015 1,090 460 82 15 97
Hertfordshire Apr-2015 4,670 1,852 218 47 265
Hillingdon Apr-2015 1,990 1,035 178 66 244
Hounslow Jan-2015 2,100 1,010 256 8 264

52 Families on the programme and making progress
Local authority Local Programme
Start Date
Maximum funded families up to 2020
Funded families on the programme as at December 2016
Number of families achieved significant
and sustained progress as at
28th March 2017
Number of families achieved
continuous employment as at
28th March 2017
Total claims for results as at
28th March 2017
Isle of Wight Apr-2015 1,000 420 21 17 38
Islington Jan-2015 2,630 1,250 187 60 247
Kensington and Chelsea Sep-2015 1,130 610 130 26 156
Kent Jan-2015 9,200 4,474 2,167 106 2,273
Kingston upon Hull Jan-2015 3,510 1,489 264 82 346
Kingston upon Thames Apr-2015 680 262 56 5 61
Kirklees Jan-2015 3,740 1,674 402 69 471
Knowsley Sep-2014 2,010 908 128 38 166
Lambeth Sep-2014 3,480 1,872 154 112 266
Lancashire Sep-2015 8,620 3,420 257 81 338
Leeds Sep-2014 6,900 3,754 1,350 494 1,844
Leicester Jan-2015 3,940 1,523 125 75 200
Leicestershire Sep-2014 2,770 1,703 386 319 705
Lewisham Jan-2015 3,170 906 351 25 376
Lincolnshire Jan-2015 4,760 2,405 94 238 332
Liverpool Sep-2014 6,760 3,500 138 591 729
Luton Jan-2015 1,940 959 266 35 301
Medway Towns Apr-2015 2,060 1,011 100 73 173
Merton Sep-2014 1,150 525 272 22 294
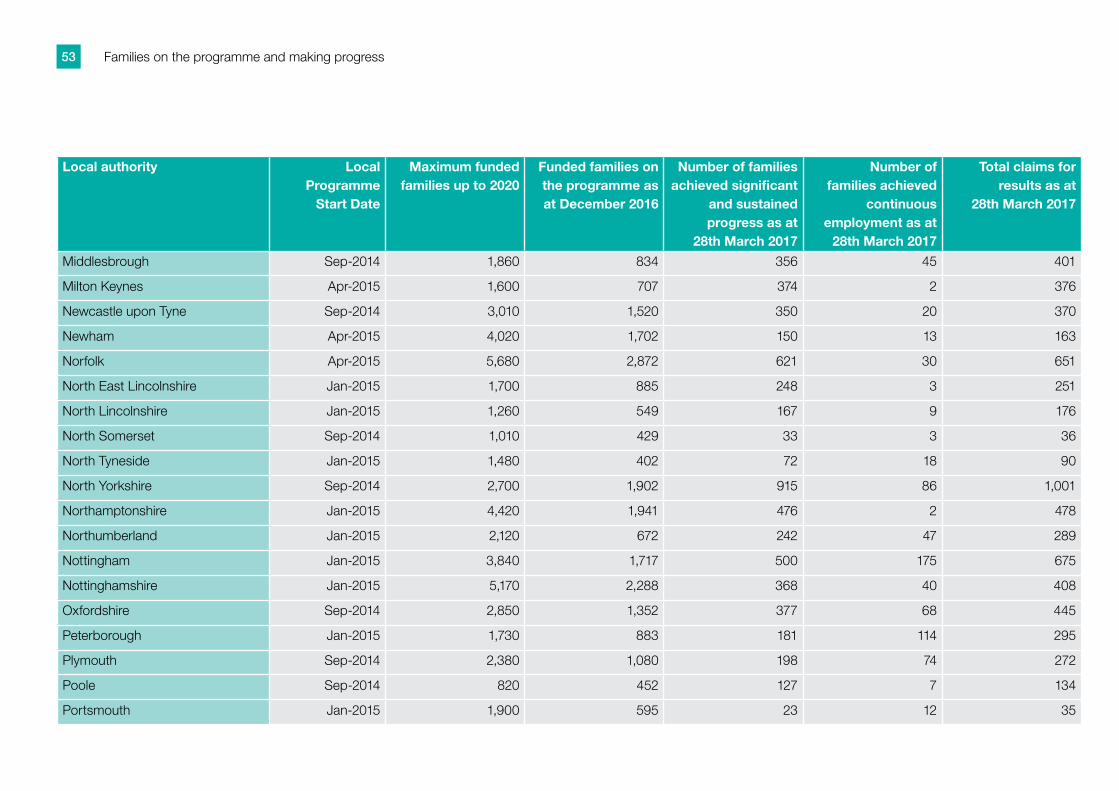
53 Families on the programme and making progress
Local authority Local Programme
Start Date
Maximum funded families up to 2020
Funded families on the programme as at December 2016
Number of families achieved significant
and sustained progress as at
28th March 2017
Number of families achieved
continuous employment as at
28th March 2017
Total claims for results as at
28th March 2017
Middlesbrough Sep-2014 1,860 834 356 45 401
Milton Keynes Apr-2015 1,600 707 374 2 376
Newcastle upon Tyne Sep-2014 3,010 1,520 350 20 370
Newham Apr-2015 4,020 1,702 150 13 163
Norfolk Apr-2015 5,680 2,872 621 30 651
North East Lincolnshire Jan-2015 1,700 885 248 3 251
North Lincolnshire Jan-2015 1,260 549 167 9 176
North Somerset Sep-2014 1,010 429 33 3 36
North Tyneside Jan-2015 1,480 402 72 18 90
North Yorkshire Sep-2014 2,700 1,902 915 86 1,001
Northamptonshire Jan-2015 4,420 1,941 476 2 478
Northumberland Jan-2015 2,120 672 242 47 289
Nottingham Jan-2015 3,840 1,717 500 175 675
Nottinghamshire Jan-2015 5,170 2,288 368 40 408
Oxfordshire Sep-2014 2,850 1,352 377 68 445
Peterborough Jan-2015 1,730 883 181 114 295
Plymouth Sep-2014 2,380 1,080 198 74 272
Poole Sep-2014 820 452 127 7 134
Portsmouth Jan-2015 1,900 595 23 12 35

54 Families on the programme and making progress
Local authority Local Programme
Start Date
Maximum funded families up to 2020
Funded families on the programme as at December 2016
Number of families achieved significant
and sustained progress as at
28th March 2017
Number of families achieved
continuous employment as at
28th March 2017
Total claims for results as at
28th March 2017
Reading Apr-2015 1,170 543 95 44 139
Redbridge Sep-2014 1,990 1,104 451 99 550
Redcar and Cleveland Sep-2014 1,290 754 205 31 236
Richmond upon Thames Sep-2014 650 335 92 4 96
Rotherham Apr-2015 2,500 974 43 42 85
Rutland Apr-2015 100 53 18 0 18
Sandwell Jan-2015 3,920 2,047 359 63 422
Sefton Jan-2015 2,130 1,072 74 67 141
Sheffield Sep-2014 5,360 2,880 1,044 84 1,128
Shropshire Jan-2015 1,580 557 12 26 38
Slough Apr-2015 1,260 644 221 9 230
Solihull Jan-2015 1,210 512 56 8 64
Somerset Jan-2015 3,000 1,507 169 60 229
South Gloucestershire Sep-2014 1,050 563 80 21 101
South Tyneside Apr-2015 1,430 576 16 31 47
Southampton Sep-2014 2,230 1,107 184 150 334
Southend-on-Sea Jan-2015 1,480 625 216 21 237
Southwark Apr-2015 3,340 1,041 53 43 96
St. Helens Jan-2015 1,710 852 30 16 46

55 Families on the programme and making progress
Local authority Local Programme
Start Date
Maximum funded families up to 2020
Funded families on the programme as at December 2016
Number of families achieved significant
and sustained progress as at
28th March 2017
Number of families achieved
continuous employment as at
28th March 2017
Total claims for results as at
28th March 2017
Staffordshire Jan-2015 4,680 2,396 403 50 453
Stockton-on-Tees Jan-2015 1,560 741 487 5 492
Stoke-on-Trent Apr-2015 2,890 1,476 412 14 426
Suffolk Jan-2015 4,110 2,035 568 121 689
Sunderland Jan-2015 2,540 1,213 138 76 214
Surrey Sep-2014 3,700 1,963 500 90 590
Sutton Apr-2015 1,110 584 89 44 133
Swindon Jan-2015 1,310 677 106 7 113
Telford and Wrekin Jan-2015 1,360 662 132 41 173
Thurrock Apr-2015 1,220 511 158 90 248
Torbay Apr-2015 1,180 351 57 28 85
Tower Hamlets Apr-2015 3,660 846 41 57 98
Wakefield Sep-2014 3,030 1,321 398 126 524
Walsall Jan-2015 2,830 1,430 476 91 567
Waltham Forest Jan-2015 2,990 1,249 414 14 428
Wandsworth Sep-2014 2,190 1,269 434 41 475
Warrington Apr-2015 1,250 470 56 15 71
Warwickshire Sep-2014 2,790 1,371 534 29 563
West Berkshire Sep-2014 540 322 93 19 112

56 Families on the programme and making progress
Local authority Local Programme
Start Date
Maximum funded families up to 2020
Funded families on the programme as at December 2016
Number of families achieved significant
and sustained progress as at
28th March 2017
Number of families achieved
continuous employment as at
28th March 2017
Total claims for results as at
28th March 2017
West Sussex Sep-2014 3,940 2,455 1,236 45 1,281
Westminster Sep-2015 2,080 1,147 207 97 304
Wiltshire Jan-2015 1,990 827 239 27 266
Windsor and Maidenhead Jan-2015 460 192 53 21 74
Wirral Jan-2015 3,000 922 133 6 139
Wokingham Apr-2015 340 153 0 6 6
Wolverhampton Apr-2015 2,890 993 122 42 164
Worcestershire Jan-2015 3,180 1,201 96 51 147
York Jan-2015 950 421 31 27 58
Total 399,960 185,420 43,813 9,157 52,970
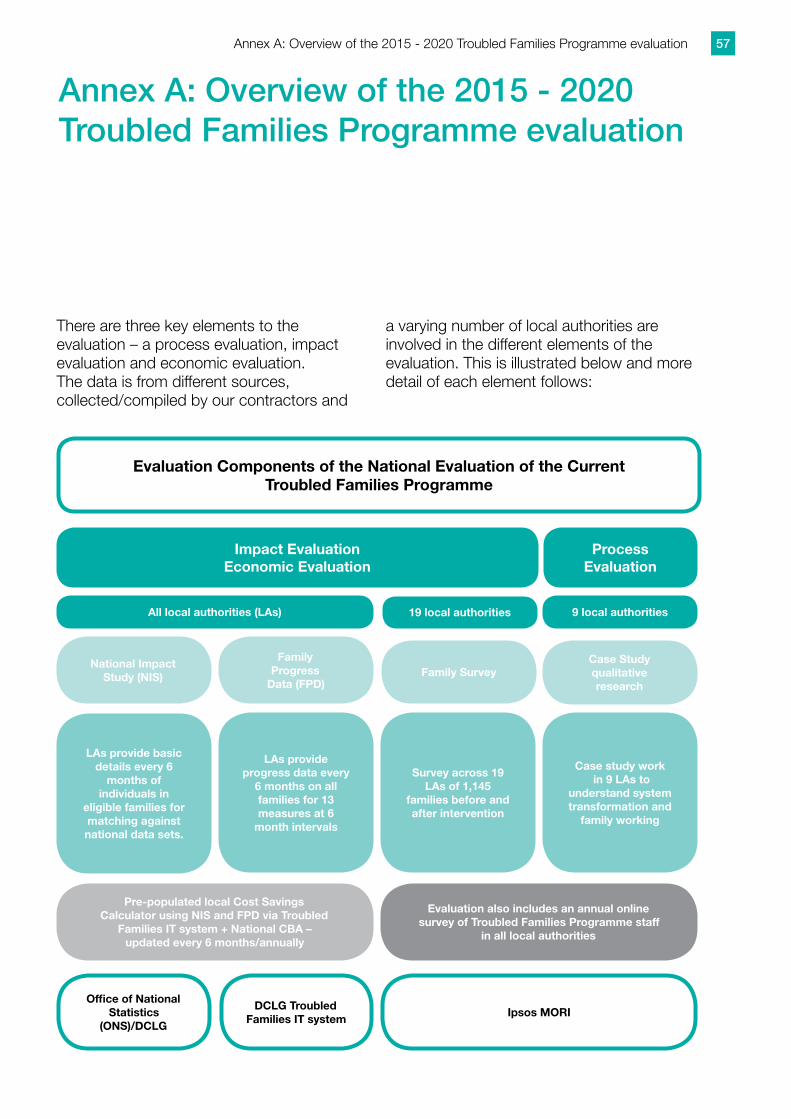
57Annex A: Overview of the 2015 - 2020 Troubled Families Programme evaluation
Annex A: Overview of the 2015 - 2020 Troubled Families Programme evaluation
There are three key elements to the evaluation – a process evaluation, impact evaluation and economic evaluation. The data is from different sources, collected/compiled by our contractors and
a varying number of local authorities are involved in the different elements of the evaluation. This is illustrated below and more detail of each element follows:
Evaluation Components of the National Evaluation of the Current Troubled Families Programme
Impact Evaluation Economic Evaluation
All local authorities (LAs)
Process Evaluation
19 local authorities 9 local authorities
National Impact Study (NIS)
Family Progress
Data (FPD)Family Survey
Case Study qualitative research
LAs provide basic details every 6
months of individuals in
eligible families for matching against national data sets.
LAs provide progress data every
6 months on all families for 13 measures at 6
month intervals
Survey across 19 LAs of 1,145
families before and after intervention
Case study work in 9 LAs to
understand system transformation and
family working
Pre-populated local Cost Savings Calculator using NIS and FPD via Troubled
Families IT system + National CBA – updated every 6 months/annually
Evaluation also includes an annual online survey of Troubled Families Programme staff
in all local authorities
Office of National Statistics
(ONS)/DCLG
DCLG Troubled Families IT system
Ipsos MORI

58 Annex A: Overview of the 2015 - 2020 Troubled Families Programme evaluation
The Impact Evaluation1. The National Impact Study: Every
local authority provides the personal details and some programme information on individuals and families they have identified as eligible for the Troubled Families Programme (families on the programme and those in a comparison group who are not yet receiving support) and send these to the Office for National Statistics (ONS, as a trusted third party contractor). ONS check and clean the data provided (sometimes with the local authorities themselves) then compile this and send the data to other government departments for matching with their national administrative datasets every six months. Once DCLG receive the dataset of derived data from ONS (the matched data is derived data to further anonymise it), DCLG analysts carry out further cleaning on the
data, for example to ensure families have children and adults, that ages match variables identifying adults/children, etc. The national datasets include the Police National Computer (PNC) held by Ministry of Justice, the National Pupil Database (NPD) held by Department for Education and the Work and Pensions Longitudinal Study (WPLS) held by Department for Work and Pensions. DCLG is discussing access to health data with Department of Health, NHS Digital and Public Health England. There are some limitations to the data: good matches with nationally held administrative data are dependent on the quality of the personal data supplied by local authorities; each government department uses a different methodology for matching the data, (their own matching algorithm), resulting in differing match rates.
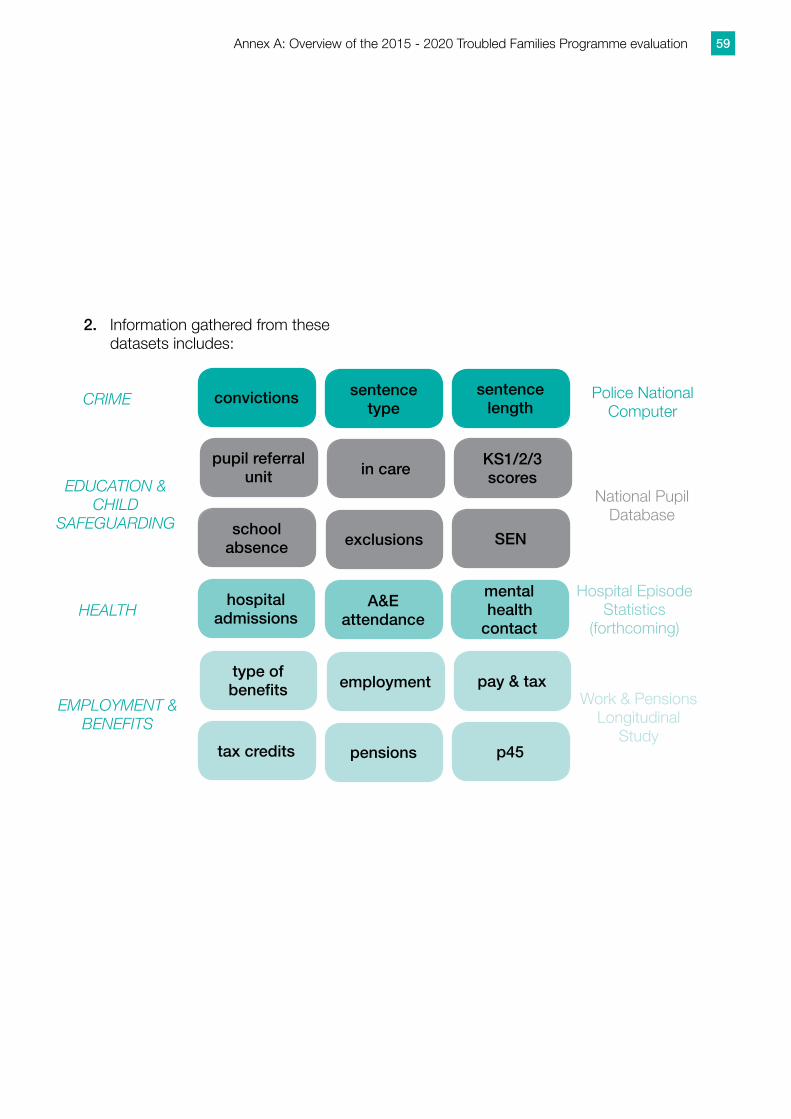
59Annex A: Overview of the 2015 - 2020 Troubled Families Programme evaluation
2. Information gathered from these datasets includes:
convictions sentence type
sentence lengthCRIME Police National
Computer
pupil referral unit in care
KS1/2/3 scores
school absence exclusions SEN
hospital admissions
A&E attendance
mental health
contact
type of benefits employment pay & tax
tax credits pensions p45
EDUCATION & CHILD
SAFEGUARDING
HEALTH
EMPLOYMENT & BENEFITS
National Pupil Database
Hospital Episode Statistics
(forthcoming)
Work & Pensions Longitudinal
Study

60 Annex A: Overview of the 2015 - 2020 Troubled Families Programme evaluation
3. Family Progress Data: Every local authority provides information that we cannot gather using nationally held administrative datasets on families being engaged with by the programme only (i.e. not a comparison group). The data is submitted using an IT system set up to collect data for the evaluation and this IT system runs checks to ensure data is entered correctly. Once it arrives DCLG analysts carry out further checks and cleaning on the
data. The data is collected in a way to allow DCLG analysts to match Family Progress Data with National Impact Study data at the individual level. This data is of varying quality and completeness, so care needs to be taken when interpreting this data and work. DCLG have already worked with local authorities to improve the quality of some of the data and this work is on-going. Data collected from local authorities includes:
Crime and ASB Education and school attendance Children who need help• Cautions or convictions • Number of community sentences • Custodial sentences • Types of offences • ASB incidents* • ASB incidents resulting in further action* • ASB incidents resulting in no further action* • Police call outs*
• Persistent absence • Fixed period and permanent exclusions • GCSE attainment • Early years development • Key stage achievement • Attending alternative provision • Attending PRU • Children missing from education*
• Children in care or looked after children • Child in need • Child protection plan • Special educational need status • Episodes of care • Time spent in care
Financial exclusion and work Health Domestic abuse or violence• Claiming any out of • Claiming ESA/IB or IS work benefits • Claiming DLA or PIP • Adults in work • Time on benefits • Claiming ESA/IB • NEETs* • Claiming IS • Rent arrears* • Claiming JSA • Evictions*
• Mental health issue* • Dependence on non-prescription drugs* • Dependence on alcohol* Pending NHS Digital • A&E attendences • Long standing illness/disability • Health conditions • Hospital admissions
• Domestic abuse or violence incidents* • Self-reported incidence of domestic abuse or
violence from the Family Survey

61Annex A: Overview of the 2015 - 2020 Troubled Families Programme evaluation
4. The Family Survey is carried out face-to-face and undertaken by Ipsos MORI. The survey has a longitudinal design which allows a family’s circumstances to be assessed at two points in time: just before they start receiving troubled families support and once they have been stepped down from the programme to assess how families have changed as a result. The survey aims to capture information on some outcomes that cannot be monitored through national administrative data or collected by local authorities e.g. family relationships and wellbeing. If families give their consent, the data from the Family Survey is matched to National Impact Study and Family Progress Data information. Families have been interviewed in a sample of 19 local authorities, the baseline wave of fieldwork ran between November 2015 and July 2016, interviews were conducted with 1,145 main carers and 596 young people (aged 11-21), these interviews will be repeated with c.700 main carers and young people at the follow-up stage in 2017/18. Bryson and Purdon Social Research are assisting with the project and are testing whether the findings from the survey can be compared against a historical dataset of UK families, using the UK Household Longitudinal Survey (UKHLS, or Understanding Society), to identify whether and how far families on the programme have improved over and above the changes typically seen in similar families.
The Process Evaluation1. Case study research uses a
qualitative approach and is also undertaken by Ipsos MORI. The aim of this research is to better understand the delivery of the programme and to provide descriptive accounts of how the programme is being received by families and delivered by staff. Baseline in-depth interviews with staff and families were carried out across a sample of nine local authorities. The fieldwork was conducted between October 2015 and March 2016 with 48 families as they started on the programme and 60 staff delivering the programme. Follow-up interviews were conducted with the families and staff one year later, and the data is still being processed. In 2017, a new sample of 11 local authorities will be selected to take part where baseline and follow-up interviews will be conducted with a new set of families and staff in a similar way.
2. The Staff Survey is an online, annual survey sent out to all current staff (until 2020) undertaken by Ipsos MORI. Three key groups of staff Troubled Families Coordinators, keyworkers and Troubled Families Employment Advisors are invited to take part. The aim of this research is to track how the programme is being delivered, how services are transforming, workforce training and development, multi-agency working, working with families and views from the perspective of staff delivering the programme in all local authorities.

62 Annex A: Overview of the 2015 - 2020 Troubled Families Programme evaluation
The Economic EvaluationIn order to assess the economic and fiscal impact of the Troubled Families Programme, a local and national cost benefit analysis is being undertaken. The economic evaluation was informed by the work carried out by Manchester New Economy and agreed by HM Treasury. The Troubled Families Information System automatically carries out local cost benefit analysis and calculates return on investment, public value cost benefit ratio and net fiscal benefit and it provides local authorities with historical costs of families.
1. Local authorities enter the costs of delivering their local interventions via an online information system. Using data collected through the National Impact Study and Family Progress Data the monetised costs families incur on the public sector and wider society (for example, through crime and truancy) is calculated, both before and after the intervention.
2. The system uses the costs of delivering services and attaches unit costs to outcomes to allow local
authorities to see how much they are spending on their services and the outcomes and benefits associated with this spend. It also estimates how much public money was saved for each pound spent on interventions, and reports the estimates back to local authorities through an online tool.
Next steps for evaluation in the forthcoming year (2017/18)
• Impact Evaluation:
o Data linking for 4th and 5th wave of NIS
o Updating analysis of data, exploring progress of families and the impact of the programme on outcomes
• Process Evaluation:
o Phase 2 fieldwork for area case studies and reporting
o Wave 3 of staff survey
• Economic Evaluation:
o Estimates of value for money