Supporting Development of Minnesota’s Transportation Investment
27
Supporting Development of Minnesota’s Transportation Investment Options Technical Memorandum #3: Return on Investment Methodology & Scenario Evaluation October 2013
Transcript of Supporting Development of Minnesota’s Transportation Investment

Supporting Development of Minnesota’s Transportation Investment Options Technical Memorandum #3:
Return on Investment Methodology & Scenario Evaluation
October 2013

This report was produced with the generous support of The McKnight Foundation.
The McKnight Foundation, a Minnesota-based family foundation, seeks to improve the quality of life for present and future
generations. Through grantmaking, collaboration, and strategic policy reform, we use our resources to attend, unite, and
empower those we serve.
Any error and all interpretations are the responsibility of Smart Growth America. Please direct questions about this report
to Roger Millar, PE, AICP, Vice President, Smart Growth America’s Leadership Institute:
[email protected], 406.544.1963.
This report was prepared by:

MnDOT - Minnesota Department of Transportation
Technical Memorandum #3: Return on Investment Methodology & Scenario Evaluation
i
. . . transportation investment options that . . . move people and goods . . .
TABLE OF CONTENTSIntroduction . . . . . . . . . . . . . . . . . . . . . . . . . . . . . . . . . . . . . . . . . . . . . . . . . . . . . . . . . . . . . . . . . . . . . . . . . . . . . 1
Return on Investment Analysis Methodology . . . . . . . . . . . . . . . . . . . . . . . . . . . . . . . . . . . . . . . . . . . . 2
Return on Investment Findings . . . . . . . . . . . . . . . . . . . . . . . . . . . . . . . . . . . . . . . . . . . . . . . . . . . . . . . . . 15
FIGURESFigure 1. Investment Option Framework . . . . . . . . . . . . . . . . . . . . . . . . . . . . . . . . . . . . . . . . . . . . . . . 4
Figure 2. Pavement Preservation, Rehabilitation and Reconstruction . . . . . . . . . . . . . . . . . . . . 8
TABLESTable 1. Benefi t-Cost Factors (PRISM) . . . . . . . . . . . . . . . . . . . . . . . . . . . . . . . . . . . . . . . . . . . . . . . . . . 5
Table 2. MnSHIP Investment Category and ROI Category Translation Matrix . . . . . . . . . . . . 6
Table 3. USDOT: ITS Upgrades for New, Rehabilitated or Existing Infrastructure . . . . . . . 14
Table 4. Maintain Current Performance - Return on Investment . . . . . . . . . . . . . . . . . . . . . . . 18
Table 5. Economically Competitive and World Class System - Return on Investment . . 19
Table 6. Total TFAC Recommendations - Return on Investment . . . . . . . . . . . . . . . . . . . . . . . 20
Table 7. Return on Investment Categories – ROI Ranges . . . . . . . . . . . . . . . . . . . . . . . . . . . . . . 22

THIS PAGE INTENTIONALLY LEFT BLANK TO ACCOMMODATE 2-SIDED PRINTING.

MnDOT - Minnesota Department of Transportation
Technical Memorandum #3: Return on Investment Methodology & Scenario Evaluation
1
IntroductionThe purpose of this project is to
assist the Minnesota Department
of Transportation (MnDOT) with
the development of transportation
investment options that expand
fl exible and effi cient ways to move
people and goods throughout
Minnesota and support job creation
and economic development in
the state. This working paper
is the project’s third technical
memorandum and reviews the
return on investment (ROI) analysis
of two long-term investment
options proposed for Minnesota’s
state highway system. Specifi cally,
the ROI analysis evaluates
recommendations made by the
Minnesota Transportation Finance
Advisory Committee (TFAC) in 2012
that would address the growing
transportation needs in the state
over the next 20 years. The results
of the ROI analysis provide answers
to the following three questions:
1. Maintaining the current
performance of Minnesota’s
state highway system would
require an investment of an
additional $5.4 billion over the
next 20 years. What would be
the return on that investment?
2. Improving Minnesota’s state
highway system to help
the state become more
economically competitive
through technology and
operational innovations
and through high return on
investment projects to reduce
congestion and delays would
require the investment of an
additional $7.1 billion over the
next 20 years. What would be
the return on that investment?
3. Within the proposed
investments over the next
20 years, some projects and
programs will necessarily have
a higher return on investment
and some will have a lower
return on investment. Which
kinds of projects and programs
off er the highest ROI?
This technical memorandum builds
on two previous working papers
and two meetings of the Project
Supporting Development of Minnesota’s Transportation Investment OptionsTechnical Memorandum #3:
Return on Investment Methodology & Scenario Evaluation
MnDOT - Minnesota Department of Transportation
Technical Memorandum #3: Return on Investment Methodology & Scenario Evaluation
2
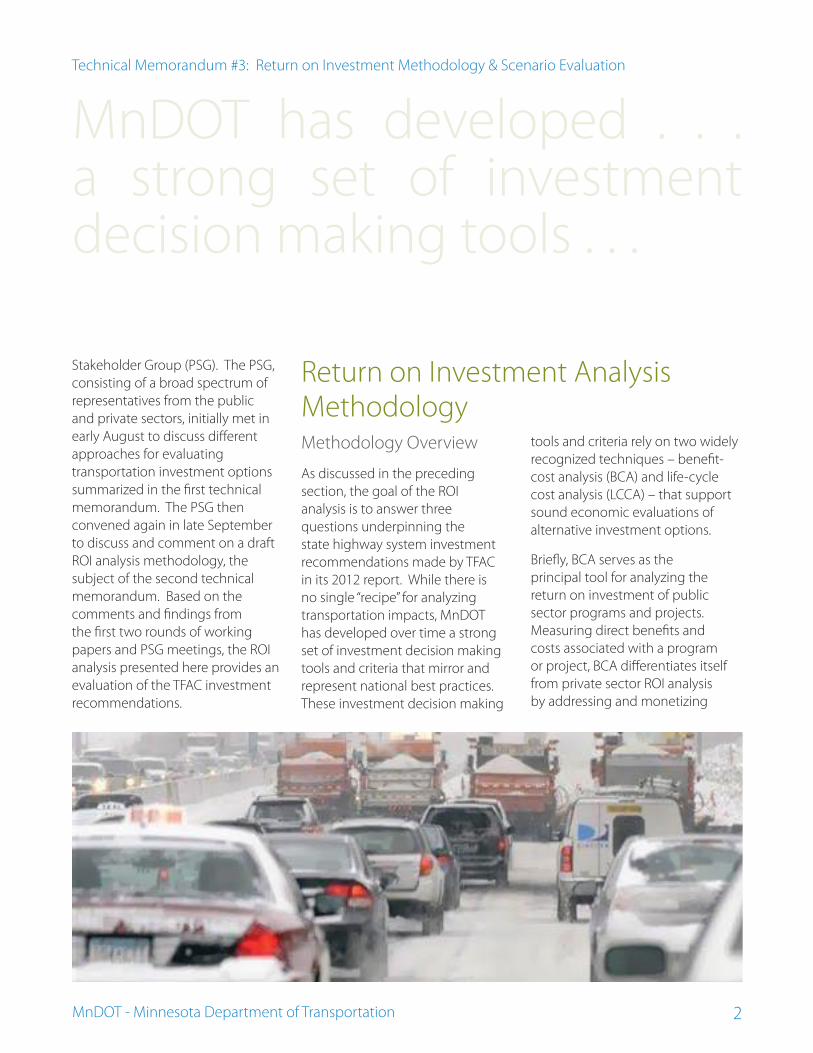
MnDOT has developed . . . a strong set of investment decision making tools . . .
Stakeholder Group (PSG). The PSG,
consisting of a broad spectrum of
representatives from the public
and private sectors, initially met in
early August to discuss diff erent
approaches for evaluating
transportation investment options
summarized in the fi rst technical
memorandum. The PSG then
convened again in late September
to discuss and comment on a draft
ROI analysis methodology, the
subject of the second technical
memorandum. Based on the
comments and fi ndings from
the fi rst two rounds of working
papers and PSG meetings, the ROI
analysis presented here provides an
evaluation of the TFAC investment
recommendations.
Return on Investment Analysis
MethodologyMethodology Overview
As discussed in the preceding
section, the goal of the ROI
analysis is to answer three
questions underpinning the
state highway system investment
recommendations made by TFAC
in its 2012 report. While there is
no single “recipe” for analyzing
transportation impacts, MnDOT
has developed over time a strong
set of investment decision making
tools and criteria that mirror and
represent national best practices.
These investment decision making
tools and criteria rely on two widely
recognized techniques – benefi t-
cost analysis (BCA) and life-cycle
cost analysis (LCCA) – that support
sound economic evaluations of
alternative investment options.
Briefl y, BCA serves as the
principal tool for analyzing the
return on investment of public
sector programs and projects.
Measuring direct benefi ts and
costs associated with a program
or project, BCA diff erentiates itself
from private sector ROI analysis
by addressing and monetizing

MnDOT - Minnesota Department of Transportation
Technical Memorandum #3: Return on Investment Methodology & Scenario Evaluation
3
. . . reports the dollar value of societal benefi ts for a dollar of investment . . .
a broad set of societal benefi ts,
including economic (e.g., travel
time and operating cost savings),
environmental (e.g. air quality and
noise), and social benefi ts (e.g.,
safety), and not simply revenue
streams. One tool in the investment
decision making process, BCA
analysis reports the dollar value
of societal benefi ts for a dollar of
investment.
Eff ectively the cost component of
BCA, life-cycle cost analysis captures
all future costs over a project’s
usable life. LCCA diff ers from BCA
in that it assumes a constant level
of benefi ts across alternatives and
then identifi es the alternative that
minimizes costs to achieve those
benefi ts. Accordingly, alternatives
can be compared on a cost basis
and expressed as a benefi t-cost
ratio as well. This technique is
particularly useful for evaluating
diff erent system preservation
strategies that yield essentially the
same benefi ts (e.g., maintaining
pavement or bridges in good
condition), but have diff erent costs
during a given analysis period.
Taken together, benefi t-cost
analysis and life-cycle cost analysis
serve as the foundation for the
ROI methodology in this technical
memorandum, allowing us to
evaluate the value of an additional
dollar of investment across a series
of investment categories and
options.
Major Assumptions
Responding to anticipated
population growth and aging
transportation infrastructure
in Minnesota, the TFAC
recommendations are organized
around two proposed, incremental
levels of investment over the
next 20 years: (1) a $5.4 billion
investment beyond projected
revenue to maintain the current
performance of the state highway
system, and (2) an additional
$7.1 billion investment to
build, maintain, and operate an
economically competitive and
world class system. Similar to an
individual’s retirement account
that contains diff erent investment
funds (e.g., technology stocks,
global stocks, Treasury bonds),
each representing a diverse range
of individual stocks and bonds,
the TFAC investment options
consist of diff erent investment
classes or categories (e.g.,
pavement preservation, bridge
replacement, highway safety,
highway reconstruction) that
include a wide variety of potential

MnDOT - Minnesota Department of Transportation
Technical Memorandum #3: Return on Investment Methodology & Scenario Evaluation
4
. . . methodology calls for developing a composite return on investment . . .
individual programs and projects
(see Figure 1).
Extending the retirement account
analogy, the ROI methodology
calls for developing a composite
return on investment based on the
relative benefi ts generated by each
investment category in the diff erent
investment options – much as one
would for any investment account.
The following assumptions describe
in greater detail the key concepts
supporting the ROI analysis.
• For each investment category,
the ROI analysis relies on a
range of benefi t-cost ratios
derived from either benefi t-
cost or life-cycle cost analysis
of a representative sample of
projects or programs. Relying
on a range of benefi t-cost ratios
is particularly important given
the diversity of investment
categories and sample
projects and programs within
a category. While underlying
parameters, such as timing
or phasing of improvements,
usable life of a facility, and
analysis period, vary among
the investment categories,
utilizing a range of benefi t-cost
ratios allows the ROI analysis to
draw informative comparisons
across categories and ultimately
investment options.
• MnDOT has long had valuable
guidance, “Benefi t-Cost Analysis
for Transportation Projects,” in
place for conducting benefi t-
cost analysis. The ROI analysis
in this memorandum applies
that guidance in tandem
with a proprietary tool called
PRISM that MnDOT uses in
its new Corridor Investment
Management Strategy (CIMS)
program to develop benefi t-
cost ratios. PRISM factors
multiple social, economic,
and environmental variables,
summarized in Table 1, into the
benefi t-cost ratios.
• Building on Minnesota’s 20-
Year State Highway Investment
Plan (MnSHIP), the ROI analysis
defi nes ten investment
categories within the TFAC
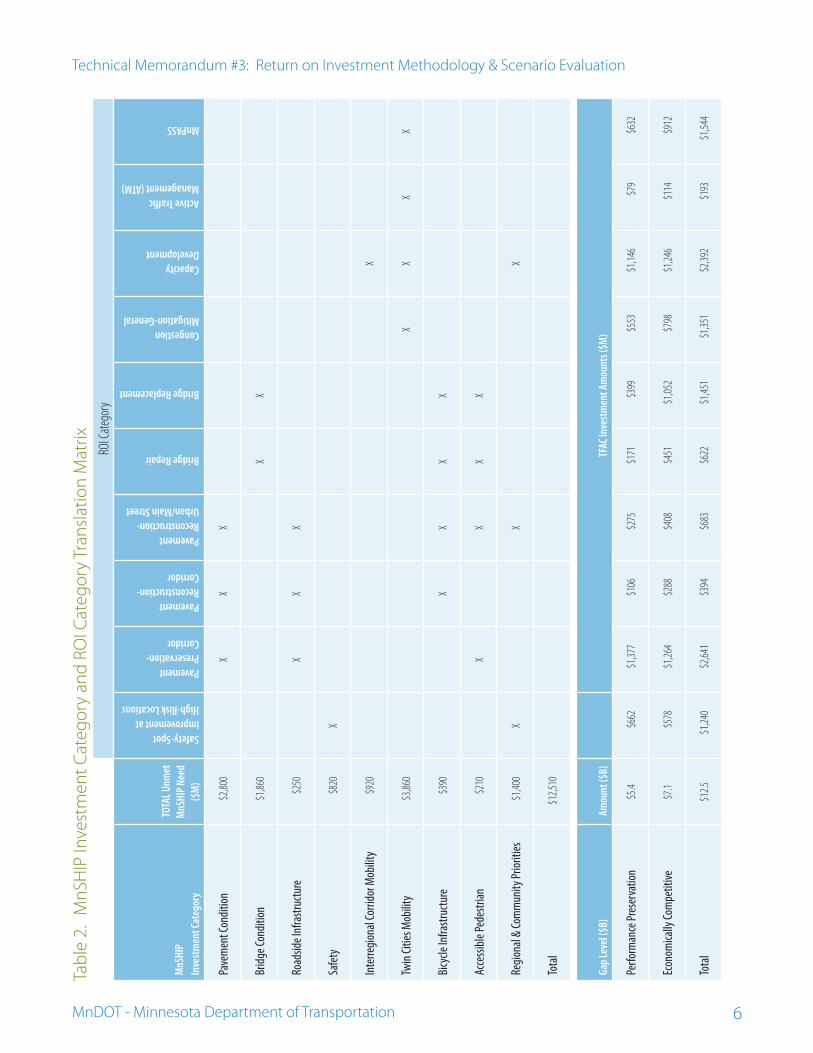
recommendations. Table 2
shows the relationship among
Figure 1. Investment Option Framework
INVESTMENT OPTION
Investment Category
Investment Category
Investment Category

MnDOT - Minnesota Department of Transportation
Technical Memorandum #3: Return on Investment Methodology & Scenario Evaluation
5
. . . proactive approach in maintaining our existing highways . . .
the MnSHIP investment
categories and unmet needs,
the ROI categories, and the
TFAC recommendations. As
illustrated in the table, the
MnSHIP unmet needs, defi ned
as either the costs necessary
to meet performance-based
targets or achieve key system
goals, are the basis for the
TFAC investment amounts.
Detailed descriptions of the ROI
categories are provided in the
next section of this document.
Return on Investment Categories
Following are descriptions of the
ten investment categories included
in the ROI analysis. The descriptions
include a brief overview of the
investment category and the
approach for calculating a benefi t-
cost ratio. Again, due to the
diversity of investment categories,
available information varies among
categories. Representative projects
are drawn from the illustrative
project list in the TFAC report where
applicable. Specifi c benefi t-cost
ratio ranges for each investment
category will be discussed under
the ROI fi ndings in the last section
of the memorandum.
Safety – Spot Improvement/High Risk Locations
Provision of safe travel is the
ultimate contribution made by a
transportation system to broader
quality of life priorities. While a safe
arrival relies on many factors outside
the direct infl uence of MnDOT
(e.g., driver behavior), infrastructure
investments promote a safe driving
environment and innovations
in safety treatments make this a
dynamic area for research and
implementation.
Regulatory agencies, including
USDOT, base decision making about
the cost eff ectiveness of safety-
related investments on the “value
of a statistical life” (VSL) economic
concept. This measure refl ects the
comprehensive value an individual
has demonstrated and a willingness
to pay to avoid a fractional
increase in the risk of death from
participating in an activity. The
value placed on avoiding a fatal
outcome also determines the
proportional cost to society of injury
crashes (graded in three severities).
MnDOT has adopted the well-
Table 1. Benefi t-Cost Factors (PRISM)
Social Economic Environmental• Safety
• Bicycle/Pedestrian Health
Eff ects
• Noise
• Travel Time
• Travel Time Reliability
• Vehicle Operating Costs
• Life Cycle Costs
• Loss of Agricultural Land
• Emission (CO2 + Criteria
Pollutants)
• Wetland Eff ects
• Runoff
MnDOT - Minnesota Department of Transportation
Technical Memorandum #3: Return on Investment Methodology & Scenario Evaluation
6
Tab
le 2
. M
nS
HIP
Inve
stm
en
t C
ate
go
ry a
nd
RO
I Ca
teg
ory
Tra
nsl
ati
on
Ma
trix
ROI C
ateg
ory
MnS
HIP
Inve
stm
ent C
ateg
ory
TOTA
L Unm
et
MnS
HIP
Need
($
M)
Safety-Spot Improvement at High-Risk Locations
Pavement Preservation-Corridor
Pavement Reconstruction-Corridor
Pavement Reconstruction-Urban/Main Street
Bridge Repair
Bridge Replacement
Congestion Mitigation-General
Capacity Development
Active Traffi c Management (ATM)
MnPASS
Pave
men
t Con
ditio
n $
2,80
0 X
XX
Brid
ge C
ondi
tion
$1,
860
XX
Road
side
Infr
astr
uctu
re $
250
XX
X
Safe
ty $
820
X
Inte
rreg
iona
l Cor
ridor
Mob
ility
$92
0 X
Twin
Citi
es M
obili
ty $
3,86
0 X
XX
X
Bicy
cle
Infr
astr
uctu
re $
390
XX
XX
Acce
ssib
le P
edes
tria
n $
210
XX
XX
Regi
onal
& C
omm
unit
y Pr
iorit
ies
$1,
400
XX
X
Tota
l $
12,5
10
Gap
Leve
l ($B
) A
mou
nt ($
B)
TFAC
Inve
stm
ent A
mou
nts (
$M)
Perf
orm
ance
Pre
serv
atio
n$5
.4 $
662
$1,
377
$10
6 $
275
$17
1 $
399
$55
3 $
1,14
6 $
79
$63
2
Econ
omic
ally
Com
petit
ive
$7.1
$57
8 $
1,26
4 $
288
$40
8 $
451
$1,
052
$79
8 $
1,24
6 $
114
$91
2
Tota
l$1
2.5
$1,
240
$2,
641
$39
4 $
683
$62
2 $
1,45
1 $
1,35
1 $
2,39
2 $
193
$1,
544

MnDOT - Minnesota Department of Transportation
Technical Memorandum #3: Return on Investment Methodology & Scenario Evaluation
7
. . . the right treatment to the right pavement at the right time . . .
documented federal guidance for
VSL and injury per-person costs,
further tailoring the crash values
by applying the latest statewide
crash profi le showing the average
number of occupants involved in a
given crash type.
Safety improvements then seek
to lower these expected costs by
reducing total crash frequency and/
or minimizing the severity of the
crash distribution (e.g., averting
injuries even if property damage-
only crashes rise modestly). Return
on investment can be evaluated
against this objective by reference
to a sample of recently completed,
planned, or analyzed projects across
Minnesota characterized by:
• Relatively low construction
costs – compared with a
traditional solution
• Limited extent – compared with
a major corridor expansion that
may deliver signifi cant benefi ts
beyond safety enhancement
The representative sample of
projects includes rural intersection
confl ict warning systems, diverging
diamond interchanges, and passing
lanes. Based on six representative
projects, the average benefi t-cost
ratio is approximately four-to-one.
Pavement Preservation – Corridor
According to the U.S. Department of
Transportation (USDOT), “pavement
preservation represents a proactive
approach in maintaining our
existing highways, reducing costly
and time consuming rehabilitation
and reconstruction projects and
the associated traffi c disruptions.“
Beyond the obvious importance
and desirability of well maintained
roadways, poor pavement – and
bridge – conditions can also
potentially jeopardize a state’s
bonding rating resulting in higher
borrowing costs for state and local
governments.
Transportation agencies typically
rely on life-cycle cost analysis
to quantify savings associated
with pavement preservation
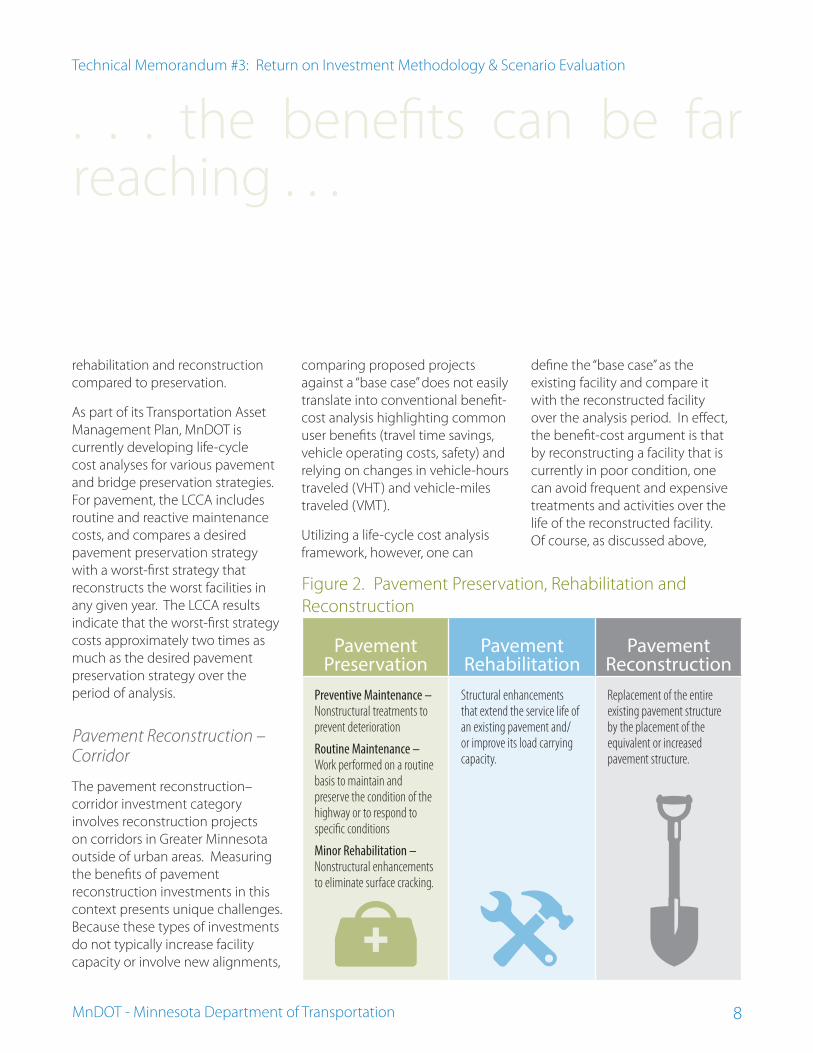
programs. The goal is to apply
the right treatment to the right
pavement at the right time, and
in doing so, avoid or delay more
expensive improvements such
as major roadway rehabilitation
or reconstruction (see Figure 2).
The cost savings associated with
preservation are then expressed
as a cost reduction per lane mile
or as a ratio between the cost of
MnDOT - Minnesota Department of Transportation
Technical Memorandum #3: Return on Investment Methodology & Scenario Evaluation
8
. . . the benefi ts can be far reaching . . .
rehabilitation and reconstruction
compared to preservation.
As part of its Transportation Asset
Management Plan, MnDOT is
currently developing life-cycle
cost analyses for various pavement
and bridge preservation strategies.
For pavement, the LCCA includes
routine and reactive maintenance
costs, and compares a desired
pavement preservation strategy
with a worst-fi rst strategy that
reconstructs the worst facilities in
any given year. The LCCA results
indicate that the worst-fi rst strategy
costs approximately two times as
much as the desired pavement
preservation strategy over the
period of analysis.
Pavement Reconstruction – Corridor
The pavement reconstruction–
corridor investment category
involves reconstruction projects
on corridors in Greater Minnesota
outside of urban areas. Measuring
the benefi ts of pavement
reconstruction investments in this
context presents unique challenges.
Because these types of investments
do not typically increase facility
capacity or involve new alignments,
comparing proposed projects
against a “base case” does not easily
translate into conventional benefi t-
cost analysis highlighting common
user benefi ts (travel time savings,
vehicle operating costs, safety) and
relying on changes in vehicle-hours
traveled (VHT) and vehicle-miles
traveled (VMT).
Utilizing a life-cycle cost analysis
framework, however, one can
defi ne the “base case” as the
existing facility and compare it
with the reconstructed facility
over the analysis period. In eff ect,
the benefi t-cost argument is that
by reconstructing a facility that is
currently in poor condition, one
can avoid frequent and expensive
treatments and activities over the
life of the reconstructed facility.
Of course, as discussed above,
Figure 2. Pavement Preservation, Rehabilitation and
Reconstruction
Pavement Preservation
Pavement Rehabilitation
Pavement Reconstruction
Preventive Maintenance – Nonstructural treatments to prevent deterioration
Routine Maintenance – Work performed on a routine basis to maintain and preserve the condition of the highway or to respond to specifi c conditions
Minor Rehabilitation –Nonstructural enhancements to eliminate surface cracking.
Structural enhancements that extend the service life of an existing pavement and/or improve its load carrying capacity.
Replacement of the entire existing pavement structure by the placement of the equivalent or increased pavement structure.

MnDOT - Minnesota Department of Transportation
Technical Memorandum #3: Return on Investment Methodology & Scenario Evaluation
9
. . . would include a broad range of bridges on diff erent types of highway facilities . . .
pavement preservation strategies
are a cost-eff ective strategy for
delaying reconstruction, but at
some point, all pavements reach
the end of their service life. For the
purposes of the ROI analysis, the
assumption is that conservatively
and on average the life-cycle cost of
reconstruction is equal to the life-
cycle cost of maintaining pavement
that is already in poor condition.
Pavement Reconstruction – Urban/Main Street
This category captures highway
reconstruction projects in cities
and towns, including main street
projects. The full reconstruction
of highways in urban settings
allows MnDOT and local partners
to make major improvements and
changes to both the road itself as
well as the underground utilities.
Urban/main street reconstruction
projects may involve improvements
to how stormwater runoff is
handled, changes in access points
(access management), lane
reconfi gurations, new lighting,
additions of green space, new
medians, new or reconstructed
sidewalks, and other modifi cations.
Given the complexity of urban
reconstruction projects, the benefi ts
can be far reaching and include
both traditional transportation
measures such as travel time
and safety, but also health and
environmental factors.
Many applications to MnDOT’s
recent CIMS solicitation requested
funding for urban/main street
reconstruction projects and as
part of the project selection
process were evaluated on a
benefi t-cost basis using the PRISM
tool. Although the resulting ROI
estimates included many factors,
there is a strong correlation
between traffi c volume and ROI
for these types of projects. Using
representative projects with a
range of traffi c volumes allows one
to estimate an approximate ROI
for urban reconstruction projects
without the need to conduct
in-depth analysis of the many
potential project elements. Based
on a sample of 34 representative
projects, the average benefi t-cost
ratio tends to fall between one and
two.
Bridge Repair
Similar to the pavement–
preservation category, the life-
cycle cost analysis for bridge repair

MnDOT - Minnesota Department of Transportation
Technical Memorandum #3: Return on Investment Methodology & Scenario Evaluation
10
Return on investment is listed as the fi rst objective criterion . . .
investments is currently being
evaluated as part of MnDOT’s
Transportation Asset Management
Plan. The bridge repair analysis
considers substructures,
superstructures, and decks, and
compares the LCCA results of a
worst-fi rst strategy to a typical repair
and maintenance strategy. For this
category, the worst-fi rst strategy
costs average approximately one-
and-a-half times more than the
typical maintenance strategy for the
given period of analysis.
Bridge Replacement
The bridge replacement category
poses the same challenges as
the pavement reconstruction–
corridor investment category since
a bridge replacement typically
does not increase facility capacity
or involve a new alignment. For
an individual bridge replacement
project, it is possible to evaluate a
replacement facility with a “base
case” that assumes closure of the
existing facility. The proposed
investments for bridge replacement,
however, would include a broad
range of bridges on diff erent types
of highway facilities in diff erent
locations. Consequently, the ROI
analysis utilizes a generalized
life-cycle cost analysis approach
to frame the trade-off between
ongoing maintenance of a bridge
in poor condition and replacing
it. Reconstruction also results
in a long-term continuation of
maximum user benefi ts, contrasted
with the progressive deterioration
in accessibility and reliability (e.g.
forced/discretionary detours,
load posting restrictions aff ecting
truck routing) anticipated when
routine maintenance practices are
performed on a facility late in its
life cycle. The assumption, as with
corridor pavement reconstruction
investments, is that on average the
life-cycle cost of replacing a bridge
is equal to the life-cycle cost of
ongoing maintenance of a bridge in
poor condition.
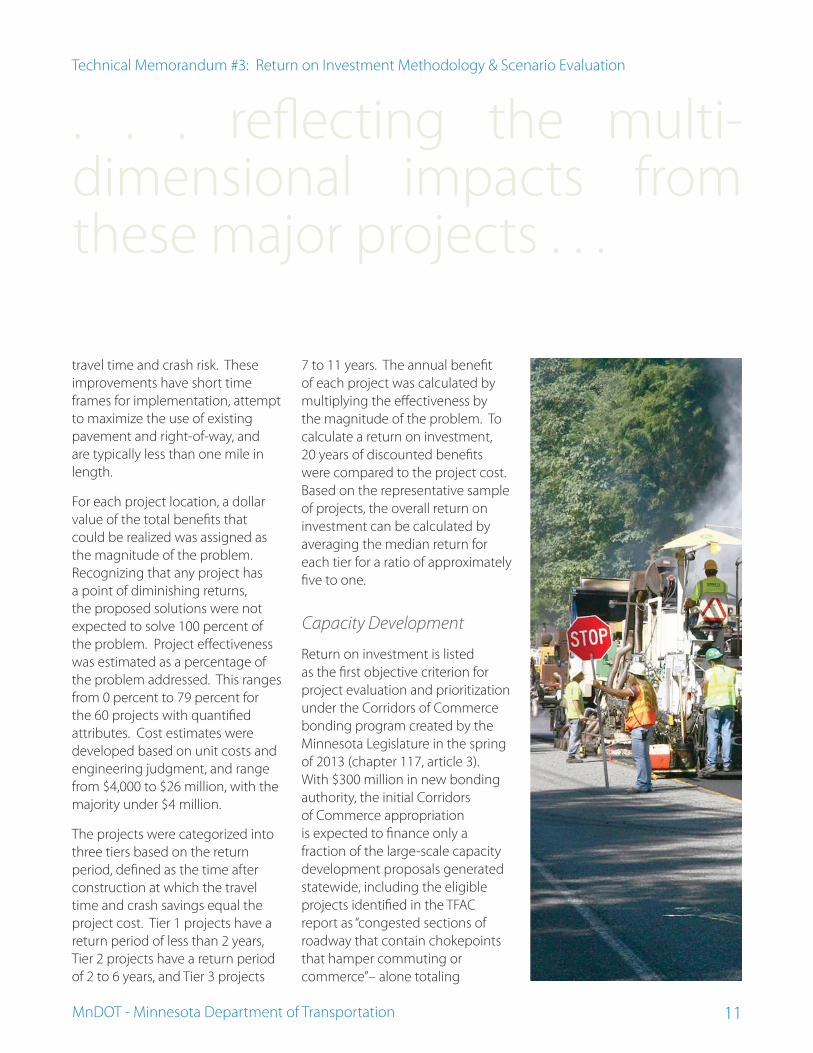
Congestion Mitigation – General
Because of the level of detail
provided in the Metro District
Congestion Management and
Safety Plan, this category lends
itself more easily to a benefi t-cost
analysis. Investments in general
congestion mitigation are intended
to identify lower cost, higher
benefi t improvements that reduce
MnDOT - Minnesota Department of Transportation
Technical Memorandum #3: Return on Investment Methodology & Scenario Evaluation
11
. . . refl ecting the multi-dimensional impacts from these major projects . . .
travel time and crash risk. These
improvements have short time
frames for implementation, attempt
to maximize the use of existing
pavement and right-of-way, and
are typically less than one mile in
length.
For each project location, a dollar
value of the total benefi ts that
could be realized was assigned as
the magnitude of the problem.
Recognizing that any project has
a point of diminishing returns,
the proposed solutions were not
expected to solve 100 percent of
the problem. Project eff ectiveness
was estimated as a percentage of
the problem addressed. This ranges
from 0 percent to 79 percent for
the 60 projects with quantifi ed
attributes. Cost estimates were
developed based on unit costs and
engineering judgment, and range
from $4,000 to $26 million, with the
majority under $4 million.
The projects were categorized into
three tiers based on the return
period, defi ned as the time after
construction at which the travel
time and crash savings equal the
project cost. Tier 1 projects have a
return period of less than 2 years,
Tier 2 projects have a return period
of 2 to 6 years, and Tier 3 projects
7 to 11 years. The annual benefi t
of each project was calculated by
multiplying the eff ectiveness by
the magnitude of the problem. To
calculate a return on investment,
20 years of discounted benefi ts
were compared to the project cost.
Based on the representative sample
of projects, the overall return on
investment can be calculated by
averaging the median return for
each tier for a ratio of approximately
fi ve to one.
Capacity Development
Return on investment is listed
as the fi rst objective criterion for
project evaluation and prioritization
under the Corridors of Commerce
bonding program created by the
Minnesota Legislature in the spring
of 2013 (chapter 117, article 3).
With $300 million in new bonding
authority, the initial Corridors
of Commerce appropriation
is expected to fi nance only a
fraction of the large-scale capacity
development proposals generated
statewide, including the eligible
projects identifi ed in the TFAC
report as “congested sections of
roadway that contain chokepoints
that hamper commuting or
commerce”– alone totaling

MnDOT - Minnesota Department of Transportation
Technical Memorandum #3: Return on Investment Methodology & Scenario Evaluation
12
. . .maximizes the eff ectiveness and effi ciency of the facility . . .
$571 million using the lower end of
current cost estimate ranges.
Through calculations supported
by the PRISM benefi t-cost model,
MnDOT has drafted a return on
investment measure incorporating
safety benefi ts, travel time savings,
environmental externalities, and
operating and life-cycle costs,
refl ecting the multi-dimensional
impacts from these major projects.
In all cases, a Capacity Development
(CD) scenario is compared against
a No Build (NB) baseline. At this
early evaluation stage, when
candidate projects lack detailed
studies for benefi t components and
construction scope and expense,
the ROI estimates that enable a
preliminary ranking must rely on
key assumptions – which may be
refi ned in the future with expert
offi ce review:
TRAFFIC
• AADT (and VMT) does not
change between NB and CD.
• The future AADT trend for
both scenarios is projected as
a continuation of the segment
compound annual growth rate
for the 2002-2011 period.
• Travel time savings for auto and
truck users refl ect increased
speeds under CD.
SAFETY
• NB crash frequencies and
severity are taken from the
latest 10-year actuals.
• CD crash modifi cation factors
are sourced from historical
benefi t-cost analyses or FHWA’s
Crash Modifi cations Factor
Clearinghouse.
• Future crash counts track with
AADT growth.
COSTS
• Unless otherwise indicated by
available project documents,
construction costs are allocated
as:
– 70% structures, grading,
sub/base, surface (40-year
average life)
– 10% Right-of-Way (100-year
expected life)
– 20% engineering and all
other purposes (no residual
value)
• Incremental annual operations
and maintenance expense for
CD is $10,000 per added lane-
mile.

MnDOT - Minnesota Department of Transportation
Technical Memorandum #3: Return on Investment Methodology & Scenario Evaluation
13
MnPASS users receive benefi ts in the form of faster and more reliable trip times . . .
• NB major rehabilitation/
replacement timing is
estimated based on current
pavement condition.
• The benefi t from smoother
pavement with CD (for the
years prior to NB rehab/replace)
is derived from modeling
conducted by the national
research organization TRIP,
linking vehicle operating costs
to the pavement condition
diff erential.
GENERAL
• Construction duration is
estimated as a function of
total project costs (i.e. more
expensive projects require
multiple seasons).
• Analysis represents 20 years of
benefi ts following the opening
of the CD facility, converted to
the present value equivalent at
a 2.2% discount rate.
Applying this procedure to a
representative sample of projects,
the average benefi t-cost ratio tends
to be slightly greater than one.
Active Traffi c Management
The rapidly evolving application
of computer and communication
technologies to transportation
systems off ers a number of
opportunities to maximize existing
assets and new investments.
According to FHWA, Active Traffi c
Management (ATM) is, “the ability
to dynamically manage recurrent
and non-recurrent congestion
based on prevailing and predicted
traffi c conditions. Focusing on
trip reliability, it maximizes the
eff ectiveness and effi ciency of the
facility.” Strategies include but are
not limited to speed harmonization,
temporary shoulder use, junction
control, and dynamic signing and
rerouting. To date, national research
on the benefi ts of ATM strategies
has been reported under the larger
umbrella of Transportation Systems
Management and Operations
(TSM&O).
TSM&O can include physical and
non-physical investments and
address a broad array of project and
system issues and needs. Some of
these strategies are often referred
to as Intelligent Transportation
Systems (ITS), but include much
broader activities. An important
resource for assessing the benefi ts
and cost of investment in TSM&O
is, Investment Opportunities
for Managing Transportation
Performance through Technology,

MnDOT - Minnesota Department of Transportation
Technical Memorandum #3: Return on Investment Methodology & Scenario Evaluation
14
. . . infrastructure investments promote a safe driving environment . . .
a USDOT 2009 report of the
Intelligent Transportation Systems
Joint Program Offi ce. Table 3 is
based on information contained in
the USDOT ITS benefi ts database.
Although the benefi t-cost ratios
reported in the USDOT table vary
by application, it is reasonable to
defi ne a range of benefi t-cost ratios
for a specifi c set of ATM techniques.
Using average benefi t-cost ratios
from USDOT and MnDOT’s most
recent four-year work plan of
ATM investments (25% signal
optimization, 60% information/
detection, and 15% ramp metering),
the average benefi t-cost ratio for
ATM investments tends toward
nine-to-one.
MnPASS
MnPASS is the high-occupancy/toll
(HOT) lane network operated by
MnDOT. The system allows single-
occupant vehicles to travel on
express lanes adjacent to general
purpose lanes with the payment
of a variable fee that is collected
electronically. MnPASS charges
are dynamically set based on the
level of congestion experienced in
the express lane with a maximum
toll of $8. MnPASS users receive
benefi ts in the form of faster and
more reliable trip times, as well as
safer driving conditions given the
controlled access to the express
lanes. Traffi c also fl ows more freely
on the non-tolled general purpose
lanes when a fraction of their
volume chooses to divert to the
MnPASS alternative.
A formal benefi t-cost analysis was
conducted on one existing MnPASS
facility (I-394, west of Minneapolis)
in February 2012 by the Center
for Transportation Studies at the
University of Minnesota. MnDOT
is planning to expand the MnPASS
network next to I-35E north of
St. Paul (ending at Little Canada
Road), with construction scheduled
Table 3. USDOT: ITS Upgrades for New, Rehabilitated or
Existing Infrastructure
Category/Project B/C RatioTRAFFIC SIGNAL
OPTIMIZATION/
RETIMING
17:1 to 62:1
Traffi
c In
cide
nt
Man
agem
ent
SAFETY
SERVICE PATROLS2:1 to 42:1
SURVEILLANCE/
DETECTION6:1
ROAD WEATHER
INFORMATION
SYSTEMS
2:1 to 10:1
RAMP
METERING
SYSTEMS
15:1
MnDOT - Minnesota Department of Transportation
Technical Memorandum #3: Return on Investment Methodology & Scenario Evaluation
15
. . . maintain the current performance of the state highway system . . .
to begin in 2014 and continuing
through 2015. Cambridge
Systematics completed a benefi t-
cost analysis for this segment in
August 2012. Additionally, a survey
of travel time and vehicle operating
cost savings was performed in
June 2010 for 14 other candidate
future MnPASS corridors, including
the six identifi ed as congestion
chokepoints by TRIP:
• MN 36
• I-94, between the downtowns
• I-35W, north from Minneapolis
to Blaine
• I-494, from I-94 to MSP Airport
• US 169
• MN 77
The median benefi t-cost statistic
across these eight opened,
programmed, and potential
MnPASS corridors serves as the
average value of the category ROI
estimate range.
Return on Investment FindingsRecognizing the fundamental
role transportation facilities and
services play in the state’s quality of
life and business climate, the TFAC
report focused on the investment
levels necessary to maintain and
modernize Minnesota’s aging
transportation infrastructure for the
state’s growing population. The two
investment options recommended
in the TFAC report are briefl y
described below followed by the
return on investment analysis.
Investment Scenarios
Maintain Current Performance
Given forecasts of future conditions
and system performance levels,
the TFAC report identifi ed an
additional $5 billion needed over
the next 20 years to maintain the
current performance of the state
highway system. According to the
TFAC report, the additional funding
would result in the following
outcomes:
• Pavement and bridge
conditions would not change
• Fatalities would continue to
drop
• Congestion would increase,
but a few spot improvement
projects could be undertaken
in isolated locations. Very few
expansion projects would
occur.
Economically Competitive & World Class System
Complementing the investment
required to maintain the current
system performance, TFAC also
recommended $7 billion in added
revenue to meet all performance
targets and deliver an economically
competitive and world class system.
The additional funding would allow
the state to achieve these important
results:
• Pavement and bridge
conditions targets are met
• The rate of decline in traffi c
fatalities and injuries is
increased
• The MnPASS vision for the Twin
Cities Metro area is completed.
Also, a modest number of high
priority expansion projects are
completed.

MnDOT - Minnesota Department of Transportation
Technical Memorandum #3: Return on Investment Methodology & Scenario Evaluation
16
. . . the benefi t-cost ratio results . . . are all based on the average investment levels . . .
Investment Scenarios: Return on Investment
The return on investment analysis
for the TFAC investment options
compares the sum of the average
benefi ts across all categories to
the incremental investment levels
found in Table 2, i.e., the total
average costs. The average benefi t
for each category is the product
of multiplying the proposed
investment level by the average
benefi t-cost ratio. Additionally, a
range of low-to-high benefi t-cost
ratios was developed based on a
sample standard deviation of the
representative projects with two
exceptions. As discussed earlier,
it is assumed that the pavement
reconstruction–corridor and
bridge replacement average
benefi t-cost ratios will tend toward
a value of one from a life-cycle
cost perspective, and accordingly,
the low and high values will be
approximately 0.5 and 1.5. It should
be emphasized that the low, high,
and average benefi t-cost ratio
results reported in the following
three summary tables (Table 4, 5,
and 6) are all based on the average
investment levels. Low and high
investment levels are subsequently
used to determine the ROI range for
each investment category (Table 7).
The fi rst question posed at the
outset of this memorandum
focused on the initial investment
scenario, the recommendation to
invest $5.4 billion over 20 years to
maintain the current performance
of the state highway system. It
asked:
1. Maintaining the current
performance of Minnesota’s
state highway system would
require an investment of an
additional $5.4 billion over the
next 20 years. What would be
the return on that investment?
Table 4, summarizes the results of
the ROI analysis for the fi rst scenario.
The proposed investment of $5.4
billion over 20 years would yield
an average benefi t-cost ratio of 3.1
to 1, within a range of 1.9 to 4.2.

MnDOT - Minnesota Department of Transportation
Technical Memorandum #3: Return on Investment Methodology & Scenario Evaluation
17
. . . the value of delivering higher performance . . .
While the pavement preservation-
corridor and capacity development
categories represent the largest
investments, the congestion
mitigation category contributes the
greatest amount of total benefi ts.
Other substantial benefi t amounts
would be derived from the
pavement preservation-corridor,
safety –spot improvement, and
MnPASS investment categories.
The second question for the ROI
analysis centered on the value of
delivering higher performance
levels across all investment
categories and an economically
competitive and world class
highway system. It asked:
2. Improving Minnesota’s state
highway system to help
the state become more
economically competitive
through technology and
operational innovations
and through high return on
investment projects to reduce
congestion and delays would
require the investment of an
additional $7.1 billion over the
next 20 years. What would be
the return on that investment?
To achieve the higher performance
levels, increased investment
in several categories would be
necessary, particularly highway
reconstruction, bridge repair
and replacement, and MnPASS.
Importantly, the congestion
mitigation-general category would
also receive a signifi cant increase
in investment, but experience
diminishing returns compared to
the initial round of investment.
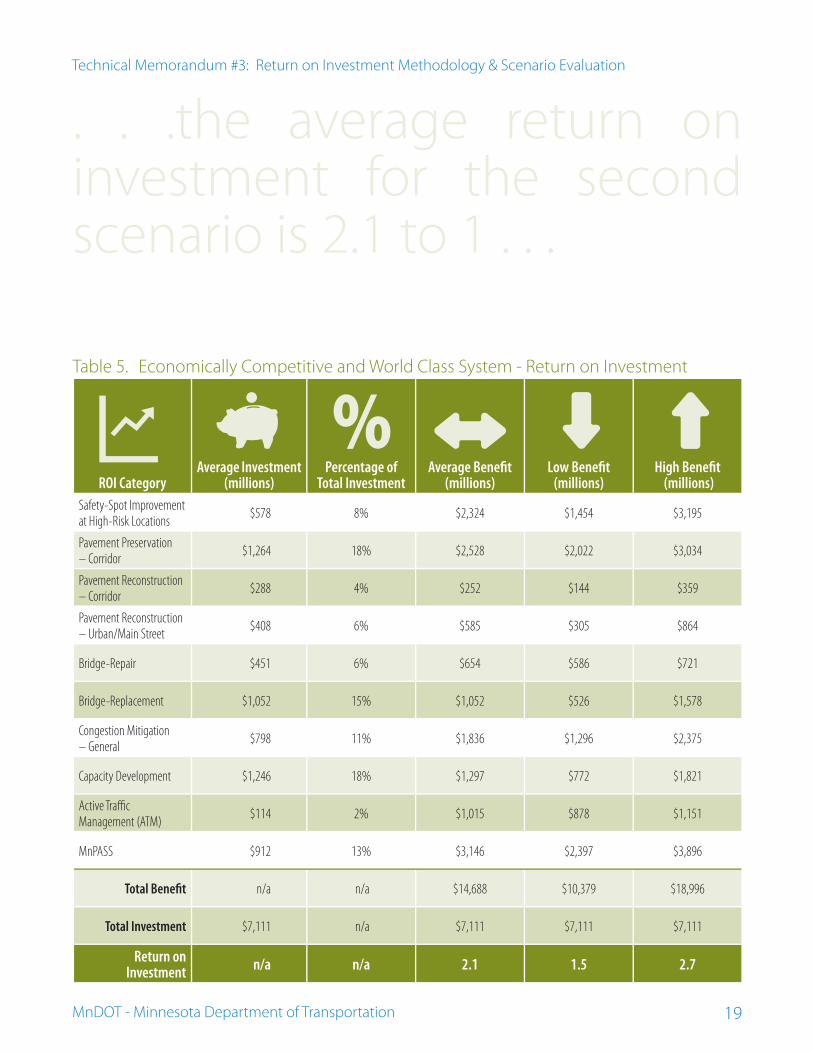
A conservative estimate of the
benefi t-cost ratio for the bridge
replacement category also limits
the overall return for this additional
investment. Consequently, as
shown in Table 5, the average return
on investment for the second
scenario is 2.1 to 1, within a range of
1.5 to 2.7.
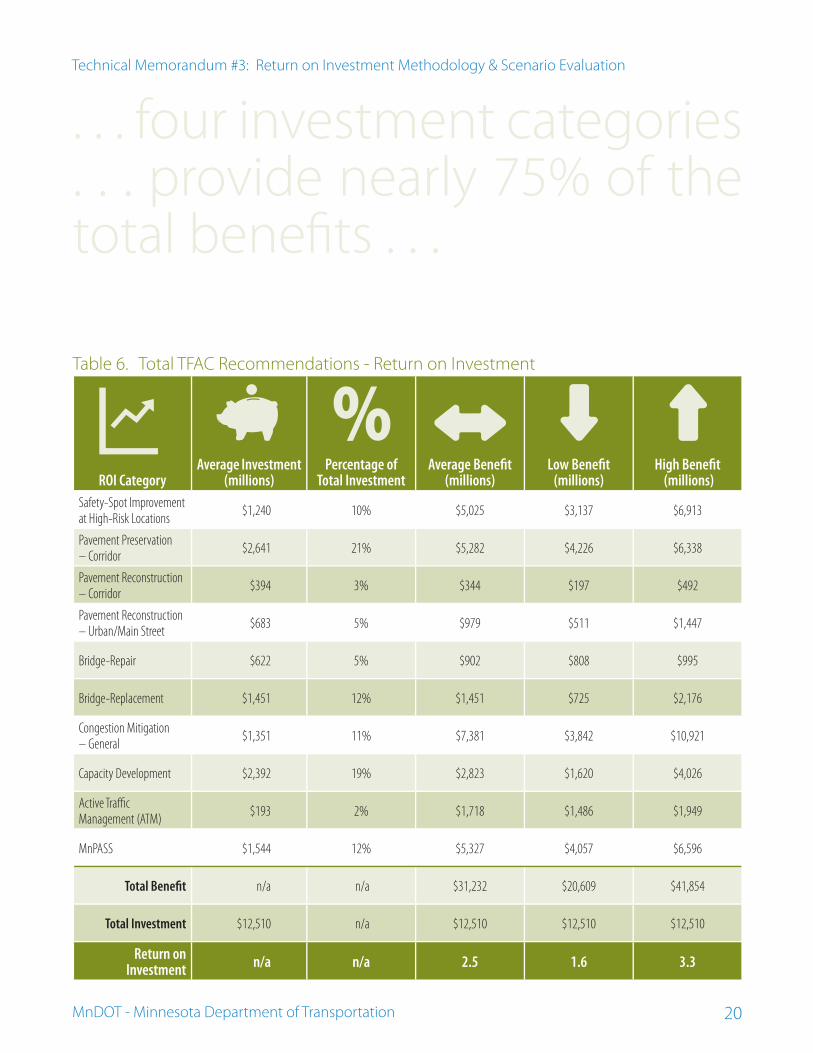
Combining the two increments
of additional investment, the total
$12.5 billion recommended by
TFAC would generate the estimated
return on investment shown in
Table 6. Six of the ten investment
categories account for 85% of
the proposed investment, with
pavement preservation-corridor
and capacity development totaling
40%. Four investment categories
– pavement preservation-
corridor, congestion mitigation-
general, MnPASS, and safety-spot
improvements – provide nearly 75%
of the total benefi ts.

MnDOT - Minnesota Department of Transportation
Technical Memorandum #3: Return on Investment Methodology & Scenario Evaluation
18
. . . increased investment in several categories would be necessary . . .
Table 4. Maintain Current Performance - Return on Investment
ROI CategoryAverage Investment
(millions)Percentage of
Total InvestmentAverage Benefi t
(millions)Low Benefi t
(millions)High Benefi t
(millions)Safety-Spot Improvement at High-Risk Locations
$662 12% $2,701 $1,684 $3,718
Pavement Preservation – Corridor
$1,377 26% $2,754 $2,203 $3,305
Pavement Reconstruction – Corridor
$106 2% $93 $53 $133
Pavement Reconstruction – Urban/Main Street
$275 5% $395 $206 $583
Bridge-Repair $171 3% $248 $222 $273
Bridge-Replacement $399 7% $399 $199 $598
Congestion Mitigation – General
$553 10% $5,546 $2,546 $8,545
Capacity Development $1,146 21% $1,526 $847 $2,204
Active Traffi c Management (ATM)
$79 1% $703 $608 $798
MnPASS $632 12% $2,180 $1,661 $2,700
Total Benefi t n/a n/a $16,544 $10,230 $22,858
Total Investment $5,400 n/a $5,400 $5,400 $5,400
Return on Investment n/a n/a 3.1 1.9 4.2
MnDOT - Minnesota Department of Transportation
Technical Memorandum #3: Return on Investment Methodology & Scenario Evaluation
19
. . .the average return on investment for the second scenario is 2.1 to 1 . . .
Table 5. Economically Competitive and World Class System - Return on Investment
ROI CategoryAverage Investment
(millions)Percentage of
Total InvestmentAverage Benefi t
(millions)Low Benefi t
(millions)High Benefi t
(millions)Safety-Spot Improvement at High-Risk Locations
$578 8% $2,324 $1,454 $3,195
Pavement Preservation – Corridor
$1,264 18% $2,528 $2,022 $3,034
Pavement Reconstruction – Corridor
$288 4% $252 $144 $359
Pavement Reconstruction – Urban/Main Street
$408 6% $585 $305 $864
Bridge-Repair $451 6% $654 $586 $721
Bridge-Replacement $1,052 15% $1,052 $526 $1,578
Congestion Mitigation – General
$798 11% $1,836 $1,296 $2,375
Capacity Development $1,246 18% $1,297 $772 $1,821
Active Traffi c Management (ATM)
$114 2% $1,015 $878 $1,151
MnPASS $912 13% $3,146 $2,397 $3,896
Total Benefi t n/a n/a $14,688 $10,379 $18,996
Total Investment $7,111 n/a $7,111 $7,111 $7,111
Return on Investment n/a n/a 2.1 1.5 2.7
MnDOT - Minnesota Department of Transportation
Technical Memorandum #3: Return on Investment Methodology & Scenario Evaluation
20
. . . four investment categories
. . . provide nearly 75% of the total benefi ts . . .
Table 6. Total TFAC Recommendations - Return on Investment
ROI CategoryAverage Investment
(millions)Percentage of
Total InvestmentAverage Benefi t
(millions)Low Benefi t
(millions)High Benefi t
(millions)Safety-Spot Improvement at High-Risk Locations
$1,240 10% $5,025 $3,137 $6,913
Pavement Preservation – Corridor
$2,641 21% $5,282 $4,226 $6,338
Pavement Reconstruction – Corridor
$394 3% $344 $197 $492
Pavement Reconstruction – Urban/Main Street
$683 5% $979 $511 $1,447
Bridge-Repair $622 5% $902 $808 $995
Bridge-Replacement $1,451 12% $1,451 $725 $2,176
Congestion Mitigation – General
$1,351 11% $7,381 $3,842 $10,921
Capacity Development $2,392 19% $2,823 $1,620 $4,026
Active Traffi c Management (ATM)
$193 2% $1,718 $1,486 $1,949
MnPASS $1,544 12% $5,327 $4,057 $6,596
Total Benefi t n/a n/a $31,232 $20,609 $41,854
Total Investment $12,510 n/a $12,510 $12,510 $12,510
Return on Investment n/a n/a 2.5 1.6 3.3

MnDOT - Minnesota Department of Transportation
Technical Memorandum #3: Return on Investment Methodology & Scenario Evaluation
21
. . . the highest ROI point estimates . . . targeting high traffi c volume . . .
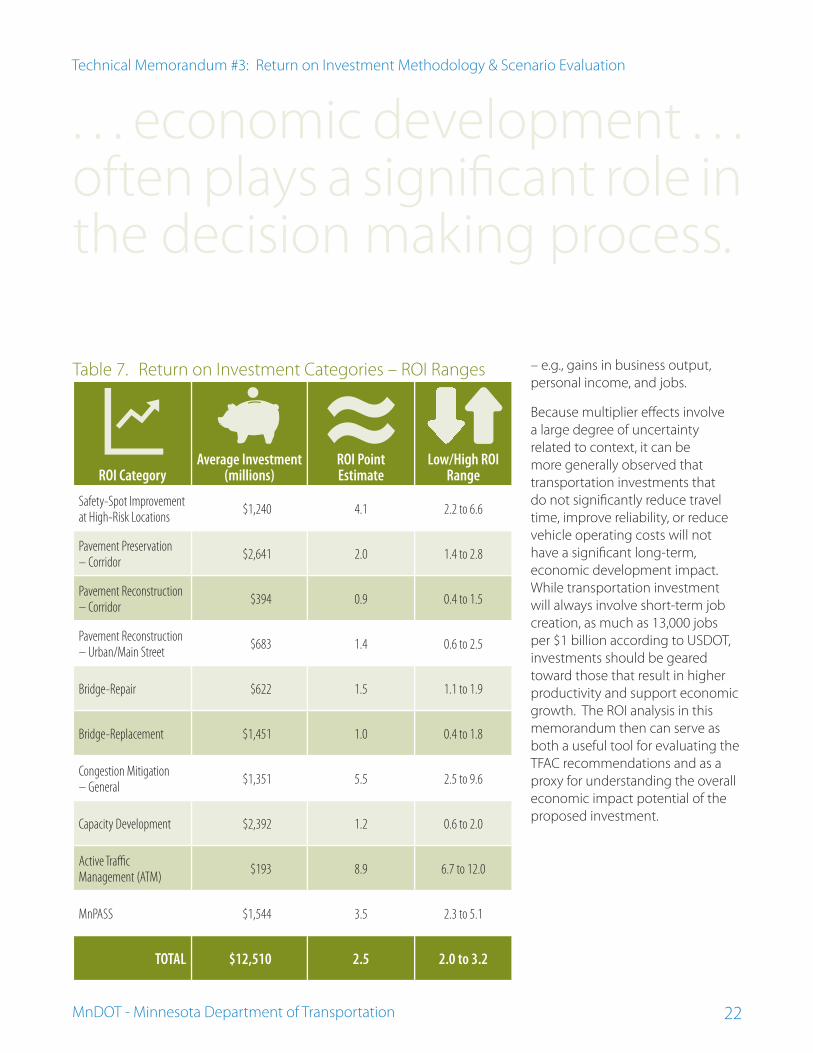
The ROI ranges in Table 7 are
based primarily on the sample
standard deviation of the analyzed
representative projects, and address
the third question posed in the
introduction. It asked:
3. Within the proposed
investments over the next
20 years, some projects and
programs will necessarily have
a higher return on investment
and some will have a lower
return on investment. Which
kinds of projects and programs
off er the highest ROI?
As one might expect, the highest
ROI point estimates are found in
those categories targeting high
traffi c volume related investments.
A simple ordering of the point
estimates, however, would show
that half of the values fall between
1.2 and 4.1. It is important also
to underscore again the diversity
of potential investments in each
category, refl ected in the ROI
ranges. To capture as much of the
diversity as possible, the low and
high estimates of benefi ts were
calculated with the high and low
cost estimates, respectively – i.e.,
the ranges attempt to defi ne the
worst and best case estimates
within each category. Finally, the
ROI range for the total investment
of $12.5 billion assumes that the
categories are mostly independent
of one another.
Of course, ROI analysis is only one
of several important pieces of
information in the transportation
investment decision making
process. Geographic and social
equity, economic development,
resilience to natural and manmade
emergencies, and competing
funding demands are some of the
many other factors that infl uence
transportation investments.
Regional and local economic
development, in particular, often
play a signifi cant role in the decision
making process.
Although the ROI analysis
contained in this document does
not attempt to quantify wider
economic development impacts,
several general observations can
be made. First, the ROI analysis and
benefi t-cost ratios do incorporate
direct user or economic benefi ts,
including travel time, travel
reliability, and vehicle operating
cost savings. These direct user
benefi ts, in turn, form the basis for
wider, long-term economic impacts
generating what are commonly
referred to as “multiplier” eff ects
MnDOT - Minnesota Department of Transportation
Technical Memorandum #3: Return on Investment Methodology & Scenario Evaluation
22
. . . economic development . . . often plays a signifi cant role in the decision making process.
– e.g., gains in business output,
personal income, and jobs.
Because multiplier eff ects involve
a large degree of uncertainty
related to context, it can be
more generally observed that
transportation investments that
do not signifi cantly reduce travel
time, improve reliability, or reduce
vehicle operating costs will not
have a signifi cant long-term,
economic development impact.
While transportation investment
will always involve short-term job
creation, as much as 13,000 jobs
per $1 billion according to USDOT,
investments should be geared
toward those that result in higher
productivity and support economic
growth. The ROI analysis in this
memorandum then can serve as
both a useful tool for evaluating the
TFAC recommendations and as a
proxy for understanding the overall
economic impact potential of the
proposed investment.
Table 7. Return on Investment Categories – ROI Ranges
ROI CategoryAverage Investment
(millions)ROI Point Estimate
Low/High ROI Range
Safety-Spot Improvement at High-Risk Locations
$1,240 4.1 2.2 to 6.6
Pavement Preservation – Corridor
$2,641 2.0 1.4 to 2.8
Pavement Reconstruction – Corridor
$394 0.9 0.4 to 1.5
Pavement Reconstruction – Urban/Main Street
$683 1.4 0.6 to 2.5
Bridge-Repair $622 1.5 1.1 to 1.9
Bridge-Replacement $1,451 1.0 0.4 to 1.8
Congestion Mitigation – General
$1,351 5.5 2.5 to 9.6
Capacity Development $2,392 1.2 0.6 to 2.0
Active Traffi c Management (ATM)
$193 8.9 6.7 to 12.0
MnPASS $1,544 3.5 2.3 to 5.1
TOTAL $12,510 2.5 2.0 to 3.2