Supported Education: Interim Results from a RCT · Supported Education: Interim Results from a RCT...
26
Supported Education: Interim Results from a RCT Michelle G. Mullen-Gonzalez, MS, CRC, CPRP University of Medicine & Dentistry of NJ Dept of Psychiatric Rehabilitation
Transcript of Supported Education: Interim Results from a RCT · Supported Education: Interim Results from a RCT...

Supported Education:
Interim Results from a RCT
Michelle G. Mullen-Gonzalez, MS, CRC, CPRP
University of Medicine & Dentistry of NJ
Dept of Psychiatric Rehabilitation

This study was supported by a grant from the
National Institute on Disability and
Rehabilitation Research (Salzer, PI:
H133B100037). The contents of this
presentation do not necessarily represent the
policy of the Department of Education, nor
endorsement by the federal government.

Description of the Study
• First study to evaluate community-based,
Supported Education for college students
• Random assignment
• Multi-site (NJ and CT)
• Two conditions
• Up to two year follow up

Intervention
• Two levels of SEd services provided
– Enhanced
– Basic
• Referral to a local SEd program; 5
programs are currently participating who
serve over 40 colleges and universities
• Intervention is provided for up to two years

Data Collected
Participants complete assessments at baseline and twice a year for two years (n=5)
• Information includes basic demographics and: – CSEQ (baseline & final assessment)
– Educational Barriers & Educational Supports
– Hopkins Symptom Checklist
– Recovery Assessment Scale & QOL
– Transcripts
– SEd program service reports

Cohorts at baseline
• Cohort 1: 22 – Completed the study in Summer 2011
• Cohort 2: 27 – Completed the study in January 2012
• Cohort 3: 24
• Cohort 4: 6
• Cohort 5: 14
• Cohort 6: 6 and still recruiting

Characteristics at Baseline
Gender
Male 29.3% Female 67.7%
Age 33.02 (SD= 11.16)
18-22 24.1%
23-30 18.8%
31 & over 57.1%
Marital Status
Single 65.7% Divorced 14.1%
Married 14.1% Separated 2%

Characteristics
Race/ Ethnicity
White 63.3% Asian 10%
African American 14.1% Other 6%
Hispanic 9%
Financial Entitlements Living Situation
SSDI 20.8% Alone 17.1%
SSI 14.6% Other students 9.1%
VA 2% Partner/Significant Other 20.3%
Parents 31.4%
Children 12.3%

Baseline Mental Health Demographics
Diagnosis
Bipolar 36.5%
Depression 30.2%
Schizophrenia/ Schizoaffective 16.6%
Other 6.3%
Not yet verified 9.4%
With 2 or more MH diagnoses 49.8%
Age at Diagnosis 21.5 (SD=8.68)
Hosp for Psych Condition Yes 64.6% No 33.3%
Age at 1st Hosp 25.34 (SD=9.33)/ 23.04 (7.024)
Number of Psych Hosp 4.45(SD=5.24)
Use Psych Meds Yes 84.4% No 13.5%

Academic Profile at Baseline
Year in School
Freshman 29.3% Sophomore 26.3%
Junior 16.2% Senior 9.1%
Graduate 13% Unclassified 4%
Self-Report Grades
A 24.2% B-, C+ 17.2%
A-, B+ 32.3% C, C-, lower 9%
B 13.1%
Campus/ Mental Health Supports
Psychiatrist Yes 87.6% Disability Services No 70.8%
Therapist Yes 69.9% Accommodations No 74%

Top Barriers to Academic
Success
• Concentrating 81.3%
• Time Management 71.9%
• Maintaining Stamina 67.7%
• Memorizing Information 65.6%
• Prioritizing Tasks 65.6%
• Studying for Exams 65.6%
• Maintaining Organization 64.6%
• Managing Symptoms 61.5%

Educational Barriers Questionnaire
Factor Analysis
Factor 1: Executive Functioning Skills
Factor 2: Essential Academic Skills
Factor 3: Logistics/Mechanics of
Postsecondary Education
Factor 4: Social Skills

Executive Functioning Subscale
0
0.1
0.2
0.3
0.4
0.5
0.6
0.7
Baseline FU1 (1-6m) FU2 (7-12m)
Enhanced
Basic

Executive Functioning
Subscale by Age Group
0
0.1
0.2
0.3
0.4
0.5
0.6
0.7
0.8
Baseline FU1 (1-6m) FU2 (7-12m)
18-22
23-30
31+

Essential Academic Skills
Subscale
0
0.1
0.2
0.3
0.4
0.5
0.6
Baseline FU1 (1-6m) FU2 (7-12m)
Enhanced
Basic

Essential Academic Skills
Subscale by Age Group
0
0.1
0.2
0.3
0.4
0.5
0.6
Baseline FU1 (1-6m) FU2 (7-12m)
18-22
23-30
31+

Logistics/ Mechanics Subscale
0
0.05
0.1
0.15
0.2
0.25
0.3
0.35
0.4
Baseline FU1 (1-6m) FU2 (7-12m)
Enhanced
Basic

Logistics/ Mechanics
Subscale by Age Group
0
0.05
0.1
0.15
0.2
0.25
0.3
0.35
0.4
0.45
0.5
Baseline FU1 (1-6m) FU2 (7-12m)
18-22
23-30
31+
Significant difference between 18-22 and 23-30 at baseline.
F(2, 88) = 3.78, p < .05

Social Skills Subscale
0
0.05
0.1
0.15
0.2
0.25
0.3
0.35
0.4
0.45
Baseline FU1 (1-6m) FU2 (7-12m)
Enhanced
Basic

Social Skills Subscale by
Age Group
0
0.1
0.2
0.3
0.4
0.5
0.6
Baseline FU1 (1-6m) FU2 (7-12m)
18-22
23-30
31+

Symptoms & SEd
• Most people are interested in the classic
psychiatric symptoms when discussing
SEd or people with psychiatric conditions
• SEd may be as helpful with symptoms as
they are with developing EF or academic
skills

Hopkins Symptom Checklist
0
0.5
1
1.5
2
2.5
Baseline FU1 (1-6m) FU2 (7-12m)
Enhanced
Basic
Significant difference at FU2 between enhanced and basic conditions.
t(37) = -2.28, p < .05

Hopkins Symptom Checklist
by Age Group
0
0.5
1
1.5
2
2.5
3
Baseline FU1 (1-6m) FU2 (7-12m)
18-22
23-30
31+
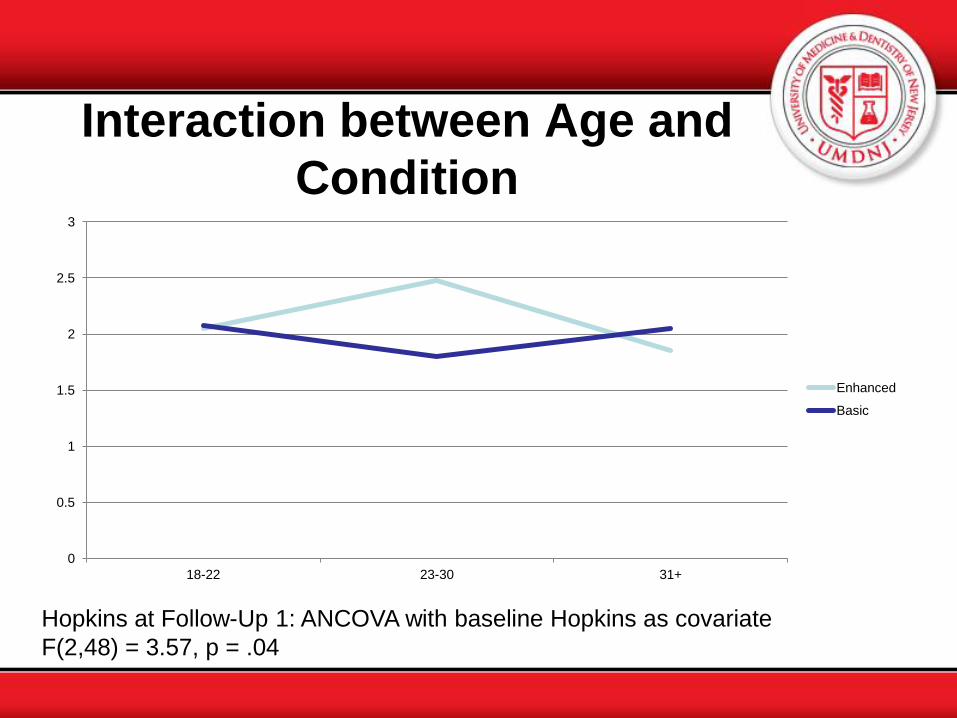
Interaction between Age and
Condition
0
0.5
1
1.5
2
2.5
3
18-22 23-30 31+
Enhanced
Basic
Hopkins at Follow-Up 1: ANCOVA with baseline Hopkins as covariate
F(2,48) = 3.57, p = .04

Findings Disclaimer
• This study is still recruiting participants
• Most of the findings do not yet have sufficient power to show statistical significance
• The preliminary findings show promise to providing evidence to SEd

More Information
If you would like more information about this
study or other studies on SEd, please
contact:
Michelle G. Mullen-Gonzalez