Support RAND For More Information · or reuse in another form, any of our research documents for...
91
For More Information Visit RAND at www.rand.org Explore RAND Project AIR FORCE View document details Support RAND Purchase this document Browse Reports & Bookstore Make a charitable contribution Limited Electronic Distribution Rights is document and trademark(s) contained herein are protected by law as indicated in a notice appearing later in this work. is electronic representation of RAND intellectual property is provided for non- commercial use only. Unauthorized posting of RAND electronic documents to a non-RAND website is prohibited. RAND electronic documents are protected under copyright law. Permission is required from RAND to reproduce, or reuse in another form, any of our research documents for commercial use. For information on reprint and linking permissions, please see RAND Permissions. Skip all front matter: Jump to Page 16 e RAND Corporation is a nonprofit institution that helps improve policy and decisionmaking through research and analysis. is electronic document was made available from www.rand.org as a public service of the RAND Corporation. CHILDREN AND FAMILIES EDUCATION AND THE ARTS ENERGY AND ENVIRONMENT HEALTH AND HEALTH CARE INFRASTRUCTURE AND TRANSPORTATION INTERNATIONAL AFFAIRS LAW AND BUSINESS NATIONAL SECURITY POPULATION AND AGING PUBLIC SAFETY SCIENCE AND TECHNOLOGY TERRORISM AND HOMELAND SECURITY
Transcript of Support RAND For More Information · or reuse in another form, any of our research documents for...

For More InformationVisit RAND at www.rand.org
Explore RAND Project AIR FORCE
View document details
Support RANDPurchase this document
Browse Reports & Bookstore
Make a charitable contribution
Limited Electronic Distribution RightsThis document and trademark(s) contained herein are protected by law as indicated in a notice appearing later in this work. This electronic representation of RAND intellectual property is provided for non-commercial use only. Unauthorized posting of RAND electronic documents to a non-RAND website is prohibited. RAND electronic documents are protected under copyright law. Permission is required from RAND to reproduce, or reuse in another form, any of our research documents for commercial use. For information on reprint and linking permissions, please see RAND Permissions.
Skip all front matter: Jump to Page 16
The RAND Corporation is a nonprofit institution that helps improve policy and decisionmaking through research and analysis.
This electronic document was made available from www.rand.org as a public service of the RAND Corporation.
CHILDREN AND FAMILIES
EDUCATION AND THE ARTS
ENERGY AND ENVIRONMENT
HEALTH AND HEALTH CARE
INFRASTRUCTURE AND TRANSPORTATION
INTERNATIONAL AFFAIRS
LAW AND BUSINESS
NATIONAL SECURITY
POPULATION AND AGING
PUBLIC SAFETY
SCIENCE AND TECHNOLOGY
TERRORISM AND HOMELAND SECURITY

This product is part of the RAND Corporation technical report series. Reports may include research findings on a specific topic that is limited in scope; present discussions of the methodology employed in research; provide literature reviews, survey instru-ments, modeling exercises, guidelines for practitioners and research professionals, and supporting documentation; or deliver preliminary findings. All RAND reports un-dergo rigorous peer review to ensure that they meet high standards for research quality and objectivity.

Costs of Flying Units in Air Force Active and Reserve Components
Albert A. Robbert

Costs of Flying Units in Air Force Active and Reserve Components
Albert A. Robbert
Prepared for the United States Air Force
Approved for public release; distribution unlimited
PROJECT AIR FORCE

The RAND Corporation is a nonprofit institution that helps improve policy and decisionmaking through research and analysis. RAND’s publications do not necessarily reflect the opinions of its research clients and sponsors.
Support RAND—make a tax-deductible charitable contribution atwww.rand.org/giving/contribute.html
R® is a registered trademark.
© Copyright 2013 RAND Corporation
This document and trademark(s) contained herein are protected by law. This representation of RAND intellectual property is provided for noncommercial use only. Unauthorized posting of RAND documents to a non-RAND website is prohibited. RAND documents are protected under copyright law. Permission is given to duplicate this document for personal use only, as long as it is unaltered and complete. Permission is required from RAND to reproduce, or reuse in another form, any of our research documents for commercial use. For information on reprint and linking permissions, please see the RAND permissions page (www.rand.org/pubs/permissions.html).
RAND OFFICES
SANTA MONICA, CA • WASHINGTON, DC
PITTSBURGH, PA • NEW ORLEANS, LA • JACKSON, MS • BOSTON, MA
DOHA, QA • CAMBRIDGE, UK • BRUSSELS, BE
www.rand.org
The research described in this report was sponsored by the United States Air Force under Contract FA7014-06-C-0001. Further information may be obtained from the Strategic Planning Division, Directorate of Plans, Hq USAF.
Library of Congress Cataloging-in-Publication Data is available for this publication.
ISBN: 978-0-8330-7666-3

iii
Preface
The relative costs of operating and supporting Air Force active- and reserve-component units is an important consideration in programming the mix of forces for various missions. Unfor-tunately, there are no generally accepted or well-documented methodologies for compiling the costs and output measures to be included in these comparisons. This report describes the devel-opment of one such methodology and applies it to exploring force mix alternatives in several weapon systems. Our objective is to provide an approach that is sufficiently comprehensive, uses accessible data, and yields replicable results.
The analysis underlying this report was based on cost, aircraft inventory, and flying hour data pertaining to Air Force active- and reserve-component flying units from FYs 2006 through 2010. This report explores the relationships among these variables and draws conclusions for their implications regarding the cost-minimizing mix of active and reserve force structure.
The Air Force Reserve conducted a detailed review of this report and does not agree with its methodology, analysis, or findings. The Air Force Reserve believes that the conclusions in this paper are not supported by Office of the Secretary of Defense force planning utilization policy and that they underestimate the reserve component’s contribution as an operational force. Due to its concerns associated with the report’s cost methodology, utilization data, and the over-reliance on the significance of “cost per operational flying hour” as a single metric, the Air Force Reserve recommends prudence when applying the insights noted in this report.
The research reported here was sponsored by the Vice Chief of Staff, United States Air Force, and conducted within the Manpower, Personnel, and Training Program of RAND Project AIR FORCE as part of a fiscal year 2012 study “Size and Shape of the Future Total Force.”
RAND Project AIR FORCE
RAND Project AIR FORCE (PAF), a division of the RAND Corporation, is the U.S. Air Force’s federally funded research and development center for studies and analyses. PAF pro-vides the Air Force with independent analyses of policy alternatives affecting the development, employment, combat readiness, and support of current and future air, space, and cyber forces. Research is conducted in four programs: Force Modernization and Employment; Manpower, Personnel, and Training; Resource Management; and Strategy and Doctrine.
Additional information about PAF is available on our website:http://www.rand.org/paf/

v
Contents
Preface . . . . . . . . . . . . . . . . . . . . . . . . . . . . . . . . . . . . . . . . . . . . . . . . . . . . . . . . . . . . . . . . . . . . . . . . . . . . . . . . . . . . . . . . . . . . . . . . . . . . . . . . . . . iiiFigures . . . . . . . . . . . . . . . . . . . . . . . . . . . . . . . . . . . . . . . . . . . . . . . . . . . . . . . . . . . . . . . . . . . . . . . . . . . . . . . . . . . . . . . . . . . . . . . . . . . . . . . . . . . viiTables . . . . . . . . . . . . . . . . . . . . . . . . . . . . . . . . . . . . . . . . . . . . . . . . . . . . . . . . . . . . . . . . . . . . . . . . . . . . . . . . . . . . . . . . . . . . . . . . . . . . . . . . . . . . ixSummary . . . . . . . . . . . . . . . . . . . . . . . . . . . . . . . . . . . . . . . . . . . . . . . . . . . . . . . . . . . . . . . . . . . . . . . . . . . . . . . . . . . . . . . . . . . . . . . . . . . . . . . . xiAcknowledgments . . . . . . . . . . . . . . . . . . . . . . . . . . . . . . . . . . . . . . . . . . . . . . . . . . . . . . . . . . . . . . . . . . . . . . . . . . . . . . . . . . . . . . . . . . . xviiAbbreviations . . . . . . . . . . . . . . . . . . . . . . . . . . . . . . . . . . . . . . . . . . . . . . . . . . . . . . . . . . . . . . . . . . . . . . . . . . . . . . . . . . . . . . . . . . . . . . . . . . xix
ChAPTer One
Introduction . . . . . . . . . . . . . . . . . . . . . . . . . . . . . . . . . . . . . . . . . . . . . . . . . . . . . . . . . . . . . . . . . . . . . . . . . . . . . . . . . . . . . . . . . . . . . . . . . . . . . 1
ChAPTer TwO
Costs and Outputs . . . . . . . . . . . . . . . . . . . . . . . . . . . . . . . . . . . . . . . . . . . . . . . . . . . . . . . . . . . . . . . . . . . . . . . . . . . . . . . . . . . . . . . . . . . . . . 5Cost Data . . . . . . . . . . . . . . . . . . . . . . . . . . . . . . . . . . . . . . . . . . . . . . . . . . . . . . . . . . . . . . . . . . . . . . . . . . . . . . . . . . . . . . . . . . . . . . . . . . . . . . . . . 6
Costs While Deployed . . . . . . . . . . . . . . . . . . . . . . . . . . . . . . . . . . . . . . . . . . . . . . . . . . . . . . . . . . . . . . . . . . . . . . . . . . . . . . . . . . . . . . . . 7Supplements to AFTOC Costs . . . . . . . . . . . . . . . . . . . . . . . . . . . . . . . . . . . . . . . . . . . . . . . . . . . . . . . . . . . . . . . . . . . . . . . . . . . . . . . 9
Output Metrics . . . . . . . . . . . . . . . . . . . . . . . . . . . . . . . . . . . . . . . . . . . . . . . . . . . . . . . . . . . . . . . . . . . . . . . . . . . . . . . . . . . . . . . . . . . . . . . . . . 10
ChAPTer Three
Cost Structures and Alternative Mixes . . . . . . . . . . . . . . . . . . . . . . . . . . . . . . . . . . . . . . . . . . . . . . . . . . . . . . . . . . . . . . . . . . . . 11Cost per Flying Hour . . . . . . . . . . . . . . . . . . . . . . . . . . . . . . . . . . . . . . . . . . . . . . . . . . . . . . . . . . . . . . . . . . . . . . . . . . . . . . . . . . . . . . . . . . . 12Operational Flying Hours . . . . . . . . . . . . . . . . . . . . . . . . . . . . . . . . . . . . . . . . . . . . . . . . . . . . . . . . . . . . . . . . . . . . . . . . . . . . . . . . . . . . . . 17Cost-Minimizing Force Mixes . . . . . . . . . . . . . . . . . . . . . . . . . . . . . . . . . . . . . . . . . . . . . . . . . . . . . . . . . . . . . . . . . . . . . . . . . . . . . . . . 18Excursions . . . . . . . . . . . . . . . . . . . . . . . . . . . . . . . . . . . . . . . . . . . . . . . . . . . . . . . . . . . . . . . . . . . . . . . . . . . . . . . . . . . . . . . . . . . . . . . . . . . . . . . . 21
Potential Changes in Fleet Size and Operational Demands . . . . . . . . . . . . . . . . . . . . . . . . . . . . . . . . . . . . . . . . . . . . 22Reducing Deployment Stress . . . . . . . . . . . . . . . . . . . . . . . . . . . . . . . . . . . . . . . . . . . . . . . . . . . . . . . . . . . . . . . . . . . . . . . . . . . . . . . 22
ChAPTer FOur
Perspectives and Insights . . . . . . . . . . . . . . . . . . . . . . . . . . . . . . . . . . . . . . . . . . . . . . . . . . . . . . . . . . . . . . . . . . . . . . . . . . . . . . . . . . . . . 25
APPenDIxeS
A. Organization Types . . . . . . . . . . . . . . . . . . . . . . . . . . . . . . . . . . . . . . . . . . . . . . . . . . . . . . . . . . . . . . . . . . . . . . . . . . . . . . . . . . . . . . . 27B. Outputs and Costs per Output . . . . . . . . . . . . . . . . . . . . . . . . . . . . . . . . . . . . . . . . . . . . . . . . . . . . . . . . . . . . . . . . . . . . . . . . . 43C. Optimization exercises . . . . . . . . . . . . . . . . . . . . . . . . . . . . . . . . . . . . . . . . . . . . . . . . . . . . . . . . . . . . . . . . . . . . . . . . . . . . . . . . . . . 57
references . . . . . . . . . . . . . . . . . . . . . . . . . . . . . . . . . . . . . . . . . . . . . . . . . . . . . . . . . . . . . . . . . . . . . . . . . . . . . . . . . . . . . . . . . . . . . . . . . . . . . . . 67


vii
Figures
S.1. Cost per Flying Hour as a Function of Flying Hours, KC-135 Wings . . . . . . . . . . . . . . . . . . . . . . xii S.2. Strategic Capacity, Operational Demand, and Ideal Force Mix . . . . . . . . . . . . . . . . . . . . . . . . . . . . xiv 1.1. Strategic, Operational, and Training Demands . . . . . . . . . . . . . . . . . . . . . . . . . . . . . . . . . . . . . . . . . . . . . . . . 2 2.1. Cost Calculations for 20th Fighter Wing (Shaw Air Force Base, South Carolina) . . . . . . . . . 8 2.2. Cost Calculations for 187th Fighter Wing (Montgomery, Alabama) . . . . . . . . . . . . . . . . . . . . . . . . 8 3.1. Total Annual Unit Costs as a Function of Flying Hours, C-130 Wings . . . . . . . . . . . . . . . . . . . . 12 3.2. Total Annual Unit Costs as a Function of Flying Hours, KC-135 Wings . . . . . . . . . . . . . . . . . . 13 3.3. Total Annual Unit Costs as a Function of Flying Hours, F-16 Wings . . . . . . . . . . . . . . . . . . . . . . 13 3.4. Total Cost per Flying Hour as a Function of Flying Hours, C-130 Wings . . . . . . . . . . . . . . . . . 15 3.5. Total Cost per Flying Hour as a Function of Flying Hours, KC-135 Wings . . . . . . . . . . . . . . . 15 3.6. Total Cost per Flying Hour as a Function of Flying Hours, F-16 Wings . . . . . . . . . . . . . . . . . . . 16 3.7. Strategic Capacity, Operational Demand, and Ideal Force Mix . . . . . . . . . . . . . . . . . . . . . . . . . . . . 22 B.1. Average Annual Flying Hours, C-130 Wings . . . . . . . . . . . . . . . . . . . . . . . . . . . . . . . . . . . . . . . . . . . . . . . . . 43 B.2. Percentage of Flying Hours That Were Operational, C-130 Wings . . . . . . . . . . . . . . . . . . . . . . . . 44 B.3. Average PMAI, C-130 Wings . . . . . . . . . . . . . . . . . . . . . . . . . . . . . . . . . . . . . . . . . . . . . . . . . . . . . . . . . . . . . . . . . . . 44 B.4. Average Cost per PMAI, C-130 Wings . . . . . . . . . . . . . . . . . . . . . . . . . . . . . . . . . . . . . . . . . . . . . . . . . . . . . . . . . 45 B.5. Average Flying Hours per PMAI, C-130 Wings . . . . . . . . . . . . . . . . . . . . . . . . . . . . . . . . . . . . . . . . . . . . . . . 45 B.6. Average Cost per Flying Hour, C-130 Wings . . . . . . . . . . . . . . . . . . . . . . . . . . . . . . . . . . . . . . . . . . . . . . . . . 46 B.7. Average Operational Flying Hours per PMAI, C-130 Wings . . . . . . . . . . . . . . . . . . . . . . . . . . . . . . . 46 B.8. Average Cost per Operational Flying Hour, C-130 Wings . . . . . . . . . . . . . . . . . . . . . . . . . . . . . . . . . . . 47 B.9. Average Annual Flying Hours, KC-135 Wings . . . . . . . . . . . . . . . . . . . . . . . . . . . . . . . . . . . . . . . . . . . . . . . . 47 B.10. Percentage of Flying Hours That Were Operational, KC-135 Wings . . . . . . . . . . . . . . . . . . . . . . 48 B.11. Average PMAI, KC-135 Wings . . . . . . . . . . . . . . . . . . . . . . . . . . . . . . . . . . . . . . . . . . . . . . . . . . . . . . . . . . . . . . . . . 48 B.12. Average Cost per PMAI, KC-135 Wings . . . . . . . . . . . . . . . . . . . . . . . . . . . . . . . . . . . . . . . . . . . . . . . . . . . . . . . 49 B.13. Average Flying Hours per PMAI, KC-135 Wings . . . . . . . . . . . . . . . . . . . . . . . . . . . . . . . . . . . . . . . . . . . . . 49 B.14. Average Cost per Flying Hour, KC-135 Wings . . . . . . . . . . . . . . . . . . . . . . . . . . . . . . . . . . . . . . . . . . . . . . . 50 B.15. Average Operational Flying Hours per PMAI, KC-135 Wings . . . . . . . . . . . . . . . . . . . . . . . . . . . . . 50 B.16. Average Cost per Operational Flying Hour, KC-135 Wings . . . . . . . . . . . . . . . . . . . . . . . . . . . . . . . . . 51 B.17. Average Annual Flying Hours, F-16 Wings . . . . . . . . . . . . . . . . . . . . . . . . . . . . . . . . . . . . . . . . . . . . . . . . . . . . 51 B.18. Percentage of Flying Hours That Were Operational, F-16 Wings . . . . . . . . . . . . . . . . . . . . . . . . . . . 52 B.19. Average PMAI, F-16 Wings . . . . . . . . . . . . . . . . . . . . . . . . . . . . . . . . . . . . . . . . . . . . . . . . . . . . . . . . . . . . . . . . . . . . . . 52 B.20. Average Cost per PMAI, F-16 Wings . . . . . . . . . . . . . . . . . . . . . . . . . . . . . . . . . . . . . . . . . . . . . . . . . . . . . . . . . . . 53 B.21. Average Flying Hours per PMAI, F-16 Wings . . . . . . . . . . . . . . . . . . . . . . . . . . . . . . . . . . . . . . . . . . . . . . . . . 53 B.22. Average Cost per Flying Hour, F-16 Wings . . . . . . . . . . . . . . . . . . . . . . . . . . . . . . . . . . . . . . . . . . . . . . . . . . . 54 B.23. Average Operational Flying Hours per PMAI, F-16 Wings . . . . . . . . . . . . . . . . . . . . . . . . . . . . . . . . . 54 B.24. Average Cost per Operational Flying Hour, F-16 Wings . . . . . . . . . . . . . . . . . . . . . . . . . . . . . . . . . . . . . 55 B.25. Average Tasked Aircraft-Days per PMAI, F-16 Wings . . . . . . . . . . . . . . . . . . . . . . . . . . . . . . . . . . . . . . . . 55 B.26. Average Cost per Tasked Aircraft-Day, F-16 Wings . . . . . . . . . . . . . . . . . . . . . . . . . . . . . . . . . . . . . . . . . . 56
viii Costs of Flying Units in Air Force Active and Reserve Components
C.1. Cost-Minimizing Force Mixes with Varying Operational Demands, C-130s . . . . . . . . . . . . . 58 C.2. Cost-Minimizing Force Mixes with Varying Fleet Sizes, C-130s . . . . . . . . . . . . . . . . . . . . . . . . . . . . 59 C.3. Increasing Operational Hours in Reserve-Component Units, Five-Year Average
Operational Demand, C-130s . . . . . . . . . . . . . . . . . . . . . . . . . . . . . . . . . . . . . . . . . . . . . . . . . . . . . . . . . . . . . . . . . . . 60 C.4. Cost-Minimizing Force Mixes with Varying Operational Demand, F-16s . . . . . . . . . . . . . . . . . 63 C.5. Cost-Minimizing Force Mixes with Varying Fleet Sizes, F-16s . . . . . . . . . . . . . . . . . . . . . . . . . . . . . 64 C.6. Increasing Operational Hours in Reserve-Component Units, Five-Year Average
Operational Demand, F-16s . . . . . . . . . . . . . . . . . . . . . . . . . . . . . . . . . . . . . . . . . . . . . . . . . . . . . . . . . . . . . . . . . . . . . 64 C.7. Increasing Operational Hours in Reserve-Component Units, Reduced Operational
Demand, F-16s . . . . . . . . . . . . . . . . . . . . . . . . . . . . . . . . . . . . . . . . . . . . . . . . . . . . . . . . . . . . . . . . . . . . . . . . . . . . . . . . . . . . . 65
ix
Tables
S.1. Operational Flying Hours as a Proportion of Total Flying Hours, FYs 2006–2010 . . . . . xiii S.2. Cost-Minimizing Active/Reserve Mixes . . . . . . . . . . . . . . . . . . . . . . . . . . . . . . . . . . . . . . . . . . . . . . . . . . . . . . . xiv 3.1. Wings Included in Cost per Flying Hour Analysis . . . . . . . . . . . . . . . . . . . . . . . . . . . . . . . . . . . . . . . . . . . . 14 3.2. Average Training, Operational, and Total Flying Hours . . . . . . . . . . . . . . . . . . . . . . . . . . . . . . . . . . . . . 17 3.3. Specifications for a Force Mix Optimization Model for the F-16 Fleet . . . . . . . . . . . . . . . . . . . . . 19 3.4. Cost-Minimizing Active/Reserve Mixes . . . . . . . . . . . . . . . . . . . . . . . . . . . . . . . . . . . . . . . . . . . . . . . . . . . . . . . 20 A.1. Organization Types Used to Categorize Costs . . . . . . . . . . . . . . . . . . . . . . . . . . . . . . . . . . . . . . . . . . . . . . . . 27 C.1. C-130 Fleet Size Alternatives . . . . . . . . . . . . . . . . . . . . . . . . . . . . . . . . . . . . . . . . . . . . . . . . . . . . . . . . . . . . . . . . . . . . . 61


xi
Summary
The relative costs of operating and supporting Air Force active- and reserve-component units are an important consideration in programming the mix of forces for various missions. Unfor-tunately, there are no generally accepted or well-documented methodologies for compiling the costs and output measures to be included in these comparisons. This report describes the development of one such methodology, using recorded costs from past periods, and applies it to an exploration of force mix alternatives in several weapon systems.
The primary source of our cost data was the Air Force Total Ownership Cost (AFTOC) decision support system. Using this and other, minor sources, we determined, as fully as pos-sible, the local costs of active and reserve flying wings, including their share of base infrastruc-ture support costs, in fiscal years 2006 through 2010. We focused on the Air Force’s C-130 tac-tical airlifter, KC-135 aerial refueler, and F-16 multirole fighter fleets—each well represented in the reserve components.
Since active and reserve flying wings differ widely in size, total unit costs do not provide a useful comparison. Rather, costs need to be related to comparable outputs. To that end, we gathered, primarily from AFTOC, information on each wing’s annual average number of owned aircraft, total flying hours, and operational (as opposed to training) flying hours.1,2 Additionally, for fighter wings, we found annual sums of aircraft-days tasked to meet combat-ant commander requirements. Dividing total annual wing costs by each of these outputs gave us comparable costs per output.
We found that annual costs per owned aircraft in reserve-component units are typically only one-half to two-thirds of the cost in active-component units. This is attributable primarily to the fact that reserve-component units generate about one-half to two-thirds of the annual flying hours per owned aircraft generated by active-component units.
Consistent with the above, we found that the average total costs per flying hour for reserve-component units are in roughly the same ranges as those for larger active-component units based in the continental United States (CONUS). The reserve components have signifi-cant cost advantages due to factors such as Spartan base infrastructures and more experienced (and hence more productive) workforces. We confirmed this, noting that at any observed scale
1 In AFTOC terminology, aircraft in a unit’s primary mission aircraft inventory (PMAI) are referred to as “owned” by the unit. This category includes all aircraft assigned to the unit that are devoted to the primary flying mission of the unit. It excludes backup, attrition, and reconstitution reserves. 2 In AFTOC, flying hours are mapped to three categories—operations, training, and testing—based on the mission symbol (which indicates the purpose of a sortie) captured in documentation pertaining to each sortie.

xii Costs of Flying Units in Air Force Active and Reserve Components
of operation, reserve-component units have a significantly lower cost per flying hour.3 Scale of operation here refers to the number of flying hours per time period generated by a unit. So, for example, reserve component units that flew about 7,500 hours in a year had lower average flying costs per hour than did active-component units that also flew 7,500 hours. This is shown in Figure S.1, which shows the average costs per flying hour, arranged along the horizontal axis by total number of hours flown, for one of the aircraft we studied, the KC-135. Results for the C-130 and F-16 are similar.
But the reserve components face an offsetting disadvantage in that their fleets are dis-persed across many small-scale operations—too small to realize available economies of scale. Most reserve-component KC-135 units flew less than 6,000 hours in a year, whereas no active component did so. As Figure S.1 shows, the costs per flying hour in those small-scale reserve-component units tend to be at or above costs per flying hour in larger-scale active-component units.
Compared with reserve-component units, active units typically fly a higher proportion of their total flying hours as operational. Table S.1 indicates the five-year averages of these propor-tions for the three aircraft types in our analysis. When total unit costs are spread across active units’ larger proportions of operational flying hours, their costs per operational flying hour are often lower than in reserve-component units.
For the purpose of meeting strategic demands, reserve-component units provide mission-ready aircraft with competent aircrew and maintenance workforces at lower cost per aircraft than active units. In contrast, active units have often met operational demands at lower cost per
3 Typically, only overseas-based active units are observed to operate on the more limited scale observed in reserve compo-nent units.
Figure S.1Cost per Flying Hour as a Function of Flying Hours, KC-135 Wings
NOTE: Each dot represents one wing’s average cost per flying hour and total flying hours in one fiscal year.RAND TR1275-S.1
Co
st p
er fl
yin
g h
ou
r (F
Y 2
010
$)
Total annual unit flying hours (average FYs 2006–2010)
0
10,000
20,000
30,000
40,000
50,000
60,000
70,000
80,000
0 5,000 10,000 15,000 20,000 25,000 30,000 35,000
Active-component units
Reserve-component units

Summary xiii
flying hour. To determine the cost-minimizing force mix suggested by these asymmetrical cost advantages, we constructed optimization models that minimize total fleet costs subject to a set of constraints, including that strategic, operational, and proficiency flying demands are met and that active and reserve units operate at feasible or desirable levels of intensity and opera-tional tempo.4 Our three output measures correspond to those demands—total owned aircraft indicates strategic capacity, total annual operational flying hours indicates operational capac-ity, and total annual flying hours indicates proficiency flying capacity. Using these models, in two of the three fleets we studied we found that demands satisfied during our five-year history could have been met less expensively with more of the fleets in the active component. Table S.2 indicates the result of these analyses for the five-year period (FYs 2006 through 2010) we examined. In these analyses, the cost-minimizing mix retains the same total fleet size and the same number of operational flying hours as the five-year average (or a modified two-year aver-age in the case of the C-130 fleet).
In excursions using our optimization models, we found that reducing operational demands would tilt the cost-minimizing mix in the direction of the reserve components, while reducing planned strategic capacity (fleet size) would have the opposite effect. In general, as illustrated in Figure S.2, the greater the ratio of strategic capacity to operational demand, the greater the proportion of the cost-minimizing mix that would be in the reserve components.
In the near term, the Air Force faces budget-driven reductions in its fleet sizes but no immediate reduction in operational demands. For the three fleets we examined, this suggests that near-term fleet reductions should be taken in the reserve components. This will allow the remaining fleets to meet continuing operational demands with fewer total flying hours and less deployment stress on individual active aircrews and maintenance workforces. If operational demands subsequently subside, the stage will then be set for tilting the mix back toward the reserve components.
Anticipating future strategic and operational demands is beyond the scope of this research, and due to the issues associated with transferring aircraft between components, prudence will be required in applying the insights noted here. That prudence will naturally be applied as part
4 Strategic demand refers to the surge capacity needed for major theater warfare, as represented in defense planning sce-narios. Operational demand, sometimes called steady-state demand, refers to the capacity to meet ongoing combatant com-mander taskings.
Table S.1Operational Flying Hours as a Proportion of Total Flying Hours, FYs 2006–2010
AircraftActive
Component (%)Reserve
Components (%)
C-130 68 55
KC-135 76 50
F-16 43 25
NOTE: Data are for aircraft with purpose codes CA (combat support) and CC (combat) only. Aircraft coded TF (training) or for various test or other special purposes are not included.

xiv Costs of Flying Units in Air Force Active and Reserve Components
Table S.2Cost-Minimizing Active/Reserve Mixes
Aircraft Component
Recent Average Cost-Minimizing Mix
Potential Annual
Savings ($)Total PMAI
Total Flying Hours
Annual Fleet Cost ($, billions)
Total PMAI
Total Flying Hours
Annual Fleet Cost ($, billions)
C-130 Active 88 63,200 1.42 73 58,000 1.28
Reserve 198 84,200 1.76 213 90,700 1.90
Associate 6,100 0.22 6,100 0.22
Total 286 153,400 3.40 286 154,800 3.40 0 (0.0%)
KC-135 Active 128 106,800 2.05 331 161,100 3.08
Reserve 203 83,800 1.83
Associate 9,300 0.19 9,300 0.19
Total 331 199,900 4.07 331 170,400 3.27 800 million (19.7%)
F-16 Active 340 107,700 2.80 421 120,400 3.17
Reserve 319 69,700 1.55 239 47,800 1.12
Associate 4,100 0.07 4,100 0.07
Total 660 181,500 4.41 660 172,300 4.35 60 million (1.4%)
NOTE: Values shown for KC-135 and F-16 are averages for FYs 2006 through 2010 for units included in our analyses. Values for the C-130 are for 2009 and 2010 (period truncated due to deactivation of an active wing in 2008). Cost-minimizing mixes retain the same fleet size and produce the same total annual operational flying hours as the recent average (see five-year-average data in Table 3.2).
Figure S.2Strategic Capacity, Operational Demand, and Ideal Force Mix
RAND TR1275-S.2
Forc
e m
ix
Active forces
Reserve forces
Ratio of strategic capacity to operational demand
Strategic capacity equalsoperational demand
Strategic capacity well aboveoperational demand

Summary xv
of the Air Force’s total force enterprise review process, which examines the costs and benefits of active and reserve component partnerships.
Since active and reserve component units experience roughly comparable overall costs per flying hour, active-component units that regularly operate at a higher operational tempo can satisfy operational demand at lower total costs than non-activated reserve-component units operating at a lower operational tempo. However, reserve component units may cur-rently be constrained in their contribution to meeting operational demand by factors that can be changed, to include activation and/or mobilization policies, mission scheduling procedures, and man-day funding. If these constraints can be relaxed, reserve component units might accept more operational missions, resulting in a higher proportion of flying hours flown opera-tionally and a lower cost per operational flying hour. To be prudent, increased operational contributions from the reserve components should be demonstrated before force mix decisions are based upon them.
Generally speaking, for the purpose of meeting strategic surge demand, reserve compo-nent units provide mission-ready aircraft with competent aircrew and maintenance workforces at lower cost than active component units. The asymmetrical cost advantages in the two com-ponents are reflected in the agility and responsiveness relied upon in the active component, and by the complementary depth and capacity provided by the reserve components. From a cost perspective, the nation is therefore well served by a sustained active component/reserve component mix in its air arm.

xvii
Acknowledgments
General Philip Breedlove, as Vice Chief of Staff of the Air Force, recognized the need for a better understanding of the costs of active and reserve units and, accordingly, asked RAND Project AIR FORCE to undertake this effort. We are especially indebted to Larry Klapper, Office of the Assistant Secretary of the Air Force for Financial Management, Deputy Assistant Secretary for Cost and Economics (SAF/FMC), for his assistance in providing Air Force cost data and helping us to understand its intricacies. Contributions to the underlying analysis and preparation of this report were made by RAND colleagues, including Tara Terry, Lisa Har-rington, John Boon, Michael Boito, Michael McGee, Gary Massey, and Daniel Norton. Air Force Captain Adrian Patrascu, assigned at RAND on an Education-with-Industry tour, con-tributed to the research. RAND’s Lou Mariano was most helpful in reviewing and critiquing our statistical analyses.
The document benefited significantly from critical reviews provided by RAND colleagues Jack Graser, Jeff Hagen, and Michael Hansen and editing by James Torr. Any remaining errors are my own.

xix
Abbreviations
AC active component
AFRC Air Force Reserve Command
AFTOC Air Force Total Ownership Cost
AMC Air Mobility Command
ANG Air National Guard
CA combat support (U.S. Air Force aircraft identification code)
CC combat (U.S. Air Force aircraft identification code)
CONUS continental United States
DoD U.S. Department of Defense
FW fighter wing
FY fiscal year
JCS Joint Chiefs of Staff
MAJCOM major command
NAF numbered air force
OSD Office of the Secretary of Defense
PMAI primary mission aircraft inventory
RC reserve component
REMIS Reliability and Maintainability Information System
ROTC Reserve Officer Training Corps


1
ChApTER ONE
Introduction
Minimizing cost is an important consideration in evaluating active/reserve force mix alterna-tives. One of the compelling reasons for maintaining reserve components (Air Force Reserve Command [AFRC] and the Air National Guard [ANG]) in the force is the potential to reduce costs relative to a force that is entirely active. However, clear delineation of the relative costs of active and reserve forces, or of the total cost of force mix alternatives, is often elusive. Conclu-sions regarding relative costs are typically based on a surrogate for costs—estimates of full-time and part-time military personnel strengths in comparable active and reserve units. See, for example, the discussion of rotational cycle costing in a recent report from the offices of the Joint Chiefs of Staff (JCS) and Secretary of Defense (OSD) (DoD, 2011, pp. 46–51) or a similar discussion in an AFRC white paper on force mix decisions (AFRC, 2011, pp. 8–11).
Buck (2008) described three alternative approaches to depicting relative reserve- and active-component costs. A traditional, simple method compares the reserve-component budget as a proportion of the total force budget with the reserve-component force structure as a pro-portion of the total force structure. A second approach, such as that described in the previous paragraph, uses the cost of individual members as a starting point. A final method examines the full cost of operating and supporting individual units. Klerman (2008), for example, used this approach to depict the relative costs of Army brigade combat teams. Earlier, Robbert, Williams, and Cook (1999) used a similar approach but relied on cost models for typical units rather than actual costs for actual units.
Consistent with Buck’s third method, better cost comparisons would account as fully as possible for the personnel, logistics, installation support, and other related costs for comparable units. Our objective in this analysis is to provide an approach that comprehensively captures these relevant costs, using data that are widely accessible, and yielding results that can be rep-licated by other analysts.
Cost information with sufficient granularity for this approach is assembled and dissemi-nated by the Air Force in its Air Force Total Ownership Cost (AFTOC) system (Office of the Assistant Secretary of the Air Force for Financial Management [SAF/FM], 2011). Along with recorded expenditures, AFTOC collects administrative information that allows costs, through evolving business rules, to be associated with the Air Force units, bases, and, in some cases, the aircraft systems for which they were incurred. However, we found that AFTOC does not organize costs in a way that permits ready comparison of active and reserve units. For this com-parison, we constructed our own business rules to parse the available AFTOC data, identifying costs that are relevant to this comparison and excluding those that are not.
Once unit costs are determined, they must be related to useful outputs. Simply com-paring total unit costs—costs of operating wings or squadrons, for example—is inappropri-
2 Costs of Flying Units in Air Force Active and Reserve Components
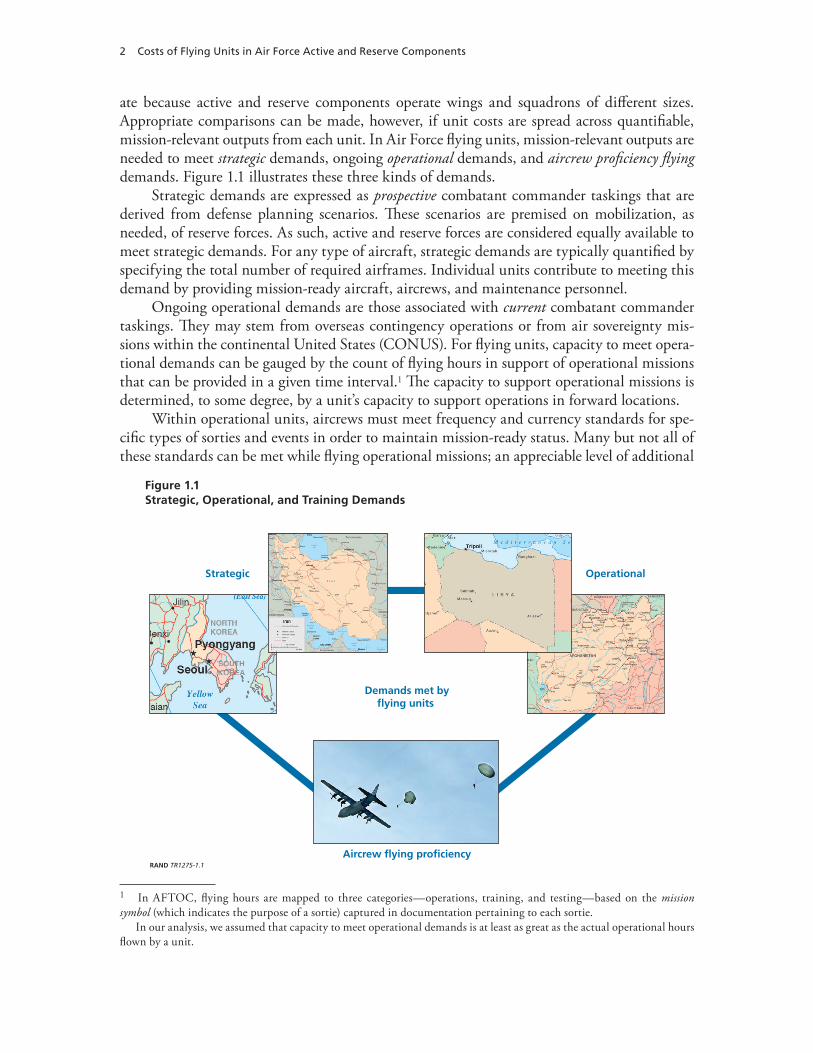
ate because active and reserve components operate wings and squadrons of different sizes. Appropriate comparisons can be made, however, if unit costs are spread across quantifiable, mission-relevant outputs from each unit. In Air Force flying units, mission-relevant outputs are needed to meet strategic demands, ongoing operational demands, and aircrew proficiency flying demands. Figure 1.1 illustrates these three kinds of demands.
Strategic demands are expressed as prospective combatant commander taskings that are derived from defense planning scenarios. These scenarios are premised on mobilization, as needed, of reserve forces. As such, active and reserve forces are considered equally available to meet strategic demands. For any type of aircraft, strategic demands are typically quantified by specifying the total number of required airframes. Individual units contribute to meeting this demand by providing mission-ready aircraft, aircrews, and maintenance personnel.
Ongoing operational demands are those associated with current combatant commander taskings. They may stem from overseas contingency operations or from air sovereignty mis-sions within the continental United States (CONUS). For flying units, capacity to meet opera-tional demands can be gauged by the count of flying hours in support of operational missions that can be provided in a given time interval.1 The capacity to support operational missions is determined, to some degree, by a unit’s capacity to support operations in forward locations.
Within operational units, aircrews must meet frequency and currency standards for spe-cific types of sorties and events in order to maintain mission-ready status. Many but not all of these standards can be met while flying operational missions; an appreciable level of additional
1 In AFTOC, flying hours are mapped to three categories—operations, training, and testing—based on the mission symbol (which indicates the purpose of a sortie) captured in documentation pertaining to each sortie.
In our analysis, we assumed that capacity to meet operational demands is at least as great as the actual operational hours flown by a unit.
Figure 1.1Strategic, Operational, and Training Demands
RAND TR1275-1.1
Strategic Operational
Aircrew flying proficiency
Demands met byflying units
Introduction 3
flying, beyond that executed to meet operational demands, is generally required to maintain mission-ready status. Thus, the capacity to support aircrew proficiency training can be mea-sured by the total flying hours that a unit can generate in a given time interval.2
Dividing total costs by each of these output measures—total owned aircraft, operational flying hours, and total flying hours—yields costs per output. Costs per output can be differen-tiated for active and reserve units. An efficient active/reserve mix is one that minimizes these costs while meeting the three kinds of demands described above. As we shall demonstrate, however, the picture is complicated by the fact that the component that contributes to meeting strategic demands at lowest cost may not contribute to meeting operational demands at lowest cost.
In this analysis, we examined costs and outputs for three types of aircraft that are well represented in both active and reserve components: C-130 tactical airlifters, KC-135 aerial refuelers, and F-16 multirole fighters. We focused on operational units, as distinguished from units whose specific mission is to provide initial or requalification training in an aircraft type prior to a pilot’s assignment to an operational unit. We examined costs and outputs during fiscal years (FYs) 2006 through 2010. We explored how alternative active and reserve mixes could have provided the same capacities as were actually observed during that period, and we estimated how cost-minimizing mixes might shift if different capacities were programmed.
Chapter Two of this report describes how we compiled and parsed cost data, output met-rics, and the resulting costs per output. Chapter Three provides analyses of cost structures and exploration of cost-minimizing mixes under varying conditions. Chapter Four provides overall perspectives and insights drawn from the analysis.
2 During periods of heavy operational taskings, some units may be unable to meet training standards for all missions/events, especially missions/events not used in their deployed operating environments. Nonetheless, we believe that total flying hours rather than training flying hours provide the better metric for measuring aircrew proficiency training capacity.


5
ChApTER TwO
Costs and Outputs
Active and reserve components differ in several important respects that have potentially sig-nificant impacts on their costs and outputs. To permit a credible comparison of the costs of their outputs, we needed to acquire data that reflected these differences as fully as possible. We wanted, for example, to be sensitive to the significant differences in installation infrastructure costs at the typically Spartan reserve-component installations and the typically larger, more well-appointed active-component installations. We also wanted to reflect differences in person-nel characteristics, such as the part-time status of many reserve-component military person-nel, the lower turnover in reserve-component units, and the higher experience levels generally found in reserve-component units.
While we sought to include costs that are relevant to the way the active and reserve components generate outputs, we determined that certain other cost elements should not be included in our comparisons. We excluded the costs of acquiring weapon systems. Aircraft acquisition costs do not differ in any systematic way as a function of the component that will eventually own the asset. Additionally, in determining the force mix, acquisition costs are sunk costs that should not influence disposition of the assets. We also excluded costs associated with joint, service, major command (MAJCOM), and numbered air force (NAF) headquarters and various field operating agencies and direct reporting units. While primarily housed within the active component, these are largely devoted to managing the total enterprise of the Air Force, including the reserve components, as opposed to managing just the active component of the Air Force.
Given these considerations, we aggregated costs and outputs at the level of operational flying wings.1 We determined each wing’s operating and maintenance costs for its primary mission aircraft, plus the wing’s share of installation support costs, for each of the five fiscal years included in our analysis. For output measures, we captured the average count of owned aircraft, operational flying hours, and total flying hours for each wing in each year.2,3 For fighters, we captured an additional output measure tracked by Air Combat Command—total
1 In a very few cases, we aggregated at the level of groups or squadrons that were operating at separate locations from their parent wings.2 In AFTOC terminology, aircraft in a unit’s primary mission aircraft inventory (PMAI) are referred to as “owned” by the unit. This category includes all aircraft assigned to the unit that are devoted to the primary flying mission of the unit. It excludes backup, attrition, and reconstitution reserves. 3 As noted in Chapter One, in AFTOC, flying hours are mapped to three categories—operations, training, and testing—based on the mission symbol (which indicates the purpose of a sortie) captured in documentation pertaining to each sortie.

6 Costs of Flying Units in Air Force Active and Reserve Components
annual aircraft-days supplied to meet combatant commander taskings.4 Total costs divided by each of the output measures provided the costs per output for each operational wing.
Many operational wings are host to an associate unit. Associate units have their own assigned personnel and their own budgets, but no assigned aircraft. Instead, they maintain and operate the aircraft owned by the host unit. In classic associations, the host unit is an active wing and the associate unit is a reserve component wing. However, in active associations, the host unit is a reserve component wing and the associate unit is an active squadron or element. In air reserve component associations, both host and associate units are in the reserve compo-nents. AFTOC reports both costs and outputs of host and associate units separately. Relying on these data, we segregated the costs and outputs of host and associate units.
Cost Data
AFTOC is a management information system intended to provide as complete a picture as possible of the costs of ownership of Air Force weapon systems. It is maintained by the SAF/FM, that office’s subordinate organizations (such as the Air Force Cost Analysis Agency), and supporting contractors. Raw data are collected from various Air Force data systems, ware-housed, and extensively processed using evolving business rules prior to being made available for retrieval through web-based utilities. Costs fall into three broad categories—military pay, civilian pay, and non-pay. They are acquired with enough detail to permit, to varying degrees, disaggregating them to organizational levels (e.g., MAJCOM, wing, and squadron), weapon systems, installations, and other useful classifications. Most are actual execution costs, the exception being military personnel costs. Military personnel costs are paid from a central account that does not provide a means for associating them with units, locations, or weapon systems. Accordingly, AFTOC determines military personnel costs indirectly by acquiring assigned personnel strengths at a very granular level and multiplying them by standard com-posite rates for military pay and benefits.5
An operational wing is often not the only customer served by an installation’s support functions. An operational wing may share an installation with, for example, a MAJCOM, a NAF headquarters, an ANG state headquarters, or other direct mission units.6 To isolate the installation support costs incurred by the operational wing, we had to find a basis for prorating the installation support costs across it and the other direct-mission units on the installation. After consultation with Air Force cost analysts, we determined that the best available basis for allocating installation support costs would be relative proportions of military pay costs in the
4 These data were derived from a source not available to the general public.5 A useful summary of cost data included in AFTOC can be found within the password-protected AFTOC website in a document titled “About Appropriations Data Products” (U.S. Air Force, no date). All DoD employees are authorized to gain access to the AFTOC site; contractors must have DoD sponsorship.
Separate composite rates are used for full-time and part-time military personnel. These rates are sensitive to the differ-ences in pay and benefits, including retirement accrual, between active and reserve personnel.6 We use the term direct mission in this context to identify units that have a mission directed to some purpose other than installation support. In addition to the examples cited in the text, this might include a Red Horse civil engineering squad-ron, another operational wing operating a different weapon system, a field operating agency, or other similar activities.
Costs and Outputs 7
direct mission units.7 Because of AFTOC’s indirect method of computing military personnel costs, these costs are always associated with units, at both wing and squadron or equivalent levels. In contrast, many civilian pay and non-pay costs are disaggregated to the level of wings and comparable organizations but not to squadrons. Civilian personnel costs associated with a host wing were treated as a support cost to be allocated across the direct missions on the installation.
To isolate direct mission costs and allocate installation support costs, we divided costs observed in AFTOC at an installation into five bins. In describing these categories, we refer to a focal unit—the term we use for a wing that operates the focal aircraft type (C-130, KC-135, or F-16) being analyzed. The five bins are as follows:
1. military pay in operations and maintenance activities in the focal unit2. military pay in other direct mission units 3. other costs linked through AFTOC business rules to the focal aircraft type4. other costs linked through AFTOC business rules to aircraft types other than the focal
aircraft type (rarely used; applies only on installations supporting multiple aircraft types)5. installation support costs (by definition, all costs not included in the first four catego-
ries).
To sort the costs into these categories, we relied primarily on the types of organizations to which the costs were linked, using organizational nomenclature provided in AFTOC. Appen-dix A indicates how we mapped organizational nomenclatures to focal unit operations and maintenance (bin 1), other direct missions (bin 2), and installation support (bin 5) categories for each of the three types of aircraft we examined. Secondarily, we used mission/design indi-cators provided in AFTOC to sort costs into the bins.
The next step in our process was to allocate installation support costs to the focal unit. We calculated the costs in bin 1 as a proportion of costs in bin 1 plus bin 2. We then allocated the proportion of bin 5 costs to the focal unit. The total AFTOC-derived costs for the focal unit are those in bin 1 plus bin 3 plus the prorated share of bin 5. Figures 2.1 and 2.2 illustrate how these costs were broken out for an active and a reserve wing, respectively. The figures also show how some supplemental costs not captured in AFTOC, discussed below, are brought into the total cost.
Costs While Deployed
Many costs incurred by deployed units are recorded in AFTOC in the same way as costs incurred when those units are in garrison, i.e., the installation field in AFTOC contains the garrison unit and base name rather than the expeditionary unit and base name. This is true for military personnel costs because they are based on the assigned strengths of garrison units, and the assigned strength is unaffected by deployments. It is also true for aircraft-related costs and flying hours, accounted for by aircraft tail number, because, for AFTOC cost-accounting purposes, aircraft remain associated with their garrison unit even while deployed.
7 An alternative method would have been to allocate support costs in proportion to full-time-equivalent manpower in the direct mission units. AFTOC provides military manpower counts in each unit, but does not distinguish between full-time and part-time manpower. However, military pay data included in AFTOC are based on full-time/part-time distinctions, making pay the better basis for allocating support costs.

8 Costs of Flying Units in Air Force Active and Reserve Components
Figure 2.1Cost Calculations for 20th Fighter Wing (Shaw Air Force Base, South Carolina)
NOTES: FW = fighter wing. Costs shown here, for illustration, are five-year averages without inflation. Data usedin analyses were inflated to FY 2010 constant dollars after totals were reached.RAND TR1275-2.1
20th FW F-16Operations andmaintenancemilitary pay$136 million Bin 1
9th AF and otherdirect missionsMilitary pay$94 million Bin 2
Direct missionsTotal military pay$230 million
20th FW F-16Other costs linkedto F-16$168 million Bin 3
Other costs notlinked to F-16 orother direct mission$222 million Bin 5
20th FW F-16Prorated unlinkedcosts$131 million
20th FW F-16Total AFTOC costs$435 million
20th FW F-16Extended medical costs$10 million Non-AFTOC
20th FW F-16Training pipeline costs$38 million Non-AFTOC
20th FW F-16Total costs$483 million
59% Typical items: fuel, depot-levelreparables, civilian pay
Typical items: civil engineering squadron,security forces squadron, mission supportsquadron, contract services, utilities, supplies
20th FW F-16 operations and maintenancemilitary manpower is 59% of this total
Figure 2.2Cost Calculations for 187th Fighter Wing (Montgomery, Alabama)
NOTES: Costs shown here, for illustration, are five-year averages without inflation. Data used in analyses wereinflated to FY 2010 constant dollars after totals were reached.RAND TR1275-2.2
187th FW F-16Operations andmaintenancemilitary pay$8.0 million Bin 1
Alabama ANG Hqand other directmissionsMilitary pay$3.8 million Bin 2
Direct missionsTotal military pay$11.8 million
187th FW F-16Other costs linkedto F-16$41.2 million Bin 3
Other costs notlinked to F-16 orother direct mission$21.2 million Bin 5
187th FW F-16Prorated unlinkedcosts$14.4 million
187th FW F-16Total AFTOC costs$63.6 million
187th FW F-16Man-day costs$11.7 million Non-AFTOC
187th FW F-16Training pipeline costs$4.4 million Non-AFTOC
187th FW F-16Total costs$79.7 million
68% Typical items: fuel, depot-levelreparables, civilian pay
187th FW F-16 operations and maintenancemilitary manpower is 68% of this total
Typical items: civil engineering squadron,security forces squadron, mission supportsquadron, contract services, utilities, supplies

Costs and Outputs 9
In our cost analyses, we consider the fact that these costs are traced back to garrison units to be advantageous. We sought to include all costs, both those incurred in garrison and those incurred while deployed, in our cost-per-output calculations. For example, the cost of train-ing sorties generated in garrison should be considered part of the cost of an operational flying hour generated while deployed. Said another way, a dwell-to-deploy ratio recognizes that costs incurred during periods of dwell are part of the overall costs incurred to sustain a unit’s opera-tional outputs while deployed.
Some extraordinary costs incurred at deployed locations are not reflected via assigned personnel counts or aircraft tail numbers back to garrison flying units. These expeditionary installation-related costs are equally applicable to both active- and reserve-component units. They are not included in our cost calculations, and should not be. Our objective in this study is to examine the relative efficiency of active and reserve units in generating outputs, but includ-ing these costs would make units that deployed more appear to be less efficient. Moreover, as the mix of active and reserve forces changes, these costs remain fixed.
Supplements to AFTOC Costs
Some relevant costs are not included in AFTOC, requiring us to estimate them separately and add them to our AFTOC-derived costs.
For active duty military personnel, the composite rate used in AFTOC to estimate per-sonnel costs excludes certain health care costs paid for by DoD rather than by the Air Force. In 2010, this was $9,586 per active duty military member (Air Force Instruction [AFI] 65-503, p. A19-2). We included it because it is a cost to the government.
AFTOC does not include man-day costs. These are expenses for the pay and allowances of reservists while they are activated to perform missions in support of a MAJCOM. They are paid from the Air Force’s military personnel appropriations account. The Air Force only recently began to track these expenditures at a more granular level. We were able to obtain data from the U.S. Air Force, Directorate of Manpower, Organization and Resources (AF/A1M) for FYs 2009 and 2010. The available data indicate the total number of man-days used, by grade, by each reserve-component wing. We estimated their cost by multiplying the man-days used by active duty standard military composite rates, modified to reflect part-time reserve rather than full-time active duty retirement accrual rates. Since we had only two years of data, we used the average of those two years’ costs as estimates for each of the five years included in our analysis.8 We attributed these costs to the garrison reserve units of the activated reservists.9
For several reasons, reserve-component units require much less pipeline training than active units.10 To meet their military personnel requirements, the reserve components rely
8 In 2009 and 2010, man-day costs accounted for an average of 15 percent of our calculated total costs in reserve C-130 units, 8 percent in KC-135 units, and 7 percent in F-16 units. Accordingly, if our extrapolation of man-day costs to earlier years created an error on the magnitude of, for example, 20 percent, the resulting error in our total cost estimates would be about 3 percent in C-130 units and half of that in KC-135 or F-16 units. 9 Some of these costs may have been incurred for activations unrelated to the flying mission of the reservists’ garrison unit. If possible, we would have excluded those costs from our analysis, but the available data provided no way to isolate them. 10 We use the term pipeline training to include the series of courses required to prepare an individual for an initial assign-ment. For pilots, this includes undergraduate pilot training and an advanced course in the weapon system to which the individual will be assigned. For enlisted personnel, it includes basic military training and initial skills training in their Air Force specialty. We did not include the cost of officer commissioning sources (Air Force Academy, Air Force Reserve Offi-cer Training Corps [AFROTC], or Officer Training School) in these calculations because, in the absence of end strength
10 Costs of Flying Units in Air Force Active and Reserve Components
heavily on affiliation of airmen leaving active duty. Additionally, since reserve-component per-sonnel are called on much less frequently to rotate to and from overseas locations, headquar-ters assignments, and other similar demands, turnover in reserve-component operational units is appreciably lower than in active units. To reflect this distinct training cost advantage for reserve units, we estimated the flow of graduates from various training pipelines into active and reserve units and applied training pipeline costs to them.11
Finally, since AFTOC provides then-year costs, we applied cost inflators to express all costs in constant FY 2010 dollars.12
Output Metrics
As mentioned above, the three output metrics we identified as being most useful for gauging mission contributions are total owned aircraft, operational flying hours, and total flying hours.
The number of aircraft owned by a unit is characterized in various ways. The count of primary authorized aircraft (PAA) indicates the nominal size of a unit. It is used for program-ming purposes, but, for a variety of reasons, a unit may own more or less than its authorized number of aircraft, and the number owned may vary over time. The count of PMAI indicates the number of aircraft actually assigned to a unit for its wartime mission (CJCSI, 2011, p. A-2). We used this as the basis for our calculated cost per owned aircraft, and hereafter when we refer to “owned aircraft,” we mean PMAI. Average PMAI counts for units are available from a number of sources, including AFTOC.
In its Reliability and Maintainability Information System (REMIS), the Air Force cap-tures the number of sorties and hours flown by each aircraft along with a mission symbol indicating the purpose of each sortie. In AFTOC, mission symbols are used to distinguish between flying hours used for operational purposes and flying hours used for training or test-ing purposes.13 We used operational flying hours and total flying hours from this source for our cost per output calculations.
changes, which tend to be made independently of force mix decisions, changing the active/reserve mix in an aircraft type would not alter these costs. 11 Some audiences with whom we shared our analysis have argued that part of the cost of active duty pipeline training should be allocated to the reserve units that later benefit from it when separating active duty airmen affiliated with them. We chose not to follow this approach. The human capital invested in separating active duty airmen would be lost if there were no reserve components to recapture it. The opportunity to affiliate with reserve units might marginally increase active duty losses, thereby marginally increasing active duty training pipeline costs. But this effect would be small and difficult to estimate as a function of changes in the force mix. Accordingly, we did not attempt to capture it. 12 The inflators (current dollars/constant dollars) we used are found in OSD’s FY 2011 “Green Book,” 5-9 (OSD, 2010). Inflators are provided for a variety of expense types and for a grand total of all expense types. We used the grand total inflators. 13 REMIS flying hour data, at mission-design series and unit levels of disaggregation, are passed to AFTOC and can be retrieved through AFTOC’s online utilities. See U.S. Air Force, 2011.

11
ChApTER ThREE
Cost Structures and Alternative Mixes
To continue our analysis, we determined the outputs and cost per output for each unit for which we had useful data. Appendix B contains graphic displays of unit outputs averaged over the five years included in our analysis. These data support some general observations:
• The smallest active units (typically based overseas) own only marginally more aircraft (i.e., have more PMAI) than typical reserve-component units, but the largest active units own three to four times the number of aircraft as typical reserve-component units.
• Typical active units fly one and a half to three times as many hours per year per aircraft as reserve-component units.
• Operational flying hours as a proportion of total flying hours in active units are typically one and a half to twice the proportion found in reserve-component units.1
• Through a combination of more flying hours per aircraft and a higher proportion of those hours being operational, large CONUS active units may fly five or more times the number of operational hours per year as typical reserve-component units.
Graphic displays in Appendix B also show costs per output, obtained by dividing total unit costs by the number of outputs from each unit. From these data, we can draw these observations:
• The annual cost per owned aircraft in active units is typically one and a half to twice that of reserve-component units.
• The average total costs per flying hour for reserve-component units are in roughly the same ranges as those for active-component units.
• The cost per operational flying hour in an active unit is typically less than that of a reserve-component unit.
These observations suggest some broad implications for the cost of alternative active and reserve force mixes. To meet strategic demands, where fleet size is the important consideration, the reserve components’ lower cost per owned aircraft is a favorable factor. To meet operational demands, the active component’s lower cost per operational flying hour is a favorable factor.
These observations suggested two research questions. First, since reserve-component units tend to operate with some significant cost advantages (e.g., more Spartan installation support
1 Some reserve-component representatives briefed on our results have indicated that there is a capacity to raise this pro-portion, through either voluntary activation or mobilization authority. However, officials in Air Mobility Command and Air Combat Command, responsible for management of unit taskings, are skeptical that much more can be done through voluntary activation. The issue remains to be tested empirically.

12 Costs of Flying Units in Air Force Active and Reserve Components
structures, higher experience levels yielding more productive workforces), why are reserve-component flying hour costs not uniformly less than active-component flying hour costs? Second, since cost considerations favor the active and reserve components differently for the purposes of meeting strategic and operational demands, what approach can be taken to deter-mine a cost-minimizing active/reserve mix? In the remainder of this chapter, we will outline analyses we used to address these questions.
Cost per Flying Hour
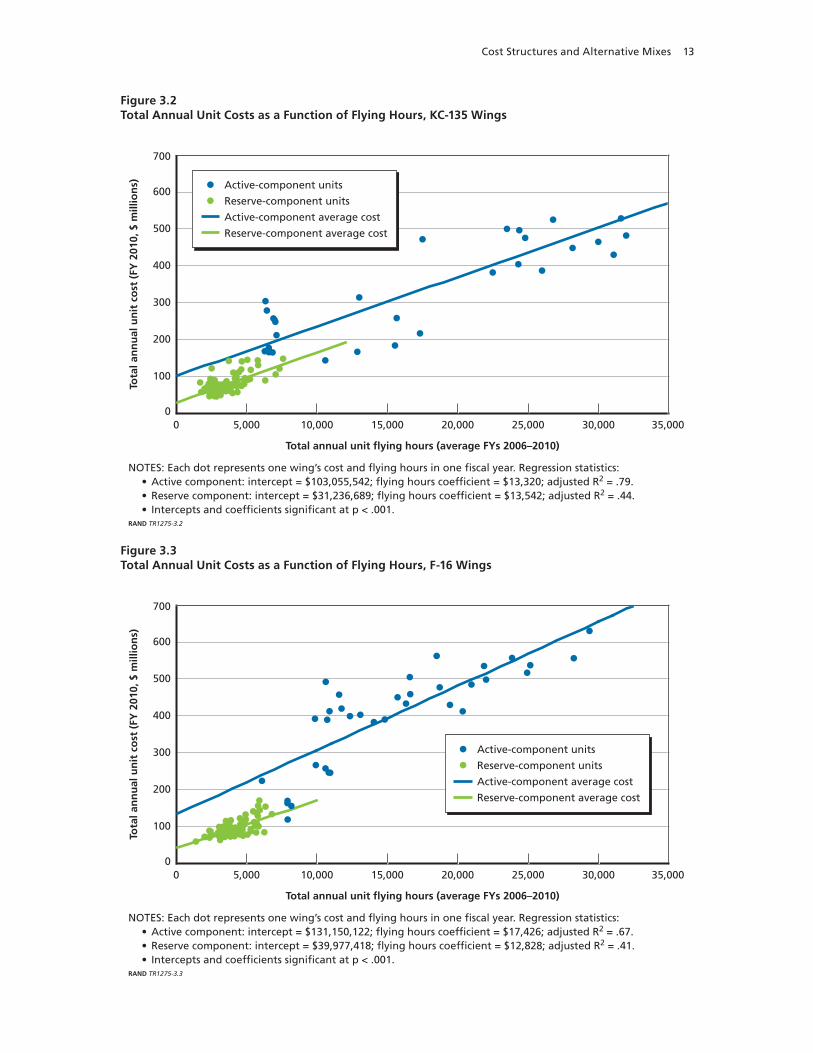
Figures 3.1 through 3.3, corresponding to the three aircraft types we examined (C-130s, KC-135s, and F-16s), are scatter plots showing total annual unit costs on the vertical axis and total annual unit flying hours on the horizontal axis.2 Each dot in a figure represents a wing’s opera-tions for one year. The figures are based on five years of data, so each wing, except for those that activated or deactivated during the five-year period, is represented by five dots.
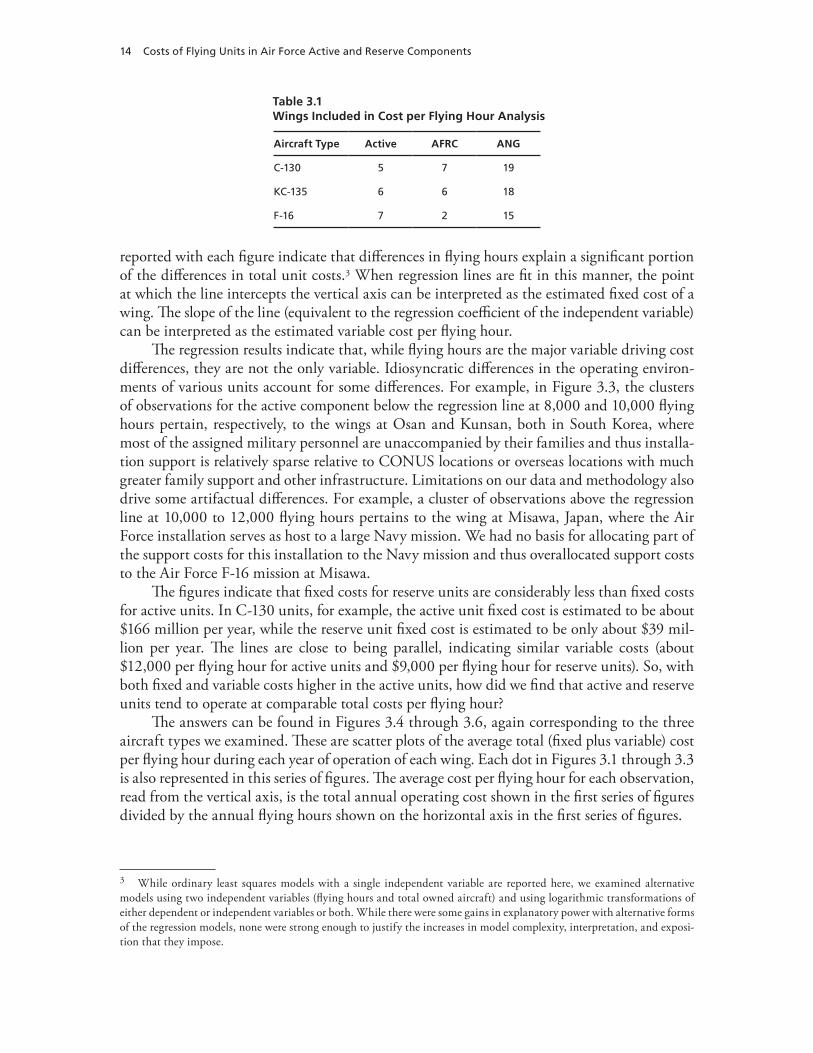
The total number of units included in these analyses is shown in Table 3.1. We expected the cost structures of associate units to be different from those of independently equipped units, and thus we excluded associate units from the analyses described in this chapter.
The solid lines in Figures 3.1 through 3.3 are ordinary least squares regression lines fit to the data, with the cost figures on the vertical axis as a dependent variable and the flying hour figures on the horizontal axis as an independent variable. For each aircraft type, we devel-oped separate regression models for active- and reserve-component units. Regression statistics
2 Total annual unit costs are the sum of AFTOC and supplemental costs described in Chapter Two.
Figure 3.1Total Annual Unit Costs as a Function of Flying Hours, C-130 Wings
NOTES: Each dot represents one wing’s cost and flying hours in one fiscal year. Regression statistics: • Active component: intercept = $165,647,746; flying hours coefficient = $11,907; adjusted R2 = .84. • Reserve component: intercept = $38,879,888; flying hours coefficient = $8,961; adjusted R2 = .36. • Intercepts and coefficients significant at p < .001.RAND TR1275-3.1
Tota
l an
nu
al u
nit
co
st (
FY 2
010,
$ m
illio
ns)
Total annual unit flying hours (average FYs 2006–2010)
0
100
200
300
400
500
600
700
0 5,000 10,000 15,000 20,000 25,000 30,000 35,000
Active-component units
Reserve-component units
Active-component average cost
Reserve-component average cost
Cost Structures and Alternative Mixes 13
Figure 3.2Total Annual Unit Costs as a Function of Flying Hours, KC-135 Wings
NOTES: Each dot represents one wing’s cost and flying hours in one fiscal year. Regression statistics: • Active component: intercept = $103,055,542; flying hours coefficient = $13,320; adjusted R2 = .79. • Reserve component: intercept = $31,236,689; flying hours coefficient = $13,542; adjusted R2 = .44. • Intercepts and coefficients significant at p < .001.RAND TR1275-3.2
Tota
l an
nu
al u
nit
co
st (
FY 2
010,
$ m
illio
ns)
Total annual unit flying hours (average FYs 2006–2010)
0
100
200
300
400
500
600
700
0 5,000 10,000 15,000 20,000 25,000 30,000 35,000
Active-component units
Reserve-component units
Active-component average cost
Reserve-component average cost
Figure 3.3Total Annual Unit Costs as a Function of Flying Hours, F-16 Wings
NOTES: Each dot represents one wing’s cost and flying hours in one fiscal year. Regression statistics: • Active component: intercept = $131,150,122; flying hours coefficient = $17,426; adjusted R2 = .67. • Reserve component: intercept = $39,977,418; flying hours coefficient = $12,828; adjusted R2 = .41. • Intercepts and coefficients significant at p < .001.RAND TR1275-3.3
Tota
l an
nu
al u
nit
co
st (
FY 2
010,
$ m
illio
ns)
Total annual unit flying hours (average FYs 2006–2010)
0
100
200
300
400
500
600
700
0 5,000 10,000 15,000 20,000 25,000 30,000 35,000
Active-component units
Reserve-component units
Active-component average cost
Reserve-component average cost
14 Costs of Flying Units in Air Force Active and Reserve Components
reported with each figure indicate that differences in flying hours explain a significant portion of the differences in total unit costs.3 When regression lines are fit in this manner, the point at which the line intercepts the vertical axis can be interpreted as the estimated fixed cost of a wing. The slope of the line (equivalent to the regression coefficient of the independent variable) can be interpreted as the estimated variable cost per flying hour.
The regression results indicate that, while flying hours are the major variable driving cost differences, they are not the only variable. Idiosyncratic differences in the operating environ-ments of various units account for some differences. For example, in Figure 3.3, the clusters of observations for the active component below the regression line at 8,000 and 10,000 flying hours pertain, respectively, to the wings at Osan and Kunsan, both in South Korea, where most of the assigned military personnel are unaccompanied by their families and thus installa-tion support is relatively sparse relative to CONUS locations or overseas locations with much greater family support and other infrastructure. Limitations on our data and methodology also drive some artifactual differences. For example, a cluster of observations above the regression line at 10,000 to 12,000 flying hours pertains to the wing at Misawa, Japan, where the Air Force installation serves as host to a large Navy mission. We had no basis for allocating part of the support costs for this installation to the Navy mission and thus overallocated support costs to the Air Force F-16 mission at Misawa.
The figures indicate that fixed costs for reserve units are considerably less than fixed costs for active units. In C-130 units, for example, the active unit fixed cost is estimated to be about $166 million per year, while the reserve unit fixed cost is estimated to be only about $39 mil-lion per year. The lines are close to being parallel, indicating similar variable costs (about $12,000 per flying hour for active units and $9,000 per flying hour for reserve units). So, with both fixed and variable costs higher in the active units, how did we find that active and reserve units tend to operate at comparable total costs per flying hour?
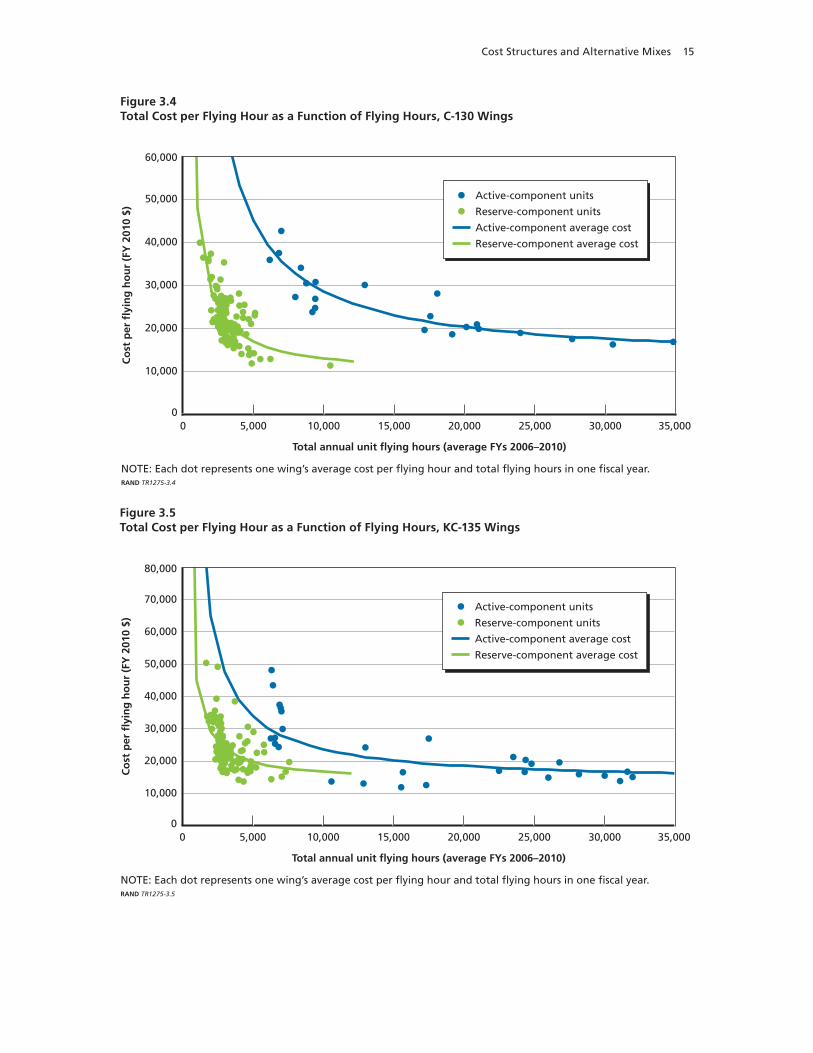
The answers can be found in Figures 3.4 through 3.6, again corresponding to the three aircraft types we examined. These are scatter plots of the average total (fixed plus variable) cost per flying hour during each year of operation of each wing. Each dot in Figures 3.1 through 3.3 is also represented in this series of figures. The average cost per flying hour for each observation, read from the vertical axis, is the total annual operating cost shown in the first series of figures divided by the annual flying hours shown on the horizontal axis in the first series of figures.
3 While ordinary least squares models with a single independent variable are reported here, we examined alternative models using two independent variables (flying hours and total owned aircraft) and using logarithmic transformations of either dependent or independent variables or both. While there were some gains in explanatory power with alternative forms of the regression models, none were strong enough to justify the increases in model complexity, interpretation, and exposi-tion that they impose.
Table 3.1Wings Included in Cost per Flying Hour Analysis
Aircraft Type Active AFRC ANG
C-130 5 7 19
KC-135 6 6 18
F-16 7 2 15
Cost Structures and Alternative Mixes 15
Figure 3.4Total Cost per Flying Hour as a Function of Flying Hours, C-130 Wings
NOTE: Each dot represents one wing’s average cost per flying hour and total flying hours in one fiscal year.RAND TR1275-3.4
Co
st p
er fl
yin
g h
ou
r (F
Y 2
010
$)
Total annual unit flying hours (average FYs 2006–2010)
0
10,000
20,000
30,000
40,000
50,000
60,000
0 5,000 10,000 15,000 20,000 25,000 30,000 35,000
Active-component units
Reserve-component units
Active-component average cost
Reserve-component average cost
Figure 3.5Total Cost per Flying Hour as a Function of Flying Hours, KC-135 Wings
NOTE: Each dot represents one wing’s average cost per flying hour and total flying hours in one fiscal year.RAND TR1275-3.5
Co
st p
er fl
yin
g h
ou
r (F
Y 2
010
$)
Total annual unit flying hours (average FYs 2006–2010)
0
10,000
20,000
30,000
40,000
50,000
60,000
70,000
80,000
0 5,000 10,000 15,000 20,000 25,000 30,000 35,000
Active-component units
Reserve-component units
Active-component average cost
Reserve-component average cost

16 Costs of Flying Units in Air Force Active and Reserve Components
As with the individual unit data points, the curved lines in these figures were created by dividing the total cost at any point on the regression line in the first three figures by the flying hours at that point on the line.4 Their shapes—declining as the scale of operations increases—reflect economies of scale.5 Using Figure 3.4 (pertaining to C-130 wings) as an example, we can see that active units operating at a larger scale (above 20,000 flying hours per year) expe-rienced average flying hour costs below $20,000. Many reserve-component units, operating at a smaller scale (less than 6,000 flying hours per year), experienced average flying hour costs above $20,000 per year. Most of the active flying hours are generated by units operating at more efficient points on their average cost curves, where fixed costs are being spread across a larger number of outputs. Many reserve units are operating at inefficient points on their average cost curves, where fixed costs are being spread across a smaller number of outputs. At any given scale (i.e., at any given point along the horizontal axis), reserve units operate at considerably lower cost per flying hour than active units. Note, for example, that reserve units flying 5,000 to 6,000 hours per year are operating in a range from $12,000 to $25,000 per hour, while active units in that range (typically, overseas-based units) are averaging $36,000 to $42,000 per hour. But larger, CONUS-based active units operate more typically at a much larger scale, where economies of scale offset and often overwhelm the inherent cost advantages of the reserve-component units. The effect is most pronounced in the KC-135 fleet (Figure 3.5).
4 The equation for the curved lines in Figures 3.4 through 3.6 is as follows: average cost = [fixed cost + (variable cost × flying hours)]/flying hours.
5 Scale of operation here refers to the number of flying hours per time period generated by a unit.
Figure 3.6Total Cost per Flying Hour as a Function of Flying Hours, F-16 Wings
NOTE: Each dot represents one wing’s average cost per flying hour and total flying hours in one fiscal year.RAND TR1275-3.6
Co
st p
er fl
yin
g h
ou
r (F
Y 2
010
$)
Total annual unit flying hours (average FYs 2006–2010)
0
10,000
20,000
30,000
40,000
50,000
60,000
70,000
0 5,000 10,000 15,000 20,000 25,000 30,000 35,000
Active-component units
Reserve-component units
Active-component average cost
Reserve-component average cost
Cost Structures and Alternative Mixes 17
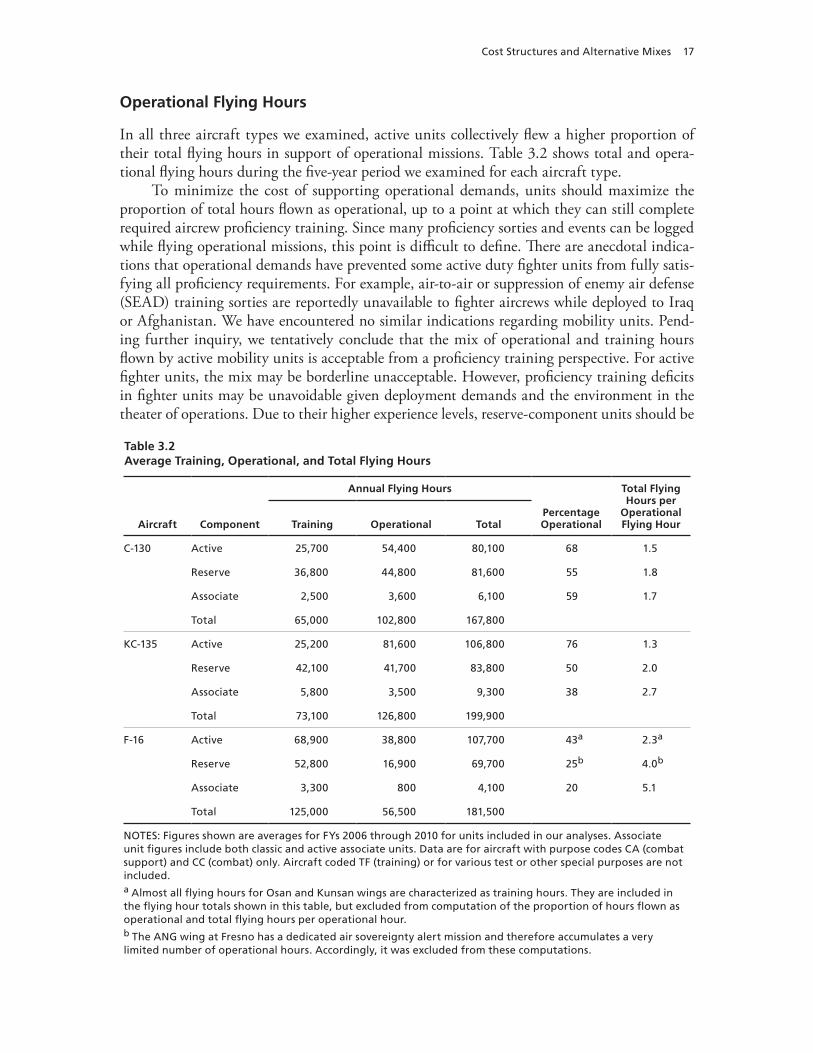
Operational Flying Hours
In all three aircraft types we examined, active units collectively flew a higher proportion of their total flying hours in support of operational missions. Table 3.2 shows total and opera-tional flying hours during the five-year period we examined for each aircraft type.
To minimize the cost of supporting operational demands, units should maximize the proportion of total hours flown as operational, up to a point at which they can still complete required aircrew proficiency training. Since many proficiency sorties and events can be logged while flying operational missions, this point is difficult to define. There are anecdotal indica-tions that operational demands have prevented some active duty fighter units from fully satis-fying all proficiency requirements. For example, air-to-air or suppression of enemy air defense (SEAD) training sorties are reportedly unavailable to fighter aircrews while deployed to Iraq or Afghanistan. We have encountered no similar indications regarding mobility units. Pend-ing further inquiry, we tentatively conclude that the mix of operational and training hours flown by active mobility units is acceptable from a proficiency training perspective. For active fighter units, the mix may be borderline unacceptable. However, proficiency training deficits in fighter units may be unavoidable given deployment demands and the environment in the theater of operations. Due to their higher experience levels, reserve-component units should be
Table 3.2Average Training, Operational, and Total Flying Hours
Aircraft Component
Annual Flying Hours
Percentage Operational
Total Flying Hours per
Operational Flying HourTraining Operational Total
C-130 Active 25,700 54,400 80,100 68 1.5
Reserve 36,800 44,800 81,600 55 1.8
Associate 2,500 3,600 6,100 59 1.7
Total 65,000 102,800 167,800
KC-135 Active 25,200 81,600 106,800 76 1.3
Reserve 42,100 41,700 83,800 50 2.0
Associate 5,800 3,500 9,300 38 2.7
Total 73,100 126,800 199,900
F-16 Active 68,900 38,800 107,700 43a 2.3a
Reserve 52,800 16,900 69,700 25b 4.0b
Associate 3,300 800 4,100 20 5.1
Total 125,000 56,500 181,500
NOTES: Figures shown are averages for FYs 2006 through 2010 for units included in our analyses. Associate unit figures include both classic and active associate units. Data are for aircraft with purpose codes CA (combat support) and CC (combat) only. Aircraft coded TF (training) or for various test or other special purposes are not included.a Almost all flying hours for Osan and Kunsan wings are characterized as training hours. They are included in the flying hour totals shown in this table, but excluded from computation of the proportion of hours flown as operational and total flying hours per operational hour.b The ANG wing at Fresno has a dedicated air sovereignty alert mission and therefore accumulates a very limited number of operational hours. Accordingly, it was excluded from these computations.
18 Costs of Flying Units in Air Force Active and Reserve Components
able to match the active units’ proportion of hours flown as operational with no greater train-ing deficit.6
Active units’ higher proportion of hours flown as operational indicates that they have been more efficient than reserve units at satisfying the Air Force’s ongoing operational demands. They required fewer total flying hours to provide each operational flying hour (see right-hand column in Table 3.2). Since active- and reserve-component units experience roughly compa-rable costs per flying hour, this efficiency generally allows active units to satisfy operational demand at lower total costs than reserve-component units.
Reserve units, however, may have been constrained in their contribution to meeting oper-ational demands by factors that can be changed. One constraint is the extent to which part-time reservists can be activated, either voluntarily or through mobilization. Another is the availability of man-day funding to cover the costs of activated reservists. Finally, procedures for allocating missions to reserve units may be constraining reserve-component participation in operational missions. If these constraints could be relaxed, reserve-component units might accept more operational missions, resulting in a higher proportion of their flying hours flown operationally. In ongoing research, we are exploring these potential constraints to determine whether they are binding and, if not, to what extent they can be relaxed in beneficial ways. We note, however, that to achieve the same efficiencies as active units, reserve C-130, KC-135, and F-16 units would have to increase their proportion of operational hours by roughly 25, 50, and 75 percent, respectively. Changes of this magnitude may be infeasible, suggesting that reserve-component units may not be able to bring their costs per operational hour down to the level exhibited by active units.
Cost-Minimizing Force Mixes
We have reported that, for the purpose of meeting strategic demands, reserve-component units provide mission-ready aircraft with competent aircrew and maintenance workforces at lower cost per aircraft than active units. In contrast, active units have often met operational demands at lower cost per flying hour. Given these asymmetrical cost advantages, an analytic approach is needed to determine the cost-minimizing mixes of active and reserve forces. A simplis-tic approach would provide enough active forces to meet operational demands, then supply additional reserve forces to bring total aircraft fleets up to the size required to meet strategic demands. But this sequential approach would not be cost-minimizing. It would ignore avail-able reserve-component contributions to meeting operational demands, resulting in more total operational capacity than needed and more total flying hours across the fleet. Instead, the appropriate analytic approach is an optimization model that simultaneously considers active and reserve force contributions to meeting strategic and operational demands. The model’s objective is to find the force mix that minimizes cost subject to a set of constraints, including
6 In our analysis, we have not attempted to differentiate between the costs of training and operational flying hours. We are unable to account for costs at the sortie level of detail, which would be necessary to develop separate training and opera-tional flying hour costs. Our assumption is that such costs incurred by garrison units and their deployed elements are simi-lar. Extraordinary support costs attributable to operations in deployed locations are not borne by the garrison units and, as we argued in Chapter Two of this report, should be ignored in cost-minimizing force mix considerations. We differentiate between the cost of total flying hours and the cost of operational flying hours by including the costs of flying hours devoted to training as part of the costs of flying hours generated for operational missions.

Cost Structures and Alternative Mixes 19
that strategic, operational, and proficiency flying demands are met and that active and reserve units operate at feasible or desirable levels of intensity and operational tempo.7
In our analysis, we treated force mix considerations as a series of separate considerations for each aircraft type. We initially use historical fleet sizes and operational hours flown as rep-resentations of strategic and operational demands met by those fleets. Anticipating future stra-tegic and operational demands is beyond the scope of this research, but we have examined and report on how shifts in those demands would affect the cost-minimizing mix.
Table 3.3 illustrates how we structured the optimization model for the F-16 fleet. We constructed similar models for the C-130 and KC-135 fleets. Changing the constraints in the model allowed us to construct the excursions examined later in this chapter.
In general, our optimization models’ constraints on flying hours per PMAI and propor-tion of hours flown as operational reflect the averages observed in our five years of data. While
7 Linear programming and comparable nonlinear methods are used to solve such optimization problems. For technical reasons, our analysis required a nonlinear method.
Table 3.3Specifications for a Force Mix Optimization Model for the F-16 Fleet
Element Specification
Objective function
Minimize total cost, summed across all required units, and calculated for each unit as its fixed cost + its variable cost per flying hour x number of pMAI x annual flying hours per pMAIa
Variables Number of units of each typical size (23, 42, or 74 pMAI for active units, 18 or 23 pMAI for reserve units)
Number of flying hours per pMAI for each component
Constraintsb Annual active unit flying hours per pMAI ≤ 320 (average in five-year history)
Annual active unit flying hours per pMAI ≥ 286 (per AFI 11-102), minimum needed to meet proficiency flying sortie and event requirements)
Annual reserve unit flying hours per pMAI ≤ 220 (average in five-year history)
Number of 42-pMAI active units = 4 (current number of such units at overseas locations; needed to preserve forward presence)
Number of 23-pMAI active units = 1 (current number of such units at overseas locations; needed to preserve forward presence)
Number of 23-pMAI reserve units ≤ 1 (current number of such units)
proportion of active pMAI in CONUS units ≥ 30% (needed to avoid extreme CONUS/overseas imbalance)
Total annual operational flying hours ≥ 56,600 (average in five-year history)
Total pMAI = 660 (average in five-year history)
Total annual tasked aircraft days ≥ 27,600 (average in five-year history)
proportion of active flying hours operational ≤ 43% (average in five-year history)c
proportion of reserve flying hours operational ≤ 25% (average in five-year history)
a See notes under Figures 3.1 through 3.3 for regression intercepts and coefficients that can be interpreted as fixed and variable costs.b In variations of this model, policy options are explored by relaxing these constraints.c Kunsan and Osan flying hours are 100 percent training rather than operational. we exclude these units from the five-year average and from this constraint in the model.

20 Costs of Flying Units in Air Force Active and Reserve Components
it is possible that some or all units could operate at higher tempos than these averages repre-sent, capacity to sustain higher tempos is unproven. However, in some excursions (see below), we relaxed these constraints to examine the cost implications of higher-tempo reserve unit operations.
Table 3.4 provides the recent average and cost-minimizing active/reserve mixes in each fleet, using costs and outputs observed in our five-year history as a baseline and cost-minimizing alternatives derived from the optimization modeling described above. We found that active- and reserve-component C-130 units were operating in an envelope where cost differences are minimal. In the other two fleets, however, the results indicate that, during the five years we examined, fleets of the same total size, providing the same number of operational flying hours, would have operated less expensively if a greater proportion of the force structure would have been in active units. The primary reason for this is the greater proportion of hours flown as operational in active units, permitting the fleets to produce the required operational flying hours with fewer total flying hours. Economies of scale, affecting the cost per flying hour, are also an important factor. In the case of the F-16 fleet, the savings would have been nominally large ($60 million per year) but small in proportion to total costs (1.4 percent) of the fleet. In the KC-135 fleet, however, savings would have been large both nominally and proportionally
Table 3.4Cost-Minimizing Active/Reserve Mixes
Aircraft Component
Recent Average Cost-Minimizing Mix
Potential Annual
Savings ($)Total PMAI
Total Flying Hours
Annual Fleet Cost ($, billions)
Total PMAI
Total Flying Hours
Annual Fleet Cost ($, billions)
C-130 Active 88 63,200 1.42 73 58,000 1.28
Reserve 198 84,200 1.76 213 90,700 1.90
Associate 6,100 0.22 6,100 0.22
Total 286 153,400 3.40 286 154,800 3.40 0 (0.0%)
KC-135 Active 128 106,800 2.05 331 161,100 3.08
Reserve 203 83,800 1.83
Associate 9,300 0.19 9,300 0.19
Total 331 199,900 4.07 331 170,400 3.27 800 million (19.7%)
F-16 Active 340 107,700 2.80 421 120,400 3.17
Reserve 319 69,700 1.55 239 47,800 1.12
Associate 4,100 0.07 4,100 0.07
Total 660 181,500 4.41 660 172,300 4.35 60 million (1.4%)
NOTE: Values shown for KC-135 and F-16 are averages for FYs 2006 through 2010 for units included in our analyses. Values for the C-130 are for 2009 and 2010 (period truncated due to deactivation of an active wing in 2008). Cost-minimizing mixes retain the same fleet size and produce the same total annual operational flying hours as the recent average (see five-year-average data in Table 3.2).

Cost Structures and Alternative Mixes 21
($800 million, or 19.7 percent).8 An added benefit in these two fleets would have been fewer total flying hours on the airframes, extending their expected service lifetimes.
Since the cost calculations used in these optimization models include both fixed and variable costs of a wing, the savings indicated would be realized only if the mix were changed by activating and deactivating whole wings at the margin. If the mix were instead adjusted by reducing the number of aircraft assigned to each reserve-component wing, savings would be reduced.9
Excursions
Appendix C contains plots illustrating how the cost-minimizing force mix would change under varying conditions. For each of the three aircraft types included in our analyses, the conditions we examined are
• changes in operational demand (more or fewer operational flying hours)• changes in planned strategic capacity (more or fewer total owned aircraft)• increases above the five-year average level of operational flying hours in reserve-
component units.
Specific projections regarding the level of these changes in the future are beyond the scope of this study. We confine our analysis to examining the impacts of shifts in either direction from the averages observed in our five-year history.
Our findings from these excursions may be summarized as follows:
• As operational demand decreases, the cost-minimizing mix contains fewer active aircraft and more reserve-component aircraft.
• As planned strategic capacity decreases, the cost-minimizing mix contains fewer reserve-component aircraft and more active aircraft.
• Forward presence (wings located overseas) and the need to avoid CONUS/overseas imbal-ances in the active force limit how far the mix can be shifted toward the reserve compo-nents.
• In two of the three fleets we examined (C-130s and F-16s), increasing the hours flown as operational in reserve-component units shifts the cost-minimizing mix toward the reserve
8 For the KC-135, we found that larger, CONUS-based units operate at a total flying hour cost of $18,332, while smaller reserve-component units operate at a total flying hour cost of $23,303. Additionally, CONUS-based active units fly 81 per-cent of their hours as operational, while reserve-component units fly 50 percent as operational. These differences are much greater than observed in the other two fleets. They underlie our finding that the cost-minimizing mix in this fleet is 100 per-cent in the active component. 9 As an example, Table 3.4 shows a reduction of F-16s in the reserve component from 319 in the five-year average force mix to 239 in the cost-minimizing force mix—a reduction of 80 aircraft. The optimization model used in this analysis takes this reduction by removing 4.5 reserve wing equivalents. If the reduction had been taken instead by spreading the cuts across all units, the reserve-component fleet cost in the cost-minimizing mix would be $1.29 billion, $170 million more than the $1.12 billion shown in the table.
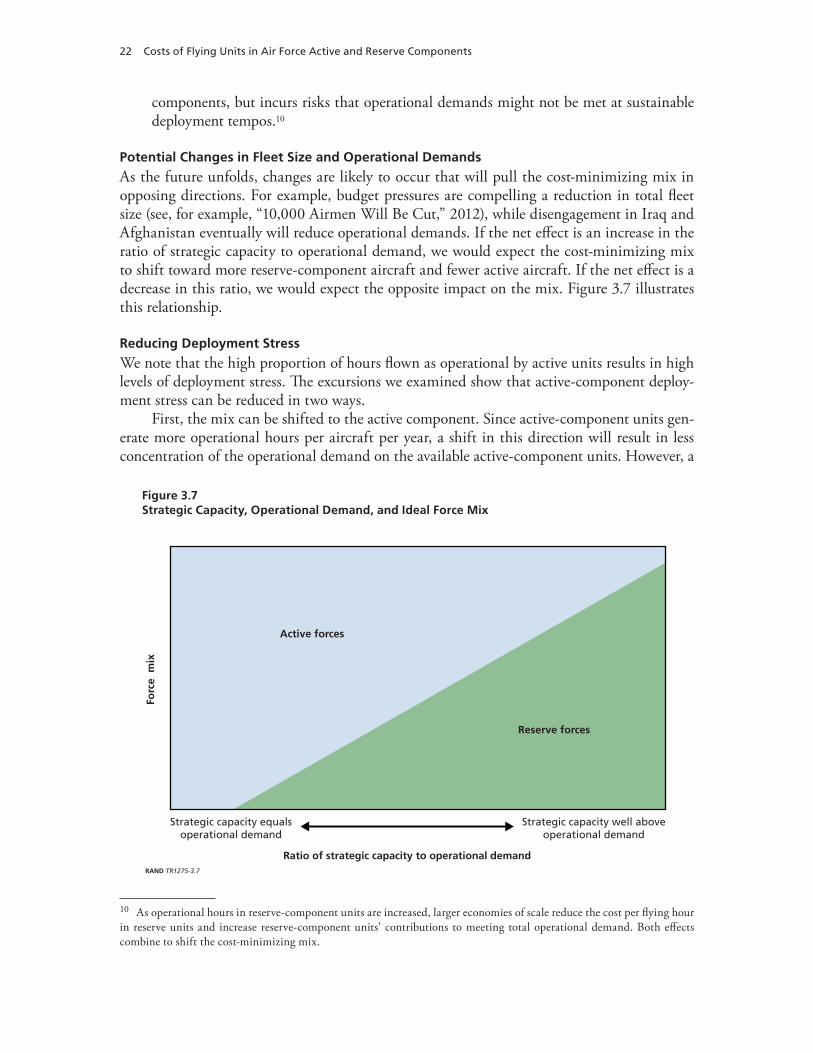
22 Costs of Flying Units in Air Force Active and Reserve Components
components, but incurs risks that operational demands might not be met at sustainable deployment tempos.10
Potential Changes in Fleet Size and Operational Demands
As the future unfolds, changes are likely to occur that will pull the cost-minimizing mix in opposing directions. For example, budget pressures are compelling a reduction in total fleet size (see, for example, “10,000 Airmen Will Be Cut,” 2012), while disengagement in Iraq and Afghanistan eventually will reduce operational demands. If the net effect is an increase in the ratio of strategic capacity to operational demand, we would expect the cost-minimizing mix to shift toward more reserve-component aircraft and fewer active aircraft. If the net effect is a decrease in this ratio, we would expect the opposite impact on the mix. Figure 3.7 illustrates this relationship.
Reducing Deployment Stress
We note that the high proportion of hours flown as operational by active units results in high levels of deployment stress. The excursions we examined show that active-component deploy-ment stress can be reduced in two ways.
First, the mix can be shifted to the active component. Since active-component units gen-erate more operational hours per aircraft per year, a shift in this direction will result in less concentration of the operational demand on the available active-component units. However, a
10 As operational hours in reserve-component units are increased, larger economies of scale reduce the cost per flying hour in reserve units and increase reserve-component units’ contributions to meeting total operational demand. Both effects combine to shift the cost-minimizing mix.
Figure 3.7Strategic Capacity, Operational Demand, and Ideal Force Mix
RAND TR1275-3.7
Forc
e m
ix
Active forces
Reserve forces
Ratio of strategic capacity to operational demand
Strategic capacity equalsoperational demand
Strategic capacity well aboveoperational demand
Cost Structures and Alternative Mixes 23
shift toward a higher active-component proportion than the ideal mixes shown in Appendix C will, of course, entail higher costs than the ideal mixes.
Second, reserve-component units can make a larger contribution to meeting operational demands. The excursions show that this can reduce costs in some cases and increase it in others, depending on whether the increased flying hours allow the marginal reserve-component unit to achieve an economy of scale that reduces its flying hour costs below that of the marginal active-component unit (which is assumed to be a large CONUS unit). Nonetheless, while cost impacts will vary, a larger reserve-component contribution to meeting operational demands will always reduce the deployment stress on active-component units.


25
ChApTER FOUR
Perspectives and Insights
Our broadest observation from this study is that, given the high operating tempo of the past decade, the active/reserve mix in heavily tasked fleets has not been optimal. Holding constant the total size of the three fleets we examined, we see that the operational mission could have been accomplished with fewer total flying hours and less cost or, by sacrificing some cost sav-ings, with less stress on active aircrews.
Underlying this observation are two important cost considerations. The first is that, while reserve-component wings operate with some inherent cost advantages, their considerably smaller scale of operations imposes a significant cost disadvantage. Reserve-component cost advantages and disadvantages roughly offset each other, such that the costs per flying hour realized in typical reserve-component units have been in about the same range as the costs per flying hour realized in typical active units.
The second important cost consideration is that, given roughly equal flying hour costs in the active and reserve components, active units’ ability to fly a larger proportion of their hours as operational makes them a more economical provider of operational capacity.
The reserve components’ primary contribution to cost minimization is their ability to provide ready aircraft and trained aircrew and maintenance workforces at lower cost than the active component. Had the fleets we examined been concentrated entirely in the active force, two of the three would have had excess operational capacity and would have cost more than a mixed active/reserve fleet. From a cost perspective, the nation is well served by having reserve components in its air arm.
The cost-minimizing active/reserve mix for an aircraft fleet is one that satisfies opera-tional, strategic, and proficiency flying demands simultaneously, with active and reserve wings operating within their feasible or desirable levels of intensity and deployment tempo. We have demonstrated that as the ratio of planned strategic capacity to required operational capacity grows larger, the cost-minimizing proportion of the force that is in the reserve components also grows larger.
Each component seeks to become more efficient. As a component becomes more efficient in meeting strategic, operational, or proficiency flying demands, the cost-minimizing force mix will shift in its direction. Our analyses suggest that paths toward greater efficiency would be different for the active and reserve components.
For the active component, the most promising path is examining the amount of flying required to maintain proficiency. Long-standing assumptions regarding the required number of flying hours per year per aircrew might be modified in view of emerging simulator technol-

26 Costs of Flying Units in Air Force Active and Reserve Components
ogy. Additionally, crew ratios could be examined to determine whether they match Air Force needs, especially where host and associate units share aircraft.1
For reserve-component units, the most promising paths toward greater efficiency would be increasing their scale of operations and their contribution to meeting operational demands. Increasing the scale of operations requires fewer, larger units. The reserve components, how-ever, will be reluctant to follow this path because considerations other than cost lead them to value wider geographical dispersion of their operating locations. Making greater contributions to meeting operational demands involves a review of the reserve components’ “mission buy” process, the programming and management of man-day budgets, and the capacity of reserve units to support voluntary activations or sustain routine involuntary unit mobilizations. Pre-mising a planned force mix on an assumed greater capacity of reserve-component units to sup-port operational demands, without first demonstrating that capacity, would seem imprudent. It could result in morale- and retention-sapping levels of deployment stress that “break” both active- and reserve-component units.
Going forward, the Air Force is responding to budget pressures to reduce its fleet sizes. Absent a reduction in operational demands, cost and force stress considerations indicate that, at least in the fleets we examined, these reductions should be taken in the reserve component. Doing so will allow the remaining fleets to meet continuing operational demands with fewer total flying hours and less deployment stress on active aircrews and maintenance workforces. As operational demands subsequently subside, the stage will then be set for tilting the mix back toward the reserve components.
1 If crew ratios are predicated on surge requirements, and since host and associate units should be considered equally available to meet surge requirements, the sum of host and associate crew ratios should be the same as the crew ratio of units without associates. We recognize, however, that factors other than surge requirements may drive crew ratios, including operational tempo and aircrew absorption considerations.

27
AppENDIx A
Organization Types
Table A.1 lists the organization types encountered in AFTOC data at installations that hosted units operating the three aircraft types included in our analysis (C-130, KC-135, and F-16). Bin numbers in the table heading are explained in Chapter Two. Some organization types fit in more than one category, depending on context; these were sorted to appropriate bins using additional information available in AFTOC. Organizational nomenclatures are truncated in this table in the same way that they are truncated in AFTOC.
Table A.1Organization Types Used to Categorize Costs
Organizational Nomenclaturea
Focal Unit Operation and Maintenance
(Bin 1)Other Direct
(Bin 2)
Installation Support (Bin 5)
A-10 Squadrons x
Acquisition Group x
Advanced Air & Space Studies S x
Aerial port Flight x
Aerial port Squadron x
Aeromedical Evacuation Squadron x
Aeromedical Staging Squadron x
Aeromedical-Dental Group x
Aeromedical-Dental Squadron x x
Aerospace Maintenance/Regeneratio x
Aerospace Medicine Flight x
Aerospace Medicine Squadron x
Aerospace Sustainment wing x
AF Band pacific Band x
AF Communications Agency Field x
AF Doctrine Center Direct Repo x
AF Expeditionary Operations Sc x
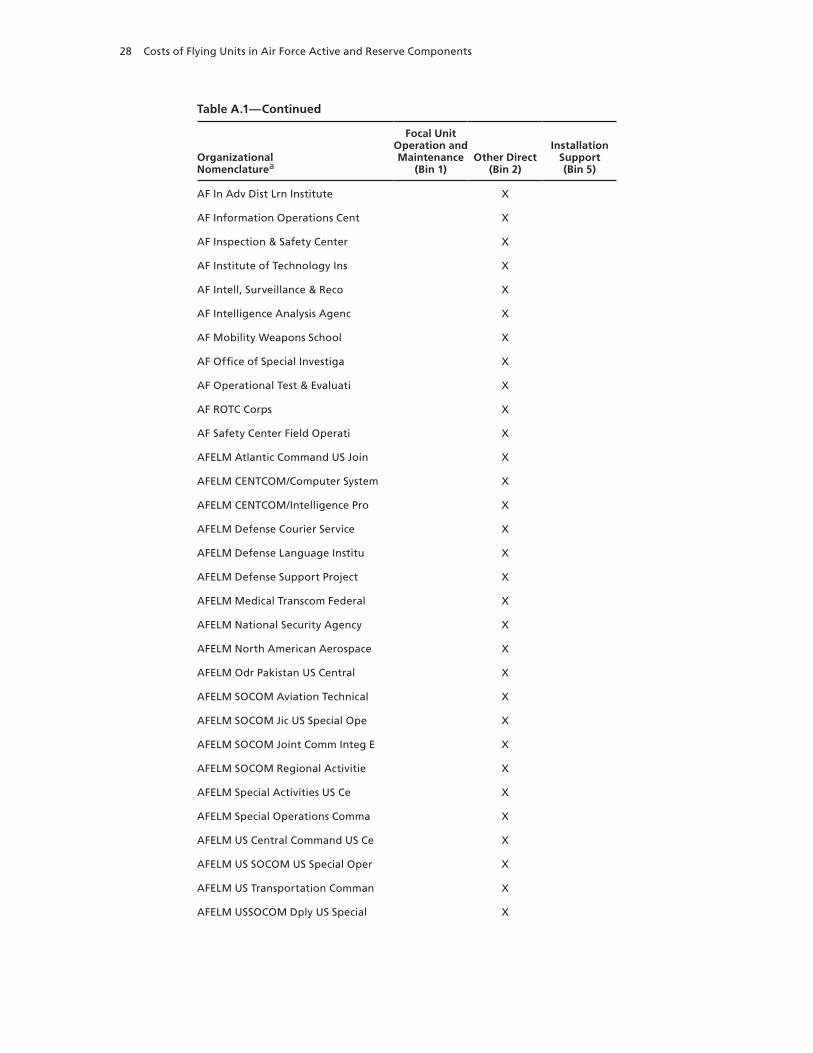
28 Costs of Flying Units in Air Force Active and Reserve Components
Table A.1—Continued
Organizational Nomenclaturea
Focal Unit Operation and Maintenance
(Bin 1)Other Direct
(Bin 2)
Installation Support (Bin 5)
AF In Adv Dist Lrn Institute x
AF Information Operations Cent x
AF Inspection & Safety Center x
AF Institute of Technology Ins x
AF Intell, Surveillance & Reco x
AF Intelligence Analysis Agenc x
AF Mobility weapons School x
AF Office of Special Investiga x
AF Operational Test & Evaluati x
AF ROTC Corps x
AF Safety Center Field Operati x
AFELM Atlantic Command US Join x
AFELM CENTCOM/Computer System x
AFELM CENTCOM/Intelligence pro x
AFELM Defense Courier Service x
AFELM Defense Language Institu x
AFELM Defense Support project x
AFELM Medical Transcom Federal x
AFELM National Security Agency x
AFELM North American Aerospace x
AFELM Odr pakistan US Central x
AFELM SOCOM Aviation Technical x
AFELM SOCOM Jic US Special Ope x
AFELM SOCOM Joint Comm Integ E x
AFELM SOCOM Regional Activitie x
AFELM Special Activities US Ce x
AFELM Special Operations Comma x
AFELM US Central Command US Ce x
AFELM US SOCOM US Special Oper x
AFELM US Transportation Comman x
AFELM USSOCOM Dply US Special x

Organization Types 29
Table A.1—Continued
Organizational Nomenclaturea
Focal Unit Operation and Maintenance
(Bin 1)Other Direct
(Bin 2)
Installation Support (Bin 5)
AFELM USSOCOM Joint Communicat x
AFELM USSOCOM Joint Special Op x
AFELM USSOCOM Jpse US Special x
AFELM USSOCOM Jsou US Special x
AFELM USSOCOM Soac US Special x
AFELM Security Assistance US Ce x
AFOSI Field Support Squadron x
AFSpC Civil Engineer Flight x
AFSpC Communications Support S x
AFSpC Computer Support Squadro x
AFSpC Contracting Flight x
AFSpC Space Operations Squadro x
Aggressor Squadron x
Air & Space Basic Course Schoo x
Air & Space Communication Oper x
Air & Space Communications Gro x
Air & Space Communications Squ x
Air & Space Intelligence Squad x
Air & Space Operations Center x
Air & Space plans Squadron x
Air Base Group x
Air Base Squadron x
Air Base wing x
Air Combat Operations Staff x
Air Command & Staff College x
Air Communications Flight x
Air Communications Squadron x x
Air Control Flight x
Air Control Group x
Air Control Squadron x
Air Control wing x

30 Costs of Flying Units in Air Force Active and Reserve Components
Table A.1—Continued
Organizational Nomenclaturea
Focal Unit Operation and Maintenance
(Bin 1)Other Direct
(Bin 2)
Installation Support (Bin 5)
Air Force Air Force x
Air Force Band x
Air Force headquarters x
Air Force Office x
Air Intelligence Field Operati x
Air Intelligence Group x
Air Intelligence Squadron x
Air Mobility Battle Laboratory x
Air Mobility Command x
Air Mobility Group x x
Air Mobility Operations Group x
Air Mobility Operations Squadr x
Air Mobility Squadron x x
Air Mobility warfare Center x
Air Mobility wing x
Air Operations Center x
Air Operations Group x x
Air Operations Squadron x x
Air plans Squadron x
Air postal Squadron x
Air Refueling Group x
Air Refueling Squadron x x
Air Refueling wing x x
Air Reserve personnel Squadron x
Air Support Flight x
Air Support Group x x
Air Support Operations Group x
Air Support Operations Squadro x x
Air Support Squadron x x
Air Traffic Ctrl Squadron x
Air University Command x

Organization Types 31
Table A.1—Continued
Organizational Nomenclaturea
Focal Unit Operation and Maintenance
(Bin 1)Other Direct
(Bin 2)
Installation Support (Bin 5)
Air war College x
Airborne Air Control Squadron x
Aircraft Commodities Sustainme x
Aircraft Control & warning Fli x
Aircraft Instrumentation Squad x
Aircraft Maintenance Group x
Aircraft Maintenance Squadron x
Aircraft Sustainment Group x
Aircraft Sustainment Squadron x
Aircraft Sustainment wing x
Airlift Control Flight x x
Airlift Flight x x
Airlift Group x
Airlift Squadron x x
Airlift wing x x
Alabama ANG headquarters x
Alaskan Norad Flight x
Alteration & Installation Squa x
AMC Air Intelligence Squadron x
AMC Air Operations Squadron x
AMC Communications Group x
AMC Contracting Flight x
AMC Financial Services Squadro x
AMC Inspection Squadron x
AMC Installations & Mission Sup x
AMC Logistics Support Squadron x
AMC Regional Supply Squadron x
AMC Safety Flight x
AMC Tanker Airlift Control Cen x
AMC Test & Evaluation Squadron x
ANG Combat Readiness Training x
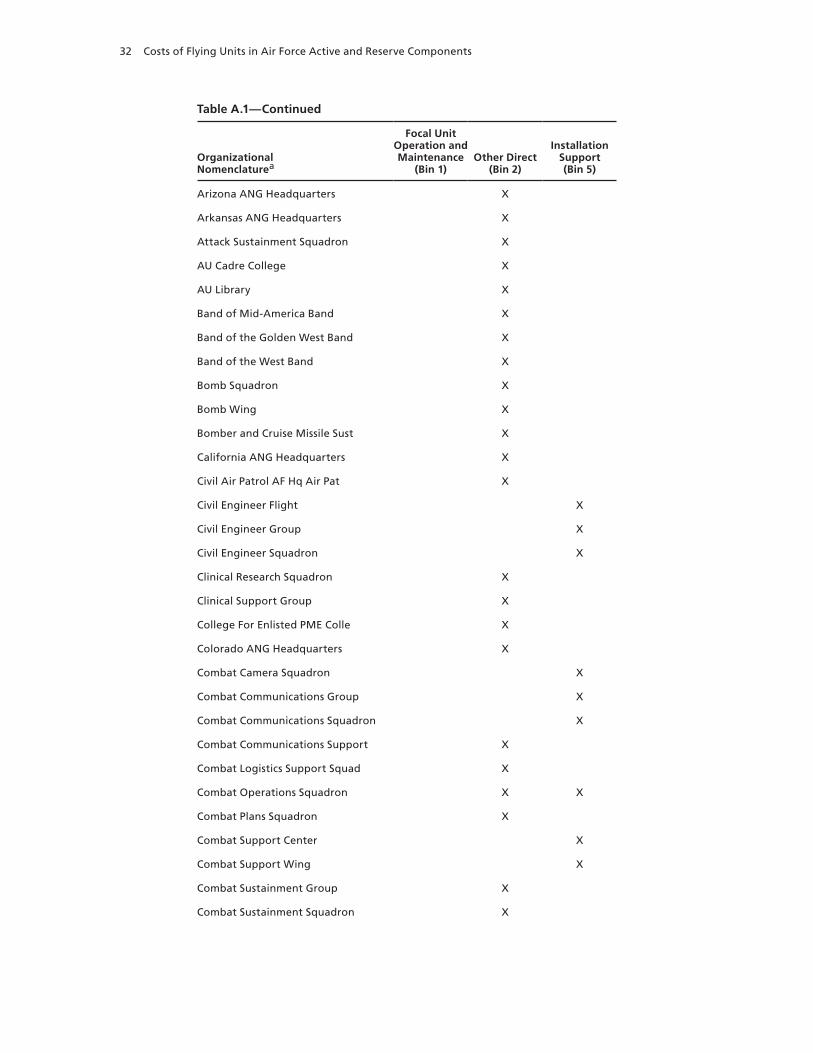
32 Costs of Flying Units in Air Force Active and Reserve Components
Table A.1—Continued
Organizational Nomenclaturea
Focal Unit Operation and Maintenance
(Bin 1)Other Direct
(Bin 2)
Installation Support (Bin 5)
Arizona ANG headquarters x
Arkansas ANG headquarters x
Attack Sustainment Squadron x
AU Cadre College x
AU Library x
Band of Mid-America Band x
Band of the Golden west Band x
Band of the west Band x
Bomb Squadron x
Bomb wing x
Bomber and Cruise Missile Sust x
California ANG headquarters x
Civil Air patrol AF hq Air pat x
Civil Engineer Flight x
Civil Engineer Group x
Civil Engineer Squadron x
Clinical Research Squadron x
Clinical Support Group x
College For Enlisted pME Colle x
Colorado ANG headquarters x
Combat Camera Squadron x
Combat Communications Group x
Combat Communications Squadron x
Combat Communications Support x
Combat Logistics Support Squad x
Combat Operations Squadron x x
Combat plans Squadron x
Combat Support Center x
Combat Support wing x
Combat Sustainment Group x
Combat Sustainment Squadron x

Organization Types 33
Table A.1—Continued
Organizational Nomenclaturea
Focal Unit Operation and Maintenance
(Bin 1)Other Direct
(Bin 2)
Installation Support (Bin 5)
Combat Sustainment wing x
Combat Systems Sustainment Gro x
Combat Training Flight x
Combat Training Squadron x
Command/Control Squadron x
Commodities Maintenance Group x
Commodities Maintenance Squadr x
Commodities Sustainment Group x
Communications Flight x
Communications Group x x
Communications Maintenance Squ x
Communications Squadron x
Communications Support Squadro x
Community College of the AF Co x
Component Maintenance Squadron x
Comptroller Squadron x
Computer Support Squadron x
Computer Systems Squadron x
Connecticut ANG headquarters x
Construction & Training Squadr x
Contingency Operations Support x
Contingency Response Group x
Contingency Response wing x
Contracting Flight x
Contracting Squadron x
Contractor Logistics Sustainme x
Def Meteorological Systems pro x
Delaware ANG headquarters x
Deleted - Material Sustainment x
Dental Group x
Dental Squadron x
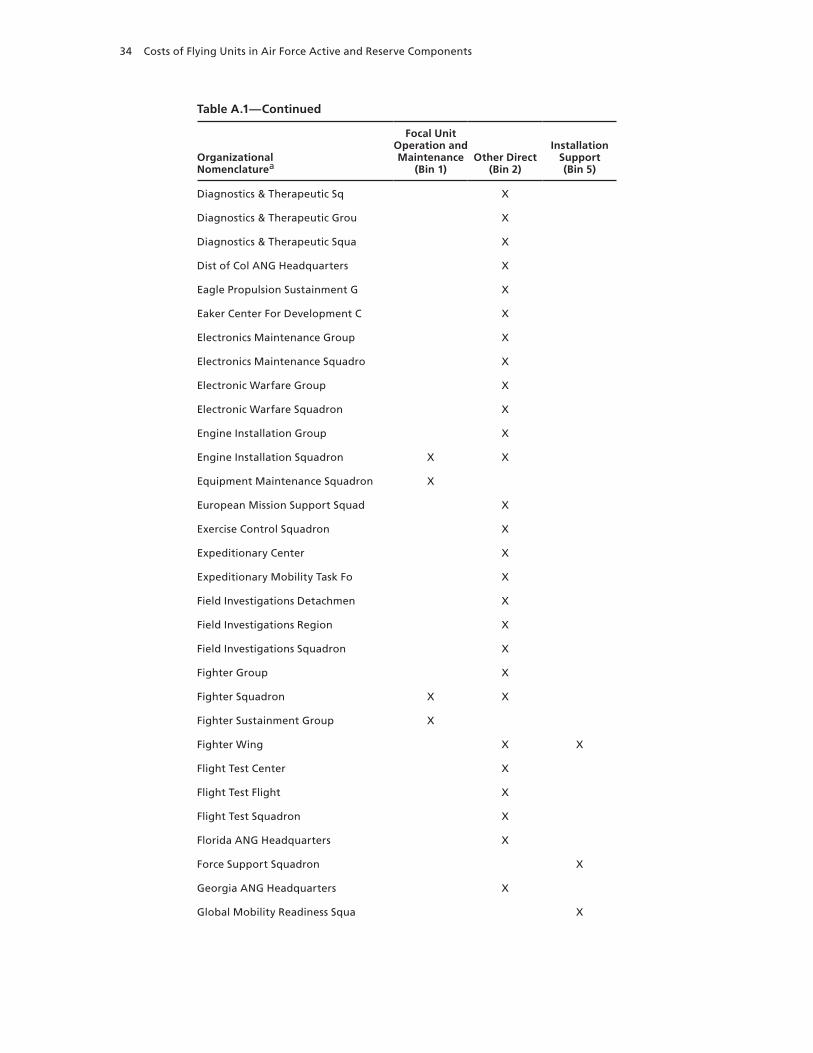
34 Costs of Flying Units in Air Force Active and Reserve Components
Table A.1—Continued
Organizational Nomenclaturea
Focal Unit Operation and Maintenance
(Bin 1)Other Direct
(Bin 2)
Installation Support (Bin 5)
Diagnostics & Therapeutic Sq x
Diagnostics & Therapeutic Grou x
Diagnostics & Therapeutic Squa x
Dist of Col ANG headquarters x
Eagle propulsion Sustainment G x
Eaker Center For Development C x
Electronics Maintenance Group x
Electronics Maintenance Squadro x
Electronic warfare Group x
Electronic warfare Squadron x
Engine Installation Group x
Engine Installation Squadron x x
Equipment Maintenance Squadron x
European Mission Support Squad x
Exercise Control Squadron x
Expeditionary Center x
Expeditionary Mobility Task Fo x
Field Investigations Detachmen x
Field Investigations Region x
Field Investigations Squadron x
Fighter Group x
Fighter Squadron x x
Fighter Sustainment Group x
Fighter wing x x
Flight Test Center x
Flight Test Flight x
Flight Test Squadron x
Florida ANG headquarters x
Force Support Squadron x
Georgia ANG headquarters x
Global Mobility Readiness Squa x
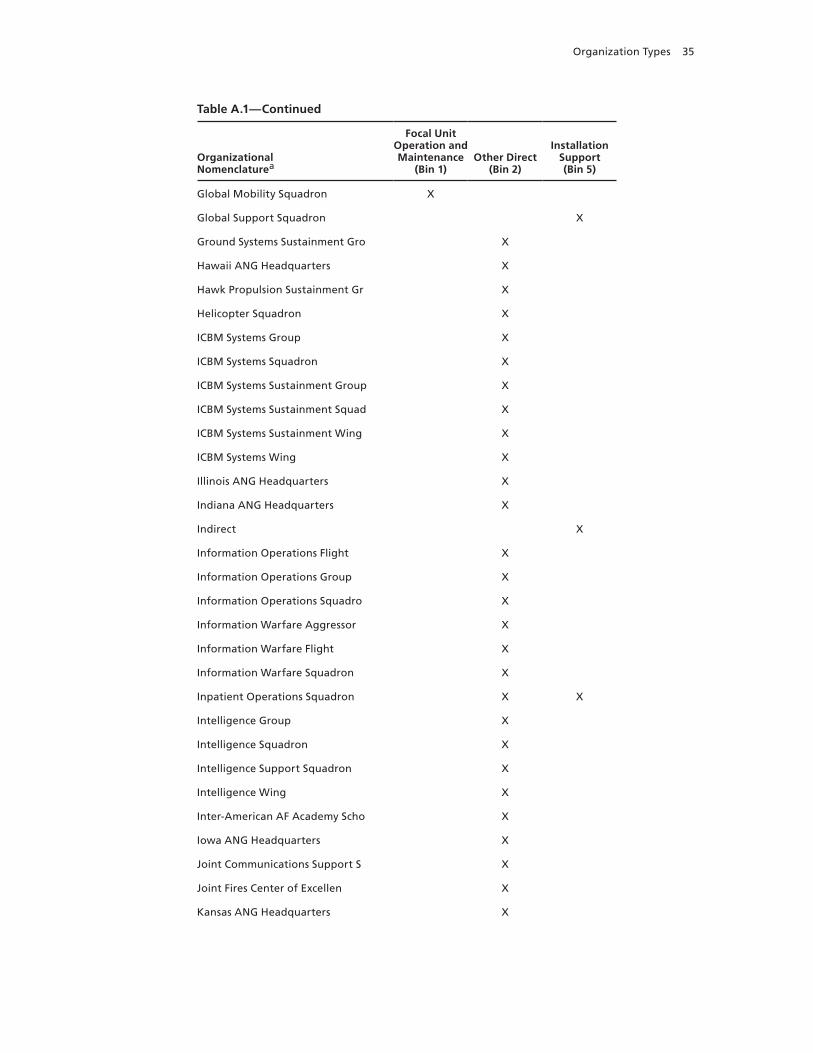
Organization Types 35
Table A.1—Continued
Organizational Nomenclaturea
Focal Unit Operation and Maintenance
(Bin 1)Other Direct
(Bin 2)
Installation Support (Bin 5)
Global Mobility Squadron x
Global Support Squadron x
Ground Systems Sustainment Gro x
hawaii ANG headquarters x
hawk propulsion Sustainment Gr x
helicopter Squadron x
ICBM Systems Group x
ICBM Systems Squadron x
ICBM Systems Sustainment Group x
ICBM Systems Sustainment Squad x
ICBM Systems Sustainment wing x
ICBM Systems wing x
Illinois ANG headquarters x
Indiana ANG headquarters x
Indirect x
Information Operations Flight x
Information Operations Group x
Information Operations Squadro x
Information warfare Aggressor x
Information warfare Flight x
Information warfare Squadron x
Inpatient Operations Squadron x x
Intelligence Group x
Intelligence Squadron x
Intelligence Support Squadron x
Intelligence wing x
Inter-American AF Academy Scho x
Iowa ANG headquarters x
Joint Communications Support S x
Joint Fires Center of Excellen x
Kansas ANG headquarters x
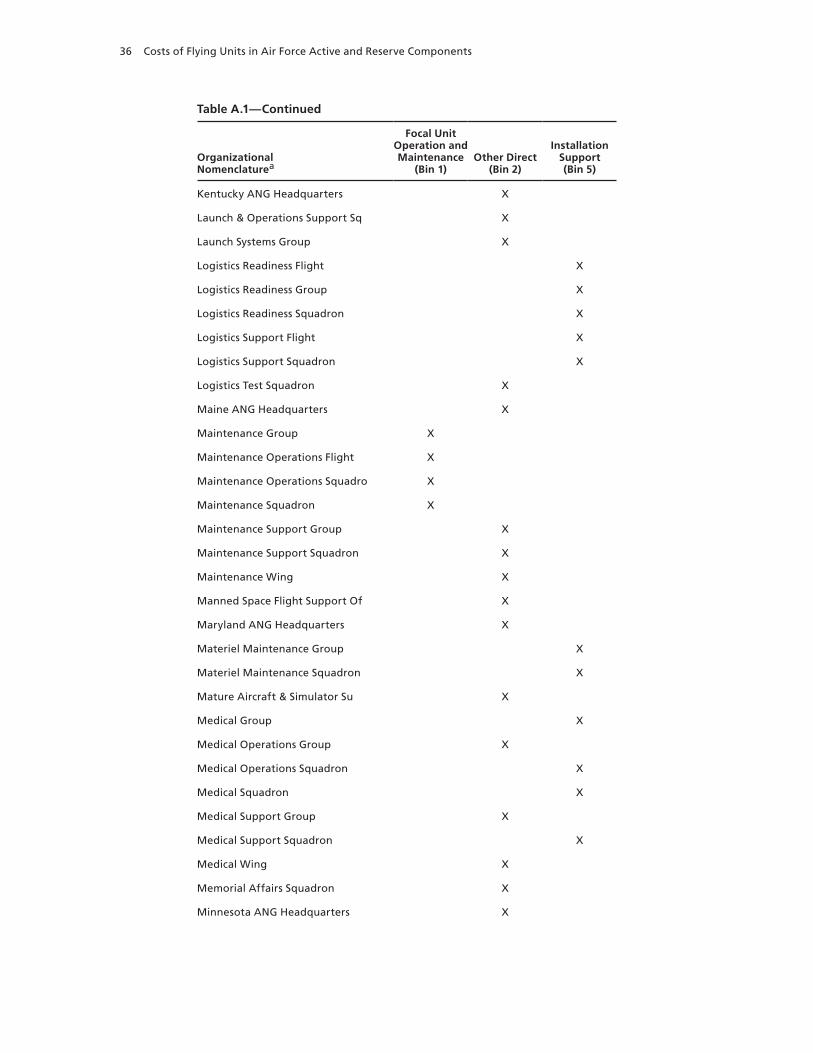
36 Costs of Flying Units in Air Force Active and Reserve Components
Table A.1—Continued
Organizational Nomenclaturea
Focal Unit Operation and Maintenance
(Bin 1)Other Direct
(Bin 2)
Installation Support (Bin 5)
Kentucky ANG headquarters x
Launch & Operations Support Sq x
Launch Systems Group x
Logistics Readiness Flight x
Logistics Readiness Group x
Logistics Readiness Squadron x
Logistics Support Flight x
Logistics Support Squadron x
Logistics Test Squadron x
Maine ANG headquarters x
Maintenance Group x
Maintenance Operations Flight x
Maintenance Operations Squadro x
Maintenance Squadron x
Maintenance Support Group x
Maintenance Support Squadron x
Maintenance wing x
Manned Space Flight Support Of x
Maryland ANG headquarters x
Materiel Maintenance Group x
Materiel Maintenance Squadron x
Mature Aircraft & Simulator Su x
Medical Group x
Medical Operations Group x
Medical Operations Squadron x
Medical Squadron x
Medical Support Group x
Medical Support Squadron x
Medical wing x
Memorial Affairs Squadron x
Minnesota ANG headquarters x

Organization Types 37
Table A.1—Continued
Organizational Nomenclaturea
Focal Unit Operation and Maintenance
(Bin 1)Other Direct
(Bin 2)
Installation Support (Bin 5)
Missile Maintenance Group x
Missile Maintenance Squadron x
Missile Sustainment Group x
Missile Sustainment Squadron x
Mission Support Flight x
Mission Support Group x
Mission Support Squadron x
Mississippi ANG headquarters x
Missouri ANG headquarters x
Mobility AF Logistics Support x
Mobility Operations School x
Montana ANG headquarters x
Muir S Fairchild Research Info x
Munitions Maintenance Group x
Munitions Squadron x x
Munitions Support Squadron x
Munitions Sustainment Group x
National Air & Space Intellige x
National Guard Readiness Cente x
National Security Space Instit x
NEADS Security Forces Flight x
Nebraska ANG headquarters x
Network Operations Security Sq x
Network Support Group x
Network warfare Group x
Network warfare Squadron x
Network warfare wing x
Nevada ANG headquarters x
New hampshire ANG headquarters x
New Jersey ANG headquarters x
New Mexico ANG headquarters x
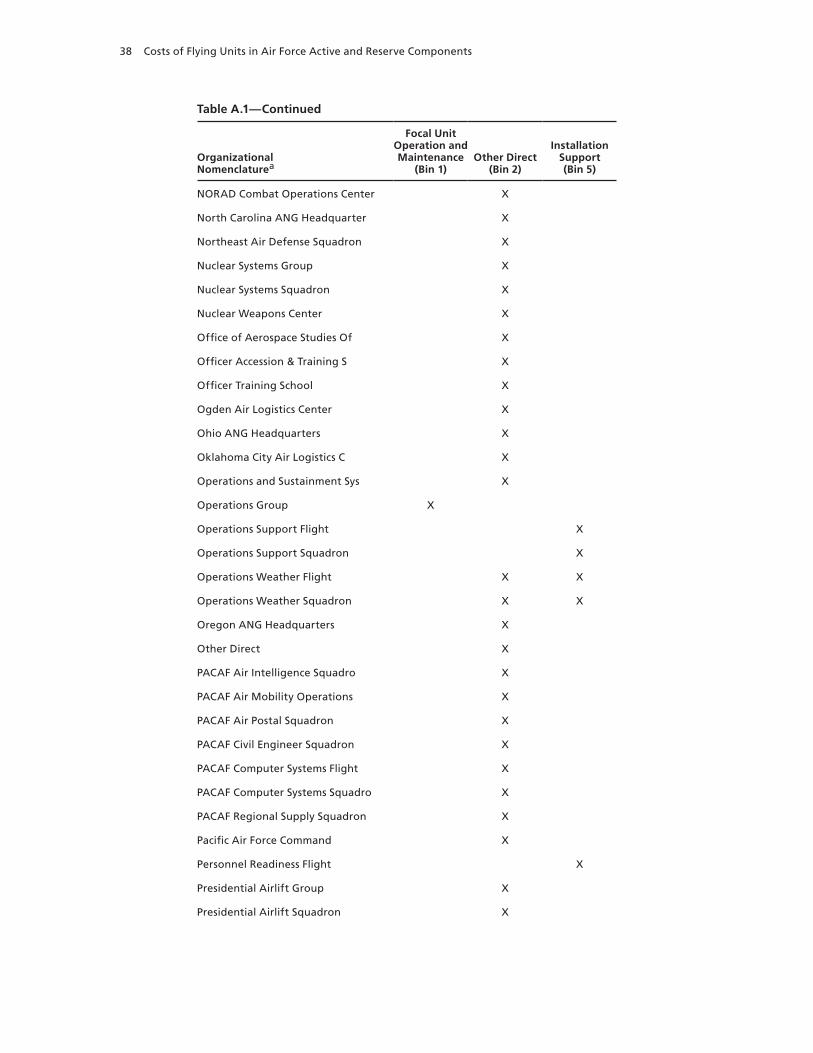
38 Costs of Flying Units in Air Force Active and Reserve Components
Table A.1—Continued
Organizational Nomenclaturea
Focal Unit Operation and Maintenance
(Bin 1)Other Direct
(Bin 2)
Installation Support (Bin 5)
NORAD Combat Operations Center x
North Carolina ANG headquarter x
Northeast Air Defense Squadron x
Nuclear Systems Group x
Nuclear Systems Squadron x
Nuclear weapons Center x
Office of Aerospace Studies Of x
Officer Accession & Training S x
Officer Training School x
Ogden Air Logistics Center x
Ohio ANG headquarters x
Oklahoma City Air Logistics C x
Operations and Sustainment Sys x
Operations Group x
Operations Support Flight x
Operations Support Squadron x
Operations weather Flight x x
Operations weather Squadron x x
Oregon ANG headquarters x
Other Direct x
pACAF Air Intelligence Squadro x
pACAF Air Mobility Operations x
pACAF Air postal Squadron x
pACAF Civil Engineer Squadron x
pACAF Computer Systems Flight x
pACAF Computer Systems Squadro x
pACAF Regional Supply Squadron x
pacific Air Force Command x
personnel Readiness Flight x
presidential Airlift Group x
presidential Airlift Squadron x
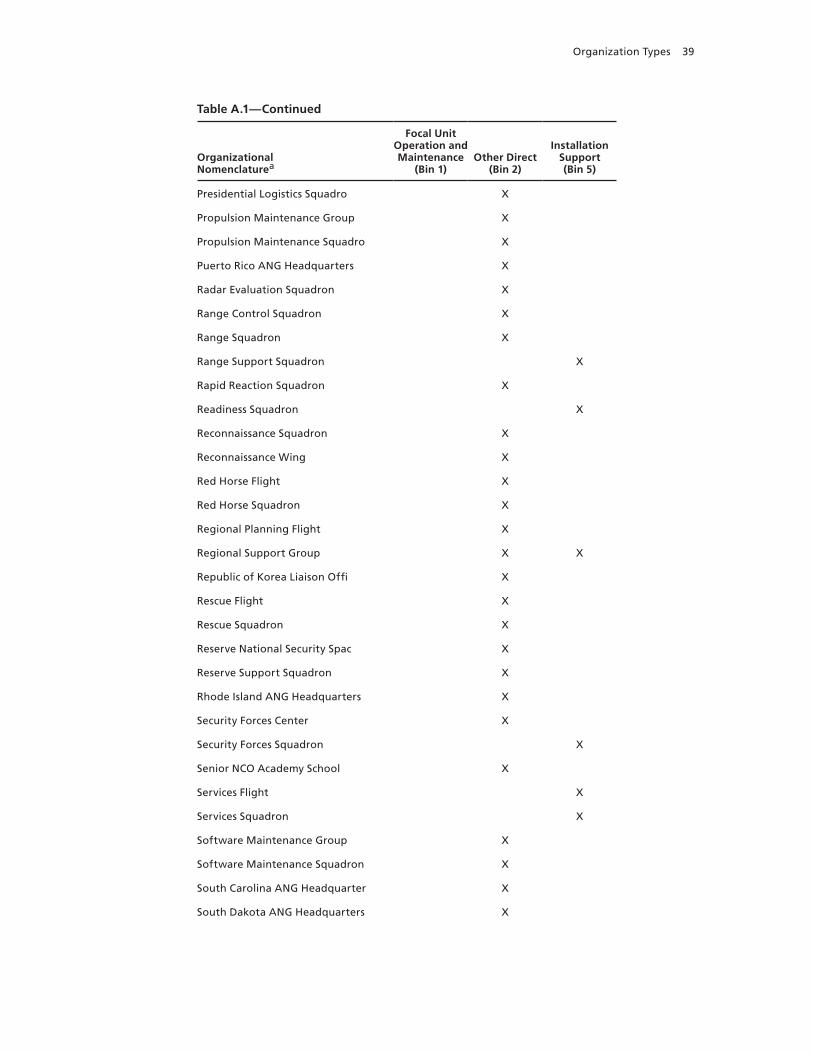
Organization Types 39
Table A.1—Continued
Organizational Nomenclaturea
Focal Unit Operation and Maintenance
(Bin 1)Other Direct
(Bin 2)
Installation Support (Bin 5)
presidential Logistics Squadro x
propulsion Maintenance Group x
propulsion Maintenance Squadro x
puerto Rico ANG headquarters x
Radar Evaluation Squadron x
Range Control Squadron x
Range Squadron x
Range Support Squadron x
Rapid Reaction Squadron x
Readiness Squadron x
Reconnaissance Squadron x
Reconnaissance wing x
Red horse Flight x
Red horse Squadron x
Regional planning Flight x
Regional Support Group x x
Republic of Korea Liaison Offi x
Rescue Flight x
Rescue Squadron x
Reserve National Security Spac x
Reserve Support Squadron x
Rhode Island ANG headquarters x
Security Forces Center x
Security Forces Squadron x
Senior NCO Academy School x
Services Flight x
Services Squadron x
Software Maintenance Group x
Software Maintenance Squadron x
South Carolina ANG headquarter x
South Dakota ANG headquarters x

40 Costs of Flying Units in Air Force Active and Reserve Components
Table A.1—Continued
Organizational Nomenclaturea
Focal Unit Operation and Maintenance
(Bin 1)Other Direct
(Bin 2)
Installation Support (Bin 5)
Space & C3i Sustainment Group x
Space Command x
Space Communications Squadron x
Space Control Squadron x
Space Development & Test wing x
Space Development Group x
Space Logistics Group x
Space Operations Group x
Space Test Group x
Space Test Operations Squadron x
Space warning Squadron x
Space wing x
Special Investigation Academy x
Special Investigation Activity x
Special Operations Flight x
Special Operations Group x
Special Operations Squadron x
Special Operations wing x
Special Tactics Squadron x
Specialize Management Sustainm x
Squadron Officer School x
Squadron Officers College x
Strategic Operations Squadron x
Student Flight x
Student Squadron x
Supply Squadron x
Support Group x
Support Squadron x
Surgical Inpatient Squadron x
Surgical Operation Group x
Surgical Operation Squadron x
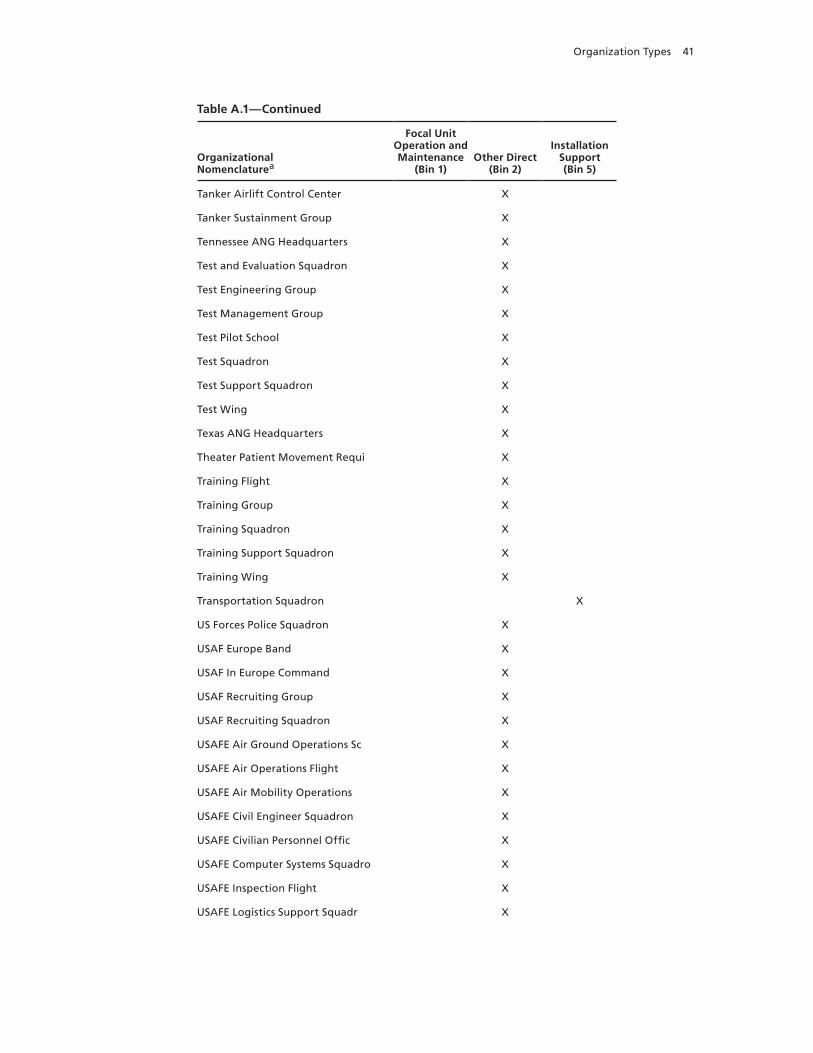
Organization Types 41
Table A.1—Continued
Organizational Nomenclaturea
Focal Unit Operation and Maintenance
(Bin 1)Other Direct
(Bin 2)
Installation Support (Bin 5)
Tanker Airlift Control Center x
Tanker Sustainment Group x
Tennessee ANG headquarters x
Test and Evaluation Squadron x
Test Engineering Group x
Test Management Group x
Test pilot School x
Test Squadron x
Test Support Squadron x
Test wing x
Texas ANG headquarters x
Theater patient Movement Requi x
Training Flight x
Training Group x
Training Squadron x
Training Support Squadron x
Training wing x
Transportation Squadron x
US Forces police Squadron x
USAF Europe Band x
USAF In Europe Command x
USAF Recruiting Group x
USAF Recruiting Squadron x
USAFE Air Ground Operations Sc x
USAFE Air Operations Flight x
USAFE Air Mobility Operations x
USAFE Civil Engineer Squadron x
USAFE Civilian personnel Offic x
USAFE Computer Systems Squadro x
USAFE Inspection Flight x
USAFE Logistics Support Squadr x

42 Costs of Flying Units in Air Force Active and Reserve Components
Table A.1—Continued
Organizational Nomenclaturea
Focal Unit Operation and Maintenance
(Bin 1)Other Direct
(Bin 2)
Installation Support (Bin 5)
USAFE Medical Services Flight x
USAFE NCO Academy Flight x
USAFE Regional Basing Flight x
USAFE Regional Supply Squadron x
USAFE Services Flight x
USAFE warrior preparations Cent x
Utah ANG headquarters x
Vehicle Readiness Squadron x
Vermont ANG headquarters x
Virgin Islands ANG headquarter x
weapons Squadron x x
weather Flight x
weather Recon Squadron x
weather Squadron x
west Virginia ANG headquarters x
western Air Defense Squadron x
wing x
wisconsin ANG headquarters x
wyoming ANG headquarters x
a Truncated organizational nomenclatures shown here are as they appear in AFTOC.

43
AppENDIx B
Outputs and Costs per Output
This appendix contains graphical displays of the average annual outputs generated by active- and reserve-component wings during the five years included in our analyses (FYs 2006 through 2010) and the average annual costs of those outputs. Associate unit outputs and costs are indi-cated in bars immediately to the right of their host wings. All costs were inflated to FY 2010 dollars.
Figure B.1Average Annual Flying Hours, C-130 Wings
RAND TR1275-B.1
Flyi
ng
ho
urs
0
5,000
10,000
15,000
20,000
25,000
30,000
Dyess
Little
Rock
Pope
Ramste
in
Yokota
Max
wel
l
Min
neapolis
−St. P
aul
Niagar
a Fal
ls
ANG asso
ciate
Pete
rson
Pitt
sburg
hPo
pe
Active
asso
ciate
Youngstow
n
Channel
Isla
nds
Charlo
tte D
ouglas
Cheyen
ne
Active
asso
ciate
Ft. W
orth
Gener
al D
ownin
gKulis
Louisv
ille
Luis
Munoz
Man
sfiel
d
Mar
tin St
ate
Min
neapolis
−St. P
aul
Nashvil
le
New C
astle
QuonsetRen
o
Rosencr
ans
Sava
nnah
Yeager
Active, operationalActive, trainingAFRC, operationalAFRC, trainingANG, operationalANG, training

44 Costs of Flying Units in Air Force Active and Reserve Components
Figure B.2Percentage of Flying Hours That Were Operational, C-130 Wings
RAND TR1275-B.2
Perc
enta
ge
0
20
40
60
80
100
Dyess
Little
Rock
Pope
Ramste
in
Yokota
Max
wel
l
Min
neapolis
−St. P
aul
Niagar
a Fal
ls
ANG asso
ciate
Pete
rson
Pitt
sburg
hPo
pe
Active
asso
ciate
Youngstow
n
Channel
Isla
nds
Charlo
tte D
ouglas
Cheyen
ne
Active
asso
ciate
Ft. W
orth
Gener
al D
ownin
gKulis
Louisv
ille
Luis
Munoz
Man
sfiel
d
Mar
tin St
ate
Min
neapolis
−St. P
aul
Nashvil
le
New C
astle
QuonsetRen
o
Rosencr
ans
Sava
nnah
Yeager
Active
AFRC
ANG
Figure B.3Average PMAI, C-130 Wings
RAND TR1275-B.3
PMA
I
0
5
10
15
20
25
35
30
Dyess
Little
Rock
Pope
Ramste
in
Yokota
Max
wel
l
Min
neapolis
−St. P
aul
Niagar
a Fal
ls
ANG asso
ciate
Pete
rson
Pitt
sburg
hPo
pe
Active
asso
ciate
Youngstow
n
Channel
Isla
nds
Charlo
tte D
ouglas
Cheyen
ne
Active
asso
ciate
Ft. W
orth
Gener
al D
ownin
gKulis
Louisv
ille
Luis
Munoz
Man
sfiel
d
Mar
tin St
ate
Min
neapolis
−St. P
aul
Nashvil
le
New C
astle
QuonsetRen
o
Rosencr
ans
Sava
nnah
Yeager
Active
AFRC
ANG

Outputs and Costs per Output 45
Figure B.4Average Cost per PMAI, C-130 Wings
RAND TR1275-B.4
FY 2
010
$, m
illio
ns
0
5
10
15
20
25
Dyess
Little
Rock
Pope
Ramste
in
Yokota
Max
wel
l
Min
neapolis
−St. P
aul
Niagar
a Fal
ls
ANG asso
ciate
Pete
rson
Pitt
sburg
hPo
pe
Active
asso
ciate
Youngstow
n
Channel
Isla
nds
Charlo
tte D
ouglas
Cheyen
ne
Active
asso
ciate
Ft. W
orth
Gener
al D
ownin
gKulis
Louisv
ille
Luis
Munoz
Man
sfiel
d
Mar
tin St
ate
Min
neapolis
−St. P
aul
Nashvil
le
New C
astle
QuonsetRen
o
Rosencr
ans
Sava
nnah
Yeager
Active
AFRC
ANG
Figure B.5Average Flying Hours per PMAI, C-130 Wings
RAND TR1275-B.5
Flyi
ng
ho
urs
0
200
400
600
800
1,000
Dyess
Little
Rock
Pope
Ramste
in
Yokota
Max
wel
l
Min
neapolis
−St. P
aul
Niagar
a Fal
ls
ANG asso
ciate
Pete
rson
Pitt
sburg
hPo
pe
Active
asso
ciate
Youngstow
n
Channel
Isla
nds
Charlo
tte D
ouglas
Cheyen
ne
Active
asso
ciate
Ft. W
orth
Gener
al D
ownin
gKulis
Louisv
ille
Luis
Munoz
Man
sfiel
d
Mar
tin St
ate
Min
neapolis
−St. P
aul
Nashvil
le
New C
astle
QuonsetRen
o
Rosencr
ans
Sava
nnah
Yeager
Active
AFRC
ANG
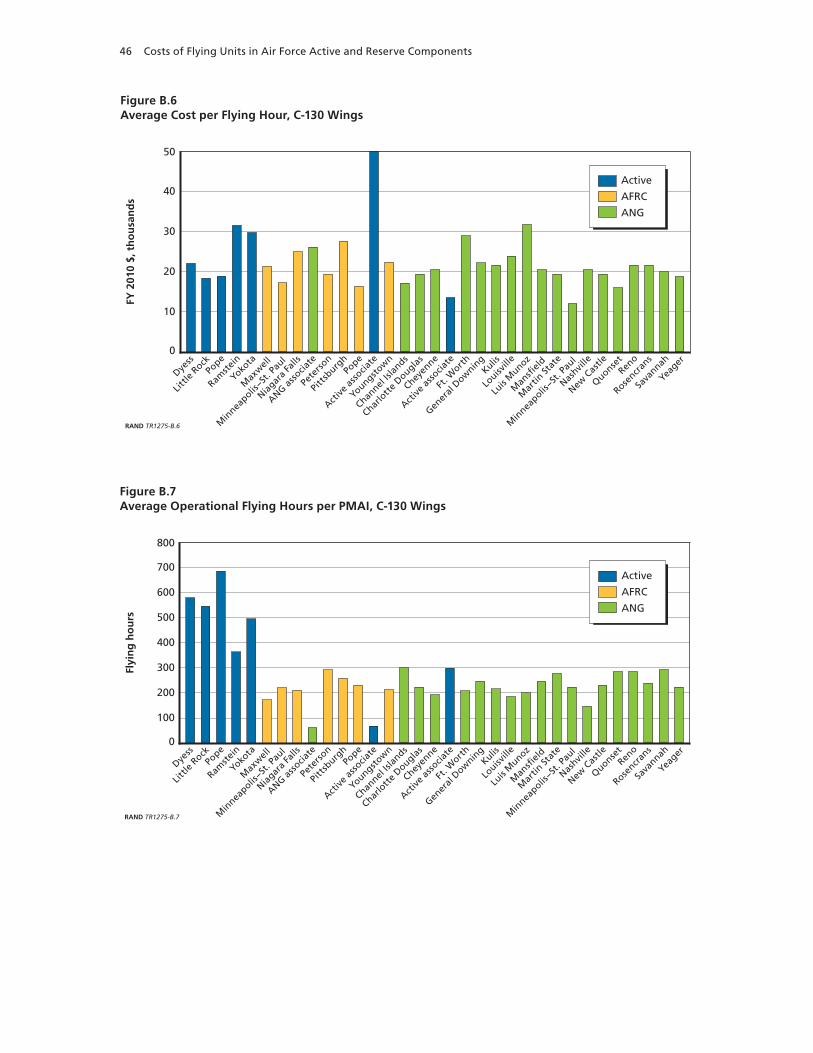
46 Costs of Flying Units in Air Force Active and Reserve Components
Figure B.6Average Cost per Flying Hour, C-130 Wings
RAND TR1275-B.6
FY 2
010
$, t
ho
usa
nd
s
0
10
20
30
40
50
Dyess
Little
Rock
Pope
Ramste
in
Yokota
Max
wel
l
Min
neapolis
−St. P
aul
Niagar
a Fal
ls
ANG asso
ciate
Pete
rson
Pitt
sburg
hPo
pe
Active
asso
ciate
Youngstow
n
Channel
Isla
nds
Charlo
tte D
ouglas
Cheyen
ne
Active
asso
ciate
Ft. W
orth
Gener
al D
ownin
gKulis
Louisv
ille
Luis
Munoz
Man
sfiel
d
Mar
tin St
ate
Min
neapolis
−St. P
aul
Nashvil
le
New C
astle
QuonsetRen
o
Rosencr
ans
Sava
nnah
Yeager
Active
AFRC
ANG
Figure B.7Average Operational Flying Hours per PMAI, C-130 Wings
RAND TR1275-B.7
Flyi
ng
ho
urs
0
100
200
300
700
600
500
400
800
Dyess
Little
Rock
Pope
Ramste
in
Yokota
Max
wel
l
Min
neapolis
−St. P
aul
Niagar
a Fal
ls
ANG asso
ciate
Pete
rson
Pitt
sburg
hPo
pe
Active
asso
ciate
Youngstow
n
Channel
Isla
nds
Charlo
tte D
ouglas
Cheyen
ne
Active
asso
ciate
Ft. W
orth
Gener
al D
ownin
gKulis
Louisv
ille
Luis
Munoz
Man
sfiel
d
Mar
tin St
ate
Min
neapolis
−St. P
aul
Nashvil
le
New C
astle
QuonsetRen
o
Rosencr
ans
Sava
nnah
Yeager
Active
AFRC
ANG
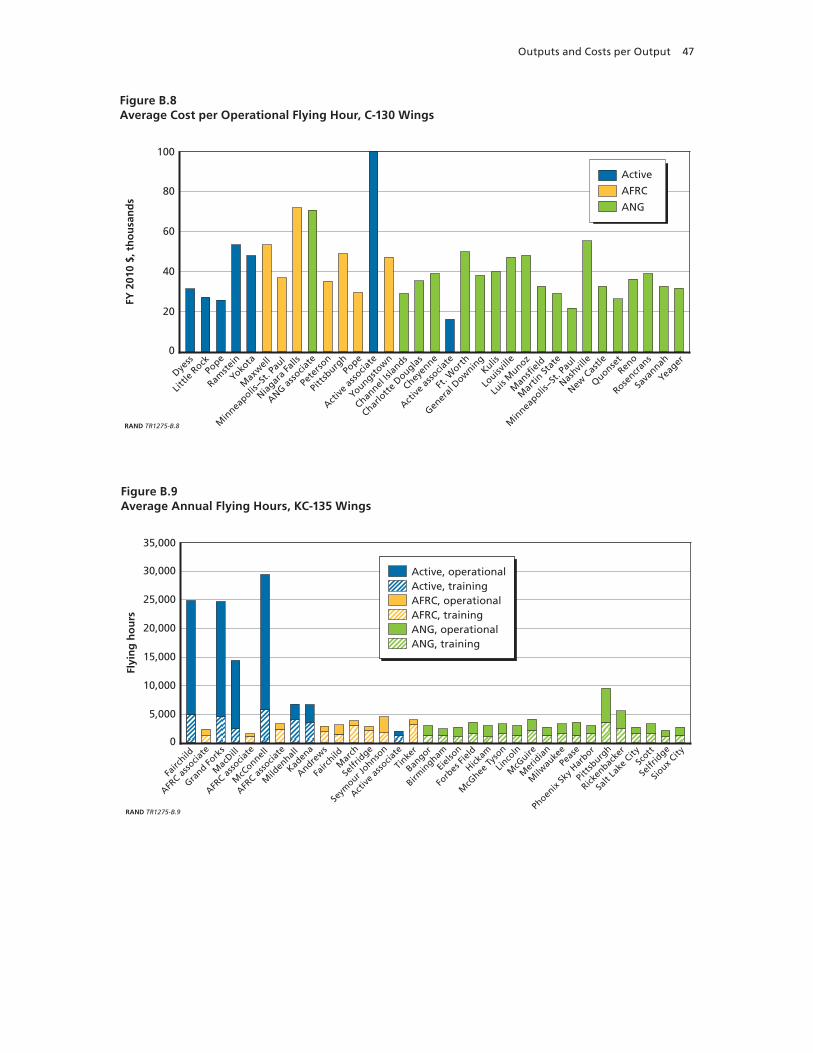
Outputs and Costs per Output 47
Figure B.8Average Cost per Operational Flying Hour, C-130 Wings
RAND TR1275-B.8
FY 2
010
$, t
ho
usa
nd
s
0
20
40
60
80
100
Dyess
Little
Rock
Pope
Ramste
in
Yokota
Max
wel
l
Min
neapolis
−St. P
aul
Niagar
a Fal
ls
ANG asso
ciate
Pete
rson
Pitt
sburg
hPo
pe
Active
asso
ciate
Youngstow
n
Channel
Isla
nds
Charlo
tte D
ouglas
Cheyen
ne
Active
asso
ciate
Ft. W
orth
Gener
al D
ownin
gKulis
Louisv
ille
Luis
Munoz
Man
sfiel
d
Mar
tin St
ate
Min
neapolis
−St. P
aul
Nashvil
le
New C
astle
QuonsetRen
o
Rosencr
ans
Sava
nnah
Yeager
Active
AFRC
ANG
Figure B.9Average Annual Flying Hours, KC-135 Wings
RAND TR1275-B.9
Flyi
ng
ho
urs
0
5,000
10,000
15,000
20,000
25,000
35,000
30,000
Fairc
hild
AFRC a
ssocia
te
Grand Fo
rks
Mac
Dill
AFRC a
ssocia
te
McC
onnell
AFRC a
ssocia
te
Mild
enhal
l
Kaden
a
Andrew
s
Fairc
hildM
arch
Selfr
idge
Seym
our Johnso
n
Active
asso
ciate
Tinke
r
Bangor
Birmin
gham
Eiel
son
Forb
es Fi
eld
Hickam
McG
hee Ty
son
Linco
ln
McG
uire
Mer
idia
n
Milw
auke
e
Peas
e
Phoen
ix Sk
y Har
bor
Pitt
sburg
h
Ricken
backe
r
Salt
Lake
City
Scott
Selfr
idge
Sioux C
ity
Active, operationalActive, trainingAFRC, operationalAFRC, trainingANG, operationalANG, training
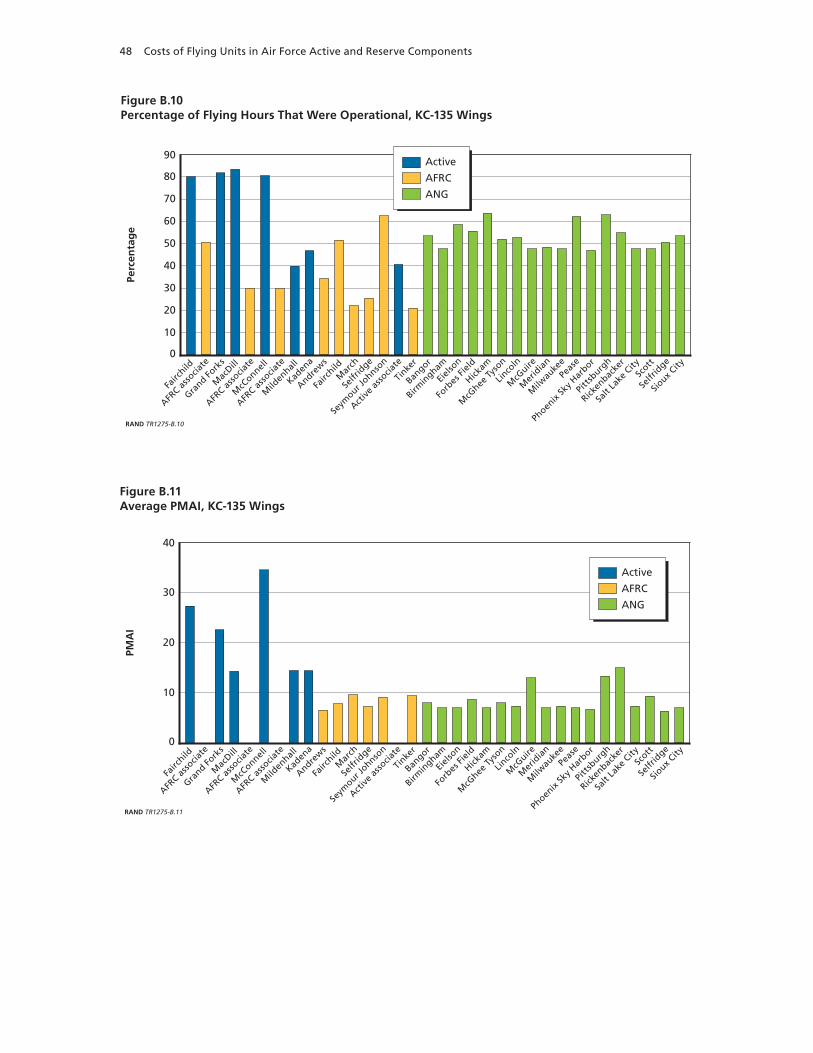
48 Costs of Flying Units in Air Force Active and Reserve Components
Figure B.10Percentage of Flying Hours That Were Operational, KC-135 Wings
RAND TR1275-B.10
Perc
enta
ge
0
10
20
40
90
80
70
60
50
30
Fairc
hild
AFRC a
ssocia
te
Grand Fo
rks
Mac
Dill
AFRC a
ssocia
te
McC
onnell
AFRC a
ssocia
te
Mild
enhal
l
Kaden
a
Andrew
s
Fairc
hildM
arch
Selfr
idge
Seym
our Johnso
n
Active
asso
ciate
Tinke
r
Bangor
Birmin
gham
Eiel
son
Forb
es Fi
eld
Hickam
McG
hee Ty
son
Linco
ln
McG
uire
Mer
idia
n
Milw
auke
e
Peas
e
Phoen
ix Sk
y Har
bor
Pitt
sburg
h
Ricken
backe
r
Salt
Lake
City
Scott
Selfr
idge
Sioux C
ity
Active
AFRC
ANG
Figure B.11Average PMAI, KC-135 Wings
RAND TR1275-B.11
PMA
I
0
10
20
30
40
Fairc
hild
AFRC a
ssocia
te
Grand Fo
rks
Mac
Dill
AFRC a
ssocia
te
McC
onnell
AFRC a
ssocia
te
Mild
enhal
l
Kaden
a
Andrew
s
Fairc
hildM
arch
Selfr
idge
Seym
our Johnso
n
Active
asso
ciate
Tinke
r
Bangor
Birmin
gham
Eiel
son
Forb
es Fi
eld
Hickam
McG
hee Ty
son
Linco
ln
McG
uire
Mer
idia
n
Milw
auke
e
Peas
e
Phoen
ix Sk
y Har
bor
Pitt
sburg
h
Ricken
backe
r
Salt
Lake
City
Scott
Selfr
idge
Sioux C
ity
Active
AFRC
ANG

Outputs and Costs per Output 49
Figure B.12Average Cost per PMAI, KC-135 Wings
RAND TR1275-B.12
FY 2
010
$, m
illio
ns
0
5
10
20
25
15
Fairc
hild
AFRC a
ssocia
te
Grand Fo
rks
Mac
Dill
AFRC a
ssocia
te
McC
onnell
AFRC a
ssocia
te
Mild
enhal
l
Kaden
a
Andrew
s
Fairc
hildM
arch
Selfr
idge
Seym
our Johnso
n
Active
asso
ciate
Tinke
r
Bangor
Birmin
gham
Eiel
son
Forb
es Fi
eld
Hickam
McG
hee Ty
son
Linco
ln
McG
uire
Mer
idia
n
Milw
auke
e
Peas
e
Phoen
ix Sk
y Har
bor
Pitt
sburg
h
Ricken
backe
r
Salt
Lake
City
Scott
Selfr
idge
Sioux C
ity
Active
AFRC
ANG
Figure B.13Average Flying Hours per PMAI, KC-135 Wings
RAND TR1275-B.13
Flyi
ng
ho
urs
0
200
400
1,000
1,200
800
600
Fairc
hild
AFRC a
ssocia
te
Grand Fo
rks
Mac
Dill
AFRC a
ssocia
te
McC
onnell
AFRC a
ssocia
te
Mild
enhal
l
Kaden
a
Andrew
s
Fairc
hildM
arch
Selfr
idge
Seym
our Johnso
n
Active
asso
ciate
Tinke
r
Bangor
Birmin
gham
Eiel
son
Forb
es Fi
eld
Hickam
McG
hee Ty
son
Linco
ln
McG
uire
Mer
idia
n
Milw
auke
e
Peas
e
Phoen
ix Sk
y Har
bor
Pitt
sburg
h
Ricken
backe
r
Salt
Lake
City
Scott
Selfr
idge
Sioux C
ity
Active
AFRC
ANG
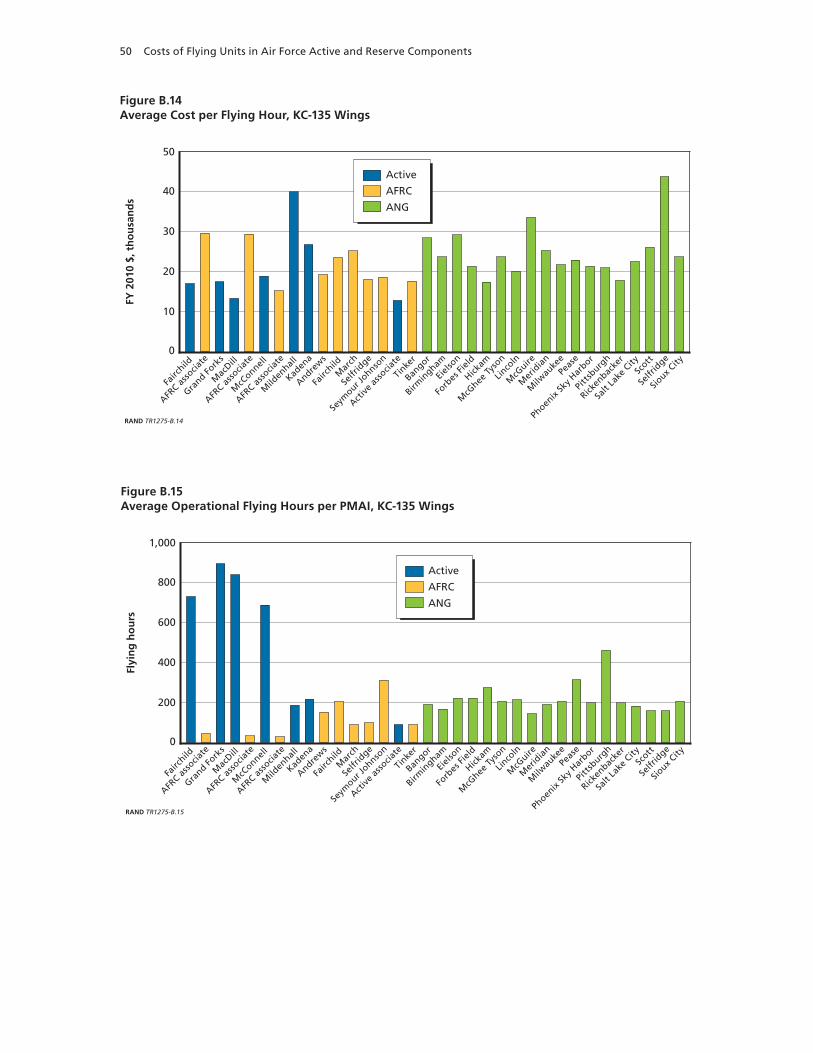
50 Costs of Flying Units in Air Force Active and Reserve Components
Figure B.14Average Cost per Flying Hour, KC-135 Wings
RAND TR1275-B.14
FY 2
010
$, t
ho
usa
nd
s
0
10
20
40
50
30
Fairc
hild
AFRC a
ssocia
te
Grand Fo
rks
Mac
Dill
AFRC a
ssocia
te
McC
onnell
AFRC a
ssocia
te
Mild
enhal
l
Kaden
a
Andrew
s
Fairc
hildM
arch
Selfr
idge
Seym
our Johnso
n
Active
asso
ciate
Tinke
r
Bangor
Birmin
gham
Eiel
son
Forb
es Fi
eld
Hickam
McG
hee Ty
son
Linco
ln
McG
uire
Mer
idia
n
Milw
auke
e
Peas
e
Phoen
ix Sk
y Har
bor
Pitt
sburg
h
Ricken
backe
r
Salt
Lake
City
Scott
Selfr
idge
Sioux C
ity
Active
AFRC
ANG
Figure B.15Average Operational Flying Hours per PMAI, KC-135 Wings
RAND TR1275-B.15
Flyi
ng
ho
urs
0
200
400
1,000
800
600
Fairc
hild
AFRC a
ssocia
te
Grand Fo
rks
Mac
Dill
AFRC a
ssocia
te
McC
onnell
AFRC a
ssocia
te
Mild
enhal
l
Kaden
a
Andrew
s
Fairc
hildM
arch
Selfr
idge
Seym
our Johnso
n
Active
asso
ciate
Tinke
r
Bangor
Birmin
gham
Eiel
son
Forb
es Fi
eld
Hickam
McG
hee Ty
son
Linco
ln
McG
uire
Mer
idia
n
Milw
auke
e
Peas
e
Phoen
ix Sk
y Har
bor
Pitt
sburg
h
Ricken
backe
r
Salt
Lake
City
Scott
Selfr
idge
Sioux C
ity
Active
AFRC
ANG

Outputs and Costs per Output 51
Figure B.16Average Cost per Operational Flying Hour, KC-135 Wings
RAND TR1275-B.16
FY 2
010
$, t
ho
usa
nd
s
0
20
40
80
120
100
60
AFRC a
ssocia
te
Grand Fo
rks
Mac
Dill
AFRC a
ssocia
te
McC
onnell
AFRC a
ssocia
te
Mild
enhal
l
Kaden
a
Andrew
s
Fairc
hildM
arch
Selfr
idge
Seym
our Johnso
n
Active
asso
ciate
Tinke
r
Bangor
Birmin
gham
Eiel
son
Forb
es Fi
eld
Hickam
McG
hee Ty
son
Linco
ln
McG
uire
Mer
idia
n
Milw
auke
e
Peas
e
Phoen
ix Sk
y Har
bor
Pitt
sburg
h
Ricken
backe
r
Salt
Lake
City
Scott
Selfr
idge
Sioux C
ity
Fairc
hild
Active
AFRC
ANG
Figure B.17Average Annual Flying Hours, F-16 Wings
RAND TR1275-B.17
Flyi
ng
ho
urs
0
5,000
10,000
15,000
20,000
25,000
30,000
Active, operationalActive, trainingAFRC, operationalAFRC, trainingANG, operationalANG, training
Aviano
Hill
AFRC a
ssocia
te
Kunsan
Misa
wa
Osan
Shaw
Span
gdahle
m
Carsw
ell
Homes
tead
Andrew
s
Atlantic
City
Buckle
y
Burlingto
n
Des M
oines
Duluth
Fres
no
Ft. W
ayne
Kirtla
nd
Mad
ison
McE
ntire
Montg
omer
y
Sioux F
alls
Tole
do
Tulsa
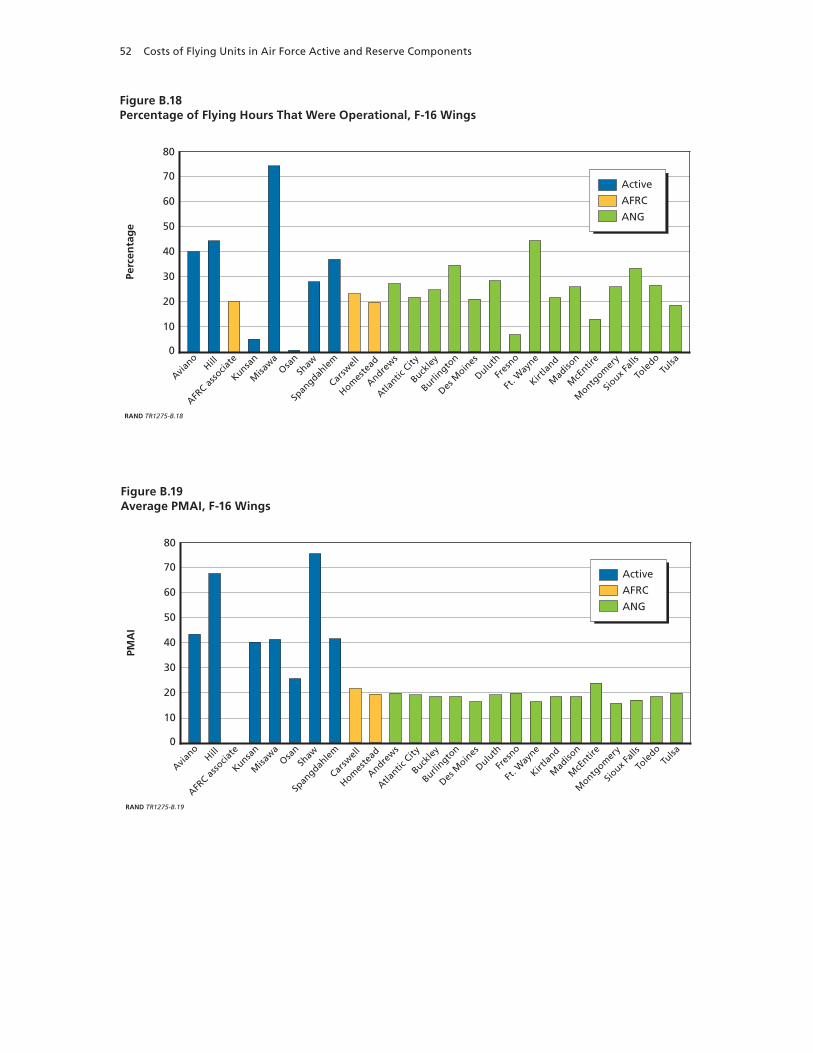
52 Costs of Flying Units in Air Force Active and Reserve Components
Figure B.18Percentage of Flying Hours That Were Operational, F-16 Wings
RAND TR1275-B.18
Perc
enta
ge
0
10
20
30
40
70
60
50
80
Aviano
Hill
Kunsan
Misa
wa
Osan
Shaw
Span
gdahle
m
Carsw
ell
Homes
tead
Andrew
s
Atlantic
City
Buckle
y
Burlingto
n
Des M
oines
Duluth
Fres
no
Ft. W
ayne
Kirtla
nd
Mad
ison
McE
ntire
Montg
omer
y
Sioux F
alls
Tole
do
Tulsa
AFRC a
ssocia
te
Active
AFRC
ANG
Figure B.19Average PMAI, F-16 Wings
RAND TR1275-B.19
PMA
I
0
10
20
30
40
70
60
50
80
Aviano
Hill
AFRC a
ssocia
te
Kunsan
Misa
wa
Osan
Shaw
Span
gdahle
m
Carsw
ell
Homes
tead
Andrew
s
Atlantic
City
Buckle
y
Burlingto
n
Des M
oines
Duluth
Fres
no
Ft. W
ayne
Kirtla
nd
Mad
ison
McE
ntire
Montg
omer
y
Sioux F
alls
Tole
do
Tulsa
Active
AFRC
ANG

Outputs and Costs per Output 53
Figure B.20Average Cost per PMAI, F-16 Wings
RAND TR1275-B.20
FY 2
010
$, m
illio
ns
0
2
4
6
8
10
12
Aviano
Hill
AFRC a
ssocia
te
Kunsan
Misa
wa
Osan
Shaw
Span
gdahle
m
Carsw
ell
Homes
tead
Andrew
s
Atlantic
City
Buckle
y
Burlingto
n
Des M
oines
Duluth
Fres
no
Ft. W
ayne
Kirtla
nd
Mad
ison
McE
ntire
Montg
omer
y
Sioux F
alls
Tole
do
Tulsa
Active
AFRC
ANG
Figure B.21Average Flying Hours per PMAI, F-16 Wings
RAND TR1275-B.21
Flyi
ng
ho
urs
0
100
200
300
400
Aviano
Hill
AFRC a
ssocia
te
Kunsan
Misa
wa
Osan
Shaw
Span
gdahle
m
Carsw
ell
Homes
tead
Andrew
s
Atlantic
City
Buckle
y
Burlingto
n
Des M
oines
Duluth
Fres
no
Ft. W
ayne
Kirtla
nd
Mad
ison
McE
ntire
Montg
omer
y
Sioux F
alls
Tole
do
Tulsa
Active
AFRC
ANG

54 Costs of Flying Units in Air Force Active and Reserve Components
Figure B.22Average Cost per Flying Hour, F-16 Wings
RAND TR1275-B.22
FY 2
010
$, t
ho
usa
nd
s
0
10
20
30
40
Aviano
Hill
AFRC a
ssocia
te
Kunsan
Misa
wa
Osan
Shaw
Span
gdahle
m
Carsw
ell
Homes
tead
Andrew
s
Atlantic
City
Buckle
y
Burlingto
n
Des M
oines
Duluth
Fres
no
Ft. W
ayne
Kirtla
nd
Mad
ison
McE
ntire
Montg
omer
y
Sioux F
alls
Tole
do
Tulsa
Active
AFRC
ANG
Figure B.23Average Operational Flying Hours per PMAI, F-16 Wings
RAND TR1275-B.23
Flyi
ng
ho
urs
0
100
200
300
Aviano
Hill
AFRC a
ssocia
te
Kunsan
Misa
wa
Osan
Shaw
Span
gdahle
m
Carsw
ell
Homes
tead
Andrew
s
Atlantic
City
Buckle
y
Burlingto
n
Des M
oines
Duluth
Fres
no
Ft. W
ayne
Kirtla
nd
Mad
ison
McE
ntire
Montg
omer
y
Sioux F
alls
Tole
do
Tulsa
Active
AFRC
ANG
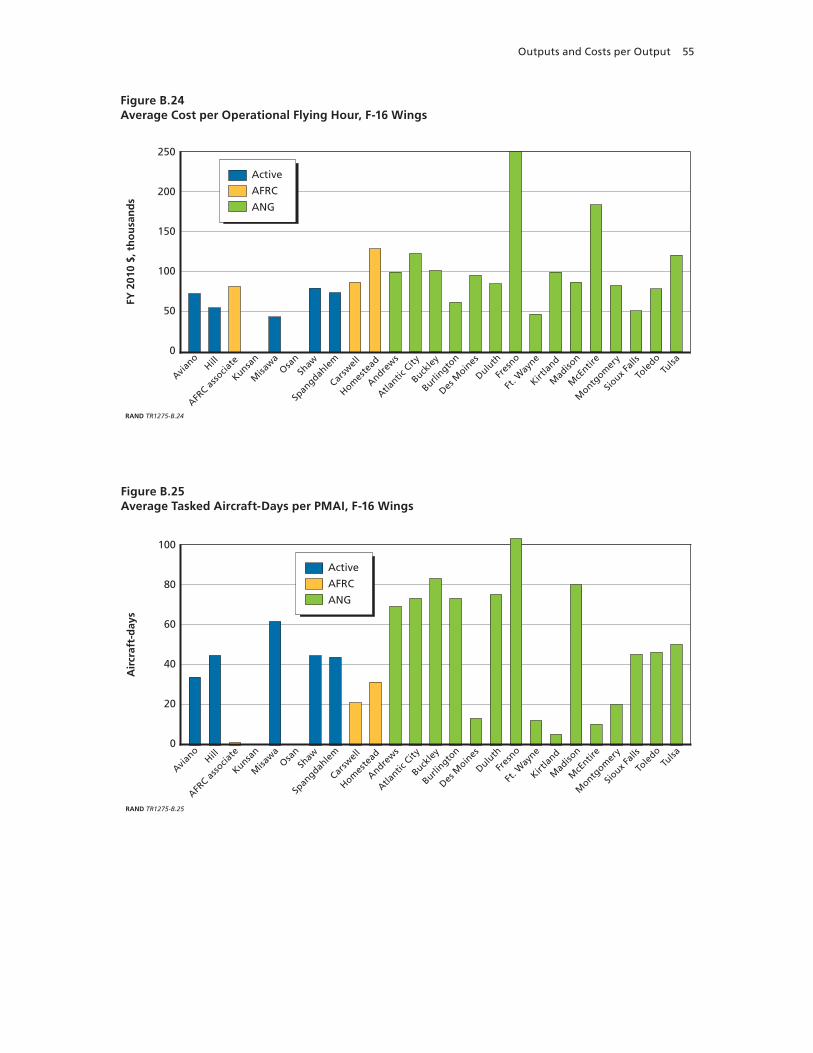
Outputs and Costs per Output 55
Figure B.24Average Cost per Operational Flying Hour, F-16 Wings
RAND TR1275-B.24
FY 2
010
$, t
ho
usa
nd
s
0
50
200
150
100
250
Aviano
Hill
AFRC a
ssocia
te
Kunsan
Misa
wa
Osan
Shaw
Span
gdahle
m
Carsw
ell
Homes
tead
Andrew
s
Atlantic
City
Buckle
y
Burlingto
n
Des M
oines
Duluth
Fres
no
Ft. W
ayne
Kirtla
nd
Mad
ison
McE
ntire
Montg
omer
y
Sioux F
alls
Tole
do
Tulsa
Active
AFRC
ANG
Figure B.25Average Tasked Aircraft-Days per PMAI, F-16 Wings
RAND TR1275-B.25
Air
craf
t-d
ays
0
20
80
60
40
100
Aviano
Hill
AFRC a
ssocia
te
Kunsan
Misa
wa
Osan
Shaw
Span
gdahle
m
Carsw
ell
Homes
tead
Andrew
s
Atlantic
City
Buckle
y
Burlingto
n
Des M
oines
Duluth
Fres
no
Ft. W
ayne
Kirtla
nd
Mad
ison
McE
ntire
Montg
omer
y
Sioux F
alls
Tole
do
Tulsa
Active
AFRC
ANG

56 Costs of Flying Units in Air Force Active and Reserve Components
Figure B.26Average Cost per Tasked Aircraft-Day, F-16 Wings
RAND TR1275-B.26
FY 2
010
$, t
ho
usa
nd
s
0
100
700
600
500
400
300
200
800
Aviano
Hill
AFRC a
ssocia
te
Kunsan
Misa
wa
Osan
Shaw
Span
gdahle
m
Carsw
ell
Homes
tead
Andrew
s
Atlantic
City
Buckle
y
Burlingto
n
Des M
oines
Duluth
Fres
no
Ft. W
ayne
Kirtla
nd
Mad
ison
McE
ntire
Montg
omer
y
Sioux F
alls
Tole
do
Tulsa
Active
AFRC
ANG
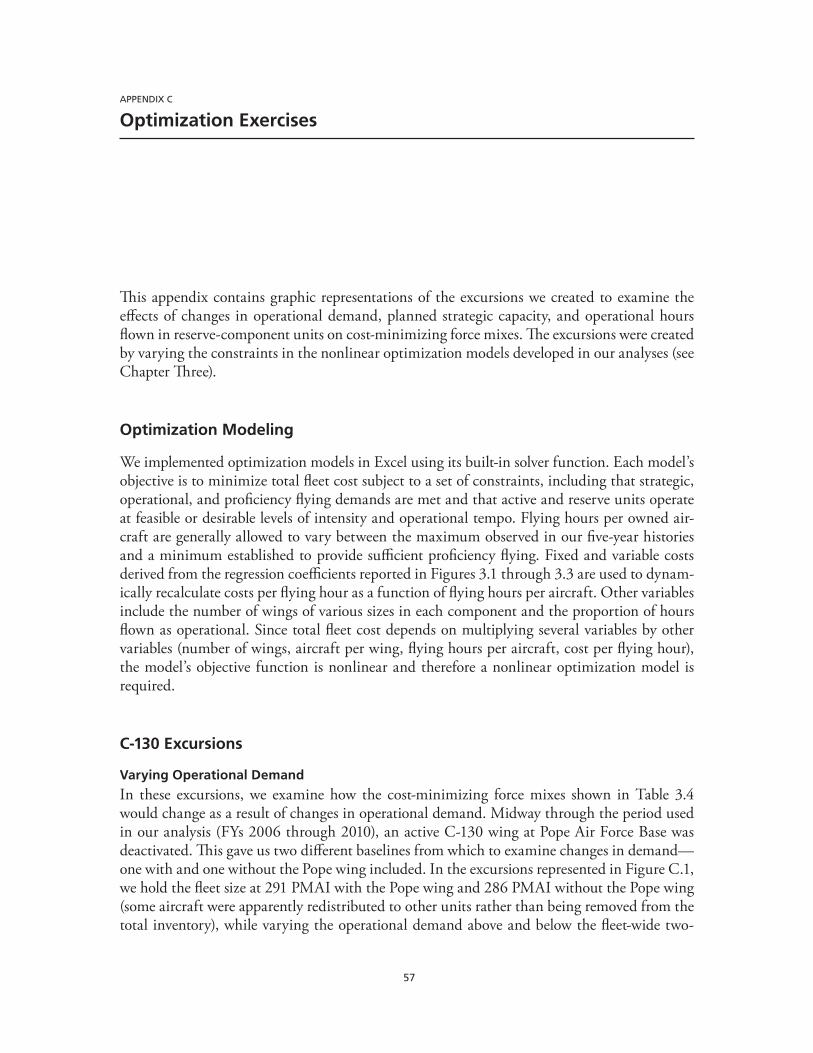
57
AppENDIx C
Optimization Exercises
This appendix contains graphic representations of the excursions we created to examine the effects of changes in operational demand, planned strategic capacity, and operational hours flown in reserve-component units on cost-minimizing force mixes. The excursions were created by varying the constraints in the nonlinear optimization models developed in our analyses (see Chapter Three).
Optimization Modeling
We implemented optimization models in Excel using its built-in solver function. Each model’s objective is to minimize total fleet cost subject to a set of constraints, including that strategic, operational, and proficiency flying demands are met and that active and reserve units operate at feasible or desirable levels of intensity and operational tempo. Flying hours per owned air-craft are generally allowed to vary between the maximum observed in our five-year histories and a minimum established to provide sufficient proficiency flying. Fixed and variable costs derived from the regression coefficients reported in Figures 3.1 through 3.3 are used to dynam-ically recalculate costs per flying hour as a function of flying hours per aircraft. Other variables include the number of wings of various sizes in each component and the proportion of hours flown as operational. Since total fleet cost depends on multiplying several variables by other variables (number of wings, aircraft per wing, flying hours per aircraft, cost per flying hour), the model’s objective function is nonlinear and therefore a nonlinear optimization model is required.
C-130 Excursions
Varying Operational Demand
In these excursions, we examine how the cost-minimizing force mixes shown in Table 3.4 would change as a result of changes in operational demand. Midway through the period used in our analysis (FYs 2006 through 2010), an active C-130 wing at Pope Air Force Base was deactivated. This gave us two different baselines from which to examine changes in demand—one with and one without the Pope wing included. In the excursions represented in Figure C.1, we hold the fleet size at 291 PMAI with the Pope wing and 286 PMAI without the Pope wing (some aircraft were apparently redistributed to other units rather than being removed from the total inventory), while varying the operational demand above and below the fleet-wide two-

58 Costs of Flying Units in Air Force Active and Reserve Components
year average of 92,700 operational flying hours per year observed after the Pope wing closed. We held the number of active overseas PMAI constant and allowed only CONUS active and reserve PMAI to vary. We also set a floor of 543 flying hours per year per owned aircraft for active-component units, which is less than the 778 hours per year found in our five-year his-tory.1 This panel indicates that, as operational demand drops, the cost-minimizing proportion of the fleet in the active component also drops. The cost-minimizing proportion in the active force plateaus below 90,000 operational hours at about 16 percent due to a constraint in the model that keeps the proportion of active CA-coded aircraft in the CONUS no less than 50 percent of the entire active CA-coded fleet.
Varying Fleet Size
In the excursions represented in Figure C.2, we hold the operational demand at the two-year average while varying the fleet size. As the fleet size declines, the cost-minimizing proportion in the active component increases.
1 The floor of 543 hours per PMAI is AMC/A3’s estimate of the minimum flying activity needed to “age” co-pilots so as to maintain an appropriate level of experience in the crew force.
Figure C.1Cost-Minimizing Force Mixes with Varying Operational Demands, C-130s
RAND TR1275-C.1
Perc
enta
ge
of
flee
t in
th
e ac
tive
co
mp
on
ent
Fleet size = 291 (286 without Pope wing)
Tota
l an
nu
al c
ost
($
bill
ion
s)
Required fleetwide operational flying hours per year
0
20
40
60
80
100
4.5
4.0
3.5
3.0
2.5
2.0
1.5
1.0
0.5
5.0
050,000 70,000 90,000 110,000 130,000
Ideal mix with Pope wingIdeal mix without Pope wingRecent actual mix with Pope wingRecent actual mix without Pope wing
Minimized cost with Pope wingMinimized cost without Pope wingRecent actual cost with Pope wingRecent actual cost without Pope wing
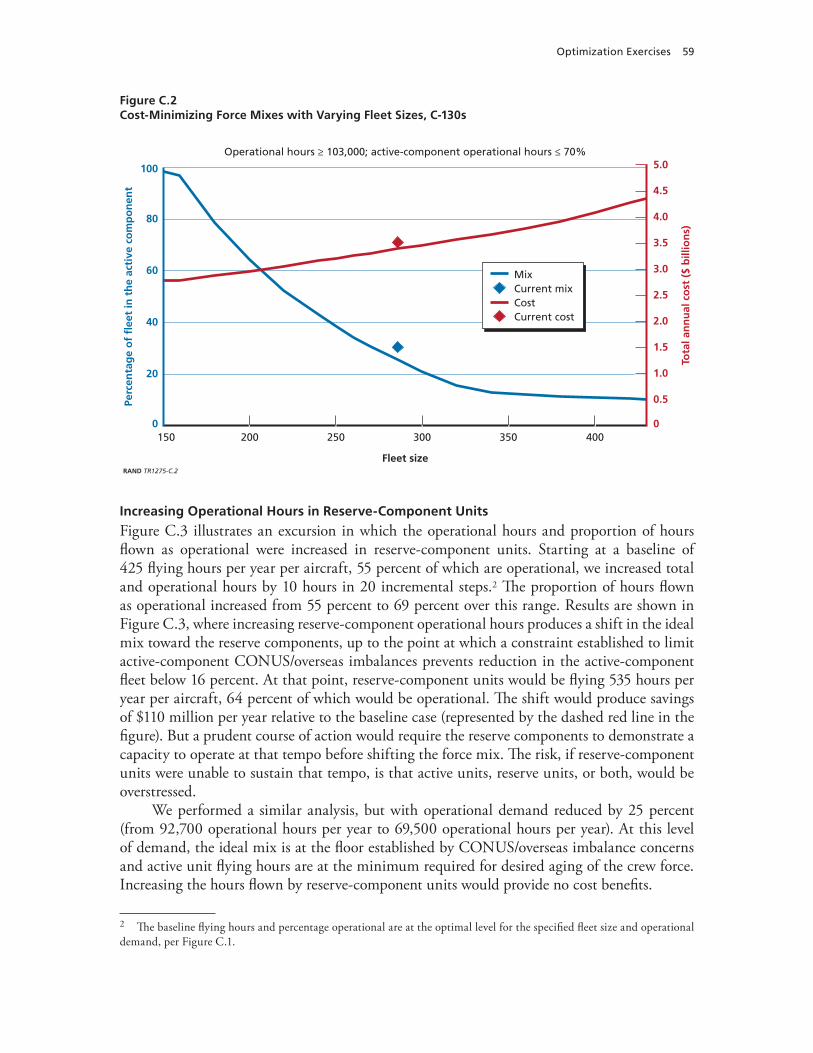
Optimization Exercises 59
Increasing Operational Hours in Reserve-Component Units
Figure C.3 illustrates an excursion in which the operational hours and proportion of hours flown as operational were increased in reserve-component units. Starting at a baseline of 425 flying hours per year per aircraft, 55 percent of which are operational, we increased total and operational hours by 10 hours in 20 incremental steps.2 The proportion of hours flown as operational increased from 55 percent to 69 percent over this range. Results are shown in Figure C.3, where increasing reserve-component operational hours produces a shift in the ideal mix toward the reserve components, up to the point at which a constraint established to limit active-component CONUS/overseas imbalances prevents reduction in the active-component fleet below 16 percent. At that point, reserve-component units would be flying 535 hours per year per aircraft, 64 percent of which would be operational. The shift would produce savings of $110 million per year relative to the baseline case (represented by the dashed red line in the figure). But a prudent course of action would require the reserve components to demonstrate a capacity to operate at that tempo before shifting the force mix. The risk, if reserve-component units were unable to sustain that tempo, is that active units, reserve units, or both, would be overstressed.
We performed a similar analysis, but with operational demand reduced by 25 percent (from 92,700 operational hours per year to 69,500 operational hours per year). At this level of demand, the ideal mix is at the floor established by CONUS/overseas imbalance concerns and active unit flying hours are at the minimum required for desired aging of the crew force. Increasing the hours flown by reserve-component units would provide no cost benefits.
2 The baseline flying hours and percentage operational are at the optimal level for the specified fleet size and operational demand, per Figure C.1.
Figure C.2Cost-Minimizing Force Mixes with Varying Fleet Sizes, C-130s
RAND TR1275-C.2
Perc
enta
ge
of
flee
t in
th
e ac
tive
co
mp
on
ent
Operational hours ≥ 103,000; active-component operational hours ≤ 70%
Tota
l an
nu
al c
ost
($
bill
ion
s)
Fleet size
0
20
40
60
80
100
4.5
4.0
3.5
3.0
2.5
2.0
1.5
1.0
0.5
5.0
0150 200 250 300 350 400
MixCurrent mixCostCurrent cost

60 Costs of Flying Units in Air Force Active and Reserve Components
Fleet Reduction Scenarios
As this report was being prepared, the Air Force was considering a cost-cutting measure that would reduce the size of the C-130 fleet by about 50 aircraft, mostly from the reserve com-ponents, over a period of several years (“10,000 Airmen Will Be Cut,” 2012). The Council of Governors—a group of 10 governors from states with heightened vulnerabilities to natural disasters—argued for retention of 24 of these aircraft in the reserve component (Hoffman, 2012). Given this interest, we developed the excursions shown in Table C.1. These excursions estimate the annual operating costs for fleets with four reduction scenarios—reducing the reserve component by 25 aircraft, reducing the active component by 25 aircraft, reducing both fleets by 25 aircraft, and reducing the reserve component by 50. We examined the effects at a recent level of operational demand (92,700 operational hours) and a 25 percent reduction from that level (69,500 operational hours) using 2012 fleet sizes (95 in active component, 177 in reserve component) as a point of departure.
The results show that cost savings are approximately equivalent regardless of which com-ponent’s aircraft are reduced. At the higher level of demand, the reductions would in some cases require reserve-component units to fly more than the 425 hours per aircraft per year that they have exhibited in recent history. If they were unable to increase their output accordingly, missions could be at risk or stress in active component units would be increased. At the lower level of demand, we limited output to the level of demand by reducing total flying hours and the proportion of hours flown as operational in both active- and reserve-component units.
Figure C.3Increasing Operational Hours in Reserve-Component Units, Five-Year Average Operational Demand, C-130s
RAND TR1275-C.3
Perc
enta
ge
of
flee
t in
th
e ac
tive
co
mp
on
ent
Fleet size = 272; operational hours ≥ 103,000
Tota
l an
nu
al c
ost
($
bill
ion
s)
Reserve-component flying hours per PMAI per year andpercentage of flying hours that are operational
0
20
40
60
80
100
4.5
2.0
1.5
1.0
0.5
5.0
0420 470 520 570 620
55% 60% 65% 69%67%
4.0
3.5
3.0
2.5
MixOptimum mix at specified fleet size and operational hoursCostOptimum cost at specified fleet size and operational hours
Op
timizatio
n Exercises 61
Table C.1C-130 Fleet Size Alternatives
Operational Flying Hours
AC PMAI
RC PMAI
Total PMAI
CONUS AC Flying Hours/ PMAI
RC Flying Hours/ PMAI
CONUS AC % of
Flying Hours Operational
RC % of
Flying Hours Operational
Total Flying Hours
Cost ($ billions)
Base case 92,700 95 177 272 731 425 72 55 149,920 3.31
RC - 25 92,700 95 152 247 842 425 72 55 147,411 3.18
AC -25 92,700 70 177 247 845 520 72 55 153,879 3.18
Both -25 92,700 70 152 222 845 605 72 55 153,879 3.05
RC -50 92,700 95 127 222 845 507 72 55 147,349 3.05
Base case 69,500 95 177 272 540 350 65 50 122,698 3.02
RC - 25 69,500 95 152 247 632 350 65 50 120,679 2.89
AC -25 69,500 70 177 247 779 425 65 50 123,310 2.76
Both -25 69,500 70 152 222 840 400 65 50 122,433 2.76
RC -50 69,500 95 127 222 624 425 65 50 120,858 2.76
NOTES: AC = active component; RC = reserve component. Many cases require reserve-component units to fly more than the 425 hours per year per pMAI observed in our five-year history.
62 Costs of Flying Units in Air Force Active and Reserve Components
KC-135 Excursions
Varying Operational Demand and Fleet Size
In our KC-135 analyses, we varied operational flying hour demand from 30,000 hours to 200,000 hours while holding fleet size at 331 PMAI (the five-year average). We then held oper-ational flying hours constant at 126,900 (the five-year average) while varying the fleet size from 200 to 650. We held the number of active overseas PMAI constant and allowed only CONUS active and reserve PMAI to vary. The model used the operating characteristics of active- and reserve-component wings derived from our five-year history (FYs 2006 through 2010). Active- and reserve-component characteristics were considerably different. Active CONUS wings aver-aged 940 flying hours per PMAI per year, of which 80 percent were operational. Reserve-component wings averaged 420 flying hours per PMAI per year, of which 50 percent were operational. Due to economies of scale effects related to these wide differences in output, the cost per flying hour for CONUS active units is well below that of reserve units throughout the envelopes explored in our excursions. We found at all points in the excursions that costs are minimized with 100 percent of the force in the active component. Each KC-135 assigned to a reserve component rather than the active component adds to the total flying hours needed to accomplish the operational mission, increases operating costs, and ages the fleet faster.
Increasing Operational Hours in Reserve-Component Units
To see whether additional operational hours flown by reserve units would alter the ideal mix, we started with a baseline drawn from the ideal force mix, where reserve units fly 400 hours per year per PMAI, 50 percent of which are operational. We added 20 increments of 10 hours to both operational and total flying hours, which resulted in increasing proportions of hours flown as operational, from 50 percent in the baseline to 66 percent in the 20th increment. We ran this excursion with baseline operational flying hour demand (126,900 hours) and at 75 percent of this demand (95,175 hours). Throughout these envelopes, the ideal mix remained 100 percent in the active component.
Including Reserve Component Units in a Cost-Minimizing Mix
For reserve-component KC-135 units to become part of a cost-minimizing mix within the operating envelopes explored above, they must reduce their underlying cost per flying hour. Cost per flying hour can be lowered by spreading the same number of reserve-component air-craft over fewer wings. Reorganizing into two-squadron, 16-aircraft wings rather than single-squadron, eight-aircraft wings, combined with increasing the reserve components’ proportion of hours flown as operational and a 25 percent reduction in operational demand, as examined in the excursion described in the previous paragraph, would result in cost-minimizing mixes with 35 to 65 percent of the fleet in the active component. At the five-year average demand level, reserve units would enter the cost-minimizing mix only if they could raise the proportion of their hours flown as operational from the five-year average of 50 percent to roughly match the 80 percent rate observed in active-component CONUS units.

Optimization Exercises 63
F-16 Excursions
Varying Operational Demand
As in our analyses of the other fleets, we allowed counts of CONUS active and reserve wings to vary. We constrained CONUS proportion of the active-component fleet to be no less than 30 percent of the total active-component fleet. As depicted in Figure C.4, with this constraint, the active-component proportion of the force mix can be no less than 41 percent of a 660-PMAI total force fleet. Above this floor, as in the C-130 fleet, reductions in operational demand shift the ideal mix toward the reserve component.
Varying Fleet Size
In Figure C.5, we hold operational flying hours constant at the five-year average of 56,600 and hold tasked aircraft days to a minimum of the 27,600 observed in the five-year history. The fleet size is varied from 500 to 800. Below a fleet size of 600, the five-year average operational demand cannot be met with operating characteristics observed during the five years. Above that level, as with the C-130 fleet, the cost-minimizing proportion in the active component increases as fleet size decreases.
Increasing Operational Hours in Reserve-Component Units
Figures C.6 and C.7 illustrate excursions in which we increased the operational hours and proportion of hours flown as operational in reserve-component units. Starting at a baseline of 200 flying hours per year per aircraft, 50 percent of which are operational, we increased total and operational hours by 5 hours in 20 incremental steps. The proportion of hours flown as
Figure C.4Cost-Minimizing Force Mixes with Varying Operational Demand, F-16s
RAND TR1275-C.4
Perc
enta
ge
of
flee
t in
th
e ac
tive
co
mp
on
ent
Fleet size = 660; tasked days ≥ 27,600
Tota
l an
nu
al c
ost
($
bill
ion
s)
Required fleetwide operational flying hours per year
0
20
40
60
80
100
5.0
4.0
3.0
2.0
1.0
6.0
040,000 45,000 50,000 55,000 60,000
Ideal mixRecent mixMinimized costRecent cost

64 Costs of Flying Units in Air Force Active and Reserve Components
Figure C.5Cost-Minimizing Force Mixes with Varying Fleet Sizes, F-16s
RAND TR1275-C.5
Perc
enta
ge
of
flee
t in
th
e ac
tive
co
mp
on
ent
Operational hours = 56,600; tasked days ≥ 27,600
Tota
l an
nu
al c
ost
($
bill
ion
s)
Fleet size
0
20
40
60
80
100
5.0
4.0
3.0
2.0
1.0
6.0
0500 550 600 650 700 750 800
Ideal mixRecent mixMinimized costRecent cost
Figure C.6Increasing Operational Hours in Reserve-Component Units, Five-Year Average Operational Demand, F-16s
RAND TR1275-C.6
Perc
enta
ge
of
flee
t in
th
e ac
tive
co
mp
on
ent
Fleet size = 660; operational hours ≥ 56,600; tasked days ≥ 27,600
Tota
l an
nu
al c
ost
($
bill
ion
s)
0
20
40
60
80
100
5.0
4.0
3.0
2.0
1.0
6.0
0200 210 220 230 240 290 300280270260
25% 32% 38% 49%46%42%
250
MixOptimum mix at specified fleet size and operational hoursCostOptimum cost at specified fleet size and operational hours
Reserve-component flying hours per PMAI per year andpercentage of flying hours that are operational
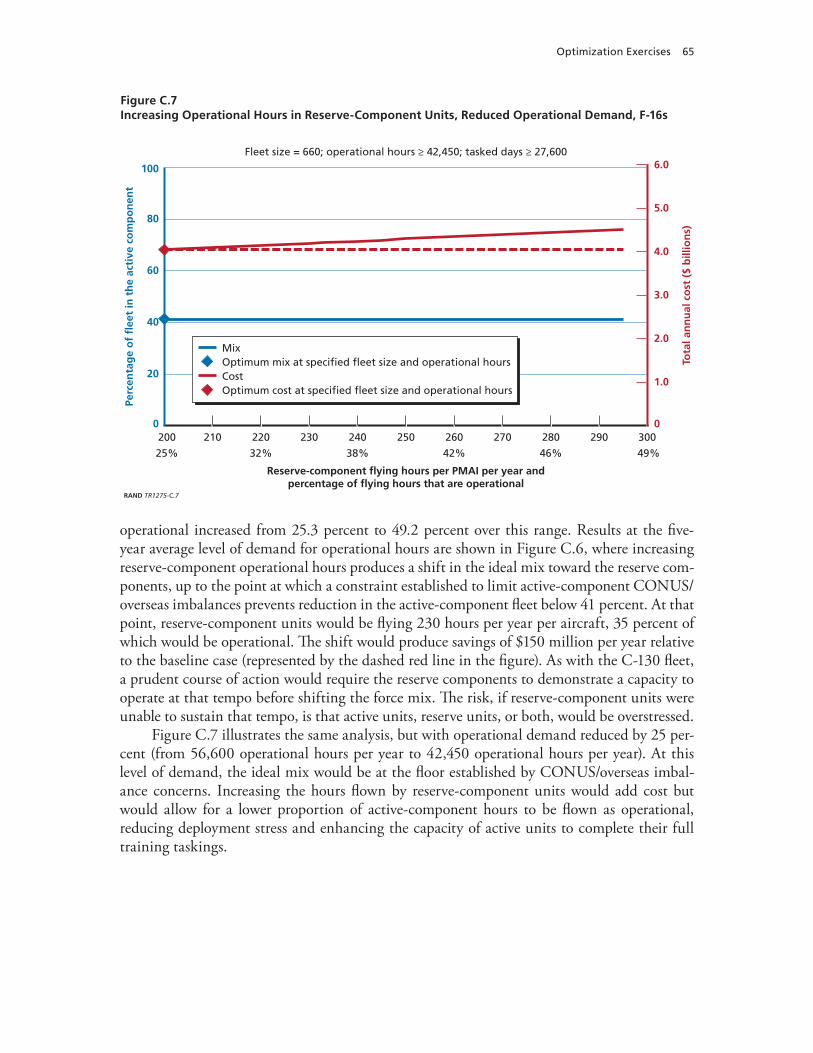
Optimization Exercises 65
operational increased from 25.3 percent to 49.2 percent over this range. Results at the five-year average level of demand for operational hours are shown in Figure C.6, where increasing reserve-component operational hours produces a shift in the ideal mix toward the reserve com-ponents, up to the point at which a constraint established to limit active-component CONUS/overseas imbalances prevents reduction in the active-component fleet below 41 percent. At that point, reserve-component units would be flying 230 hours per year per aircraft, 35 percent of which would be operational. The shift would produce savings of $150 million per year relative to the baseline case (represented by the dashed red line in the figure). As with the C-130 fleet, a prudent course of action would require the reserve components to demonstrate a capacity to operate at that tempo before shifting the force mix. The risk, if reserve-component units were unable to sustain that tempo, is that active units, reserve units, or both, would be overstressed.
Figure C.7 illustrates the same analysis, but with operational demand reduced by 25 per-cent (from 56,600 operational hours per year to 42,450 operational hours per year). At this level of demand, the ideal mix would be at the floor established by CONUS/overseas imbal-ance concerns. Increasing the hours flown by reserve-component units would add cost but would allow for a lower proportion of active-component hours to be flown as operational, reducing deployment stress and enhancing the capacity of active units to complete their full training taskings.
Figure C.7Increasing Operational Hours in Reserve-Component Units, Reduced Operational Demand, F-16s
RAND TR1275-C.7
Perc
enta
ge
of
flee
t in
th
e ac
tive
co
mp
on
ent
Fleet size = 660; operational hours ≥ 42,450; tasked days ≥ 27,600
Tota
l an
nu
al c
ost
($
bill
ion
s)
Reserve-component flying hours per PMAI per year andpercentage of flying hours that are operational
0
20
40
60
80
100
5.0
4.0
3.0
2.0
1.0
6.0
0200 210 220 230 240 290 300280270260
25% 32% 38% 49%46%42%
250
MixOptimum mix at specified fleet size and operational hoursCostOptimum cost at specified fleet size and operational hours


67
References
“10,000 Airmen Will Be Cut,” Air Force Times, February 13, 2012, pp. 24–25.
Air Force Instruction (AFI) 11-102, Flying Hour Program Management, Washington, D.C., August 30, 2011. As of May 17, 2012: http://www.e-publishing.af.mil/shared/media/epubs/AFI11-102.pdf
Air Force Instruction (AFI) 65-503, Financial Management: US Air Force Cost and Planning Factors, Washington, D.C., February 3, 1994.
Air Force Reserve Command (AFRC), Total Force 21, Part II, Developing a 21st Century Approach for Military Force Structure Planning, Washington, D.C., March 1, 2011. As of May 17, 2012: http://www.afrc.af.mil/shared/media/document/AFD-110510-025.pdf
Buck, Jennifer C., “The Cost of the Reserves,” in John D. Winkler and Barbara A. Bicksler, eds., The New Guard and Reserve, San Ramon, Calif.: Falcon Books, 2008, pp. 175–186.
Chairman of the Joint Chiefs of Staff Instruction (CJCSI) 4410.01F, Standardized Terminology for Aircraft Inventory Management, Washington, D.C., May 10, 2011. As of May 17, 2012: http://www.dtic.mil/cjcs_directives/cdata/unlimit/4410_01.pdf
Hoffman, Michael, “Air Force Offers C-130s to Placate Air Guard,” Military.com News, April 25, 2012. As of May 17, 2012: http://www.military.com/news/article/air-force-offers-c130s-to-placate-air-guard.html
Klerman, Jacob A., Rethinking the Reserves, Santa Monica, Calif.: RAND Corporation, MG-757-OSD, 2008. As of May 17, 2012: http://www.rand.org/pubs/monographs/MG757.html
Office of the Assistant Secretary of the Air Force for Financial Management (SAF/FM), Air Force Total Ownership Cost (AFTOC) system, online, accessed various dates, 2011, not available to the general public.
Office of the Under Secretary of Defense (OSD) (Comptroller), National Defense Budget Estimates for FY 2011, Washington, D.C., March 2010. As of May 17, 2012: http://comptroller.defense.gov/defbudget/fy2011/FY11_Green_Book.pdf
Robbert, Albert A., William A. Williams, and Cynthia R. Cook, Principles for Determining the Air Force Active/Reserve Mix, Santa Monica, Calif.: RAND Corporation, MR-1091-AF, 1999. As of May 17, 2012: http://www.rand.org/pubs/monograph_reports/MR1091.html
U.S. Air Force, “Air Force Total Ownership Cost (AFTOC),” entry page to password-protected AFTOC website, last updated March 9, 2011. As of May 18, 2012: https://aftoc.hill.af.mil/
———, “About Appropriations Data Products,” PDF file available within password-protected website, no date. As of June 4, 2012: https://aftoc2.hill.af.mil/sites/aftoc/Product%20Information/About%20Appropriations%20Data%20Products
U.S. Department of Defense (DoD), Office of the Vice Chairman of the Joint Chiefs of Staff and Office of the Assistant Secretary of Defense for Reserve Affairs, Comprehensive Review of the Future Role of the Reserve Component, Volume I, Executive Summary and Main Report, Washington, D.C., May 17, 2011. As of April 5, 2012: http://ra.defense.gov/documents/publications/Comprehensive%20Reserve%20Review%20%285Apr11%29%20Ver26h%20-%20Final.pdf

OBJECTIVE ANALYSIS.EFFECTIVE SOLUT IONS.
C O R P O R A T I O N
RAND publications are available at www.rand.org
$34.95
TR-1275-AF
This product is part of the RAND Corporation technical report series. RAND technical reports are used to communicate research findings and policy recommendations on a specific topic for a targeted audience. All RAND reports undergo rigorous peer review to ensure high standards for research quality and objectivity.
R
HEADQUARTERS CAMPUS 1776 MAIN STREET, P.O. BOX 2138 SANTA MONICA, CA 90407-2138
OFFICESSANTA MONICA, CAWASHINGTON, DCPITTSBURGH, PANEW ORLEANS, LAJACKSON, MSBOSTON, MA
DOHA, QA
CAMBRIDGE, UKBRUSSELS, BE
www.rand.org