Support RAND For More Information€¦ · Management Trends and Costs for Aircraft and ......
199
This document and trademark(s) contained herein are protected by law as indicated in a notice appearing later in this work. This electronic representation of RAND intellectual property is provided for non- commercial use only. Permission is required from RAND to reproduce, or reuse in another form, any of our research documents. Limited Electronic Distribution Rights Visit RAND at www.rand.org Explore RAND Project AIR FORCE View document details For More Information This PDF document was made available from www.rand.org as a public service of the RAND Corporation. 6 Jump down to document THE ARTS CHILD POLICY CIVIL JUSTICE EDUCATION ENERGY AND ENVIRONMENT HEALTH AND HEALTH CARE INTERNATIONAL AFFAIRS NATIONAL SECURITY POPULATION AND AGING PUBLIC SAFETY SCIENCE AND TECHNOLOGY SUBSTANCE ABUSE TERRORISM AND HOMELAND SECURITY TRANSPORTATION AND INFRASTRUCTURE WORKFORCE AND WORKPLACE The RAND Corporation is a nonprofit research organization providing objective analysis and effective solutions that address the challenges facing the public and private sectors around the world. Purchase this document Browse Books & Publications Make a charitable contribution Support RAND
Transcript of Support RAND For More Information€¦ · Management Trends and Costs for Aircraft and ......

This document and trademark(s) contained herein are protected by law as indicated in a notice appearing later in this work. This electronic representation of RAND intellectual property is provided for non-commercial use only. Permission is required from RAND to reproduce, or reuse in another form, any of our research documents.
Limited Electronic Distribution Rights
Visit RAND at www.rand.org
Explore RAND Project AIR FORCE
View document details
For More Information
This PDF document was made available
from www.rand.org as a public service of
the RAND Corporation.
6Jump down to document
THE ARTS
CHILD POLICY
CIVIL JUSTICE
EDUCATION
ENERGY AND ENVIRONMENT
HEALTH AND HEALTH CARE
INTERNATIONAL AFFAIRS
NATIONAL SECURITY
POPULATION AND AGING
PUBLIC SAFETY
SCIENCE AND TECHNOLOGY
SUBSTANCE ABUSE
TERRORISM AND HOMELAND SECURITY
TRANSPORTATION ANDINFRASTRUCTURE
WORKFORCE AND WORKPLACE
The RAND Corporation is a nonprofit research organization providing objective analysis and effective solutions that address the challenges facing the public and private sectors around the world.
Purchase this document
Browse Books & Publications
Make a charitable contribution
Support RAND

This product is part of the RAND Corporation reprint series. RAND
reprints reproduce previously published journal articles and book
chapters with the permission of the publisher. RAND reprints have
been formally reviewed in accordance with the publisher’s editorial
policy.

David E. Stem, Michael Boito, Obaid Younossi
Prepared for the United States Air ForceApproved for public release; distribution unlimited
Systems Engineering and Program ManagementTrends and Costs for Aircraft and Guided Weapons Programs

The RAND Corporation is a nonprofit research organization providing objective analysis and effective solutions that address the challenges facing the public and private sectors around the world. RAND’s publications do not necessarily reflect the opinions of its research clients and sponsors.
R® is a registered trademark.
© Copyright 2006 RAND Corporation
All rights reserved. No part of this book may be reproduced in any form by any electronic or mechanical means (including photocopying, recording, or information storage and retrieval) without permission in writing from RAND.
Published 2006 by the RAND Corporation1776 Main Street, P.O. Box 2138, Santa Monica, CA 90407-2138
1200 South Hayes Street, Arlington, VA 22202-50504570 Fifth Avenue, Suite 600, Pittsburgh, PA 15213
RAND URL: http://www.rand.org/To order RAND documents or to obtain additional information, contact
Distribution Services: Telephone: (310) 451-7002; Fax: (310) 451-6915; Email: [email protected]
Library of Congress Cataloging-in-Publication Data
Stem, David E. Systems engineering and program management trends and costs for aircraft and
guided weapons programs / David E. Stem, Michael Boito, Obaid Younossi. p. cm. Includes bibliographical references. “MG-413.” ISBN 0-8330-3872-9 (pbk. : alk. paper) 1. United States. Air Force—Procurement—Costs. 2. Airplanes, Military—
United States—Costs. 3. Guided missiles—United States—Costs. I. Boito, Michael, 1957– II. Younossi, Obaid. III. Title.
UG1123.S75 2006358.4'162120973—dc22
2005030589
U.S. Air Force photo by Kevin Robertson
The research reported here was sponsored by the United States Air Force under Contract F49642-01-C-0003. Further information may be obtained from the Strategic Planning Division, Directorate of Plans, Hq USAF.

iii
Preface
Although systems engineering and program management (SE/PM)have long been part of aircraft and weapons systems development andproduction costs, there has not been a comprehensive, focused studythat has addressed the issue of developing cost estimates for SE/PM.This report specifically focuses on techniques that can be used to es-timate SE/PM costs. It also describes various functions within SE/PMand investigates possible cost drivers of SE/PM.
Through extensive interviews with government and industrypersonnel, a literature search of past studies regarding SE/PM costanalysis, and analysis of actual SE/PM data, the authors characterizetrends in SE/PM costs and general estimating methodologies. Thisstudy should be of interest to government and industry cost analysts,the military aircraft and weapon acquisition community, and othersconcerned with current and future acquisition policies.
Because of its proprietary nature, the cost information for therelevant programs is provided in a supplementary RAND Corpora-tion report (TR-311-AF), which is not available to the general public.Inquiries regarding the supplement should be directed to the Officeof the Technical Director, Air Force Cost Analysis Agency at (703)604-0387.
This report is one of a series of reports from a RAND ProjectAIR FORCE study entitled “The Cost of Future Military Aircraft:Historical Cost-Estimating Relationships and Cost-Reduction Initia-tives.” The purpose of the study is to improve the cost-estimatingtools used to project the cost of future weapon systems and to investi-

iv SE/PM: Trends and Costs for Aircraft and Guided Weapons Programs
gate the effects of recent management initiatives and governmentpolicies on cost. The study is being conducted within the RANDProject AIR FORCE Resource Management Program. The researchis sponsored by the Principal Deputy, Office of the Assistant Secre-tary of the Air Force (Acquisition), and by the Office of the TechnicalDirector, Air Force Cost Analysis Agency.
Other RAND Project AIR FORCE reports that address militaryaircraft cost estimating issues are the following:
• Military Airframe Acquisition Costs: The Effects of Lean Manufac-turing, Cynthia R. Cook and John C. Graser (MR-1325-AF,2001). This report examines the package of new tools and tech-niques known as “lean production” to determine if it would en-able aircraft manufacturers to produce new weapons systems atcosts below those predicted by historical cost estimating models.
• An Overview of Acquisition Reform Cost Savings Estimates, MarkA. Lorell, John C. Graser (MR-1329-AF, 2001). In this report,the authors examine relevant literature and conducted interviewsto determine whether estimates on the efficacy of acquisition re-form measures are sufficiently robust to be of predictive value.
• Military Airframe Costs: The Effects of Advanced Materials andManufacturing Processes, Obaid Younossi, Michael Kennedy,John C. Graser (MR-1370-AF, 2001). This report examines theeffect of the use of advanced materials, such as composites andtitanium, on military aircraft costs. The report provides cost es-timators with useful factors for adjusting and creating estimatesbased on parametric cost-estimating methods.
• Military Jet Engine Acquisition: Technology Basics and Cost-Estimating Methodology, Obaid Younossi, Mark V. Arena, Rich-ard M. Moore, Mark A. Lorell, Joanna Mason, John C. Graser(MR-1596-AF, 2002). This report updates earlier studies in thearea of propulsion cost analysis, discusses recent engine tech-nologies, and provides methods and techniques that can be usedto estimate the costs of future engine programs.
• Test and Evaluation Trends and Costs for Aircraft and GuidedWeapons, Bernard Fox, Michael Boito, John C. Graser, Obaid

Preface v
Younossi (MG-109-AF, 2004). This report examines the effectsof changes in the test and evaluation (T&E) process used toevaluate military aircraft and air-launched guided weapons dur-ing their development programs. It also provides relationshipsfor developing estimates of T&E costs for future programs.
• Software Cost Estimation and Sizing Methods: Issues and Guide-lines, Shari Lawrence Pfleeger, Felicia Wu, Rosalind Lewis (MG-269-AF, 2005). This report recommends an approach to im-prove the utility of software cost estimates by exposing uncer-tainty and reducing risks associated with developing software es-timates.
• Lessons Learned from the F/A-22 and F/A-18E/F DevelopmentPrograms, Obaid Younossi, David E. Stem, Mark A. Lorell,Frances M. Lussier (MG-276-AF, 2005). This reports evaluatesthe history of the F/A-22 and F/A-18 E/F programs to under-stand how costs and schedules changed during their develop-ment. The study derives lessons that the Air Force and otherservices can use to improve acquisition.
RAND Project AIR FORCE
RAND Project AIR FORCE (PAF), a division of the RAND Corpo-ration, is the U.S. Air Force’s federally funded research and develop-ment center for studies and analyses. PAF provides the Air Force withindependent analyses of policy alternatives affecting the development,employment, combat readiness, and support of current and futureaerospace forces. Research is performed in four programs: AerospaceForce Development; Manpower, Personnel, and Training; ResourceManagement; and Strategy and Doctrine.
Additional information about PAF is available on our Web siteat http://www.rand.org/paf.


vii
Contents
Preface ...................................................................... iiiFigures ...................................................................... xiTables.......................................................................xvSummary.................................................................. xviiAcknowledgments .........................................................xxvAcronyms and Abbreviations............................................ xxvii
CHAPTER ONE
Introduction .................................................................1Study Background and Purpose .............................................1Comparison with Previous Work in This Area ..............................4Study Methods and Approach ...............................................5Limitations of the Study ................................................... 11Organization of This Report............................................... 11
CHAPTER TWO
Defining Systems Engineering and Program Management .............. 13Systems Engineering Definition ........................................... 13The Systems Engineering Process.......................................... 16
Process Input............................................................ 16Process Output.......................................................... 18System Analysis and Control ........................................... 19
Program Management Definition ......................................... 20Tasks Specific to Contractor Program Management ...................... 21Tools Used in Systems Engineering and Program Management .......... 23

viii SE/PM: Trends and Costs for Aircraft and Guided Weapons Programs
Planning Tools.......................................................... 23Controlling Tools....................................................... 25Product-Improvement Tools ........................................... 27
CHAPTER THREE
Cost Trends in Systems Engineering and Program Management ....... 29SE/PM Development Cost Trends ........................................ 29SE/PM Production Cost Trends........................................... 36Acquisition Initiatives That May Affect Future SE/PM Costs ............ 38
Military Specification Reform .......................................... 41Integrated Product Teams .............................................. 45Evolutionary Acquisition ............................................... 48
Summary................................................................... 50
CHAPTER FOUR
Cost Data Findings and Current Estimating Approaches................ 51Cost and Schedule Data Sources........................................... 51Cost Data Findings ........................................................ 53
MIL-HDBK-881 Definition of SE/PM ................................ 53Definitions Across Multiple Contractors ............................... 54Definition of SE/PM Within a Single Company....................... 57
Government Approaches to Estimating SE/PM Costs .................... 59Estimating Approaches Used by Industry: General Methods ............. 62Estimating Approaches Used by Industry: Development Programs....... 63Estimating Approaches Used by Industry: Production Programs ......... 66Summary................................................................... 66
CHAPTER FIVE
Analytic Approach for Estimating SE/PM Costs......................... 69Analysis of Potential Cost Drivers ......................................... 70Aircraft Development SE/PM Cost-Estimating Analysis.................. 76
Aircraft Development SE/PM Cost-Estimating Parameters............ 77Aircraft Development SE/PM Cost-Estimating Relationships ......... 79
Aircraft Production SE/PM Cost-Estimating Analysis .................... 83Aircraft Production SE/PM Cost-Estimating Parameters .............. 83Aircraft Production SE/PM Cost-Estimating Relationships............ 88

Contents ix
Guided Weapons Development SE/PM Cost-Estimating Analysis ....... 99Guided Weapons Development SE/PM Cost-Estimating
Parameters ........................................................... 99Guided Weapons Development SE/PM Cost-Estimating
Relationships........................................................101Guided Weapons Production SE/PM Cost-Estimating Analysis.........103
Guided Weapons Production SE/PM Cost-Estimating Parameters...104Guided Weapons Production SE/PM Cost-Estimating
Relationships........................................................105Summary of Aircraft and Guided Weapons SE/PM Cost-Estimating
Relationships ........................................................110
CHAPTER SIX
How New Acquisition Practices Will Affect SE/PM Cost Estimates...113Reduction in Military Specifications and Military Standards ............114Use of Integrated Product Teams.........................................116Use of Evolutionary Acquisition..........................................118Summary..................................................................122
CHAPTER SEVEN
Conclusions...............................................................123SE/PM Cost Trends ......................................................123SE/PM Definitions and Current Cost-Estimating Approaches ..........124New SE/PM Cost-Estimating Approaches ...............................125New Acquisition Practices Have Mixed Effects on SE/PM Costs ........126
APPENDIX
A. Relationship of Systems Engineering to the Acquisition Life-CycleProcess................................................................131
B. MIL-HDBK-881 Excerpt: Definitions of SE/PM for CostReporting.............................................................137
C. Contractor Questionnaire ........................................... .141D. Variables Used in Developing CERs .................................145E. Statistical Correlations for SE/PM CER Variables...................149
x SE/PM: Trends and Costs for Aircraft and Guided Weapons Programs
F. Techniques for Developing Expenditure Profiles for SE/PMDevelopment Costs...................................................155
Bibliography ..............................................................161

xi
Figures
2.1. The Systems Engineering Process................................. 162.2. Management Tools for Answering System Analysis and
Control Questions ................................................ 192.3. Program Review and Audit Process............................... 263.1. Trend in Aircraft SE/PM Costs for All Aircraft Development
Programs, 1960s–1990s........................................... 303.2. Aircraft SE/PM Costs as a Percentage of Total Development
Cost for All Development Programs, 1960–1990s ............... 313.3. Trend in Aircraft SE/PM Costs Minus Outlier Development
Programs, 1960–1990s ........................................... 323.4. Aircraft SE/PM as a Percentage of Total Aircraft Development
Cost Minus Outlier Development Programs, 1960s–1990s ..... 333.5. Trend in Guided-Weapons SE/PM Costs for All Guided
Weapons Development Programs, 1960s–1990s................. 343.6. Guided Weapons SE/PM as a Percentage of Development
Cost for All Guided Weapons Programs, 1960s–1990s .......... 353.7. Trend in Guided Weapons SE/PM Costs for FSD/EMD
Development Programs, 1960s–1990s............................ 363.8. Guided Weapons SE/PM as a Percentage of Development
Cost for FSD/EMD Development Programs, 1960s–1990s ..... 373.9. Average SE/PM Cost Split for Aircraft and Guided Weapons
Development Programs ........................................... 383.10. Aircraft SE/PM as a Percentage of Air Vehicle Cost for
Successive Production Programs.................................. 39

xii SE/PM: Trends and Costs for Aircraft and Guided Weapons Programs
3.11. Guided Weapons SE/PM as a Percentage of ProductionCost for Successive Production Lots .............................. 40
3.12. Framework for DoD’s IPPD Operational Structure.............. 473.13. Evolutionary Acquisition Model.................................. 494.1. Detailed SE/PM Cost Breakout for a Sample Program........... 604.2. Variations on SE/PM Cost Estimating as a Constant
Percentage of the Design Effort................................... 644.3. SE/PM and Technical Support as a Percentage of Engineering
Design Hours Versus Actual Design Hours ...................... 655.1. SE/PM Expenditure Profile over Time: Large Upfront SE/PM
Effort .............................................................. 725.2. SE/PM Expenditure Profile over Time: Program Expenditures
Closely Following Timing of Expenditures over the EntireProgram ........................................................... 73
5.3. Actual Versus Predicted SE/PM Costs for AircraftDevelopment Programs (FY03 $)................................. 82
5.4. Production SE/PM Costs per Fighter Aircraft with SeriesChange............................................................ 85
5.5. Production SE/PM Costs per Fighter Aircraft with ForeignMilitary Sales...................................................... 86
5.6. Actual Versus Predicted SE/PM Costs for Aircraft ProductionPrograms (FY03 $ per aircraft): CER 1........................... 91
5.7. Actual Versus Predicted SE/PM Costs for Aircraft ProductionPrograms (FY03 $ per aircraft): CER 2........................... 93
5.8. SE/PM Percentage of Air Vehicle Cost Versus Rate Ratio ....... 945.9. Actual Versus Predicted SE/PM Costs for Aircraft Production
Programs (FY03 $ per aircraft): CER 3........................... 965.10. Actual Versus Predicted SE/PM Costs for Aircraft Production
Programs (FY03 $ per aircraft): CER 4........................... 975.11. SE/PM Cost Improvement Slopes on Aircraft Production
Programs .......................................................... 985.12. Actual Versus Predicted SE/PM Costs for Guided Weapons
Development Programs (FY03 $)................................1035.13. Actual Versus Predicted SE/PM Costs for Guided Weapons
Production Programs (FY03 $ unit cost): CER 1 ...............108

Figures xiii
5.14. Actual Versus Predicted SE/PM Costs for Guided WeaponsProduction Programs (FY03 $ unit cost): CER 2 ...............109
5.15. SE/PM Cost Improvement Slopes in Guided WeaponsProduction Programs ............................................111
6.1. Guided Weapons Development SE/PM Costs for Comparisonwith Programs with Fewer MILSPEC and MILSTDRestrictions.......................................................115
6.2. Aircraft Development SE/PM Cost Percentages forComparison with Programs Using IPTs.........................117
6.3. Overlapping Program Development Schedules of the ThreeJSOW Variants ..................................................121
A.1. Acquisition Life Cycle and Its Links to the SystemsEngineering Process..............................................132
F.1. SE/PM Cost Spreads for Four Fighter Aircraft DevelopmentPrograms, Normalized Durations................................158
F.2. SE/PM Cost Spreads for One Guided WeaponsDevelopment Program, Normalized Duration ..................160


xv
Tables
1.1. Generic Aircraft System Work Breakdown Structure ..............21.2. Aircraft Development Programs, Program Phases, and Sources
of Cost Data ........................................................71.3. Aircraft Production Programs, Years of Programs, and Sources
of Cost Data ........................................................81.4. Guided Weapons Development Programs, Program Phases,
and Sources of Cost Data ...........................................81.5. Guided Weapons Production Programs, Years of Programs,
and Sources of Cost Data ......................................... 104.1. Comparison of Contractors’ Systems Engineering and
Program Management Subtasks .................................. 554.2. Single Contractor’s SE/PM Subtasks Across Programs ........... 584.3. Contractors’ SE/PM Estimating Approaches ..................... 625.1. Summary of Contractors’ Responses Regarding SE/PM Cost
Drivers ............................................................ 705.2. Cost Drivers and Parameters Used for Aircraft Development
Analysis ........................................................... 775.3. Parameter Analysis Results for Aircraft Development
Programs .......................................................... 805.4. Cost Drivers and Parameters Used for Aircraft Production
Analysis ........................................................... 875.5. Aircraft Production Program Parameters and Reasons for
Their Exclusion from the CER ................................... 895.6. Cost Drivers and Parameters Used for Guided Weapons
Development Analysis ............................................ 99

xvi SE/PM: Trends and Costs for Aircraft and Guided Weapons Programs
5.7. Summary of Weapons Program Physical Parameters............1005.8. Parameter Analysis Results for Guided Weapons
Development Programs ..........................................1015.9. Variables Used for Guided Weapons Production Analysis ......104
5.10. Parameter Analysis Results for Guided Weapons ProductionPrograms .........................................................106
7.1. Cost-Estimating Methods and Their Advantages andDisadvantages ....................................................127
D.1. Aircraft Variables.................................................145D.2. Guided Weapons Variables ......................................147E.1. Correlation Matrix: Aircraft Development ......................150E.2. Correlation Matrix: Aircraft Production.........................151E.3. Correlation Matrix: Guided Weapons Development............152E.4. Correlation Matrix: Guided Weapons Production ..............153F.1. Time to Development Milestones ...............................156F.2. Weibull Parameters for Modeling SE/PM Development
Expenditures .....................................................158F.3. Cumulative SE/PM Expenditures by Development
Milestone.........................................................159

xvii
Summary
Background
Sound cost estimates are essential to developing good budgets andpolicy decisions. Some recent RAND studies have looked at estimat-ing techniques for the nonrecurring and recurring flyaway costs ofmilitary airframes and engines. This study extends the analysis intowhat are termed “below-the-line” costs.1 Below-the-line costs includecosts for such items as system test and evaluation, data, special testequipment and tooling, training, operational site activation, indus-trial facilities, initial spares and repair parts, and systems engineeringand program management. These costs are not directly associatedwith the development or the production of the hardware end item.Nevertheless, they are important cost elements that are necessary fordelivery of the complete end item to the government.
RAND began the investigation of below-the-line costs with astudy of systems test and evaluation costs (Fox et al., 2004). As afollow-on to that earlier study, this study investigates cost-estimatingtechniques that can be used to estimate Systems Engineering and____________1 Cost estimates for the Department of Defense are usually structured around the product-centric work breakdown structure described in Military Handbook 881 (Mil-HDBK-881).The handbook provides a framework for categorizing program costs starting with the hard-ware and software costs directly associated with the end item and adding the below the linecosts. Below the line costs derive their name from the fact that they are typically displayed inbudget documents and cost estimates as separate cost elements below the hardware costelements.

xviii SE/PM: Trends and Costs for Aircraft and Guided Weapons Programs
Program Management (SE/PM) costs for military aircraft and weap-ons systems in development and production.
Analysis Approach
Our approach to analyzing SE/PM costs was to first understand thenature of the content of the work that is performed in this area. Wedefine what is involved in the systems engineering and program man-agement disciplines from a general sense of what SE/PM is and de-scribe the iterative process and tools (such as reviews and documentsthat are developed for a program) that are used in the field. The defi-nition and processes provide a basis for understanding what makes upthe scope of the SE/PM effort.
Our next step was to canvas government and industry personnelto learn about the current state of techniques used for estimatingSE/PM and to gather data that could be used to investigate variousaspects of SE/PM costs. We used a questionnaire, presented in Ap-pendix C, and interviews with both government and contractor per-sonnel to find out how they define SE/PM costs, what techniquesthey currently use to estimate SE/PM costs, and what they wouldconsider potential cost drivers that could be used for predicting costs.To develop SE/PM cost estimating methods, we collected historicaldata from several aircraft and missile development and productionprograms. The data included historical costs, the schedule of majorevents in the program, and technical information from several aircraftand missile programs. Cost data were collected from a variety of gov-ernment cost reports and internal contractor accounting reports onprograms from the 1960s to today. These data were used to investi-gate trends in SE/PM costs over time and to generate cost estimatingmethodologies that cost analysts could use when little program in-formation is available early in the lifecycle of a program.
Our last step was to investigate the effects of new acquisition ini-tiatives on SE/PM costs. The three new acquisition initiatives we in-vestigated were the removal of military specifications and standards,the use of integrated product and process teams, and the relatively

Summary xix
new preferred acquisition approach of evolutionary acquisition. Eachof these initiatives could affect SE/PM costs. We tried to determinewhether the SE/PM costs for these types of programs were differentenough from the SE/PM costs for traditional acquisition programsthat some adjustment in cost estimating should be made.
Definitions and Methods
One of the complications in developing SE/PM estimates is deter-mining what is included in SE/PM costs. We found that the defini-tion used by the government, as spelled out in (MIL-HDBK-881)and excerpted in Appendix B of this report, covers tasks associatedwith the “overall planning, directing, and controlling of the defini-tion, development, and production of a system . . . [but] excludes sys-tems engineering and program management effort that can be associ-ated specifically with the equipment (hardware/software) element.”The exclusionary portion of the definition is difficult to implementbecause the systems engineering associated with a program is integralto the development of the hardware and software of the system.
When recording SE/PM costs that are incurred, contractors’ ac-counting systems may not consistently address this exclusion in theSE/PM definition. After we interviewed multiple contractors and in-vestigated their detailed internal accounting data, we found theircosts under the SE/PM category were not always consistent (see page54). Some of this difference across contractors was anticipated due tovariations in accounting methods. We further found that even withina single company there were differences from one program to anotheras to what was classified as SE/PM costs (see page 57). Although thesedifferences exist, based on an examination of detailed cost data, webelieve that the main cost sub-elements that represent a large portionof the SE/PM costs are classified consistently across contractors andprograms (see page 57).
Our discussions with government personnel and contractors re-vealed a variety of techniques for estimating SE/PM costs. In general,for aircraft programs that are early in their acquisition lifecycle, the

xx SE/PM: Trends and Costs for Aircraft and Guided Weapons Programs
government estimates SE/PM using a parametric approach applied atan aggregate level that includes not only the costs of SE/PM, but alsoincludes the costs associated with hardware design. The parametricapproaches rely on independent parameters that relate to the overalldesign of a system (i.e., weight, speed, first flight). This approach isconsistent with the task of the government cost estimator—to gener-ate a budget estimate that includes all expected costs, regardless ofhow they are classified. However, this high level of estimating doesnot allow for understanding the cost drivers specifically associatedwith SE/PM and how SE/PM costs are expended through a multiyeardevelopment program. This approach also makes it difficult to isolateSE/PM costs for any potential adjustments due to acquisition changesthat may have a cost impact. The industry contacts we interviewedused a variety of techniques for developing SE/PM estimates, rangingfrom “top-down” models to “bottom-up” approaches. The type ofmodel they use generally depends on the desired level of fidelity andlevel of detail of the estimate and on the maturity of the program.Top-down models typically use parametric approaches similar tothose the government uses when little detailed information is knownabout a program. Bottom-up approaches are used as a program be-comes more mature and better information is available that allowsmore-detailed comparisons with prior experiences.
Because our objective for this study was to develop methodolo-gies that could be used to estimate SE/PM costs directly, we used sta-tistical analysis to develop parametric cost-estimating relationships(CERs) for aircraft and guided weapons programs in developmentand production. We wanted our resulting estimating methods toutilize parameters directly related to SE/PM costs. Based on our in-terviews with contractor personnel and on previous cost studies, wegenerated a list of potential independent variables that could be logi-cally related to SE/PM costs. Using step-wise and ordinary leastsquares regression analysis, we selected the best CERs most useful topredicting costs.
Finally, to determine if any adjustments to historically basedCERs are required to account for new acquisition approaches, wecompared the SE/PM cost data from selected sample programs that

Summary xxi
implemented the new acquisition approaches with the SE/PM costdata for the overall sample of similar programs. We wanted to seewhat, if any, differences arose in the SE/PM cost for these programsunder acquisition reform as compared with other programs to deter-mine if any changes to our estimating methods were necessary to takethese new initiatives into account.
Results and Findings
We first examined historical SE/PM costs over time to determinewhat general cost trends seem to be occurring. As the basis for ourquantification of SE/PM development costs, we collected data from awide assortment of historical efforts including prototype developmentprograms, full development programs, and modification programs.For production analysis, we also used data from several productionlots from multiple programs. The data we gathered on aircraft andweapons programs from the 1960s up through recent years showedthat SE/PM represents a significant portion of program cost andseems to be on the rise for aircraft development programs (see page29). For aircraft development programs, SE/PM represents about 12percent of the total contractor cost. For weapons development pro-grams, the SE/PM percentage of the total cost is even larger—28 per-cent on average. We found the SE/PM cost split between systems en-gineering and program management is roughly 50/50 for aircraftprograms and 60/40 for weapons programs (see page 34). SE/PMproduction data for aircraft showed a large amount of variation, whileproduction cost for weapons seemed to more closely follow a tradi-tional cost-improvement curve (also referred to as a learning curve)(see page 36).
Based on our interviews with contractor personnel and a reviewof prior studies of aircraft and weapons costs, we explored a set of in-dependent variables that we believe could be related to SE/PM cost.Most independent variables fell into three categories: program scopevariables, programmatic variables, and physical descriptor variables.Program scope is measured by the cost of the program less SE/PM

xxii SE/PM: Trends and Costs for Aircraft and Guided Weapons Programs
costs in either development or production. Programmatic variablescapture the duration of the effort (in the case of development pro-grams) and quantity of items produced (in the case of productionprograms). Physical descriptor variables are generally weight based,except in the case of weapons for which diameter was also considered.In addition to these variables, for aircraft in development, we at-tempted to relate the amount of integration required (as measured byair vehicle cost divided by airframe cost) to the overall SE/PM cost.For weapons in development, we also considered programmatic vari-ables to account for programs that were not traditional engineeringand manufacturing development (EMD) programs (i.e., prototypeprograms or modification programs) and to account for changes overtime (based on the contract award year). We were also sensitive tousing independent variables that could readily be quantified by a costanalyst early in a program.
We found that for both aircraft and weapons in development,SE/PM costs were most directly related to the overall size of the pro-gram (as measured by development cost less SE/PM) (see page 79). Inaddition, we found that design duration (as measured by monthsfrom contract award to first flight) played a role in the SE/PM costfor aircraft development programs (see page 80). In looking at thefunding profile of SE/PM costs, we found that about one-third of thetotal SE/PM cost is expended from contract award to critical designreview, the second third of the SE/PM cost is spent from CDR to thefirst flight date, and the final third is spent from first flight to the endof the program (see page 82). Appendix F details techniques that canbe used to time-phase SE/PM development cost estimates.
For both aircraft and weapons, we again determined that scope(as measured by the recurring unit cost of the aircraft or missile) was asignificant factor in estimating SE/PM cost in the production phaseof the program. In addition, we determined that the cumulativequantity and production rate were related to the unit cost of SE/PMin production (see pages 88 and 105). The ratio of the yearly lot sizeto the maximum lot size was found to be an independent variablethat improved the predictive capability of our estimating equations(see page 93). The cost-improvement slopes, used for projecting

Summary xxiii
yearly SE/PM costs, showed a large variation for aircraft programs,while the slopes for weapons were more tightly grouped (see pages 98and 111).
Unfortunately, the large degree of variation in the data we usedto develop these parametric estimating methods resulted in a largestandard error for our estimating equations. We tried to further inves-tigate what might be causing the variation, but were unable to iden-tify any consistent cause. For example, in the case of aircraft produc-tion costs, we looked to see whether the high degree of SE/PM costvariability was related to the change in the aircraft model or to theintroduction of foreign military sales. These two changes did notalign with the fluctuations in the SE/PM cost data (see page 84). Forthese reasons, we conclude that the CERs we generated are most use-ful to a cost estimator in the early stages of a program’s life cycle,when little is known about the program. When more detailed infor-mation is available, other techniques could be applied for developingmore-accurate SE/PM estimates. For example, use of a direct-analogyapproach in which a well-understood program is compared with anew program can lead to less variation in the final outcome and a bet-ter understanding of the specific cost drivers (see page 125).
Finally, we investigated the potential effect that new acquisitionapproaches, such as decreased use of military specifications and mili-tary standards, use of integrated product teams (IPTs), and the use ofevolutionary acquisition, would have on SE/PM costs. Because thereis not a long history of these types of programs, we compared theSE/PM costs of the few programs that have implemented thesechanges to the overall population of similar programs. We found thatprograms that minimized military specifications did not show a sig-nificant difference from the overall sample of programs, being withinone standard deviation in SE/PM cost from the overall sample aver-age (see page 114). For programs that used IPTs, SE/PM costs wereeither similar to or slightly higher than SE/PM costs for the overallsample of programs (see page 116). To determine the quantitativeeffect that evolutionary acquisition (EA) had on SE/PM costs, weanalyzed SE/PM costs for a program that concurrently developedmultiple variants as a surrogate for an EA program, and we found

xxiv SE/PM: Trends and Costs for Aircraft and Guided Weapons Programs
that it exhibited above-average SE/PM costs (see page 121). In addi-tion, we investigated cost-estimating methodologies employed by oneof the first programs to use EA. The cost-estimating technique usedby one formally designated evolutionary acquisition program suggeststhat two areas of SE/PM need to be estimated: the SE/PM cost asso-ciated with the specific capability increment or “spiral” and the“overlay” SE/PM cost that is concerned with development and pro-duction of the overall program (see page 120).
In conclusion, SE/PM costs are a large portion of the acquisitioncost of military aircraft and guided weapons systems. In the case ofaircraft, SE/PM costs appear to be rising over time. There are multi-ple approaches to estimating the cost of SE/PM, and each has advan-tages and disadvantages. We developed a set of cost-estimating rela-tionships that can be used to specifically estimate the SE/PM costelement for development and production for both aircraft and weap-ons programs. However, the production CERs we generated were notas good as the development CERs at explaining the variation in thehistorical data. Finally, we found that implementation of new acquisi-tion approaches had mixed results in changing SE/PM costs.

xxv
Acknowledgments
Many individuals were instrumental in the completion of this study.A number of individuals, from both government and industry, tookthe time to provide insights and information used in this study.
This study would not have been possible without the sponsor-ship of Lt Gen John Corley, the U.S. Air Force Principal Deputy As-sistant Secretary for Acquisition. Also, we greatly appreciate the over-sight provided by the Air Force Cost Analysis Agency and itsassistance in gathering the data used for the analysis in this report. Inparticular, Scott Adamson and John Fitch were instrumental in giv-ing us access to government cost data.
From the government, we were able to obtain insights and datafrom the following organizations and individuals:
• Office of Secretary of Defense (Cost Analysis ImprovementGroup): Edward Kelly and Fred Janicki
• Office of Secretary of Defense (Acquisition, Technology &Logistics): James Thompson
• Joint Strike Fighter System Program Office: Michael Clark• Naval Air Systems Command, Cost Department: Richard Scott,
Heidi Farmer, and William Stranges• Aeronautical Systems Command: Mike Seibel and Sandra
McCardle• Naval Center for Cost Analysis: Thomas Burton• Global Hawk System Program Office: Walt Pingle.

xxvi SE/PM: Trends and Costs for Aircraft and Guided Weapons Programs
The following industry representatives whom we interviewedprovided useful insights that were crucial to our developing a deeperunderstanding of systems engineering and program managementtasks and the cost drivers associated those tasks:
• Boeing Corporation: Carol Hibbard, Dru Held, KimberlySchenken, and Timothy Stremming
• Raytheon Corporation: David Sauve• Lockheed Martin: Ralph Smith and Cleo Lyles.
The authors would also like to thank RAND Corporation col-leagues for making significant contributions to this report. We wouldlike to thank Jim Thompson from the Office of Undersecretary ofDefense and RAND colleague Bernard Fox for their thoughtful andcareful review. Jack Graser provided much-needed guidance and di-rection for the analysis effort. Allan Crego assisted with the statisticalanalysis of the data. Nancy DelFavero did an outstanding job of ed-iting and improving the flow of the discussion in the final report, andJennifer Li and Jane Siegel made an outstanding contribution tostructuring a previous version of this report. Michele Anandappa,Mike DuVal, and Nathan Tranquilli provided valuable administra-tive support.
xxvii
Acronyms and Abbreviations
AAAM Advanced Air-to-Air Missile
AAD Airframe Already Developed
ACAT Acquisition Category
ACTD Advanced Concept Technology Demonstration
AFCAA Air Force Cost Analysis Agency
AIA Aircraft Industry Association
ALCM Air-Launched Cruise Missile
AMRAAM Advanced Medium-Range Air-to-Air Missile
ANSI American National Standards Institute
ASD(C3I) Assistant Secretary of Defense for Command,Control, Communications, and Intelligence
ASD(NII) Assistant Secretary of Defense (Networks andInformation Integration)
ASR Alternate System Review
ATA Advanced Tactical Aircraft
ATF Advanced Tactical Fighter
AV/AF Air Vehicle/Airframe (cost)
AV AUC Air Vehicle Average Unit Cost
AV T100 Air Vehicle 100th Unit Cost
AWACS Airborne Warning and Control System
CA Contract Award

xxviii SE/PM: Trends and Costs for Aircraft and Guided Weapons Programs
CADT Contract Award to End of Development Test
CAFF Contract Award to First Flight
CAFGL Contract Award to First Guided Launch
CAFPD Contract Award to First Production Delivery
CAIV Cost as an Independent Variable
CCDR Contractor Cost Data Report
CDD Capabilities Development Document
CDR Critical Design Review
CDRL Contract Data Requirements List
CER Cost Estimating Relationship
CMM Capability Maturity Model
CPD Capability Production Document
C3I Command, Control, Communications, andIntelligence
CPR Cost Performance Report
CWBS Contractor Work Breakdown Structure
DAU Defense Acquisition University
DEN Density
DIAM Diameter
DoD Department of Defense
DoDD Department of Defense Directive
DSMC Defense Systems Management College
DT Development Test
DTC Design to Cost
DT&E Development Test and Evaluation
D&V Demonstration and Validation
DVMOD Demonstration and Validation or Modification
EA Evolutionary Acquisition
ECM Electromagnetic Compatibility

Acronyms and Abbreviations xxix
ECP Engineering Change Proposal
EIA Electronic Industries Alliance
EMD Engineering and Manufacturing Development
ESWBS Extended Ship Work Breakdown Structure
EVM Earned Value Management
FCA Functional Configuration Audit
FCHR Functional Cost Hour Reports
FF First Flight
FMS Foreign Military Sales
FQR Formal Qualification Review
FRP Full-Rate Production
FSD Full-Scale Development
FSED Full-Scale Engineering Development
G&A General and Administrative
FY Fiscal Year
GFE Government-Furnished Equipment
GPS Global Positioning System
HARM High Speed Anti-Radiation Missile
IBR Integrated Baseline Review
ICBM Intercontinental Ballistic Missile
ICD Initial Capabilities Document
IDA Institute for Defense Analyses
IEC International Electrotechnical Commission
IEEE Institute of Electrical and Electronics Engineers
IIPT Integrating Integrated Product Team
ILS Integrated Logistics Support
ILSP Integrated Logistics Support Plan
IMU Inertial Measurement Unit
INCOSE International Council on Systems Engineering

xxx SE/PM: Trends and Costs for Aircraft and Guided Weapons Programs
IPPD Integrated Product and Process Development
IPT Integrated Product Team
IR Infrared
ISO International Organization for Standardization
ISR In-Service Review
ITR Initial Technical Review
IV&V Independent Verification and Validation
JASSM Joint Air-to-Surface Standoff Missile
JDAM Joint Direct Attack Munition
JSF Joint Strike Fighter
JSOW Joint Standoff Weapon
KPP Key Performance Parameter
LCC Life-Cycle Cost
LLOT Last Lot
LOR Level of Repair
LOT MP Lot Midpoint
LOT NUM Lot Number
LRIP Low-Rate Initial Production
LRU Line Replaceable Unit
LSA Logistics Support Analysis
MDA Milestone Decision Authority
MDAP Major Defense Acquisition Program
MIL-HDBK Military Handbook
MILSPEC Military Specification
MILSTD Military Standard
MMP Manufacturing Management Plan
NCCA Naval Center for Cost Analysis
NNTE Nonrecurring, Nontest Engineering
NRDEV Nonrecurring Development Cost

Acronyms and Abbreviations xxxi
OIPT Overarching Integrated Product Team
O&S Operating and Support
OSD(PA&E) Office of Secretary of Defense (Program Analysisand Evaluation)
OT&E Operational Test and Evaluation
OTRR Operational Test Readiness Review
PAF Project AIR FORCE
PCA Physical Configuration Audit
P&D Production and Deployment
PDR Preliminary Design Review
P3I Preplanned Product Improvement
PIN Program Integration Number
PPI Post-Production Improvement
PM Program Management
PROTO Prototype
PRR Production Readiness Review
RATE Rate per Year
RDT&E Research, Development, Test, and Evaluation
RFP Request for Proposal
SAR Selected Acquisition Report
SDP Software Development Plan
SD&D System Development and Demonstration
SE Systems Engineering
SEI Software Engineering Institute
SEMP Systems Engineering Management Plan
SE/PM Systems Engineering/Program Management
SEPM LOT Lot Cost of SE/PM (in production)
SEPM UC Unit Cost of SE/PM (in production)
SFR System Functional Review

xxxii SE/PM: Trends and Costs for Aircraft and Guided Weapons Programs
SLCM Sea-Launched Cruise Missile
SLOC Source Lines of Code
SOO Statement of Objectives
SOW Statement of Work
SPEC Specification
SRAM Short-Range Attack Missile
SRR System Requirements Review
SVR System Verification Review
ST&E Systems Test and Evaluation
T100 100th Unit
T1000 1000th Unit
TDEVLSEPM Total Development Cost Less SE/PM Cost
TEMP Test and Evaluation Master Plan
TRA Technology Readiness Assessment
TRL Technical Readiness Level
TRR Test Readiness Review
TSSAM Tri-Service Standoff Attack Munition
USD(AT&L) Under Secretary of Defense (Acquisition, Tech-nology, and Logistics)
VECP Value Engineering Change Proposal
WBS Work Breakdown Structure
WE Weight Empty
WIPT Working-Level Integrated Product Team
WPN Weapon
WT Weight

1
CHAPTER ONE
Introduction
Study Background and Purpose
For cost estimators to develop sound estimates for program budgets,reliable and accurate cost-estimating techniques are needed. As newprograms are fielded and as acquisition management techniqueschange, there is a constant need to improve the tools available to costestimators. This report explores cost data on historical aircraft andguided weapons programs and presents techniques for developingsound estimates of systems engineering and program management(SE/PM) costs.
In the Department of Defense (DoD), cost estimates and budg-ets are structured to follow a product-centric, work breakdown struc-ture that itemizes program tasks and costs in a hierarchical fashion.Guidelines for developing a work breakdown structure (WBS) aredescribed in Military Handbook 881 (MIL-HDBK-881). The sug-gested generalized WBS for aircraft is shown in Table 1.1.
The WBS provides a common structure for understanding andallocating tasks, expending resources, and reporting to the govern-ment. Each lower level of the WBS has a “child-to-parent” relation-ship such that Level 1 encompasses the entire aircraft system. Level 2costs include air vehicle costs that are associated with hardware andsoftware that make up the complete flying aircraft. The Level 3 ele-ments, which are under air vehicle, include the airframe, propulsion,and all other installed equipment. The other Level 2 cost elementsthat begin with SE/PM are typically termed “below-the-line” costs.

2 SE/PM: Trends and Costs for Aircraft and Guided Weapons Programs
Table 1.1Generic Aircraft System Work Breakdown Structure
Level 1 Level 2 Level 3
Aircraft SystemAir Vehicle
AirframePropulsionAir Vehicle Applications SoftwareAir Vehicle System SoftwareCommunications/IdentificationNavigation/GuidanceCentral ComputerFire ControlData Display and Controls
Systems Engineering /ProgramManagement
Systems Test and EvaluationTrainingDataPeculiar Support Equipment
Common Support EquipmentOperational /Site ActivationIndustrial FacilitiesInitial Spares and Repair Parts
NOTE: Below-the-line costs are shown in italics.
The below-the-line cost elements (shown in Table 1.1) arecommon across multiple types of systems that DoD develops andprocures. Systems engineering and program management costs includethe costs of business management as well as the costs of engineeringand technical control of a particular program. Systems test and evalua-tion costs are the costs associated with using specific hardware andsoftware to validate that the engineered design meets the desired per-formance of the system. Training costs include the costs of servicesand equipment to instruct personnel in the operation and mainte-nance of the system. The data cost element includes the costs of de-livering to the government data associated with the contract. Peculiarsupport equipment (as it is called in MIL-HDBK-881) covers the costof developing and producing system-specific equipment to support

Introduction 3
and maintain the system. Common support equipment is associatedwith items currently in the DoD inventory that are required to sup-port and maintain other systems. Operational/site activation costs arethe costs associated with the facilities to house and operate the sys-tem. Industrial facilities costs are the depot maintenance start-upcosts. Initial spares and repair parts costs are the costs for initial sparesfor a newly fielded system.
SE/PM represents one of the more costly of the below-the-lineelements for military aircraft and guided weapon systems. This reportexplores the content of the work performed under SE/PM and looksat the trends that have been occurring in SE/PM costs for both devel-opment and production for aircraft and weapons. We also discusscurrent methods used by government and industry to estimate thecost of SE/PM, and we provide some useful cost-estimating relation-ships (CERs) that can be used for programs early in their develop-ment. The parameters used in the CERs show how SE/PM costs canbe estimated by knowing some basic information about the program.
We developed parametric cost-estimating approaches that couldbe used to directly estimate SE/PM costs as a separate WBS element.(Traditional estimating approaches estimate SE/PM as part of thelarger design effort.) We found cost drivers specifically related toSE/PM costs. These cost drivers are quantifiable and determined earlyin the acquisition of a program. We used regression analysis to de-termine how these cost parameters can forecast SE/PM costs.
Another goal of this study is to determine if the DoD’s recentacquisition-process initiatives—collectively referred to as “acquisitionreform”—affect SE/PM costs. Specifically, we investigate the effect ofthree acquisition reform initiatives—the reduction of the number ofmilitary specifications and standards, the use of integrated productteams, and the use of evolutionary acquisition—on SE/PM costs. Be-cause these processes have changed the traditional acquisition process,we wanted to determine what, if any, impact these changes are likelyto have on SE/PM costs.

4 SE/PM: Trends and Costs for Aircraft and Guided Weapons Programs
Comparison with Previous Work in This Area
Several studies have been performed that discuss methodologies thatcan be used to estimate the development and production cost of air-craft and guided weapons programs. Most of the studies focus on es-timating higher-level elements of cost (i.e., total engineering) ratherthan just focusing on the SE/PM costs associated with a program.Typically, SE/PM costs are grouped with engineering costs and arenot estimated separately. A description of some of the previous workin this area is provided below.
RAND has done research in the area of cost analysis for militaryaircraft and weapons since the 1950s. Many of these reports use his-torical cost information to develop parametric estimating equationsthat link cost to various independent variables that usually measurephysical or performance characteristics of the systems. In 1987,RAND developed a series of CERs for estimating airframe costs formilitary aircraft programs (Hess and Romanoff, 1987) that used air-craft weight empty (WE) and speed as independent variables.
Over time, the increased complexity of aircraft has created thedesire to investigate other independent variables to predict airframecosts. In 1991, RAND published a report (Resetar, Rogers, and Hess,1991) that looked at the relative cost of using advanced materials(such as composites) as compared with the cost of using traditionalmetal materials in aircraft development and production. This studywas updated in 2001 (Younossi, Kennedy, and Graser, 2001) andprovided a CER for estimating total nonrecurring engineering hoursto develop an airframe. Included in the CER is the cost of the associ-ated SE/PM effort; however, the study’s report does not present amethod for extracting SE/PM costs.
In 1988, the Institute for Defense Analyses (IDA) published astudy (Harmon et al., 1988) commissioned by the Office of the Sec-retary of Defense (OSD), Program Analysis and Evaluation (PA&E)that investigated the costs of developing military tactical aircraft. Thisreport was prepared as the Air Force was about to begin the AdvancedTactical Fighter (ATF) program and the Navy was about to start theAdvanced Tactical Aircraft (ATA) program. The IDA report contains

Introduction 5
descriptive overviews and costs related to the development of 23 dif-ferent programs from the 1960s to the 1980s.
As did the prior RAND and IDA reports, this report providesparametric cost-estimating approaches that can be used to generatecost estimates at the beginning of a program’s development beforemuch detail is known about the program’s design. It is different fromthe prior RAND and IDA studies in that it provides a methodologyfor estimating the prime contractor’s SE/PM costs directly.
Study Methods and Approach
DoD has in recent years placed a greater emphasis on the rigorousapplication of a systems engineering approach to all programs withinthe department. The acting Undersecretary of Defense for Acquisi-tion, Technology and Logistics (USD[AT&L]), Michael Wynne,stated in a memo that “all programs . . . regardless of acquisition cate-gory, shall apply a robust SE approach” (USD[AT&L], 2004). Giventhe highlighted importance of this approach, and the fact that SE/PMtends to represent a large portion of the cost for aircraft and guidedweapons systems, it is worthwhile to address the content and costsassociated with SE/PM.
As stated above, the purpose of this study is to investigate thecosts that are specifically categorized as SE/PM costs for aircraft andweapons programs in development and production. In contrast toprior studies that grouped SE/PM costs with other engineering devel-opment costs, we developed CERs for estimating SE/PM costs di-rectly using explanatory variables that are more closely associated withthe SE/PM effort.
This method would then lend itself to further investigation ofwhat changes, if any, should be considered for future SE/PM esti-mates given recent changes in the acquisition environment. One re-cent change is the evolution of prime contractors toward a greaterlead systems-integrator role, with much of the detailed design andmanufacturing outsourced to lower-level suppliers. Another change isthat contractors are more involved in deriving specifications from

6 SE/PM: Trends and Costs for Aircraft and Guided Weapons Programs
top-level performance requirements rather than using establishedmilitary specifications and standards. DoD programs have incorpo-rated Integrated Product Teams (IPTs) that require increased levels ofcommunication and coordination. Evolutionary acquisition and theuse of cost as an independent variable (CAIV) have changed the ac-quisition approach by generating more design iterations through thedevelopment process rather than using a somewhat fixed designthroughout development.
Our approach was to start by defining SE/PM and understand-ing the SE/PM process that is used by defense contractors in the ac-quisition of military equipment. We provide background on the tools(such as formal documentation and program reviews) that are com-monly used in DoD programs to provide final products that meet theuser’s requirements. Most of this background information came froma literature search of related DoD acquisition handbooks and texts.
To better understand trends in SE/PM costs and methods cur-rently used to estimate SE/PM, we interviewed both government andindustry personnel who perform such estimates. We developed aquestionnaire (provided in Appendix C) that poses questions to per-sonnel working in the defense industry about the definitions theyfollow and the methods they use in estimating SE/PM costs. Whenwe interviewed contractor personnel, we further asked them whatrelevant independent variables could be used to develop parametricestimating relationships. Finally, we asked what effects the new acqui-sition initiatives were having (if any) on SE/PM activities and costs.
The cost data we collected for this study generally came fromcontractor cost data reports (CCDRs) that covered the initial systemdevelopment or system production. This data were supplemented bydata from cost performance reports (CPRs) and from contractors’internal cost-reporting systems to gain a more thorough understand-ing of the cost details at lower levels of cost. The data set includes amix of actual costs from programs that completed development, arecurrently in development, or that were canceled during development.For aircraft systems, we collected cost information on 26 develop-ment programs and 13 production programs. For guided weapon sys-tems, we collected cost data from 37 development programs and

Introduction 7
14 production programs. Tables 1.2 through 1.5 list information onthe programs we investigated and the type of cost information thatwe used for this study (CCDRs, CPRs, and contractor/programdata). For guided-weapons production programs, all the data are fromCCDRs provided to the government.
Table 1.2Aircraft Development Programs, Program Phases, and Sources of Cost Data
Program Name Phase CCDR CPRContractor/
Program Data
B-1A FSD X
B-1B FSD X
B-1B CMUP Blk D Modification development X
B-2 FSD X
C-5A FSED X
C-17 FSED X
A-10 FSD X
AV-8B FSD X
E-2C Modification development X
E-3 FSD X
E-8 FSD X
767 AWACS Modification development X
Air Force One Modification development X
F-14 FSD (Lot I & II) X
F-15 FSD (Segment I & II) X
F-16 FSD X X
F/A-18A/B FSD X X
F/A-18E/F EMD X X
F-22 EMD X X
YF-16 Prototype development X
YF-17 Prototype development X
YF-22 Prototype development X
S-3 Development X
T-45 FSD X
V-22 FSD X
V-22 EMD X
NOTES: FSD = full-scale development; FSED = full-scale engineering development;EMD = engineering and manufacturing development.

8 SE/PM: Trends and Costs for Aircraft and Guided Weapons Programs
Table 1.3Aircraft Production Programs, Years of Program, and Sources of Cost Data
Program Name Years CCDR CPRContractor/Program
Data
F-14A 1970–1980 X X
F-14A Plus 1986–1988 X X
F-14D 1988–1990 X X
F-15A/B 1973–1977 X
F-15C/D 1978–1986 X
F-15E 1987–1991 X
F-16A/B 1977–1982 X X X
F-16C/D 1983–1993 X X X
A-10 1975–1982 X
A-6A 1966–1969 X
A-6E 1970–1988 X
EA-6B 1967–1989 X
AV-8B 1982–1991 X
C-17 1988–1996 X X
C-5A 1966–1968 X
C-5B 1984–1986 X
E-2C 1971–1992 X
E-3 1975–1978 X
F/A-18A/B 1979–1985 X
Table 1.4Guided Weapons Development Programs, Program Phases, and Sources ofCost Data
Program Name Phase CCDR CPRContractor/
Program Data
Air-to-Air
AIM-54A FSED X
AIM-54C FSED X
AIM/RIM-7M FSED X
AIM/RIM-7P FSED X
AIM-155 (AAAM – GeneralDynamics and Westinghouse) FSED X
AIM-155 (AAAM - Hughes andRaytheon) FSED X
AIM-120 FSED X

Introduction 9
Table1.4—Continued
Program Name Phase CCDR CPRContractor/
Program Data
AIM-120 FSED 2nd Source X
AIM-120 P3I Phase I EMD P3I X
AIM-120 P3I Phase II EMD P3I X
AIM-120 P3I Phase III EMD P3I X
AIM-9R FSED X
AIM-9X D&V X
AIM-9X EMD X
Air-to-Ground
AGM-69A FSED X
AGM-131A/B FSD X
AGM-65A FSED X
AGM-65D FSED X
AGM-65C FSED X
AGM-84A
Design andWeaponsSystemDevelopment X
AGM-84H EMD X
AGM-88A, Sub Phase I FSED X
AGM-88A, Sub Phase II FSED X
AGM-88A, Sub Phase III FSED X
AGM-86A FSED X
AGM-86B FSD X
AGM/RGM-136 FSED X
AGM-129A/B FSED (Guidance) X
AGM-130 FSED X
CBU-97/B FSED X
AGM-154A EMD X
AGM-154B EMD X
AGM-154C EMD X
GBU-31 EMD (Phase II) X
AGM-158 EMD X
BGM-109 FSD X
R/UGM-109E EMD X
NOTES: P3I = pre-planned product improvement; AAAM = Advanced Air-to-Air Missile;D&V = demonstration and validation.

10 SE/PM: Trends and Costs for Aircraft and Guided Weapons Programs
Table 1.5Guided Weapons Production Programs, Years of Programs, and Sources ofCost Data
Program Name Years CCDR
ALCM 1979–1983 X
AIM-120 Hughes 1987–1994 X
AIM-120 Raytheon 1987–1993 X
AGM-88AB HARM 1981–1992 X
AGM-84 Harpoon 1975–1987 X
AGM-65A Maverick 1987–1991 X
AGM-65 IR Maverick Hughes 1977–1982 X
AGM-65 IR Maverick Raytheon 1983–1993 X
AIM-54A Phoenix 1975–1982 X
AIM-9M Raytheon 1966–1969 X
AIM-9L Raytheon 1970–1988 X
SLCM Tomahawk 1967–1989 X
AIM-7M Sparrow General Dynamics 1982–1991 X
AIM-7M Sparrow Raytheon 1988–1996 X
AIM-7F Sparrow Raytheon 1966–1968 X
NOTES: ALCM = air-launched cruise missile; HARM = high-speed anti-radiation missile;IR = infrared; SLCM = sea-launched cruise missile.
We then combined the information collected through the inter-views along with the cost data collected from government reports togenerate a set of cost relationships that can be used to directly esti-mate SE/PM costs early on in a program when, generally, there isvery little known about the specific characteristics of the program de-sign. Based on the interviews and our own analysis, several independ-ent variables were chosen as potential explanatory parameters. Ourstatistical analysis included performing a step-wise regression analysisto determine which independent variables would be the best to in-clude in a cost model. After choosing the independent variables, weused ordinary least squares regression analysis to arrive at cost esti-mating equations for SE/PM costs as a function of these independentvariables.
For the final part of our analysis, we used the cost data to inves-tigate what effects new acquisition processes might have on SE/PM

Introduction 11
costs. We used univariate analysis to determine if there were any dif-ferences between the SE/PM costs for these individual programs us-ing the new acquisition processes and the SE/PM costs for the totalsample of programs.
Limitations of the Study
After interviewing personnel from defense companies, it became clearthat each of the companies, and in some cases each program within acompany, defines SE and PM somewhat differently. Part of the rea-son for these differences is that much of the defense industry has con-solidated into a few prime-level contractors. The new merged com-panies are products of several legacy companies that each useddifferent accounting systems to define the content of SE/PM. Muchof the historical data used in this study comes from a time before themajor mergers and acquisitions occurred. Some companies are at-tempting to integrate the accounting systems of the legacy companiesand some are keeping legacy accounting systems intact. We highlightsome of these differences in the accounting of SE/PM costs, but wedid not try to normalize accounting systems across companies or pro-grams.
This report deals only with SE and PM costs from the primeweapons system contractor (or contractor team) during the course ofa contract. SE and PM costs also occur at the subcontractor level andwithin the government, which require consideration when developinglife-cycle cost estimates. However, due to limitations in the availabil-ity of data, these costs are not analyzed in this report.
Organization of This Report
Chapters Two, Three, and Four provide background information onsystems engineering and program management. Chapter Two definesthe activities involved in SE/PM; Chapter Three explores the trendsin SE/PM costs for aircraft and guided weapons programs, and Chap-

12 SE/PM: Trends and Costs for Aircraft and Guided Weapons Programs
ter Four presents the current methods used in estimating SE/PMcosts. Chapters Five and Six delve into the analysis we performed indeveloping cost-estimating relationships. Chapter Five describes themethodology used in this study and the cost estimating relationshipswe developed. Chapter Six explores the effect that new acquisitionapproaches may have on SE/PM cost estimates. Our conclusionsfrom this study are presented in Chapter Seven.
Appendix A provides information on systems engineering re-views and how they relate to the acquisition life cycle. Appendix Bexcerpts the definition of SE/PM from MIL-HDBK-881. AppendixC contains the questionnaire we used for interviewing contractors.Appendix D lists the definitions of the independent variables we thatwe chose to represent the potential cost drivers of SE/PM costs in air-craft programs. Appendix E provides the correlation matrices of thevariables in the datasets. Appendix F describes a method for time-phasing a point estimate of a development program.
A supplement to this report (RAND TR-311-AF, not availableto the general public) provides proprietary data that were used in thisanalysis.

13
CHAPTER TWO
Defining Systems Engineering and ProgramManagement
Systems engineering (SE) and program management (PM) are impor-tant components in the development and production of complexmilitary weapons systems. The primary focus of SE is to integrate andbalance the work of engineering specialists from the initial designgoals to the production of the final product. PM comprises the man-agement (i.e., planning, organizing, directing, coordinating, control-ling, and approving) of the day-to-day activities of a program as itproceeds through the acquisition process.
This chapter defines systems engineering and program manage-ment, explains the systems engineering process, and describes thetools used for managing programs and the various SE/PM tasks.
Systems Engineering Definition
SE first came into being as a separate engineering discipline duringthe 1950s with the Intercontinental Ballistic Missile (ICBM) pro-gram (Przemieniecki, 1993). It was first defined in a military standard(MIL-STD-499) in 1969, which was updated in draft format byMIL-STD-499(B) in 1992.1
____________1 The draft MIL-STD-499(B) was never formally released due to the reduction of militarystandards (MILSTDs) and military specifications (MILSPECs) under acquisition reform. Inits place, there are three prevailing commercial standards, each developed by a different in-dustry organization: ISO/IEC 15288, Systems Engineering-System Life Cycle Processes;ANSI/EIA 632, Processes for Engineering a System; IEEE 1220, Application and Managementof the Systems Engineering Process.

14 SE/PM: Trends and Costs for Aircraft and Guided Weapons Programs
MIL-STD-499(B) defines systems engineering as follows:
An interdisciplinary approach to evolve and verify an integratedand life cycle balanced set of system product and process solu-tions that satisfy customer needs. Systems engineering: (a) en-compasses the scientific and engineering efforts related to thedevelopment, manufacturing, verification, deployment, opera-tions, support, and disposal of system products and processes;(b) develops needed user training equipments, procedures, anddata; (c) establishes and maintains configuration management ofthe system; (d) develops work breakdown structures and state-ments of work; and (e) provides information for managementdecision making.
As suggested by the above definition, systems engineering is aniterative process that involves many people from various backgrounds,not only design engineers, but also logisticians, configuration anddata managers, testers, manufacturing personnel, quality control per-sonnel, cost analysts, end users, and program managers.2
Many of the common SE functions found throughout programsare sometimes referred to as “ility” functions—e.g., reliability, main-tainability, producibility, and survivability/vulnerability. Reliabilityengineers are concerned with ensuring that the system will perform asintended, without a mission critical failure, for a specified period oftime. Maintainability engineers are concerned with the resource re-quired (time, skills, and material) to repair an item if it experiences afailure. Producibility engineers evaluate the design for how well it canbe manufactured using existing or new production processes. Surviv-ability/vulnerability engineers look at “the capability of the system toavoid and/or withstand a man-made hostile environment” (Ball,1985).
Besides these “ility” functions, SE is also composed of human-factors engineering, safety engineering, value engineering, quality as-____________2 The DoD definition of systems engineering has evolved somewhat to become, as stated inthe Defense Acquisition Guidebook (December 2004), the “integrating mechanism for bal-anced solutions addressing capability needs, design considerations, and constraints, as well aslimitations imposed by technology, budget, and schedule.”

Defining Systems Engineering and Program Management 15
surance, corrosion prevention, life-cycle cost/design-to-cost (DTC),standardization, and other specific functional areas. Human-factorsengineering relates to the performance and interaction of humanswith systems. Safety engineering performs the technical analysis toevaluate the design for hazards or potential accidents. Value engi-neering’s purpose is to achieve the required function at the lowestoverall cost, sometimes resulting in what are called Value EngineeringChange Proposals (VECPs). Quality assurance in SE evaluates theprocedures throughout the entire process (design, development, fabri-cation, processing, assembly, inspection, testing, maintenance, deliv-ery, and site installation) to ensure adequate quality. Corrosion pre-vention analyzes the entire design (prime contractor andsubcontractor components) to determine, prevent, and control corro-sion of the system in operation. Life-cycle cost analysts develop costestimates for the program from inception through production, field-ing, operations, and disposal. CAIV and DTC analysts consider thecost implications of design alternatives, oftentimes with a contractualincentive for meeting a desired unit cost goal. Standardization at-tempts to minimize the number of unique parts, materials, and proc-esses within the weapon systems and within the existing industrialcapability.
Systems engineering also has an Integrated Logistics Support(ILS) component that is concerned with designing the supportabilityfeatures of a fielded system. One of the typically larger activities inthis area is the Logistics Support Analysis (LSA). The LSA is an itera-tive analysis that systematically examines all the elements of a systemto determine the support required to ensure the system operates effec-tively and keeps operating effectively. The intent is to take the ILSfunctions into account as early as possible to influence the design.Included in this analysis is preparation of the maintenance plan andperformance of a Level of Repair (LOR) analysis to determine theoptimum discard/repair levels for each hardware item. ILS systemsengineering also deals with engineering change proposals; reworkanalysis; facilities analysis; ground support equipment management;spares and repair parts specification; training systems analysis; andpackaging, handling, storage, and transportation analysis.

16 SE/PM: Trends and Costs for Aircraft and Guided Weapons Programs
The Systems Engineering Process
The basic SE process translates needs or requirements into successfulproducts and/or processes. It is largely an iterative process that pro-vides overarching technical management of a system from the statedneed or capability to an effective and useful fielded system. Duringthe process, design solutions are balanced against the stated needsalong with constraints imposed by technology, budgets, and sched-ules. The process is illustrated in Figure 2.1 and is described next.
Process Input
The process starts with the input of the customer’s needs and re-quirements. The input also must include information about the de-sired mission or capability of the system, the technology to be used,
Figure 2.1The Systems Engineering Process
Process Input
• Customer needs• Requirements• Technology base
Process Output
• Database• System architecture• System
RAND MG413-2.1
SystemAnalysis and
Control(Balance)
Requirements Analysis
Functional Analysis/Allocation
Synthesis
Requirementsloop
Designloop
Verification
SOURCE: Defense Systems Management College, 1995.

Defining Systems Engineering and Program Management 17
and any constraints to the system. The input may include outputfrom a previous phase of the process, program decision requirements,or specifications and standards to be used.
Step 1—Requirements Analysis. The first iterative step in the SEprocess is the requirements analysis. In this step, the systems engineerattempts to further derive, refine, and define the customer’s require-ments. This includes determining quantifiable characteristics that thesystem must possess to be successful. The relationship among re-quirements, the priority of the requirements, and the flexibility of therequirements are determined. The missions, threats, environments,constraints, and measures of effectiveness are continually reviewed.Some constraints that are considered are technological availability,physical and human resources, cost/budgetary impacts, and the riskof not meeting the stated schedule. The output of this process an-swers the question “what?” for the functionality and “how well?” forthe performance requirements.
The system engineer should answer the following questionsduring the requirements analysis process (Defense Acquisition Uni-versity [DAU], 2003):
• What are the reasons behind the system development?• What are the customer’s expectations? How will the perform-
ance of the system be measured?• Who are the users and how do they intend to use the product?• What do the users expect of the product?• What is the users’ level of expertise?• What environmental characteristics (e.g., operations off of a car-
rier, corrosion from salt, strong electromagnetic fields) does thesystem have to take into account?
• What are the existing and planned interfaces?• What functions will the system perform, expressed in the cus-
tomer’s language?• What are the constraints—hardware, software, economic, and
procedural—with which the system must comply?• What will be the final form of the product—model, prototype,
or mass production?

18 SE/PM: Trends and Costs for Aircraft and Guided Weapons Programs
Step 2—Functional Analysis/Allocation. The second step of theSE process is the functional analysis/allocation. The goal of this partof the process is to flow down the overall system requirements to thelower-level subsystems. System-level functions include the mission,test, production, deployment, and support functions. Higher-levelfunctions are decomposed into several sub-functions so that discretetasks or activities can be assigned. Each function and sub-function isallocated a set of performance and design requirements, such thatthese low-level requirements can be traced back to the top-level re-quirements they are designed to fulfill. Special attention is given tomaking sure all interfaces, both internal and external, are addressed.Through the requirements feedback loop, the sub-functions are rolledup (re-examined) to make sure that they meet the overall require-ments at the primary level.
Step 3—Synthesis. The synthesis step is the part of the processduring which the allocated requirements are satisfied though designsolutions at the lower levels. The collection of design solutions de-fines a physical architecture that satisfies the functional architecturederived in the previous step. Design requirements are set through aseries of iterative design trade-off analyses. These design requirementsare documented and may take the form of product baselines, productand process specifications, interface-control documents, drawingpackages, facility requirements, procedural and instructional material,and personnel task loading (budgeting based on the number of peo-ple needed for each task). Through the design feedback loop, theselower-level solutions are matched back to the functional allocationthat generated them to ensure that all functions are covered and allelements are justified by a valid requirement. Also at this step, theverification feedback loop ensures that the design solution meets theoriginal requirements. Four types of verification are used to checkthat the design matches the requirements: examination, demonstra-tions, simulations and analysis, and testing.
Process Output
The final output of the entire process should be a design that fulfillsthe needs identified in the initial requirements established by the cus-

Defining Systems Engineering and Program Management 19
tomer. This design is typically documented in a database, system ar-chitecture, system configuration item, or specification.
System Analysis and Control
Throughout the above steps in the SE process, system analysis andcontrol are used to balance the requirements analysis, functionalanalysis/allocation, and synthesis with cost, schedule, and perform-ance risks to ensure that the resulting system is an affordable, opera-tionally effective, and suitable solution for the customer. Trade-offstudies, effectiveness analysis, and risk management are performedtoward this goal. Configuration control, interface management, anddata management are important in ensuring that the entire processhangs together. Technical reviews are performed to communicate de-sign solutions to the customer and internal stakeholders. The ques-tions that should be asked during this part of the process and themanagement tools that are used to answer those questions are shownin Figure 2.2.
Figure 2.2Management Tools for Answering System Analysis and Control Questions
RAND MG413-2.2
Question
How do I make decisions?
Will it do the job? Is it worth the cost?
Are we doing the right thing?
How do I know it works?
Will it meet the performance criteria?
Will it all work together?
Do we know what we have?
Are we ready to go on?
How do I run this program?
Management Tool
Trade studies
Effective analysis
Risk management
Technical performance measures
Modeling and simulation
Technical performance measures
Configuration management
Technical reviews
Integrated planning
SOURCE: DAU, 2000, p. 70.

20 SE/PM: Trends and Costs for Aircraft and Guided Weapons Programs
Program Management Definition
Program management has been defined as “the management of a se-ries of related projects designed to accomplish broad goals, to whichthe individual projects contribute, and typically executed over an ex-tended period of time” (Wideman, 2001). Program management isvery different from corporate administrative management that in-volves an ongoing oversight role. Program management usually hasthe more specific task of completing a project or set of projects forwhich there is a common goal and a finite termination point. Theprogram manager has the responsibility of planning the project, con-trolling the project’s activities, organizing the resources, and leadingthe work within the constraints of the available time and resources.
Project planning involves mapping the project’s initial courseand then updating the plan to meet needs and constraints as theychange throughout the program. In the planning process, an overallplan, called an “acquisition strategy,” is formulated by analyzing therequirements; investigating material solutions (designs); and makingtechnical, cost, and performance trade-offs to arrive at the best solu-tion. A formal acquisition plan details the specific technical, schedule,and financial aspects of a specific contract or group of contractswithin a specific phase of a program. Functional plans detail how theacquisition strategy will be carried out with respect to the variousfunctions within the program (i.e., systems engineering, test andevaluation, logistics, software development). Schedules that are con-tinually updated are used to ensure that various milestones along atimeline are being met. Budgeting, another aspect of project plan-ning, involves developing an initial cost estimate for the work to beperformed, presenting and defending the estimate to parties responsi-ble for budget approvals, and expending the funding.
Control of the project’s activities is primarily concerned withmonitoring and assessing actual activities and making sure they alignwith program goals. Monitoring involves conducting program re-views, measuring actual costs with planned costs, and testing incre-mental aspects of the program. It also includes managing the internalaspects of a program (e.g., the current contract) and monitoring ex-

Defining Systems Engineering and Program Management 21
ternal organizations (e.g., the services, OSD, or Congress) that mayhave a stake in the program’s outcome. From time to time, a programassessment is needed to determine if the overall requirement is stillbeing addressed, adequate funds are available, the risks are beingmanaged, and the initial acquisition strategy is sound.
Organizing resources requires ensuring that appropriate staffmembers are in place to perform the activities required for a success-ful program. Recruiting, training, and motivating personnel are allpart of the program manager’s responsibilities. He or she must ensurethat the organizational structure is optimized to perform the requiredtasks. Traditionally, programs have been organized functionally withhierarchical structures, each of which performs a certain task. Re-cently, IPTs have become popular for organizing personnel on a pro-ject. IPTs are multidiscipline teams with the authority and account-ability to produce a specific product within a program.
Leading the work, given time and resource constraints, involvesnot only the previously mentioned tasks, but also directing that tasksbe carried out and maintaining consensus within and outside theprogram. The program manager must give direction to his or her or-ganization and take direction from organizations outside of his or herdirect control. Maintaining a consensus requires making sure that thecompeting goals of internal and external organizations remain in bal-ance and are working toward the desired goal.
Tasks Specific to Contractor Program Management
The weapons system contractor who ultimately performs the devel-opment and production work on behalf of the government carries outmultiple tasks that are captured under program management costs. Areview of WBS dictionaries, which define the work to be performedunder each element in the WBS, from two programs each performedby a different contractor, revealed the following tasks in common:planning and control (also referred to as “business management”),configuration management, data management, and supplier man-agement. Typically, there are also tasks that fall under program man-

22 SE/PM: Trends and Costs for Aircraft and Guided Weapons Programs
agement that are related to performing integrated logistics supportwork but may be accounted for in a separate WBS element.
The planning and control task involves managing the mainte-nance of the program contractor work breakdown structure (CWBS),updating the project schedules, monitoring the program budget, andreporting information to the contractor’s higher management and tothe government customer. The CWBS details the activities that are tobe performed on the entire contract and is updated as changes to thework content are agreed upon. Planning and control also involve re-sponsibility for maintaining integrated master schedules that detailthe specific work activities and show how they are dependent uponother activities performed under the contract. Budgeting and costcontrol are maintained using a management control system that col-lects cost information that is used with the schedule information todetermine progress on the contract. The costs from the contract arereported to the government in cost performance reports, and the re-ports are used to monitor performance against both the budgeted costand the planned schedule.
The configuration management task involves responsibility formaintaining a documentation trail of changes from the initial con-figuration to the final end product. This trail ensures that all requireddeliverable hardware and software engineering data are identified,documented, and released to the government. Configuration man-agement must ensure that the requirements are flowed down to boththe internal and subcontractor parties responsible for performing thework activities. Configuration management also includes follow-upwith the release of information to make sure it is acceptable to thegovernment client.
Data management involves administration and control of all theprogram data required by the customer.3 The government negotiateswith the contractor on the data that are to be delivered and formally____________3 For government programs, in addition to the end items to be designed or produced, lists ofrequired data items are typically part of the contract. These items are typically spelled out ina Contract Data Requirements List (CDRL) that details the type and form of the data to besubmitted and how often the reports are to be generated and delivered to the government.

Defining Systems Engineering and Program Management 23
makes this part of the contract as stated in the contractor data re-quirements list (CDRL). The contractor’s duties involve establishing,maintaining, and implementing a data management program. Severalcurrent programs have established electronic technical data librariesthat are used by personnel on both the government and contractorside to share information.
Supplier management involves ensuring that the items undersubcontract and items that the government must supply (govern-ment-furnished equipment [GFE]) are delivered to the prime con-tractor. The prime contractor is the chief liaison between the subcon-tractors and the organizations that provide GFE to the program. Thisactivity involves tracking and controlling items to ensure that theirstatus is in alignment with the overall goals of the program.
The program management ILS functions include planning ofthe ILS program, demonstrating and evaluating the logistics program,performing a site/unit activation analysis, and preparing the ILS datain accordance with the CDRL. Much of this work includes planning,coordinating, organizing, controlling, and reporting ILS programobjectives.
Tools Used in Systems Engineering and ProgramManagement
The systems engineer and program manager’s activities revolvearound the basic tasks of planning, controlling, and improving aproduct design to meet the customer’s needs. Several different toolsare at the disposal of the systems engineer and program manager fordeveloping a balanced product.
Planning Tools
In the Planning phase of a program, several tools are used to definethe tasks to be accomplished in the program. Functional planningtools are also used for more-specific areas of systems analysis.
The Contract. In the planning phase, the contract provides theagreement between the government and industry contractor with re-

24 SE/PM: Trends and Costs for Aircraft and Guided Weapons Programs
spect to the system under consideration for acquisition. The contractis an outgrowth of other documents, including the request for pro-posal (RFP), the statement of work (SOW) or statement of objectives(SOO), specifications (SPEC), and the CDRL. The RFP establishes aneed and publicly requests suggested solutions from all possible sup-pliers who could meet the need. The SOW is the formal statement ofneeds to the contractor, the SPEC establishes the technical systemrequirements, and the CDRL defines the data to be delivered fromthe contract.
The Work Breakdown Structure. The WBS is the formal defini-tion of the work to be accomplished on the contract, and it ties theplanning documents together. It takes the form of a product-oriented“family tree” (with lower-level elements summing up to form higher-level elements) that details all the hardware, software, services, anddata that result from performing the SOW or SOO. Both the gov-ernment and the contractor use the WBS as a tool to manage thework with a common terminology. MIL-HDBK-881 (formerly MIL-STD-881) suggests several different WBSs for various general militaryproduct categories as a guide for developing a WBS specific to theprogram of interest. These general WBSs can be tailored to meet thespecific needs of the program.
Functional Planning Tools. Other planning tools include theSystems Engineering Management Plan (SEMP), the Software De-velopment Plan (SDP), the Manufacturing Management Plan(MMP), the Test and Evaluation Master Plan (TEMP), the Inte-grated Logistics Support Plan (ILSP), and the LSA. The SEMP es-tablishes the plan for performing the systems engineering process, in-cluding the plan for management of risk; the analysis, assessment, andverification of the work to be performed; and the design reviews andaudits to be conducted. The SDP is a management plan that focuseson the software to be developed. The MMP is an execution plan thatmaps the transition from the planning stage to production, and it de-tails activities such as analysis, modeling, and testing. The TEMP is asummary management document detailing the tests to be performedto ensure desired performance. The ILSP and LSA documents detailthe operational support plan and support requirements.

Defining Systems Engineering and Program Management 25
Controlling Tools
In the controlling phase of the systems engineering process, the de-sign is under way and the following tools provide the systems engi-neer with a way to maintain a logical development process throughthe design, build, and test stages. The tools generally fall into thecategories of cost analysis, technical performance measures, designreviews/audits, and test and evaluation.
Cost Analysis Tools. There are three primary cost analysis tools.Earned Value Management (EVM) provides a means for measuringthe contractor’s costs and progress against the planned work schedule.Design to Cost (DTC) is a method for tracking production costs withthe goal of minimizing average unit production costs while achievingthe required performance. This method has in recent years given wayto the Cost as an Independent Variable (CAIV) tool. CAIV also usescost goals for a program, but considers the entire life-cycle cost andallows performance and the schedule to be traded off against cost toachieve affordability for the program.
Technical Performance Tools. Technical performance tools aremeasures to assess compliance with program requirements and thelevel of risk in a program. Performance of each element in the WBS isestimated, forecast, and assessed against the performance goals to de-termine how the overall system performance will be achieved. Exam-ples of technical performance measures include weight, mean timebetween failures, and detection accuracy. Programs have begun iden-tifying Key Performance Parameters (KPPs) that establish perform-ance thresholds at higher levels. They are used to measure the successof a program’s design in terms of the performance that is most impor-tant to the government customer.
Design Review/Audit Tools. Design review and design audittools provide a periodic assessment of the design approach, the risk ofthe planned approach not meeting performance, cost, and schedulegoals, and the program’s progress toward production and a fieldedsystem. The design review tools most frequently used include the Ini-tial Technical Review (ITR), the Alternative System Review (ASR),the System Requirements Review (SRR), the System Functional Re-view (SFR), the Preliminary Design Review (PDR), the Critical De-

26 SE/PM: Trends and Costs for Aircraft and Guided Weapons Programs
sign Review (CDR), the Test Readiness Review (TRR), the SystemVerification Review (SVR), the Production Readiness Review (PRR),the Physical Configuration Audit (PCA), the Operational TestReadiness Review (OTRR), and the In Service Review (ISR). Thedesign audits that are typically conducted are the Functional Con-figuration Audit (FCA) and the PCA that are used to verify test andproduction readiness. The Formal Qualification Review (FQR) con-firms that the production item can be fielded. As shown in Figure2.3, the design reviews and audits are used to evaluate performanceand progress and to maintain configuration control. More details onthe specific activities of these reviews and how they relate to a pro-gram’s life cycle are in Appendix A.
Test and Evaluation Tools. Lastly, engineering and programmanagement involves testing and evaluation of the designed product.Low-rate initial production (LRIP) provides a limited number ofproduced units and demonstrates that the manufacturing process ismature prior to beginning full-rate production. Independent Verifica-tion and Validation (IV&V) is the independent review of the func-tionality of the system software to ensure its effectiveness.
Figure 2.3Program Review and Audit Process
RAND MG413-2.3
Definecapability
gaps/needs
Conceptrefinement
Technologydevelop-
ment
Preliminarydesign
Detaileddesign
Hardwarefabrication
and software coding and
test
Systemintegration
and test
Low-rateinitial
production
Full-rateproduction
Fieldedprogram
ITR ASR SRR SFR PDR
CDR TRR ISRWVR/PRR PCA/OTRR

Defining Systems Engineering and Program Management 27
Development Test and Evaluation (DT&E) is performed by theacquisition organization and assists the design engineers with verifica-tion of compliance with performance requirements. The governmentcustomer typically performs the Operational Test and Evaluation(OT&E) to independently verify that the final product is operation-ally effective and suitable. Recently, the testing and evaluation proc-esses have become more integrated in attempt to eliminate unneces-sary duplication of test activities between developmental andoperational testing.4
Product-Improvement Tools
The product-improvement tools are concerned with efforts to furtherrefine the product design to meet new or additional requirements.The product improvement phase generally occurs after an initial ver-sion of the product is in production or is fielded. Engineering ChangeProposals (ECPs) are modifications of the end item during develop-ment or production. Post-Production Improvement (PPI) is a modi-fication to the system in the operational and support phase after de-livery of the item has been accepted. Preplanned ProductImprovement (P3I) is a phased approach that seeks to satisfy incre-mentally different requirements relative to the priority of the gov-ernment customer or the urgency of the need for the item. Evolu-tionary Acquisition (EA) is the acquisition approach currently favoredby DoD; it recognizes the need, up front, for future improvementsthat will be necessary to improve capability. EA is designed to deliverincremental or spiraling capability, with the understanding that fu-ture improvements in capability will be incorporated into future de-sign releases.
The next chapter delves into the cost aspects of SE/PM for air-craft and guided weapons programs. Cost trends for aircraft andweapons in development and in production are investigated. Some ofthe recent changes in the DoD’s acquisition philosophy that may af-fect SE/PM costs are also discussed.____________4 See Fox et al., 2004, pp. 16–20.


29
CHAPTER THREE
Cost Trends in Systems Engineering and ProgramManagement
This chapter examines the trends that have affected SE/PM costs formilitary aircraft and guided weapons programs. We illustrate contrac-tor SE/PM costs over time for aircraft and guided weapons systems indevelopment. We also show what the typical cost split is betweenthese two categories. Historical SE/PM production cost informationis presented to show the variability of the data and the overall trendsin average cost throughout the production process. The chapter con-cludes with a discussion of the new acquisition approaches that mayaffect how SE/PM costs should be estimated for future programs.
SE/PM Development Cost Trends
One clear trend that is evident is that SE/PM costs are increasing inabsolute terms for military aircraft development programs. Figures3.1 through 3.8 depict the average cost for SE/PM activities in air-craft development programs grouped by decade (contract awarddates) from the 1960s through the 1990s. The figures also note thenumber of programs for each time period. The data set includes con-tracts for Demonstration and Validation (D&V), Full-Scale Devel-opment (FSD) or Engineering and Manufacturing Development(EMD), and developmental modification programs. Programs fromthe 1980s and 1990s showed an increasingly larger amount of thedevelopment effort expended on SE/PM activities, with the average

30 SE/PM: Trends and Costs for Aircraft and Guided Weapons Programs
aircraft development cost over the four decades being $441 million(in fiscal year 2003 [FY03] dollars), as shown in Figure 3.1.
If the SE/PM costs are divided by the total cost of a contract,SE/PM represents about 12 percent on average of the total cost ofaircraft development programs. Figure 3.2 shows that SE/PM repre-sents an increasingly larger percentage of the cost of the developmentprograms.
The data used for this analysis include data on a wide variety ofprograms ranging from tactical aircraft platforms, transport aircraft,electronic/surveillance aircraft, and bombers. An examination of thedata showed that some individual programs had relatively large orsmall amounts of SE/PM costs and may have upwardly or down-wardly impacted the average for a particular decade. Two bomberprograms (the B-1 and B-2) were awarded in the 1980s and were
Figure 3.1Trend in Aircraft SE/PM Costs for All Aircraft Development Programs,1960s–1990s
$161$207
$701
$632
0
100
200
300
400
500
600
700
800
1960s 1970s 1980s 1990s
5 7 8 5
Contractaward date
Ave
rag
e SE
/PM
dev
elo
pm
ent
cost
(FY
03 $
M)
Average acrossall years ($441 million)
Number of programs
RAND MG413-3.1

Cost Trends in Systems Engineering and Program Management 31
Figure 3.2Aircraft SE/PM Costs as a Percentage of Total Development Cost for AllDevelopment Programs, 1960s–1990s
8%9%
15%16%
1960s 1970s 1980s 1990s
Contract award date
Ave
rag
e SE
/PM
per
cen
tag
e
Average acrossall years (12%)
18
16
14
12
10
8
6
4
2
0
RAND MG413-3.2
much more expensive than the fighter/attack aircraft developmentprograms. Also, the inclusion of D&V programs such as the YF-16and YF-17 programs during the 1970s has the effect of reducing theaverage SE/PM cost, because both the total size and the proportion ofSE/PM costs of the D&V programs were smaller than those of theFSD programs. For Figures 3.3 and 3.4, we eliminate the bomberand D&V programs and concentrate only on smaller-sized aircraftthat experienced traditional development programs.1 After eliminat-ing these outlier programs, the figures still show a trend of increasingSE/PM costs, although the average cost is lower. This trend is true onan absolute basis (see Figure 3.3) and as a percentage of total programcost (see Figure 3.4). The large change in the 1970s and 1980s data,however, is due to the deletion of the bomber and D&V programdata.____________1 For this subset of programs, we included recent aircraft from the following mission areas:fighter, attack, electronic warfare, antisubmarine warfare, trainer, and transport. The costsfrom these programs came from the larger development contracts.

32 SE/PM: Trends and Costs for Aircraft and Guided Weapons Programs
Figure 3.3Trend in Aircraft SE/PM Costs Minus Outlier Development Programs,1960s–1990s
$161$120
$303
$632
0
100
200
300
400
500
600
700
1960s 1970s 1980s 1990s
5 4 5 5
Contractaward date
Ave
rag
e SE
/PM
dev
elo
pm
ent
cost
(FY
03 $
M)
Average acrossall years ($322 million)
Number of programs
RAND MG413-3.3
In the case of development programs for guided weapons, therewas an initial decrease in absolute cost from the 1960s to the 1970s,followed by a flat trend continuing to the 1990s (see Figure 3.5). The1960s data point may be relatively large because it represents the av-erage of only three weapons programs, one of which is an air-launched nuclear weapon;2 the data points for the later decades repre-sent a larger number of programs. The more recent programs mayalso exhibit lower SE/PM costs because several of them are modifica-tions of older designs. Also, for the more recent past, we includedprototype development efforts in the database and some programsthat never made it into production. Figure 3.6 further shows that as a
____________2 The nuclear weapons program incurred the highest SE/PM cost of all the programs in thedataset. However, eliminating this program did not change the overall trend of SE/PM costsfrom the 1960s to the 1990s.

Cost Trends in Systems Engineering and Program Management 33
Figure 3.4Aircraft SE/PM as a Percentage of Total Aircraft Development Cost MinusOutlier Development Programs, 1960s–1990s
8%
10%11%
16%
1960s 1970s 1980s 1990s
Contract award date
Ave
rag
e SE
/PM
per
cen
tag
e
Average acrossall years (11%)
18
16
14
12
10
8
6
4
2
0
RAND MG413-3.4
percentage of total guided weapons program development cost,SE/PM averages 28 percent of the program cost, more than doublethe average for aircraft programs.
If we include only the programs that could be considered first-time development FSD/EMD guided weapons programs and elimi-nate prototype development programs, programs that were neverfielded, and pre-planned product improvement (P3I) programs, the1980s and 1990s saw an increase in SE/PM costs as compared withthe 1970s. Also, the average SE/PM cost for this subset of guidedweapons development programs shown in Figure 3.7 is about 1.5times higher compared with the average of all the programs shown inFigure 3.5.
Again, if we normalize the data by dividing the SE/PM costs bythe total contract cost for a weapons system, we see the relativechange in the amount of the development effort expended on SE/PMactivities. Figure 3.8 shows that there is not much difference between

34 SE/PM: Trends and Costs for Aircraft and Guided Weapons Programs
Figure 3.5Trend in Guided-Weapons SE/PM Costs for All Guided WeaponsDevelopment Programs, 1960s–1990s
$197
$44 $43 $38
1960s 1970s 1980s 1990s
3 10 12 12
Contractaward date
Ave
rag
e SE
/PM
dev
elo
pm
ent
cost
(FY
03 $
M)
Average acrossall years ($54 million)
Number of programs
RAND MG413-3.5
250
50
100
150
200
0
the SE/PM costs as a percentage of development costs for this subsetof programs and the SE/PM costs as a percentage of developmentcosts for all programs (see Figure 3.6).
From the data we gathered, we were not able to derive a detailedcost breakout of the SE/PM WBS element. However, for some pro-grams, we did have a split between SE and PM costs and some insightinto SE/PM ILS costs. Figure 3.9 shows that for development pro-grams, there is generally a 50/50 split between systems engineeringand program management costs for aircraft programs and a 60/40split between systems engineering and program management forguided weapons development programs. For aircraft programs, ILS

Cost Trends in Systems Engineering and Program Management 35
Figure 3.6Guided Weapons SE/PM as a Percentage of Development Cost for AllGuided Weapons Programs, 1960s–1990s
42%
24%
32%
23%
1960s 1970s 1980s 1990s
Contract award date
Ave
rag
e SE
/PM
per
cen
tag
e
Average acrossall years (28%)
45
40
35
30
25
20
15
10
5
0
RAND MG413-3.6
did not make up a large part of the SE/PM costs.3 For aircraft pro-duction programs, the data were not detailed enough to determinethe split between SE and PM.
For guided weapons development programs, the split betweenSE and PM was more heavily weighted to SE. Also, air-to-air missiledevelopment programs had a higher portion of costs in SE than didair-to-ground programs. Air-to-air guided weapons development pro-grams had a 69/31 split between SE and PM, while air-to-groundprograms averaged a 55/45 split. As with the aircraft data, the guidedweapons production cost-history data did not show enough detail toproduce cost breakouts below the total SE/PM cost element.____________3 MIL-HDBK 881 generally suggests using separate WBS elements to collect ILS costs suchas training, “peculiar” support equipment, common support equipment, operational siteactivation, industrial facilities, and initial spares and repair parts. The portion of ILS effortunder SE/PM is related to the planning and controlling of the ILS activity and the develop-ment of the LSA plan.

36 SE/PM: Trends and Costs for Aircraft and Guided Weapons Programs
Figure 3.7Trend in Guided Weapons SE/PM Costs for FSD/EMD DevelopmentPrograms, 1960s–1990s
$197
$42
$75
$48
1960s 1970s 1980s 1990s
3 5 4 7
Contractaward date
Ave
rag
e SE
/PM
dev
elo
pm
ent
cost
(FY
03 $
M)
Average acrossall years ($76 million)
Number of programs
RAND MG413-3.7
250
50
100
150
200
0
SE/PM Production Cost Trends
After examining several datasets on production lots, we found thataircraft and guided weapons programs exhibited a large degree ofvariation in SE/PM as a percentage of air vehicle production costs.Figure 3.10 shows that aircraft programs display a large amount ofvariation in SE/PM percentages across programs as well as across pro-duction lots. The dashed line in the figure shows the average SE/PMpercentage of total air vehicle cost by lot for several programs, whichare illustrated by the shaded lines in the figure. The overall trendseems to be larger SE/PM cost percentages for the early lots, followed

Cost Trends in Systems Engineering and Program Management 37
Figure 3.8Guided Weapons SE/PM as a Percentage of Development Cost for FSD/EMDDevelopment Programs, 1960s–1990s
42%
23%
34%
22%
1960s 1970s 1980s 1990s
Contract award date
Ave
rag
e SE
/PM
per
cen
tag
e
Average acrossall years (28%)
45
40
35
30
25
20
15
10
5
0
RAND MG413-3.8
by a gradual decline over the next several lots, and then a wideamount of variation for the later lots in the dataset.4
As can be seen in Figure 3.11, guided weapons production pro-grams (indicated by the shaded lines) show some cost volatility in theSE/PM percentage by production lot, but the average (indicated bythe dashed line) shows an anticipated decline in SE/PM as a percent-age of production costs as later production lots are delivered. Thismay be due to the fact that weapons programs tend to run out pro-duction of a specific model until completion of a program rather thanincorporate modifications into an existing production line. Usually, anew development program will include the cost of design modifica-tions, and the production costs will restart at the top of the program’s“learning curve.”____________4 One of the contractors we interviewed suggested that much of the variation is due to blockupgrades of the programs and the introduction of new management approaches, such asIPTs.

38 SE/PM: Trends and Costs for Aircraft and Guided Weapons Programs
Figure 3.9Average SE/PM Cost Split for Aircraft and Guided Weapons DevelopmentPrograms
Aircraft developmentprograms
Guided weapons developmentprograms
RAND MG413-3.9
PE50%
SE50%
PE40%
SE60%
Acquisition Initiatives That May Affect Future SE/PMCosts
During the late 1980s and 1990s, DoD pursued several strategies totry to reduce the cost of developing and procuring weapon systems,including acquisition reform. Acquisition reform is the broad array ofproposals for changing the acquisition process to include more com-mercial-like approaches to the process and reduce the perceived bur-den of government regulation. RAND developed a taxonomy of re-form measures in a study of the cost savings from those measures(Lorell and Graser, 2001). According to this taxonomy, the threemain areas of acquisition reform are “(1) reducing regulatory andoversight compliance, (2) commercial-like program structure, and

Cost Trends in Systems Engineering and Program Management 39
Figure 3.10Aircraft SE/PM as a Percentage of Air Vehicle Cost for Successive ProductionPrograms
RAND MG413-3.10
0
5
10
15
20
25
30
35
1 2 3 4 5 6 7 8 9 10 11 12 13 14 15 16 17 18 19 20 21 22 23
Lot number
SE/P
M p
erce
nta
ge
Average SE/PM percentage across programs
(3) multiyear procurement.” Only the effect of commercial-like pro-gram structures on SE/PM costs was investigated in this study.5
Commercial-like programs are characterized by an emphasis onconcepts such as CAIV in which costs are given equal importance toperformance and schedule. Levels of mission performance above theagreed-upon threshold values can be traded for cost savings if the de-termination is made that the extra increment of performance is notworth the extra cost. These programs can feature contractor configu-ration control and design flexibility to allow insertion of commercialor dual-use technology. Military specification reform and IPTs areused to implement these changes.____________5 The earlier RAND study concluded that relief from regulatory compliance affected over-head costs and would typically be accounted for in the labor rates used for cost estimates.The SE/PM data we used were not detailed enough to examine the effects on labor rates.Multiyear procurement savings typically would be associated only with production contracts.They are largely associated with savings at the subcontractor level and would not typicallyaffect the prime contractor SE/PM costs we investigated in this study.

40 SE/PM: Trends and Costs for Aircraft and Guided Weapons Programs
Figure 3.11Guided Weapons SE/PM as a Percentage of Production Cost for SuccessiveProduction Lots
RAND MG413-3.11
0
10
20
30
40
50
60
70
1 2 3 4 5 6 7 8 9 10
Lot number
SE/P
M p
erce
nta
ge
Average SE/PM percentage across programs
Another area of commercial-like acquisition is the use of evolu-tionary acquisition. Evolutionary acquisition has recently been pro-moted in an attempt to reduce the time required for systems to beproduced and fielded. The 5000 series6 DoD Directives (DoDDs)recommend the use of evolutionary acquisition as a way to increasethe responsiveness of the acquisition system by emphasizing the useof available technology to deliver systems in the shortest time possi-ble. This evolutionary approach is designed to deliver capability inincrements, with the upfront knowledge that future capability im-provements will be necessary.7 As stated in DoDD 5000.2, “The suc-____________6 Department of Defense Directive (DoDD) 5000.1 (DoD, 2003) and DoDD 5000.2(DoD, 2003b) define management principles that should be used when managing acquisi-tion programs within DoD.7 Spiral development and incremental development are two methods used to execute evolution-ary acquisition. Spiral development is defined as the process by which the desired capabilityis known, but the end-state requirements are not known, at the start of a program. Incre-mental development is similar to spiral development, with the exception that the end-staterequirement is known in advance.

Cost Trends in Systems Engineering and Program Management 41
cess of the strategy depends on consistent and continuous definitionof requirements, and the maturation of technologies that lead to dis-ciplined development and production of systems that provide in-creasing capability towards a material concept (DoD, 2003b).” Riskmanagement and user feedback are used to keep the developmentproceeding in the right direction.
The three types of acquisition reform (reduced use of militaryspecifications [MILSPECs] and MILSTDs, use of IPTs, and use ofevolutionary acquisition) could all potentially affect SE/PM costs on agiven program. Reduction in the use of MILSPECS may alleviatesome of the constraints an engineer faces with a given design and thuslead to cost savings. However, this change may require some newcommercial specifications to be developed and used, complicating theSE/PM work and making it more costly to accomplish. The use ofIPTs could benefit the design process by including more inputs ear-lier in the program before the design is frozen, which could help theprogram avoid costs that would not have been anticipated withoutthis forum for discussion. However, IPTs require more consensusbuilding, which could result in more effort and time to come toagreement on a design and, thus, increase SE/PM costs in develop-ment. Evolutionary acquisition requires risk analysis to understandhow the development is coming along and also requires continuousreassessment of system requirements. This acquisition approach al-lows for systems to be fielded with the understanding that future up-grades will be made to better meet the user’s needs. However, it alsorequires a large amount of coordination given that each design releasemay resemble a “mini-acquisition” within the larger program. Insummary, it is unclear if these changes would increase or decreaseSE/PM costs. Each of these initiatives is discussed below.
Military Specification Reform
Since the time of World War II, the Department of Defense hadbeen establishing a library of specifications and standards for definingcomponents, materials, processes, testing procedures, and quality-control techniques for use in procuring defense material. The goal ofdeveloping these specifications was to develop a common terminology

42 SE/PM: Trends and Costs for Aircraft and Guided Weapons Programs
to facilitate communication among engineers regarding complexideas. The government used these specifications and standards to en-sure that the contractors bidding on work understood what was re-quired and to verify that each contractor complied with the require-ments of the contract.
In the early 1990s, changes in the defense acquisition environ-ment, including a smaller defense industrial base, a rapid change inthe pace of technology, and a decreasing DoD workforce, precipi-tated a change in dependence on military specifications and stan-dards. As of July 1994, about 45,000 MILSPECs and MILSTDswere in existence (DoD, Office of Undersecretary of Defense [Acqui-sition, Technology & Logistics] 2001).8 It was often stated that thesedetailed military requirements constituted a barrier to the entry ofnew commercial contractors and products to the military acquisitionprocess. DoD was no longer high-tech industries’ dominating buyer,and it wanted a means for accessing the most up-to-date technologyin a cost-effective manner.
In June 1994, as part of the acquisition reform effort, DoD de-creed an end to military standards other than performance specifica-tions. A memorandum titled “Specifications and Standards—A NewWay of Doing Business,” by Secretary of Defense William Perry,cited a goal for DoD to increase its access to commercial state-of-the-art technology and allow for dual-use processes and products fromthe commercial sector in the military as a way to expand the potentialindustrial base for military equipment and services. The memo statedthat this expanded industrial base would be capable of meeting de-fense needs at lower costs. A second goal stated in the memo was theremoval of impediments to integration of commercial componentsinto military systems. A final goal was to speed up the weapons-system development process, which typically took 12 to 15 years tofield a new system. Evolutionary acquisition hopes to take advantageof what is perceived to be a faster introduction of technology, as isdone in the commercial sector.____________8 This number reflects not only military specifications and standards but also nongovern-ment standards, commercial-item descriptions, and other documents.

Cost Trends in Systems Engineering and Program Management 43
In response to this memo, the Deputy Under Secretary of De-fense (Acquisition Reform) chartered a Process Action Team to de-velop a strategy to reduce the reliance on MILSPECs and MILSTDs.In 1994, Secretary of Defense Perry approved the Process ActionTeam’s recommendation “to use performance and commercial speci-fications and standards in lieu of military specifications and stan-dards, unless no practical alternative exists to meet the user’s needs(Perry, 1994).” Due to this policy, MIL-STD-499(A), which estab-lished the systems engineering process, was cancelled, and a final ver-sion of MIL-STD-499(B) was not released.
The Director of Systems Engineering within OSD asked that agroup of organizations collaborate to develop a commercial systems-engineering standard to replace the military one. The working groupwas called the Electronic Industries Alliance (EIA) and was composedof members from DoD, the Aircraft Industry Association (AIA), Na-tional Security Industrial Association, Institute of Electrical and Elec-tronics Engineers (IEEE), and the International Council on SystemsEngineering (INCOSE). The resulting SE standard to replace MIL-STD-499 was called EIA-632. In parallel, the IEEE developed IEEE-1220, and the International Organization for Standardization (ISO)along with the International Electrotechnical Commission (IEC)jointly developed ISO/IEC-15288. These three commercially derivedstandards each address the systems-engineering process at various lev-els9 and would all be needed to fully accomplish systems engineeringwithin an organization.
The early 1990s also saw the advent of systems engineering ca-pability-assessment models. The difference between standards andcapability models is in their purpose. Standards are meant to providean organization with processes that, if used properly, will result in aneffective and efficient means for engineering a system. Capability as-sessment models are used to identify how well the standards are being____________9 ISO/IEC 15288 covers the life cycle of a system from concept to retirement. EIA 632 isthe next lower-level standard, which addresses the processes for engineering a system (i.e.,what to do). IEEE 1220 defines the process at the task or application level. See Defense Ac-quisition University (2004a).

44 SE/PM: Trends and Costs for Aircraft and Guided Weapons Programs
implemented and point out process improvement. The primary goalof a capability model is to evaluate a program’s systems-engineeringcapability. During the early 1990s, the Software Engineering Institute(SEI) developed various versions of the Capability Maturity Model(CMM) that was later extended to systems engineering processes.
It is difficult to determine exactly what impact the cancellationof certain military specifications and standards had on the cost of de-veloping and procuring weapons systems. Many in industry did notanticipate the speed of the outright cancellation of many of the mili-tary standards. The government called for the creation of hundreds ofnongovernment standards to be created by industrial associations,which could not keep up with the demand. In several instances, mili-tary standards were merely renamed and left intact as commercialstandards.
Several pilot programs were selected to incorporate these new re-form ideas into their acquisition strategies. In particular, the JointDirect Attack Munition (JDAM) and the Joint Air-to-Surface Stand-off Missile (JASSM) programs both attempted to take advantage ofthe new acquisition philosophy. JDAM is essentially a strap-on guid-ance tail kit used on “dumb” bombs, giving them much improvedaccuracy by using the global positioning system (GPS) and an inertialmeasurement unit (IMU) to provide course correction updates to thecontrol fins during flight. JASSM is a much more complicated muni-tion that was a follow-on program to the Tri-Service Standoff AttackMunition (TSSAM), which failed due to performance shortfalls andcost increases. These programs were some of the first to look at re-ducing the number of specifications by defining only a few top-levelperformance requirements and allowing contractors great latitude tomake trade-offs to lower cost. In the case of JDAM, there were 87MILSPECs in the predevelopment program RFP, the majority ofwhich were eliminated by the time of the development phase (Lorelland Graser, 2001). In the case of JASSM, only three broad KPPs

Cost Trends in Systems Engineering and Program Management 45
were stipulated to be nonnegotiable: range, missile effectiveness, andaircraft carrier compatibility.10
One of the objectives of this study is to determine what, if any,adjustment should be made to SE/PM cost estimates for future pro-grams based on acquisition reform. Because both the JDAM andJASSSM programs have been through development, this report com-pares the SE/PM development cost of these programs to the sampleof guided weapons development programs for which we collecteddata. We compare, in a limited way, the SE/PM costs for thesestreamlined programs to the SE/PM costs for programs that weredeveloped using the conventional acquisition process.
Integrated Product Teams
Along with the introduction of military specification reform, the Sec-retary of Defense in May 1995 directed that Integrated Product andProcess Development (IPPD) with IPTs be used throughout the ac-quisition process. DoD defines IPPD as follows: “A managementprocess that integrates all activities from product concept throughproduction/field support, using a multifunctional team, to simulta-neously optimize the product and its manufacturing and sustainmentprocesses to meet cost and performance objectives” (DoD, 1996).Rather than using a long, sequential approval process that had be-come the norm, IPPD attempts to drive down the decisionmaking tothe lowest level possible through the use of dedicated teams ofstakeholders, the IPTs.
An IPT brings together stakeholders with specific relevant expe-rience and concerns who are committed to delivering a product to acustomer. (In the case of DoD acquisition, the military user is typi-cally considered the customer.) The expectation is that the teammembers will feel free to voice their concerns about a program andwill be empowered to resolve issues in a cooperative fashion. If issuescannot be resolved at lower levels, the DoD model suggests that theseissues be brought to a higher level for resolution. The goal of this____________10 JASSM added one more KPP, to address interoperability, in 2000.

46 SE/PM: Trends and Costs for Aircraft and Guided Weapons Programs
framework is to bring together individuals with a wide array of exper-tise to work out issues jointly. Theoretically, this process should allowfor a broader collection of alternatives for consideration and a quickerresolution of problems to produce a product more responsively.
As shown in Figure 3.12, the DoD IPPD framework11 consistsof IPTs at various levels that are used to execute and oversee acquisi-tion programs. IPPD is a management philosophy that uses multidis-ciplinary teams composed of representatives from engineering andother technical specialties (including business and financial analysts)who along with customers achieve the best design.
Starting at the bottom of the framework, the Program IPT typi-cally performs the execution of the specific activities on the program.The Program IPT is composed of government representatives, whosupport the program office, and contractor personnel, who work forthe contractor that was awarded the work. The specific functionalexperts from both the government and the contractor are expected towork together to discuss and resolve issues in their respective areas.
The next levels of IPTs are composed of government personnelwho are responsible for the oversight and review of the program.12
Each working-level IPT (WIPT) is composed of experts in a specificfield representing different organizations with different points ofview. Representatives from the WIPTs participate at the next-higherlevel—the Integrating IPT (IIPT). An IIPT is typically a multidisci-plinary group in which WIPT representatives raise higher-level issuesabout the program. The next level of oversight is the OverarchingIPT (OIPT), whose role is to provide strategic guidance and resolveissues raised by the WIPT and IIPT. The ultimate authority for ac-quisition programs resides with the Milestone Decision Authority(MDA), who reviews the OIPT’s input and resolves issues raised bythe OIPT to enable a program to obtain approval to proceed to the____________11 This framework is described in DoD (1999).12 Industry personnel may participate in WIPT or IIPT meetings to present information,advice, and recommendations, but they are not part of government deliberations. See DAU(2004, Section 10.3.3, “Industry Participation”).
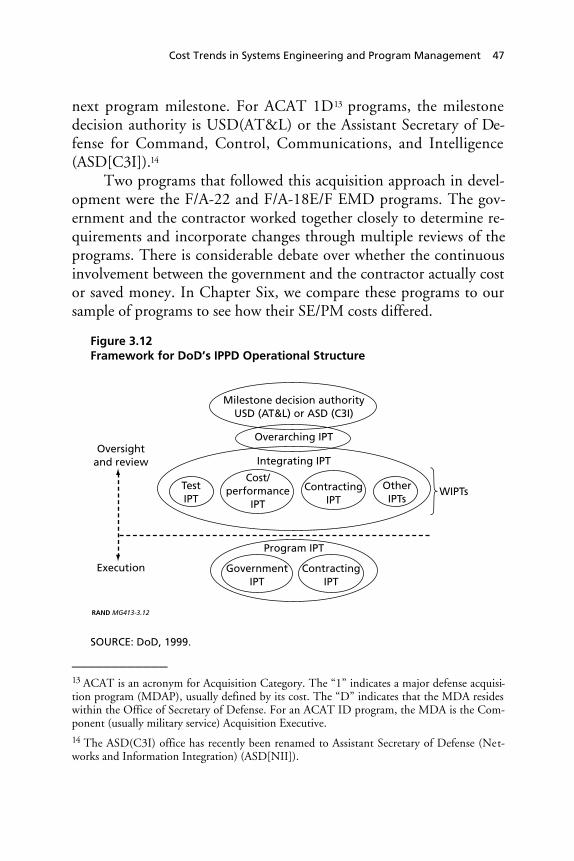
Cost Trends in Systems Engineering and Program Management 47
next program milestone. For ACAT 1D13 programs, the milestonedecision authority is USD(AT&L) or the Assistant Secretary of De-fense for Command, Control, Communications, and Intelligence(ASD[C3I]).14
Two programs that followed this acquisition approach in devel-opment were the F/A-22 and F/A-18E/F EMD programs. The gov-ernment and the contractor worked together closely to determine re-quirements and incorporate changes through multiple reviews of theprograms. There is considerable debate over whether the continuousinvolvement between the government and the contractor actually costor saved money. In Chapter Six, we compare these programs to oursample of programs to see how their SE/PM costs differed.
Figure 3.12Framework for DoD’s IPPD Operational Structure
RAND MG413-3.12
Milestone decision authorityUSD (AT&L) or ASD (C3I)
Program IPT
Overarching IPT
Integrating IPT
TestIPT
OtherIPTs
Cost/performance
IPT
ContractingIPT
GovernmentIPT
ContractingIPT
WIPTs
Oversightand review
Execution
SOURCE: DoD, 1999.
____________13 ACAT is an acronym for Acquisition Category. The “1” indicates a major defense acquisi-tion program (MDAP), usually defined by its cost. The “D” indicates that the MDA resideswithin the Office of Secretary of Defense. For an ACAT ID program, the MDA is the Com-ponent (usually military service) Acquisition Executive.14 The ASD(C3I) office has recently been renamed to Assistant Secretary of Defense (Net-works and Information Integration) (ASD[NII]).

48 SE/PM: Trends and Costs for Aircraft and Guided Weapons Programs
Evolutionary Acquisition
Evolutionary acquisition is an alternative acquisition approach, theuse of which has recently been encouraged for acquiring weapons sys-tems.15 The impetus behind EA is that the typical serial acquisitionapproach used by DoD takes too long to get a program through de-velopment and into the field. EA was first applied to software-dominated Command, Control, Communications, and Intelligence(C3I) systems in which change was occurring so rapidly that it wasdifficult to define in detail the operational capabilities before startingEMD. Also, industry technology was being driven more by the mar-ketplace than by DoD, and the development-cycle time within indus-try was much shorter than the typical development time required fora DoD program. In 2003, DoDDs 5000.1 and 5000.2 formally en-dorsed EA as the “preferred DoD strategy for rapid acquisition of ma-ture technology for the user,” expanding its use beyond C3I programsto all DoD acquisition programs.
The EA construct attempts to “deliver capability in increments,recognizing, up front, the need for future capability improvements”(DoD, 2003b). The construct calls for consistent and continuous up-dating of requirements and evaluation of technologies available tomeet those requirements. Both users and independent testing organi-zations need to be involved to provide the necessary feedback on howwell industry has identified and applied the new technologies. All ofthese efforts need to be balanced against time, cost, and overall priori-ties. Each EA increment can be treated as an individual acquisitionprogram within a larger program. Figure 3.13 shows how the EAprocess can be modeled; it depicts the incremental progression of theprogram through the release of block versions of a system and theheavy involvement of the user in the development process.____________15 Preplanned product improvement and block upgrade programs are precursors to evolu-tionary acquisition.

Cost Trends in Systems Engineering and Program Management 49
Figure 3.13Evolutionary Acquisition Model
RAND MG413-3.13
Design OperationsProduction/operations
Systemtesting
Integrationtesting
Feedback from users
Block C
Design OperationsProduction/operations
Systemtesting
Integrationtesting
Feedback from users
Block B
Design OperationsProduction/operations
Systemtesting
Integrationtesting
Feedback from users
Block A
Hardware and software
Systemrequirements
User inputs
Systemdesign
SOURCE: Defense Systems Management College, 1995.
Because the EA concept has only recently been formally appliedto weapons acquisitions, the information for assessing its effect onSE/PM is limited. The Global Hawk program used EA as an acquisi-tion technique, but the program was an Advanced Concept Technol-ogy Demonstration (ACTD) program, and historical costs were notavailable in the government databases used for this study. Some of thecontractors we contacted suggested that it would be useful to considerP3I development programs as surrogates for EA programs. One suchprogram is the Joint Standoff Weapon (JSOW). The program soughtto develop a common “truck” missile airframe that was concurrentlymodified to accommodate new sensors and payloads. We used cost

50 SE/PM: Trends and Costs for Aircraft and Guided Weapons Programs
data from the JSOW program as a surrogate for EA to attempt to de-termine the impact on SE/PM cost estimates.
Summary
SE/PM represents a significant portion of development and produc-tion costs for both aircraft and guided weapons systems. Since the1960s, SE/PM costs for aircraft development programs are increasing,while they are holding steady for guided weapon development pro-grams. The split between systems engineering and program manage-ment costs is roughly 50/50, with guided weapons programs costsshowing a slight tilt toward systems engineering. In production, wesee a large amount of variation in SE/PM costs. Changes to the de-sign process from incorporation of new acquisition initiatives, such asmilitary specifications and military standards reform; the use of IPTs;and the implementation of evolutionary acquisition may affectSE/PM costs.
In the next chapter, we explore methods of estimating SE/PMcosts that have been used in the past by both the government and byprime-level contractors. We also highlight the findings from the in-terviews we conducted with contractors to determine what costs theyinclude in SE/PM and potential cost drivers that could be used toestimate SE/PM costs.

51
CHAPTER FOUR
Cost Data Findings and Current EstimatingApproaches
We collected information for this report primarily through twomeans: (1) reviewing historical cost and schedule information fromgovernment reports and some internal contractor accounting infor-mation and (2) conducting discussions with government and prime-level defense contractor personnel who develop cost estimates forprograms. (A copy of the questionnaire we used for interviewing con-tractors is in Appendix C.) From our discussions with contractor per-sonnel, we found that the historical cost data are not always consis-tent in terms of which data are reported under each WBS element.We found that the current government cost-estimating methods tendto be high level and do not explicitly estimate SE/PM costs. Industrypersonnel use different methods to estimate SE/PM depending on thepurpose of the estimate and how much is known about the program.
Cost and Schedule Data Sources
We collected the cost data from a variety of sources. For most aircraftdevelopment programs, we obtained copies of CCDRs or CPRs fromthe Defense Cost and Resource Center. 1 For three development pro-____________1 CCDR reporting is required for all ACAT 1 programs by DoD Directive 5000.4M (1992)and generally uses a product-oriented WBS to categorize costs. The goal of collecting costdata according to this WBS is to create a database of common cost information across differ-ent programs for systems within the same commodity (e.g. aircraft, guided weapons). TheCCDR also separates the nonrecurring and recurring costs typically associated with a con-tract. The reporting requirement is flowed down to supporting contractors who perform a

52 SE/PM: Trends and Costs for Aircraft and Guided Weapons Programs
grams, we used internal company reports. For most aircraft produc-tion programs, we used a database of costs taken from CCDRs thatwas developed by an analyst at the Air Force Cost Analysis Agency(AFCAA) in the late 1990s. This database provided the then-yearcosts for programs by major WBS elements. The database referencedthe contract number and date of each CCDR used as a primarysource. For most programs, the database referenced a more completeand timely set of CCDRs than we were able to obtain elsewhere. Fora few production programs that were not in the database fromAFCAA, we obtained copies of CCDRs. For guided weapons devel-opment and production programs, we primarily used the CCDRcosts reported in the August 2000 Tri-Service Missiles and MunitionsDatabase. For the remaining weapons programs, we obtained copiesof CCDRs from other sources.
Because we observed that the duration of a contract could play apart in the analysis of cost, we obtained major milestone dates fromSelected Acquisition Reports (SARs)2 that detailed when the contractwas awarded, the first flight, the end of the development test, and thefirst production delivery. We supplemented the data found in theSARs with schedule data found in external open-source publications.The schedule information was used to determine the duration of thedevelopment contract by measuring the number of months from con-tract award to each of the major milestones.______________________________________________________significant portion of the work. CPR reporting is used during the execution of the contractto measure the status of the work being performed and to document program expenditures.Unlike the CCDR, it does not separate the nonrecurring and recurring costs, but otherwise itdoes typically use a similar WBS cost breakout.2 SARs are status reports provided to Congress that are required by Title 10, USC 2432, forMajor Defense Acquisition Programs (MDAPs). They provide information that covers pro-gram background, schedule, performance characteristics, funding summaries, and top-levelcontract information on the program. The schedule shows major design milestones withinthe program as it progresses from development to production and fielding. The fundingsummaries show the yearly amount of funding for the various appropriations that are usedfor the program. Typically, SARs are produced at the beginning of development and thenannually at the end of the calendar year, but they may be required to be produced more fre-quently if there are significant changes in a program.

Cost Data Findings and Current Estimating Approaches 53
Cost Data Findings
For several decades, contractors were required to report costs to thegovernment using a variety of standard reports. The primary govern-ment reports are the CCDR and the CPR. For the government tostandardize cost reporting for developing a cost database, a standardWBS is used to categorize costs. MIL-HDBK-881 (DoD, 1998) pro-vides the sample WBS by commodity (e.g., aircraft, ship, missile) thatcan be tailored for the specific content of the program.
The source of the cost data that feed into the government re-ports is the contractor’s accounting system. Because the cost ac-counting structure of most contractor’s accounting systems will notmatch the approved program WBS, costs are allocated or groupedinto the government-approved program WBS for reporting purposes(referred to as a “cross-walk” between the accounting system and thecost report). Because of the long-standing requirement for cost re-porting, the system produces a useful high-level database of programcosts for many systems. The fidelity and consistency of cost reportingtend to decrease at lower levels of the WBS and for smaller-sized pro-grams. Because systems engineering and program management re-quire multiple disciplines to be involved in the evolution of a pro-gram’s design, making sure that the appropriate efforts are trackedand accounted for can be difficult. We started with the government’sdefinition of SE/PM costs, found in MIL-HDBK-881, and tried todetermine how consistent various military contractors are in how theydefine SE/PM in their accounting systems.
MIL-HDBK-881 Definition of SE/PM
As described above, MIL-HDBK-881 (DoD, 1998) provides a guidefor developing a WBS for detailing the work to be performed on aprogram.3 It states that SE includes “the overall planning, directing,and controlling of the definition, development, and production of asystem or program including supportability and acquisition logistics,____________3 The complete MIL-HDBK-881 excerpt that defines the content of systems engineeringand program management costs is in Appendix B.

54 SE/PM: Trends and Costs for Aircraft and Guided Weapons Programs
e.g., maintenance support, facilities, personnel, training, testing, andactivation of a system. [It] excludes systems engineering/programmanagement effort that can be associated specifically with the equip-ment (hardware/software) element.” MIL-HDBK-881 defines PM as“the business and administrative planning, organizing, directing, co-ordinating, controlling, and approval actions designated to accom-plish overall program objectives which are not associated with specifichardware elements and are not included in systems engineering.”
The difficulty with both of these definitions is the stated exclu-sion of actual design/production engineering and management di-rectly related to the WBS element with which they are associated. Inpractice, this definition is difficult to apply consistently within aproduct commodity, within a company, or for an entire program.Systems engineering is so intimately tied to hardware and softwaredesign that it is difficult to determine how to separately account foreach. Also, with the flow down of requirements to subcontractors,some systems engineering is also done at the subcontractor level. Fi-nally, following the mergers and acquisitions that occurred in the de-fense industry during the 1990s, each of the major DoD prime con-tractors is composed of several previously stand-alone companies.This change, along with continuing pressure to reduce overhead, hasresulted in accounting systems that are continually changing at eachof the major contractor organizations.
Definitions Across Multiple Contractors
To try to understand the differences in the definitions of Systems En-gineering and Program Management, we gathered information fromcontractor proposals, WBS dictionaries, and discussions with variouscontractors. To get a cross section of the industry, we obtained a rep-resentative detailed subtask breakout for the major suppliers of air-craft and weapons. Table 4.1 compares the subtasks that various con-tractors (companies) report under SE and PM.

Cost Data Findings and Current Estimating Approaches 55
Table 4.1Comparison of Contractors' Systems Engineering and Program ManagementSubtasks
Contrac-
tor AContrac-
tor BContrac-
tor CContrac-
tor D
Systems Engineering SubtasksSystem safety X X X XReliability X X X XHuman factors X X XMaintainability X X XProducibility X X XSurvivability/Vulnerability program X X XQuality assurance X X XRequirements allocation/Validation X X XRisk management X XStandards X XElectromagnetic compatibility/
Lightning strike X XDTC/LCC program X XTest equipment X XSystems engineering management X XConfiguration integration X XOperations analysis XCorrosion prevention program XMass properties XTechnical baseline documents XTechnical integration XPilot-vehicle interface XParts standardization XWeapons integration XIntegrity XLogistics support analysis XDepot and intermediate rework analysis XFacilities program XSupport equipment program XSpare and repair parts program XTraining systems program X

56 SE/PM: Trends and Costs for Aircraft and Guided Weapons Programs
Table 4.1—Continued
Contrac-
tor AContrac-
tor BContrac-
tor CContrac-
tor D
Program Management SubtasksPlanning and control X X X XData management X X X XConfiguration management X X X XProgram management X XLogistics support management X XSupport equipment X XProgram independent analysis XTechnical plans and controls XDrawing control and maintenance XQuality assurance management XManufacturing management XIntegrated logistics data XTraining XForeign customers XProgram office XDTC/LCC program XILS demonstration and evaluation X
As shown in Table 4.1, there are subtask elements in commonacross contractors, but also many differences among them. Systemssafety, reliability, human factors, maintainability, producibility, sur-vivability/vulnerability, quality assurance, and requirements alloca-tion/validation tend to be included in systems engineering on a con-sistent basis across most contractors. Some of the differences in SEtasks may be due to accounting differences among the contractors,and they may be incorporated in other WBS elements. Several de-tailed areas of systems engineering (e.g., test equipment, mass proper-ties, pilot-vehicle interface, and weapons integration) potentiallycould be associated with hardware design and violate the MIL-HDBK-881 definition of systems engineering.
For PM subtasks, planning and control, data management, andconfiguration management tend to be consistently reported across thecontractor sample. However, there are subtasks that are included inSE for one contractor and in PM for another. Specifically, the

Cost Data Findings and Current Estimating Approaches 57
DTC/LCC effort is accounted for under both SE and PM. Forguided weapons programs, we also found that some of the systemsengineering effort was outside the normal SE WBS cost category. Thetraditional SE that concerns itself with the integration of the variouscomponents of the guided weapon was accounted for under the nor-mal SE category. A second type of SE that includes the activities forintegration of the missile on the various aircraft platforms was foundin a separate WBS category. This platform-integration element in-cludes activities such as systems requirements verification, testability,human factors, environmental protection, survivability engineering,environmental qualification, aircraft integration and interface docu-mentation, and systems validation.
Definition of SE/PM Within a Single Company
We found from our discussions with contractors that even within asingle company the definition of the content of SE/PM may changefrom program to program. As shown in Table 4.2, data from fiveprograms within a single company are presented. SE/PM hours werecollected across four sub-areas: SE (non-ILS), SE (ILS), PM (non-ILS), and PM (ILS). We found that work in each of these sub-areasshowed differing content from program to program. Further, wefound that within the SE (non-ILS) sub-area, there are work hoursthat could potentially violate the MIL-HDBK-881 definition thatexcludes design and test work from the SE/PM WBS element. Theelements such as strength analysis, design support, design loads analy-sis, and mass properties could be classified as air vehicle hardware de-sign, and the elements such as test support and flutter and vibrationanalysis could be classified as system test and evaluation.
Even though there are differences among contractors and acrossprograms in which tasks are included in the SE and PM categories,the functions they have in common represent the cost drivers ofSE/PM costs. Figure 4.1 shows the cost breakout of the lower-levelSE/PM tasks for a sample program.

58 SE/PM: Trends and Costs for Aircraft and Guided Weapons Programs
Table 4.2Single Contractor's SE/PM Subtasks Across Programs
Program
AProgram
BProgram
CProgram
DProgram
EProgram
F
Systems Engineering (Non-ILS)
Technical Support X X X X X X
Other support X X X XSurvivability/
Vulnerability X X X X
LCC/DTC program X X XStructural design
criteria X X
Producibility program X XStandardization
program X X
Strength analysis X
Design support X
Test support X
Design loads analysis X
Mass properties X
Systems analysis XFlutter and vibration
analysis X
Configuration control X X X X XReliability/Maintainability
program X X X X
Other systems engineering X X X XAir vehicle/Subsystem
analysis X X X
Safety engineering X X X
Human factors engineering X X X
System verification X XSustaining engineering
(non-ILS) X X
Quality assurance program X
Environmental analysis X
Systems Engineering (ILS) X
Logistics support analysis X X X X X
Other X X X X X
Facilities program X XSupport equipmentprogram X

Cost Data Findings and Current Estimating Approaches 59
Table 4.2—Continued
Program
AProgram
BProgram
CProgram
DProgram
EProgram
F
Systems Engineering (ILS)—continued
Spare and repair parts X
Training system analysis X
Program Management (Non-ILS) Planning and control/
configurationmanagement X X X X
Other project management X X X X X X
Travel X X
Data management X X
Security X X
Proposal preparation X XProgram management/
technical/productionreadiness reviews X X
Technical exchanges XSupport to project
management XMiscellaneous project
management X
Program Management (ILS) XILS planning and
management X X XILS demonstration and
evaluation X
Contractor support plans XOther project management(ILS)
X
Government Approaches to Estimating SE/PM Costs
For both aircraft and weapons development programs, we found thatgovernment cost-estimating techniques generally address the totalnonrecurring engineering or development cost of a program and usean allocation scheme to extract the SE/PM effort for the developmentprogram instead of attempting to estimate SE/PM costs directly. For

60 SE/PM: Trends and Costs for Aircraft and Guided Weapons Programs
Figure 4.1Detailed SE/PM Cost Breakout for a Sample Program
Program ManagementFunction
Systems EngineeringFunctions
RAND MG413-4.1
ILS demonstration and evaluation, 1%ILS planning and management, 3%
Program independent analysis, 2%
Planning and control, 29%
Configuration/ data management, 7%
Procurement, 8%
Other PM (non-ILS), 7%
ILS functions
Non-ILS functions
51%
6%
17%
26%
Human engineering, 1%Safety engineering, 1%
Quality assurance, 1%Reliability, 5%
Maintainability/corrosionprevention, 5%Survivability/vulnerability, 3%
LCC/DTC, 1%Standardization/electromag-netic/mass properties, 4%Other SE (non-ILS), 2%
Requirements management, 2%
LSA, 6%
Support equipment/facilities, 8%
Spare and repair parts, 2%
Training systems analysis/other 1%
aircraft programs, the Joint Strike Fighter (JSF) program office sharedtheir technique for estimating SE/PM costs. For missile programs, wediscussed a CER used by the Naval Center for Cost Analysis(NCCA)4 for estimating the engineering effort for development.
The JSF program uses a CER to estimate the total nonrecurring,non-test engineering (NNTE) hours based on data from six recentfighter attack aircraft development programs.5 NNTE hours repre-sent the total engineering development associated with the program,excluding the engineering associated with the contractor test effort.The CER parameters used as independent variables are the WE of theaircraft, the percentage of structural weight that is made of compos-____________4 NCCA was reorganized in 2002 and is now a division within the Office of Budget thatreports to the Navy’s Financial Management and Comptroller. It has since been renamed theNaval Cost Analysis Division.5 The JSF NNTE CER was jointly developed by representatives from various DoD costagencies including the Naval Air Systems Command, the Aeronautical Systems Center, andthe Air Force Cost Analysis Agency.

Cost Data Findings and Current Estimating Approaches 61
ites, and a “next-generation variable.”6 Based on historical ratios ofSE/PM to total design engineering, an allocation of 25 percent of thetotal NNTE hours is allocated to SE/PM.
As with the CER used by the JSF program for estimating aircraftdevelopment engineering and SE/PM costs, NCCA regularly uses aCER for estimating total nonrecurring engineering hours for missiledevelopment. The CER uses three independent variables for deter-mining engineering development hours: the cumulative average re-curring cost of the first 1,000 units produced, the EMD phase devel-opment time, and an adjustment factor to decrement the number ofhours for a product improvement program. No specific allocation ismade to determine how much of this effort is associated with SE/PM.
Both the JSF and NCCA methods for estimating the nonrecur-ring engineering hours for an aircraft or missile development yield anestimate of the total hours including the SE/PM effort. These ap-proaches have the advantage in that they relate the historical datafrom previous programs to the program of interest and make surethat all the engineering hours are accounted for in the final result.However, there is no direct estimate of the appropriate amount ofSE/PM effort required.
For production programs, we found that the government uses avariety of approaches to estimate SE/PM costs. Again, early estimateson the JSF program estimated SE/PM costs as a part of sustainingengineering costs using parametric equations relating cost to such fac-tors as weight, material complexity, and the number of units pro-duced. It relied on cost data from five different fighter and attackprograms. For a recent guided weapon program, NCCA used a factorof recurring hardware cost based on cost data from a prior programthat varied from lot to lot. Both approaches used a limited amount ofinformation (more like an analogy approach) rather than a generalcross-section of program cost information.____________6 The next-generation variable tries to capture the additional cost of a low observable designthat includes internal carriage of weapons, weight criticality, and tightly packed avionics andsubsystems.

62 SE/PM: Trends and Costs for Aircraft and Guided Weapons Programs
Estimating Approaches Used by Industry: GeneralMethods
In our discussions with prime weapons systems contractors, welearned that contractors use different cost-estimating approaches de-pending on the phase of a program’s life cycle and the purpose for theestimate. The three major phases of a life cycle are initial develop-ment, initial production, and the changes required after initial pro-duction has begun and units are fielded. The purpose of an estimatechanges as a program becomes more defined. Generally, the totalSE/PM cost is estimated at the aggregate level, but the lower-leveltasks are tracked separately within the specific program contract.
Table 4.3 shows the various estimating approaches contractorsuse. The “Trade Studies” column represents programs that are veryearly in their conception, and estimates are required at a gross level tochoose from various program alternatives. “Rough order of magni-tude” estimates are performed when a desired program alternative ischosen, but a large amount of uncertainty about program specificsstill exists. “Budgetary” estimates are performed when the chosenprogram alternative requires a greater level of detail over the perform-ance period that the program will cover. “Firm” cost estimates arerequired when a contractor is providing a bid on a program for which
Table 4.3Contractors’ SE/PM Estimating Approaches
Estimate Purpose
Phase of ProgramLife Cycle Trade Study
Rough Orderof Magnitude Budgetary Firm
New development Top-down Top-down Top-downBottom-up
Bottom-upTop-down
CombinationNew production Top-down Top-down Top-down Top-down
Bottom-upChange Top-down Top-down
Bottom-upTop-downBottom-up
Top-downBottom-up

Cost Data Findings and Current Estimating Approaches 63
a definite scope of work has been defined. Firm estimates require themost amount of detail and the highest level of accuracy.
A “bottom-up” approach utilizes a variety of techniques basedon the task, the schedule, individual judgment, and parametric ap-proaches at a detailed level. This approach is generally used when theestimates are at a more mature stage and represent a firm quote. The“top-down” approach uses CERs at a gross or high level. The top-down approach is generally used early in a program when trade stud-ies and rough order of magnitude estimates are required. Analogies toprevious programs, in which specific comparisons with other pro-grams are made to develop estimates for the new program, can beused for either the bottom-up (at a detailed level of cost) or the top-down (performed at a higher level of cost aggregation) approach.These analogies are used in either early program estimates or for afirm final estimate.
Estimating Approaches Used by Industry: DevelopmentPrograms
To determine the methods that DoD contractors use to estimateSE/PM costs, we reviewed several recent proposals that showed vari-ous techniques that have been used on aircraft and missile programs.For development programs, three general methods are used to esti-mate SE/PM costs. The first uses a constant percentage of total or de-sign engineering hours. The second uses a percentage that varies withthe total design engineering hours. The third uses a level-of-effortbuild-up technique.
Figure 4.2 depicts variations on how SE/PM can be estimated asa constant percentage of the design effort. Each variation is differenti-ated by what is considered to be the “base” design effort and by whatis included in the percentage applied to the base cost. The base cost isfirst estimated parametrically or by using an analogy to other pro-grams deemed to be comparable to the program at hand. Each ofthese three constant-percentage approaches uses a percentage appliedto the base cost for determining SE/PM costs. The arrows in Figure

64 SE/PM: Trends and Costs for Aircraft and Guided Weapons Programs
4.2 indicate the base hours or costs that are used to multiply against acertain percentage to arrive at an SE/PM estimate.
For the NNTE allocation approach, the SE/PM hours are esti-mated along with engineering design and engineering technical staffhours. This method is a factored approach used in recent governmentestimates of aircraft development programs. NNTE hours are esti-mated parametrically. Using a historical percentage, the portion ofthe NNTE effort associated with SE/PM is determined and allocatedto the SE/PM WBS element. The NNTE allocation approach ac-knowledges the difficulty of separating out the SE/PM effort from theoverall engineering design effort by estimating all the NNTE hourstogether and allocating the hours back to the engineering design, en-gineering technical staff, and SE/PM categories.
The two other constant-percentage approaches portrayed inFigure 4.2 use the same engineering design base cost for determiningthe SE/PM costs, but they are used to determine SE/PM costs sepa-rately or along with engineering technical staff cost. When theSE/PM costs are estimated separately, we call it the “direct factor ofdesign” approach. When SE/PM costs are estimated along with engi-neering technical staff costs, we call it an “indirect factor of design.”In the direct-factor approach, the engineering design effort is esti-mated using parametric approaches or analogies to other programs.SE/PM costs are then directly estimated as a percentage of the design
Figure 4.2Variations on SE/PM Cost Estimating as a Constant Percentage of the DesignEffort
RAND MG413-4.2
Base
NNTEAllocation
Direct Factorof Design
Indirect Factorof Design
Base Base
NNTE
SE/PM
Engineering technical staff
Engineering design
+

Cost Data Findings and Current Estimating Approaches 65
cost. With the indirect-factor technique, SE/PM and engineeringtechnical staff support are estimated together as a factor of engineer-ing design hours. Engineering design hours include those associatedwith the wing, fuselage, empennage, landing gear, power subsystems,cooling systems, fuel systems, flight controls, electrical subsystems,cockpit systems, and weapons delivery systems. The tasks under engi-neering technical staff are more-general functions in which the tech-nical engineers are experts in a specific area and support the product-specific engineers assigned to the program. Those tasks includeweights/mass properties analysis, strength analysis, flight and groundloads analysis, structural dynamics, guidance and control, aerody-namics, thermodynamics, materials and processes, propulsion, loft,liaison, integrated design modeling, design quality, and observables.
The next major approach used by industry to estimate SE/PM isto use a percentage that varies according to the total design hours es-timated for a program. As the design hours of a program increase,those hours as a percentage of SE/PM decrease. Figure 4.3 plots thistrend (the curve) against cost data from five of the company’s histori-cal programs (SE/PM and technical support as a percentage of design
Figure 4.3SE/PM and Technical Support as a Percentage of Engineering Design HoursVersus Actual Design Hours
RAND MG413-4.3
Design hours
SE/P
M a
nd
tec
hn
ical
su
pp
ort
as
ap
erce
nta
ge
of
des
ign
ho
urs

66 SE/PM: Trends and Costs for Aircraft and Guided Weapons Programs
hours versus the actual design hours incurred on a program). (Actualpercentages are not shown in the figure to avoid presenting proprie-tary information.)
The third major approach that contractors use is a level-of-effortestimating technique, which was found in several proposals preparedfor EMD contracts. This approach estimates a headcount for specifictasks based on analogies to prior programs and multiplies theheadcount by an expected duration for the tasks to determine the es-timated hours. This method requires detailed knowledge of both thehistorical program used as a basis for the estimate and the new pro-gram to be estimated. The contractors also use expert judgment andparametric approaches for estimating SE/PM.
Estimating Approaches Used by Industry: ProductionPrograms
In production program estimates, the SE/PM engineering hours areusually part of the total production engineering hours that are esti-mated according to the specific type of engineering to be used. Forprojecting staffing for future production lots, one contractor we in-terviewed used a function of staffing hours versus the number of pro-duction lots. The annual number of staffing hours declined until thepeak production rate was reached and then flattened for the remain-ing production lots. Another contractor used lower-level CERs forestimating SE/PM associated with engineering change proposals. Thecommon base used for these estimates is the engineering design hoursmultiplied by a factor to account for the SE/PM costs.
Summary
Given the highly integrated nature of the work under the SE/PMcategory, we found differences in the definitions of what is includedin the cost data for SE/PM. We found differences across contractors

Cost Data Findings and Current Estimating Approaches 67
and within a single contractor. However, we found that the majorcost drivers within SE/PM tend to be consistently reported.
Our examination of the various government and industry ap-proaches to estimating SE/PM costs shows that different methods areused depending on the circumstances involved in each estimate. Themethods used by government tend to focus on estimating SE/PM aspart of the overall engineering effort and do not explicitly estimate acost for SE/PM. The methods used by industry vary depending onthe maturity of a program, the phase of the life cycle of a program,and the amount of information available about a program. Variouscontractors estimate SE/PM costs based on the amount of engineer-ing design effort required. Contractors use either a constant percent-age of design effort or a percentage that varies with the total designhours estimated. Level-of-effort approaches were also used to generatedetailed SE/PM cost estimates.
In the next chapter, we describe various analytic approaches toestimating SE/PM costs. We focus on methods that cost analysts canuse early in a program when the program’s content is still beingdefined.


69
CHAPTER FIVE
Analytic Approach for Estimating SE/PM Costs
In this chapter, we discuss our approach to developing cost-estimating methodologies, the process we used to choose cost drivers,the results of our data analysis, and our recommended cost-estimatingrelationships. The CERs we generated estimate SE/PM contractorcosts (less general and administrative [G&A] costs)1 in constant FY2003 dollars.
We developed a list of potential cost drivers during discussionswith weapon system contractors. The list was shortened considerablywhen we applied two criteria to each potential cost driver: Is it readilyquantifiable, and is it known and generally available to estimatorsearly in a program? This chapter covers the estimating parametersthat we chose to represent the potential cost drivers, the use and re-sults of regression analysis to empirically test our expectations, and arecommended set of CERs for SE/PM costs in aircraft and guidedweapons development and production programs. Appendix D liststhese variables (i.e., cost drivers) and the definitions for each. Appen-dix E contains correlation matrices for the variables considered foreach CER. Appendix F provides techniques for spreading a point es-timate for weapons system program development costs generated byCERs to produce a year-by-year expenditure profile.____________1 We used SE/PM costs without G&A expenses because our primary data for aircraft andguided weapons are CCDRs that report costs without G&A. Also, G&A costs can vary fromcompany to company, contract to contract, and year to year. A cost analyst using these CERsin developing estimates should account for this added expense using the specific G&A ratefor the program.

70 SE/PM: Trends and Costs for Aircraft and Guided Weapons Programs
Analysis of Potential Cost Drivers
We asked analysts at prime-level defense contractors what they be-lieve are the cost drivers for SE/PM that could be used as inputs toparametric CERs. We wanted to focus on program parameters thatcould be associated with historical SE/PM cost data and would beavailable to the eventual users of the CERs. We also sought quantita-tive measures that were consistently reported and could be used asinputs to our CERs. The contractors’ responses are summarized inTable 5.1.
As can be seen from Table 5.1, the size of a program, its dura-tion, system complexity, technical maturity, the amount of subcon-tractor work, number of reviews, and level of security were allthought to be potential drivers that could affect SE/PM costs. Systemcomplexity was defined more specifically by the number of sourcelines of code (SLOC) developed, the number of stated requirements,the number of drawings produced, the weight of the system, and the
Table 5.1Summary of Contractors’ Responses Regarding SE/PM Cost Drivers
Suggested Cost DriversContractor
AContractor
BContractor
C
Quantifi-cation
Possible?
Availableto Cost
Analyst?
Size of program X X Yes Yes
Duration X X Yes Yes
System complexity X X X No No
SLOC X X X Yes Yes
Number of requirements X Yes No
Number of drawings X X Yes No
Weight X X Yes Yes
Number of subsystems(LRUs) X Yes No
Technical maturity X X Yes No
Subcontract work X X Yes No
Number of reviews X X Yes No
Security X No No

Analytic Approach for Estimating SE/PM Costs 71
number of subsystems or line replaceable units (LRUs) in the plat-form. However, it is clear that it would be difficult to quantify someof these cost drivers, and the information might not be available to acost estimator at the beginning of a development program (quite pos-sibly before the contractor is chosen to perform the work).
Size of a program is a logical cost driver that is quantifiable andavailable to a cost analyst early in a program’s life cycle. It can bequantified consistently by using the cost of the initial developmentcontract. It is available to the cost analyst as a result of estimating thecost of the other various WBS cost categories and using that estimateas the cost driver for the SE/PM estimate.
Duration of a contract is another variable that has a logical rela-tionship to SE/PM and is quantifiable and available. However, dura-tion can be difficult to determine for historical programs. The begin-ning date is typically the date of the development contract award, butthe end of the development program can last well into the initial pro-duction lots for a program. The SE/PM effort also stretches across thetotal development contract and into the early production phase.
To determine what would be a good way to measure duration,we plotted SE/PM expenditures versus the percentage of the timeelapsed on various aircraft development programs and compared thisexpenditure profile to the occurrence of major program events. Fig-ures 5.1 and 5.22 show SE/PM expenditures and total weapon systemprogram expenditures against the program development time for twodifferent aircraft development programs. Major program events arealso shown on the horizontal axes of the figures. These figures showthat SE/PM expenditures occur throughout the development pro-gram, from contract award and beyond the end of developmental test(DT End).____________2 The data used to create Figures 5.1 and 5.2 are derived from semiannual contractor cost-data reports from two programs. Data from six other aircraft development programs werealso obtained and plotted in a similar fashion.

72 SE/PM: Trends and Costs for Aircraft and Guided Weapons Programs
Figure 5.1SE/PM Expenditure Profile over Time: Large Upfront SE/PM Effort
RAND MG413-5.1
0
5
10
15
20
25
0 10 20 30 40 50 60 70 80 90 100
Duration (percentage of total time elapsed)
Perc
enta
ge
of
dev
elo
pm
ent
con
trac
tex
pen
dit
ure
s
Total SE/PM
Total weaponsystem
Contractaward
PDR CDR First flight
1st production delivery
DT end
Design duration
Development duration
The expenditure data we plotted fell into two general categories:high up-front expenditures for SE/PM that preceded overall programexpenditures and SE/PM expenditures that tended to follow thetiming of the program expenditures. Figure 5.1 further shows a pro-portionally large amount of SE/PM spent up front in the program ascompared with the overall program expenditures for the contract.The program depicted in Figure 5.2 shows how SE/PM expenditurescan closely follow the timing of expenditures over the entire program.The data we collected on six other programs evenly fell into these twocategories. The figures also show that much of the effort is expendedby the first flight date and the expenditures continue through the testphase. The SE/PM expenditures generally tended to trail off after DTend, making DT end a reasonable point for measuring the end of the

Analytic Approach for Estimating SE/PM Costs 73
Figure 5.2SE/PM Expenditure Profile over Time: Program Expenditures CloselyFollowing Timing of Expenditures over the Entire Program
RAND MG413-5.2
4
0
2
8
12
16
20
10
14
18
6
Duration (percentage of total time elapsed)
Perc
enta
ge
of
dev
elo
pm
ent
con
trac
tex
pen
dit
ure
s
Total SE/PM
Total weaponsystem
Contractaward PDR
CDR First flight
1st production delivery
DT end
Design duration
Development duration
0 10 20 30 40 50 60 70 80 90 100
development program. We call the time from contract award to firstflight the design duration and the time from contract award to DTend the development duration. We use these two approaches to meas-ure the duration of the development program.
Several contractors suggested that there be some means formeasuring the complexity of a program. Some suggested measures ofcomplexity were SLOC, the number of requirements, the number ofdrawings, the weight, and the number of complex subsystems (suchas the number of LRUs). Except in the case of weight, we were un-able to determine good quantitative metrics that were consistentlyavailable from historical programs and that would be available fornew programs.
SLOC is a quantifiable measure available early in program de-velopment that a cost analyst could use for determining complexity of

74 SE/PM: Trends and Costs for Aircraft and Guided Weapons Programs
a program. However, there were some SLOC-count data available ona few of the more recent programs, but we could not find consistentdata on the bulk of the historical programs in our data set. To furthercomplicate the use of SLOC as a measure of complexity, there was noway to determine if the SLOC data we did have were consistent inthe methodology used to count the SLOC.3
The number of program requirements is a possible measure ofcomplexity that was suggested as a SE/PM cost driver. Although thenumber of requirements is a quantifiable variable, it may not be veryuseful for generating methods for early initial-development cost esti-mates. It is problematic as a measure of complexity because not allrequirements take an equal amount of work to achieve, and require-ments from one program to another can be very different. Recentprograms have tried to use a few top-level KPPs to focus on achievinga limited set of goals rather than the many detailed specifications usedfor older development programs. However, these newer programsseem to show an increasing cost for SE/PM, as depicted by the cost-trend figures in Chapter Three.
The number of drawings is another measure of complexity of aprogram suggested by defense contractors. Although drawings arequantifiable, their use as cost drivers can be problematic. Typically, acount of the drawings is not fully determined until after a contractorhas been awarded a contract to perform the development work. Aswith the SLOC and number-of-requirements measures, there are dif-ficulties in consistently counting the number of drawings across pro-grams. With the advent of computer-aided design and manufacturingand different types of drawings being generated on programs, this wasnot a measure we could consistently define as a means for estimatingSE/PM costs.
The number of subsystems or LRUs is a factor in the complexityof technology that one contractor suggested. The subsystems andLRUs are quantifiable, but their number is generally not known until____________3 See Pfleeger et al. (2004), which more fully describes various methods of software sizing,including counting lines of code. The authors detail some of the inconsistencies in the meth-ods used to count code.

Analytic Approach for Estimating SE/PM Costs 75
much of the design has been done, and by then it is too late for earlycost estimating. The number of subsystems and LRUs also was notsomething that could be easily determined across the set of historicalprograms we investigated. Use of this measure is further complicatedby the degree of modularity or the addition of a weapon subsystembeyond that originally envisioned in the EMD phase.
The only complexity measure that could both be consistentlydefined and be available to a cost estimator at the time when initialprogram estimates are needed is the weight parameter. This measurehas historically been one of the most widely used parameters in costestimating and has historically been a good predictor of cost.
Technical maturity is another possible parameter suggested as adriver that could affect SE/PM costs for a program. Various measuresof technical maturity have been proposed by organizations to define aquantifiable level of maturity.4 However, technical maturity is diffi-cult to quantify for the historical programs we studied given the cur-rent level of technology, and it is difficult to quantify for new pro-grams without a significant amount of judgment being involved.Another problem with using technical maturity is determining howto measure it for a system such as an aircraft or guided weapons sys-tem that may have varying levels of technical maturity for varioussubsystems within the overall program. In the past, aircraft havebenefited from ongoing research and development in areas such asmaterials, engines, and electronics that have occurred outside of thespecific program of interest. Also, several guided weapons programscontinue to focus upgrades on specific components, such as the guid-ance and controls, and use existing components, such as the warheadand rocket motor, from previous versions of the same guided weapon.The ongoing AIM-9 Sidewinder program is a good example of thistype of continued development.
The amount of subcontract work was also mentioned as a po-tential cost driver for SE/PM costs. The rationale behind this sugges-tion is that an increasing number of subcontractors require greater____________4 For example, NASA uses a series of technical readiness levels (TRLs) to characterize thematurity of systems and subsystems.

76 SE/PM: Trends and Costs for Aircraft and Guided Weapons Programs
coordination by the prime contractor, complicating overall planningand control and requiring additional effort to keep the entire subcon-tractor team updated on the evolving system design. However, this isa very difficult cost driver to measure because the amount of subcon-tract work to be performed is not often known at the time when ini-tial government development estimates are required for budgeting.Changes to “make versus buy” decisions regularly occur within pro-grams through development and production. Given these difficulties,this variable was not considered further.
The number of formal program reviews was also thought byprime contractors to be a cost driver for SE/PM costs. Again, quanti-fication of this type of variable is not often known at the start of aprogram and can greatly depend on the difficulty of the individualreviews rather than on just the simple number of reviews. Also, thenumber of reviews of historical programs is not readily available forthe programs we investigated.
The final cost driver suggested in our discussions with contrac-tors is the level of security required for a program. The thought wasthat a high-security environment requires restrictions on data, per-sonnel, and facilities that could affect SE/PM costs. However, consis-tent quantification of this cost driver is difficult, and this variablechanges over time on a program. Also, different parts of a programmay experience differing levels of security. Because of these difficul-ties, security level was not considered further in the quantitativeanalysis.
Aircraft Development SE/PM Cost-Estimating Analysis
We used the cost drivers recommended by contractors as a means forspecifically defining independent variables for our analysis. We chosefour general categories of cost drivers that account for the followingfour program characteristics: program scope, duration, physical size,and amount of integration. These general categories are further re-fined to specific parameters that could be quantitatively defined andcompared to determine if they are good predictors of SE/PM costs.

Analytic Approach for Estimating SE/PM Costs 77
Regression analysis was then used to determine what specific CERswere the best ones that could be developed using this analysis ap-proach.
Aircraft Development SE/PM Cost-Estimating Parameters
As stated above, the cost drivers meeting our criteria for estimatingSE/PM costs early in a program were program scope, duration, physi-cal size, and level of integration. These four general categories werefurther defined quantitatively by the parameters shown in Table 5.2.
We looked at four cost parameters describing the scope of theprogram. The first two are similar to each other and are meant to in-dicate the program’s scope based on the theory that the cost of a pro-gram is a good way to judge the program’s size and complexity. Non-recurring development cost (NRDEV) is the cost of the developmenteffort less the cost of recurring items such as the cost of the develop-mental test aircraft. Total development cost less SE/PM(TDEVLSEPM) is the cost of the entire effort minus the cost ofSE/PM. A prototype (PROTO) dummy variable identifies that a de-velopment program is an initial prototype of a demonstration pro-gram as opposed to a full-up development leading into production.The airframe already developed (AAD) dummy variable is used in
Table 5.2Cost Drivers and Parameters Used for Aircraft Development Analysis
Cost Drivers Parameters for Analysis
Program scope variables Nonrecurring development costTotal development cost less SE/PMPrototype program dummyAirframe already developed dummy
Program duration variables Design duration: months from contract award tofirst flight
Development duration: months from contractaward to end of development test
Physical size variable Weight empty
Level of integration variable Air vehicle cost/airframe cost

78 SE/PM: Trends and Costs for Aircraft and Guided Weapons Programs
cases in which the program is still pursuing significant development,but the airframe largely has been developed prior to the program.
The next two parameters measure the duration of the develop-ment program. The time (measured in months) from contract awardto first flight (CAFF) represents the duration of design. The timefrom contract award to end of development test (CADT) reflects theduration of total development. Figures 5.1 and 5.2 illustrate thatSE/PM is expended early and throughout development programs. Wechose these two measures of duration to determine whether the earlypart of a development program or the entire time spent in develop-ment is a better predictor of SE/PM costs.
The empty weight of the aircraft in pounds (WE) is used to seeif physical characteristics play a role in estimating the SE/PM costs.WE includes the weight of the aircraft structure and its subsystemsincluding avionics and propulsion. Weight has traditionally beenused as a means for scaling the cost of development efforts whenother information regarding a program is unknown. Traditionally, ithas also shown a strong correlation to NRDEV.
We also tried to develop a variable to represent the amount ofintegration required on the program. This measure was inspired bythe program integration number (PIN) used in the 1988 study by theIDA as an independent variable in estimating aircraft developmentcosts (Harmon et al., 1988). IDA’s PIN is largely a function of theamount of subcontracted effort in a development program. This vari-able had some appeal to us for estimating SE/PM costs because theweapon system contractors had mentioned subcontractor involve-ment as a driver of SE/PM costs.
However, we ended up using a different formulation of programintegration for three reasons. First, the amount of subcontracted ef-fort may not be well known early in a program. Second, our examina-tion of the specific tasks within SE/PM and the amount of effort oneach task on several historical programs showed that relatively littleSE/PM effort was specifically related to subcontractors. Third, pre-liminary inspection and analysis of the data showed little correlationbetween subcontracted effort and SE/PM costs.

Analytic Approach for Estimating SE/PM Costs 79
To represent program complexity on aircraft development pro-grams, we calculated a factor that is the value of air vehicle cost di-vided by the airframe cost (AV/AF). It indicates the proportion ofdevelopment effort spent on avionics and airframe. The numeratorfor air vehicle cost comprises the airframe, avionics, and propulsionintegration5 work required by the prime contractor in the standardWBS. Higher values indicate higher avionics content. We reasonedthat programs with proportionally more effort in avionics develop-ment would require more integration effort on the avionics, and thiswould drive SE costs because the effort would not be associated spe-cifically with the equipment element.
Aircraft Development SE/PM Cost-Estimating Relationships
Our next step was to use ordinary least squares and stepwise regres-sion analysis6 to determine which specific parameters could be usedto forecast SE/PM costs for aircraft development programs. We didnot include parameters in the relationships for four reasons. First, pa-rameters were not used if they did not correlate with the dependentvariable of SE/PM costs. (Correlation matrices for the parameters weconsidered are in Appendix E.) Second, parameters were not includedif the sign of the relationships between the parameter and SE/PM____________5 The cost for propulsion development that included the development of the aircraft’s en-gine was contracted separately in the databases we used.6 Stepwise regression is a method of selecting independent variables for inclusion in a statis-tical model by looking at the individual and collective contribution that adding independentvariables has to explaining the dependent variable. There are various types of stepwise regres-sion. The process we used begins with a dependent variable, but no independent variables areincluded. Independent variables are added one by one to the model and must result in anequation with an F-statistic that is significant at a specified confidence level (we set the levelat 10 percent) to be included. The t-statistic of the added independent variable is alsochecked for significance. After each variable is added, the method recalculates the model withall the variables that have already been included along with the F-statistic of the equation andthe t-statistic of the added variable. If the addition of any variables results in the equationhaving an F-statistic less than the significance level (we again set it at 10 percent), or if the t-statistic associated with the variable is less than the significance level (we used a significancelevel of 10 percent), it is deleted from inclusion in the equation. The stepwise process endswhen all variables included in the model are significant at the 10 percent level and no vari-ables outside the model are significant at that level.

80 SE/PM: Trends and Costs for Aircraft and Guided Weapons Programs
costs did not make sense. For example, we expected that weightwould be positively correlated with SE/PM costs; if the correlationmatrix showed a negative correlation, the parameter would be re-moved from consideration. Third, we excluded parameters if theywere related to other independent parameters trying to describe thesame cost driver. Fourth, we excluded parameters if they were overlyinfluenced by one or two observations that would make the parame-ters unrepresentative of the entire data set. Table 5.3 shows the resultsof the regression analysis that led to our choosing specific parametersto estimate SE/PM costs for aircraft development.
Our preferred CER for SE/PM costs in aircraft developmentprograms is a log-linear function of duration in months from contractaward to first flight and TDEVLSEPM. Although the two independ-ent variables are related in that both are indications of the scope andcomplexity of a development program and are statistically correlated,the duration variable better reflects the tasks under SE/PM that act asif they are based on level of effort. The addition of the duration vari-able reduces the error of the model and improves the fit enough thatwe decided to include both variables in the model.
Table 5.3Parameter Analysis Results for Aircraft Development Programs
Parameters Results from Regression Analysis
Months from CAFF IncludedMonths from CADT Correlated with other variables
NRDEV Correlated with other variables
TDEVLSEPM Included
AV/AF cost Not significant, wrong sign
WE Not significant
PROTO binary or dummy variable Not significant
AAD binary or dummy variable Not significant

Analytic Approach for Estimating SE/PM Costs 81
The following CER forecasts SE/PM contractor cost (less G&Acosts)7 in constant FY03 dollars. It was generated from 26 observa-tions including aircraft prototype, modification, and full-scale devel-opment programs. The programs range from prototype programswith a few million dollars in SE/PM costs to full-scale developmentprograms with billions of dollars in SE/PM costs.
The independent variables explain the variance in cost in thedata set as a whole quite well, as indicated by the high coefficient ofdetermination (R2) and as depicted in the plot points in Figure 5.3 ofactual costs versus predicted costs for aircraft development programs.8
However, the extreme range of costs in the dataset results in a stan-dard error that is relatively large for the average-sized developmentprogram as indicated by the coefficient of variation. Analysts who areestimating small development programs, such as prototype or modifi-cation programs, should be especially cautious using the followingCER (in boldface), and at a minimum should cross-check its resultsagainst the costs of an analogous historical program.
SE/PM Development Cost (FY03$K) = 0.01524 * CAFF(Months) ^ 1.431 * TDEVLSEPM (FY03$K) ^ 0.7766Adj. R2 = 94.49 percentF-statistic = 41.38t-statistic of first independent variable = 2.85t-statistic of second independent variable = 4.63Standard error = $167.98 million
____________7 The aircraft development programs had an average G&A percentage of 11 percent andwere fairly tightly clustered around that average. The standard deviation was 2 percent with aminimum of 8 percent and a maximum of 17 percent from our dataset.8 We provide several statistics that can be used to assess the CERs that we generated. TheR^2 adj is the coefficient of determination, adjusted for degrees of freedom. We provide theR^2 adj measured in unit space to demonstrate the model’s predictive capability in showingpercentage of variation explained by the regression. The R^2 adj is different when measuredin log space, and it cannot be used to compare different functional forms (e.g., linear versuslog-linear models). The coefficient of variation based on the standard error is a more appro-priate measure for comparing across functional forms. For more information about the dif-ferences in R^2 measured in log space versus R^2 measured in unit space, see Book andYoung (forthcoming).

82 SE/PM: Trends and Costs for Aircraft and Guided Weapons Programs
Coefficient of variation = 39.11 percentNumber of observations = 28
For development programs, once a total estimate is made using aCER, such as the one presented above, cost analysts usually have toalso look at how the estimated total cost should be spread across theduration of the development contract. Using historical cost informa-tion from aircraft development programs, we found that the SE/PMcosts tend to be spread in the following manner. The first third of thecost is spent from contract award to CDR. The second third of thecost is spent between CDR and first flight of the development testaircraft. The final third is spent from first flight to the end of the de-velopment test time. We also showed that a Weibull distribution canbe used to generate an expenditure profile for SE/PM costs. More
Figure 5.3Actual Versus Predicted SE/PM Costs for Aircraft DevelopmentPrograms (FY03 $)
RAND MG413-5.3
Pred
icte
d S
E/PM
co
st
Actual SE/PM cost

Analytic Approach for Estimating SE/PM Costs 83
detailed information about this profiling analysis can be found inAppendix F.
Aircraft Production SE/PM Cost-Estimating Analysis
Similar to the approach we used for developing an SE/PM CER foraircraft development programs, we investigated a similar CER for es-timating SE/PM costs in production. We used the same logical ap-proach—i.e., looking at parameters that could be used to quantifyproduction cost drivers and using regression analysis to see how thoseparameters fared in predicting SE/PM costs.
Developing a production CER presented a greater challenge dueto the variability of the data (see Figure 3.10). In the next subsection,we discuss out attempts to investigate the root cause of this variabilityto be able to model it in our resultant CER. But we were unable toaccurately identify what was causing the variation. The final CERSwe generated for production cost did not have a good fit to the data(as seen by low R2 values) and should be used with extreme caution.
Aircraft Production SE/PM Cost-Estimating Parameters
We developed a different set of parameters to represent the cost driv-ers in production than the set of parameters representing the costdrivers in aircraft development because of the different nature of de-velopment and production programs. Unlike development programs,production programs are usually funded and executed in single-yearlots. A production lot is usually awarded with deliveries starting twoyears after the contract award and finishing delivery by the third yearafter the award. Because this process is rather consistent across pro-grams, we chose not to investigate duration of the production lotcontract as a cost driver as we did for development programs.
Production costs differ from development costs in another re-spect that affected our list of parameters. Each aircraft program has asingle full-scale development effort and cost, but each program alsohas several lots or years of production, each with a different cost. Wetried to explain the differences in the average level of SE/PM across

84 SE/PM: Trends and Costs for Aircraft and Guided Weapons Programs
programs as well as the variation in costs from lot to lot on a particu-lar program. Our conversations with weapon system contractors re-vealed that SE/PM costs in production are affected by changes thatoccur after initial development and are incorporated into each lotthroughout production. For example, they mentioned that SE/PMcosts are affected by the need to correct deficiencies discovered in de-velopment testing or a lot-acceptance test, by major configurationchanges such as block upgrades or series changes, or by the manage-ment of simultaneous production of multiple configurations.
We considered how to formulate parameters and test the hy-potheses that major configuration changes and the simultaneous pro-duction of multiple configurations would affect SE/PM costs. Almostall aircraft programs undergo some configuration changes in produc-tion. We defined major configuration changes as a model change to adifferent series, for example, the F/A-18A/B changing to the C/D. Inour dataset, the fighter aircraft offered a subset of programs with longproduction histories and major changes in configuration that wouldallow us to test the hypothesis. The fighter programs also had foreignmilitary sales (FMS) at various times in their history. FMS aircraft aresold in slightly different configurations than aircraft for the U.S. mili-tary and involve a different customer. These programs allowed us totest the hypothesis that management of multiple configurationswould affect SE/PM costs.
We plotted the data on the fighter programs in our dataset toexamine these questions and understand how we could formulate pa-rameters to account for major configuration changes and the produc-tion of multiple configurations. Among other issues, we investigatedwhether an increase in SE/PM preceded the introduction of thechange, was coincident with the change, or followed the introductionof the change into the production line. After plotting the data (seeFigure 5.4), we determined that there was no consistent relationshipbetween major changes in configuration and increases in SE/PM costper aircraft. One program did show a significant increase in cost peraircraft coincident with a change in model, but the other programsshowed no clear pattern. The one program with a significant increase

Analytic Approach for Estimating SE/PM Costs 85
Figure 5.4Production SE/PM Costs per Fighter Aircraft with Series Change
RAND MG413-5.4
Lot midpoint
0 200 600400 800 1,000
SE/P
M c
ost
per
air
craf
t o
n a
no
rmal
ized
sca
le
NOTES: Arrows indicate last year of original series. Each curved line represents the costdata for a specific aircraft production program.
in SE/PM cost per aircraft also had a significant increase in SE/PMcost per lot upon the introduction of its new series that was sustainedlong after the change in configuration.
To better understand this unpredictable cost behavior, welooked at internal company reports that identified recurring and non-recurring SE and PM labor hours for the one program with increasedSE/PM costs. The CCDRs for the programs reported the SE/PM ef-fort for all programs as a recurring effort, which is a typical reportingpractice if most of the production effort is recurring in nature. Theinternal reports revealed that most of the SE/PM cost increase afterthe introduction of the follow-on aircraft series was for nonrecurringSE labor. Such effort may have been for the design of engineeringchanges associated with the model change, related studies, or non-

86 SE/PM: Trends and Costs for Aircraft and Guided Weapons Programs
related efforts. In any event the increase was due to nonrecurringtasks in production and, therefore, was impossible to forecast.
We performed the same analysis to see if changes in FMS couldexplain fluctuations in SE/PM production costs by lot.9 Figure 5.5shows the plot of yearly SE/PM costs and the years in which FMStook place. We saw no evidence that FMS increased SE/PM costs.The figure shows that for two programs SE/PM costs per aircraftwere unchanged during FMS years. The third program shows no ap-parent relationship between FMS in general or the number of cus-tomers and SE/PM costs per aircraft.
Figure 5.5Production SE/PM Costs per Fighter Aircraft with Foreign Military Sales
RAND MG413-5.5
Lot midpoint
0 200 600400 800 1,000
SE/P
M c
ost
per
air
craf
t o
n a
no
rmal
ized
sca
le (2)
(2)
(3)
(3)(3)
(1)
NOTES: Arrows indicate last years of significant foreign military sales. Numbers in pa-rentheses indicate number of FMS customers. Each curved line represents the cost datafor a specific aircraft production program.
____________9 One program shown in Figure 5.4 was removed because it had FMS throughout the pro-duction program data.

Analytic Approach for Estimating SE/PM Costs 87
After examining the data to test our hypotheses, we found noevidence to show that configuration changes or management of mul-tiple configurations resulted in a significant increase in SE/PM costs.Although the hypotheses are intuitively appealing, they were not bornout in the data we gathered. We did not pursue the analysis any fur-ther with the complete data set.
Table 5.4 shows the parameters we chose to represent cost driv-ers in production.
We believed that in production, as in development, the amountof SE/PM would be related to the scope and complexity of the air-craft. The first four variables in Table 5.4 are costs to indicate thescope and complexity of the aircraft. The air vehicle average unit costper lot (AV AUC) and air vehicle 100th unit cost (AV T100) repre-sent the recurring cost of the airframe and contractor-furnished avi-onics. It does not include the cost of the engine and other cost ele-ments that make up the unit recurring flyaway cost (i.e., SE/PM,engineering change orders, or government-furnished equipment). Itgenerally does not include G&A and profit.
The physical variable we investigated was the empty weight ofthe aircraft. As in the case of development, weight is a variable thathas historically been used in estimating and can serve as a proxy forcomplexity.
Table 5.4Cost Drivers and Parameters Used for Aircraft Production Analysis
Cost Drivers Parameters for Analysis
Program scope variables Air vehicle average unit cost per lot (AV AUC)Air vehicle 100th unit cost (AV T100)NRDEVSE/PM costs in development (SEPM DEV)
Physical variable WE
Programmatic variables Lot numberLot midpoint rate per yearProduction quantity rate ratio

88 SE/PM: Trends and Costs for Aircraft and Guided Weapons Programs
For representing programmatic cost drivers, we looked at fourdifferent parameters for predicting SE/PM production lot costs. Weused the variables of lot number (LOT NUM) and lot midpoint(LOT MP) to reflect the expectation that declining SE effort wouldbe required after deficiencies discovered in testing are corrected inearly production lots and the aircraft configuration stabilizes. Thisexpected decrease in effort with cumulative quantity would be offsetin some years by increased effort caused by major configurationchanges and production of multiple configurations, if applicable. Al-gebraic LOT MPs were calculated using the average slope of the en-tire dataset.
We included the variable of rate per year (RATE) to reflect theidea that recurring SE/PM may have some fixed costs associated withit, such that the cost per aircraft would increase for a smaller-sized lotand decrease for a larger-sized lot. The production quantity rate ratiovariable is similar in intent to the rate variable, but it is calculatedseparately for each production lot of the program. Production quan-tity rate ratio is defined as the ratio of a given year’s production lotquantity divided by the maximum production lot quantity achievedfor that program (Qn/Qmax).
The final variable we investigated was the effect of the last pro-duction lot. Looking back at Figure 3.10, it appears as thoughSE/PM costs tend to increase toward the end of production, and thelast production lot might experience an increase in cost. To see if thisvariable might have an effect on cost, we introduced a last lot(LLOT) binary parameter.
Aircraft Production SE/PM Cost-Estimating Relationships
The variables that we evaluated in the regression analysis are shown inTable 5.5, along with the reason for the exclusion of any parameterfrom the CER.
Because of the large variation in aircraft production SE/PMcosts, the CERs we generated showed poor fit statistics. Examinationof the data plots illustrates the problem. Figure 3.10 presentedone illustration of the unruliness of the SE/PM costs in aircraft

Analytic Approach for Estimating SE/PM Costs 89
Table 5.5Aircraft Production Program Parameters and Reasons for TheirExclusion from the CER
Parameters
Results from RegressionAnalysis/Reason for
Exclusion
AV AUC Not significantAV T100) Not significantSEPM DEV IncludedNRDEV Wrong signRATE IncludedLOT NUM Wrong signWE Not significantLOT MP IncludedProduction quantity rate ratio IncludedLast lot binary or dummy variable Not significant
production, and all of the CERs we fit to the historical SE/PM costswere unable to predict SE/PM costs very well. There is large variationin SE/PM costs among programs, whether the costs are calculated perproduction lot, average per aircraft per lot, or per pound of emptyweight per aircraft per lot. Furthermore, there is often large variationin SE/PM costs on an individual program that is not explained by thecumulative quantity or rate effect that one normally sees with produc-tion cost data. For some programs, the overall trend is a decrease incost over time in production; for other programs, the overall trend isthe opposite.
Our approach to developing CERs for production was to firstgenerate equations similar to the functional form represented by thestandard cost-improvement curve. The general functional form, alsoreferred to as a “learning curve,” is represented by the following equa-tion: Y = A * X ^ B, where Y is the average unit cost for the Xth unitand A and B are constants.10 The A value provides a means of scalingthe curve on the Y-axis and represents the cost of the first unit. The____________10 Usually aircraft and guided weapons are bought in production lots. The X value repre-sents the algebraic midpoint of the particular production lot for an associated Y value.

90 SE/PM: Trends and Costs for Aircraft and Guided Weapons Programs
B value is a constant that depicts the change in cost as X increasesfrom the first unit. The B value is typically expected to be a negativenumber less than one that gives the function an exponentially decay-ing shape.11
A variation of this basic cost-improvement curve includes an ad-ditional term to account for changes in yearly quantity. The func-tional form of this model is Y = A * X ^ B * Q ^ R, where Q is theyearly production rate and R is a constant. Similar to the basic equa-tion in the previous paragraph, the R value is typically a negativevalue less than one that provides a means for further adjusting theunit cost down for an increase in yearly quantity, or adjusting theunit cost up for a decrease in yearly quantity.
Using the functional form including the term for yearly produc-tion rate, we produced two possible CERs that could be used to pre-dict SE/PM unit cost in production. The first version of the CERuses the cost of SE/PM in development as a means of scaling the Y-axis starting point (or A value). We hypothesized that the amount ofSE/PM expended in development should be related to the amount ofSE/PM required in production. The second variation of this basicmodel uses the recurring cost of the air vehicle at the 100th unit(T100) as a way to scale the SE/PM production start point. The ex-pectation was that the higher the air vehicle cost, the more SE/PMcosts would be required in production.
The equation (in boldface) and the statistical results from theanalysis using SE/PM development cost for scaling the first CER fol-low. The equation forecasts SE/PM contractor cost (less G&A cost)12
in FY03 dollars.
Production SE/PM Cost per Aircraft (FY03$K) = 2133 *SEPM DEV(FY03$K)^ 0.1957 * LOT MP ^ –0.09178 *RATE ^ –0.768
____________11 The B value is given as the natural log of the learning curve divided by the natural log of2. The learning curve is usually expressed as a percentage and is equal to 2^B.12 The aircraft production programs had an average G&A percentage of 6 percent. Thestandard deviation of G&A was 2 percent.

Analytic Approach for Estimating SE/PM Costs 91
Adj. R2 = 51.94 percentF-statistic = 89.86t-statistic of first independent variable = 3.21t-statistic of second independent variable = –1.78t-statistic of third independent variable = –11.70Standard error = $2.87 millionCoefficient of variation = 106.05 percentNumber of observations = 165 lots, 13 programs
The first CER that we produced has coefficients that indicate aunit learning curve of 93.8 percent and a rate curve of 58.7 percent.Figure 5.6 shows how closely the first CER predicts SE/PM produc-tion costs (represented by the diagonal line) as compared with theactual costs for the 165 observations (yearly production lots) of a
Figure 5.6Actual Versus Predicted SE/PM Costs for Aircraft ProductionPrograms (FY03 $ per aircraft): CER 1
RAND MG413-5.6
Pred
icte
d S
E/PM
co
st
Actual SE/PM cost

92 SE/PM: Trends and Costs for Aircraft and Guided Weapons Programs
variety of types of Navy and Air Force aircraft production programs(represented by the plotted squares). The figure shows that the CERdoes a poor job of predicting higher-value programs as the data pointsdrop from the predicted line. Given this fact, the CER should beused only as a rough crosscheck, preferably in conjunction with ananalogy of the same type of aircraft produced by the same contractor.
The second CER we developed with this same functional formuses the recurring air vehicle cost at T100 as a y-axis scaling variable.Using the T100 value in the equation allows the SE/PM estimatingequation to be scaled on the y-axis using production recurring costsinstead of SE/PM development costs. The equation (in boldface) andthe statistical results for the second CER are as follows:
Production SE/PM Cost per Aircraft (FY03 $K) = 2682 * AVT100 (FY03$K) ^.1832 * LOT MP ^ -0.1599 * RATE ^–0.5678Adj. R2 = 51.46 percentF-statistic = 82.7296t-statistic of first independent variable = 1.8486t-statistic of second independent variable = –3.1871t-statistic of third independent variable = –9.997Standard error = $2.86 millionCoefficient of variation = 106.18 percentNumber of observations = 165 lots, 13 programs
This second CER for production SE/PM costs per aircraft hasvery similar fit statistics to the first CER that used SE/PM develop-ment cost as an independent variable. The second CER has coeffi-cients that indicate a unit learning curve of 89.5 percent and a ratecurve of 67.5 percent for the same data points used to generate theprevious CER. As was the case with the first CER, this CER yields alarge amount of difference between the actual and predicted costs,especially for higher-cost programs, as Figure 5.7 shows.
Given the problem of the poor predictive capability exhibited bythe CERs as shown in Figures 5.6 and 5.7, we tried to slightly alter

Analytic Approach for Estimating SE/PM Costs 93
Figure 5.7Actual Versus Predicted SE/PM Costs for Aircraft ProductionPrograms (FY03 $ per aircraft): CER 2
RAND MG413-5.7
Pred
icte
d S
E/PM
co
st
Actual SE/PM cost
the basic functional form and investigate the results. The functionalform that we used is given by the following equation: Y = A * X ^ B *(Qn/Qmax) ^ R. In this equation, the yearly lot quantity is divided bythe maximum yearly production quantity.13 This approach provides amultiplicative term that provides a penalty (a cost increase) for lotsthat are below the maximum quantity production lot size. We feltthat this was reasonable given that many of the SE/PM functions actas fixed costs and would be minimized (from a unit cost perspective)when the most units were being produced. We further found fromexamining the yearly production data that this was in fact occurringfor some of the programs in our dataset. Figure 5.8 depicts theSE/PM unit cost as a percentage of total air vehicle cost by produc-____________13 This formulation is discussed in Lee (1997, p. 60).

94 SE/PM: Trends and Costs for Aircraft and Guided Weapons Programs
tion lot as compared with the corresponding Qn/Qmax values foreach production lot (depicted by the plot points) for a select aircraftproduction program.
This specific program experienced a ramp up to the maximumproduction rate, a ramp down, a ramp back up to the maximum pro-duction rate, and a final ramp down.
The third CER (shown in boldface) and associated statisticsfrom the logarithmic functional form using the production quantityrate ratio are as follows:
Production SEPM Cost per Aircraft (FY03$K) = 28 *AV T100 (FY03$K) ^ 0.5216
* LOT MP ^ –0.3435* (Qn/Qmax) ^ –0.4623
Figure 5.8SE/PM Percentage of Air Vehicle Cost Versus Rate Ratio
0%
5%
10%
15%
20%
25%
30%
35%
0 0.2 0.4 0.6 0.8 1.0 1.2
RAND MG413-5.8
Qn/Qmax

Analytic Approach for Estimating SE/PM Costs 95
Adj. R2 = 44.51 percentF-statistic = 50.52t-statistic of intercept = 2.57t-statistic of first independent variable = 4.72t-statistic of second independent variable = –5.21t statistic of third independent variable = –6.33Standard error = $3.05 millionCoefficient of variation = 113.54 percentNumber of observations = 165 lots, 13 programs
The third CER has coefficients that indicate a unit learning-curve slope of 78.8 percent and a production rate efficiency slope of72.6 percent, and that SE/PM costs per aircraft increases by less thanhalf as air vehicle cost doubles. The CER predicts that SE/PM costsper aircraft declines as more units are produced and production ratesincrease (up to the maximum yearly quantity), and increases with theAV T100 cost. The CER is based on 160 observations (yearly pro-duction lots) of a variety of types of Navy and Air Force aircraft pro-duction programs.
The standard error of the estimate is larger than the averageSE/PM costs per aircraft in the dataset. Figure 5.9 shows that theCER (represented by the diagonal line) does a poor job of predictingSE/PM production costs when compared with the actual costs (repre-sented by the squares in the figure); however, it does a better job ofpredicting the overall sample of program costs in the dataset, suchthat the data is more evenly distributed against the prediction line. Asmentioned earlier, the CER should be used only as a rough cross-check, preferably in conjunction with an analogy of the same type ofaircraft produced by the same contractor.
The final functional form that we tested was a linear functionalform variation using the AV T100 cost and the production quantityrate ratio as the independent variables. This CER gave us better statis-tical results than the log-log form with the production rate ratio vari-able, but it does not exhibit a decline in SE/PM costs per aircraft asmore aircraft are produced cumulatively. The poorer fit of the log-log

96 SE/PM: Trends and Costs for Aircraft and Guided Weapons Programs
Figure 5.9Actual Versus Predicted SE/PM Costs for Aircraft ProductionPrograms (FY03 $ per aircraft): CER 3
RAND MG413-5.9
Pred
icte
d S
E/PM
co
st
Actual SE/PM cost
CER that we developed using a cumulative quantity variable indicatesthat SE/PM per aircraft in production tends not to decline over timeor as more units are produced in a classic learning-curve form, at leastafter the first few production lots. This fourth CER has coefficientsthat indicate that SE/PM per aircraft declines as production rates in-crease, and increases in proportion with the AV T100 cost. Thefourth CER and the statistical results are as follows:
Production SEPM Cost per Aircraft (FY03$K) = 1125 +(–2200) * (Qn/Qmax) + 0.09108 * AV T100 (FY03$K)Adj. R2 = 52.02 percentF-statistic = 87.18t-statistic of intercept = 2.27t-statistic of first independent variable = –2.89

Analytic Approach for Estimating SE/PM Costs 97
t-statistic of second independent variable = 13.18Standard error = $2.84 millionCoefficient of variation = 105.57 percentNumber of observations = 165 lots, 13 programs
Figure 5.10 shows how closely the CER predicts SE/PM pro-duction costs as compared with the actual costs. As was the case withthe prior CERs, there is still quite a large amount of variation be-tween the actual SE/PM costs of the programs and the predictionline. Like the third CER we tested, this CER does a better job of re-flecting all of the data in the dataset than does the traditional learn-ing-curve approach attempted in the first two production CERs.Given the poor fit statistics, as with all the aircraft production CERs,this methodology should be used only with extreme caution.
Figure 5.10Actual Versus Predicted SE/PM Costs for Aircraft ProductionPrograms (FY03 $ per aircraft): CER 4
RAND MG413-5.10
Pred
icte
d S
E/PM
co
st
Actual SE/PM cost

98 SE/PM: Trends and Costs for Aircraft and Guided Weapons Programs
An important reason for the poor fit of CER equations to thehistorical data is the wide range of cost improvement slopes observedamong historical aircraft production programs. Figure 5.11 summa-rizes the wide range of cost improvement slopes in our dataset, whichwas calculated using cumulative quantity only as the independentvariable.
Given the above analysis, we tend to prefer the overall better fitprovided by the fourth CER. It has the best fit of all the alternativesand does not fall prey to having the problem of poorly representingSE/PM costs for large programs. As with all the production CERsdeveloped in this study, the error remaining is high, and the CERshould be used with caution.
Figure 5.11SE/PM Cost Improvement Slopes on Aircraft Production Programs
RAND MG413-5.11
41–50% 51–60% 61–70% 71–80% 81–90% 91–100% Over 100%
Cost improvement slope
Nu
mb
er o
f o
bse
rvat
ioin
s
4
3
2
1
0

Analytic Approach for Estimating SE/PM Costs 99
Guided Weapons Development SE/PM Cost-EstimatingAnalysis
As with aircraft, we investigated the cost drivers that the contractorswe interviewed recommended as a means for estimating guidedweapon SE/PM costs. We chose four general categories of variablesthat account for the following program characteristics: programscope, program duration, physical size, and programmatics. As we didwith aircraft programs, we chose quantitative parameters that couldbe used to represent the general cost drivers for developing CERs.
Guided Weapons Development SE/PM Cost-Estimating Parameters
Most of the parameters that we used in our analyses of weapons de-velopment programs were indicators of program size, duration, orcomplexity. Table 5.6 shows the cost drivers we investigated and theparameters we chose to represent those cost drivers.
The first parameter was a scope variable chosen to indicate theprogram’s size and complexity. The cost of the weapon developmentprogram cost minus the cost of SE/PM (TDEVLSEPM) was theparameter we investigated. The next three parameters measure the
Table 5.6Cost Drivers and Parameters Used for Guided Weapons DevelopmentAnalysis
Cost Drivers Parameters for Analysis
Program scope TDEVLSEPMProgram duration Months from contract award to first guided launch
Months from CADTMonths from contract award to first production
delivery (CAFPD)
Physical size WeightDiameterDensity (weight/cross-sectional area)
Programmatics Dem/Val or Modification binary or dummy variableContract award year

100 SE/PM: Trends and Costs for Aircraft and Guided Weapons Programs
duration of the development program. The months from contractaward to first guided launch (CAFGL) represent the duration of de-sign. The months from contract award to end of development testreflect the duration of total development. Months from contractaward to first production delivery (CAFPD) are also meant to reflectthe duration of total development. This last parameter is a less satis-factory indicator of the duration of total development in our opinionbecause it is more influenced by the concurrency of the developmentand production phases. Nevertheless, we included it in the investiga-tion because it is sometimes more readily available to estimators thanthe preferable CADT parameter.
The parameters of weight (WT), diameter (DIAM), and density(DEN) (weight/cross sectional area) are physical-sizing parametersmeant to scale programs similar to the weight empty variable used foraircraft programs. It was thought that a smaller diameter missilewould require denser packaging and greater complexity and woulddrive SE/PM costs. Also, air-to-air weapons tend to have a smallerdiameter and also a smaller weight than air-to-ground weapons. Thedensity variable was used to normalize the weight in a specified pack-age. Table 5.7 shows that air-to-air weapons tend to weigh less, butthey have a smaller diameter and cross-sectional area than air-to-ground weapons. The ratio of weight and cross-sectional area pro-vides a useful measure of overall weapon density.
Table 5.7Summary of Weapons Program Physical Parameters
AverageWeight(pounds)
AverageDiameter(inches)
Average Cross-Sectional Area(square inches)
Average Density(Weight/Cross-
Sectional Area inpounds per square
inch)
Air-to-airweapons 453 7.9 57 9.4
Air-to-groundweapons 1,598 16.7 237 7.1

Analytic Approach for Estimating SE/PM Costs 101
Two parameters were investigated to see how programmaticdrivers affect SE/PM costs. A Dem/Val or modification (DVMOD)program binary or dummy variable was used to compare the largerFSD/EMD programs to these generally more modest efforts. Con-tract award (CA) year was included in the analysis to allow us to ex-plore the effects of trends over time, but not necessarily for potentialinclusion in a CER.
Guided Weapons Development SE/PM Cost-Estimating Relationships
Repeating the process that we followed to investigate estimating pa-rameters for aircraft programs, we used regression analysis to deter-mine the best independent variables to predict SE/PM costs. We usedstepwise regression of the candidate independent variables for weaponSE/PM costs, and applied the same four criteria as we did in the se-lection of independent variables for aircraft SE/PM costs. The vari-ables that we evaluated are shown in Table 5.8, along with the reasonfor their exclusion from the CER if they were excluded.
Contract award year was not included as a parameter for devel-opment programs because the two largest guided weapons develop-ment programs in the dataset were the short-range attack missile
Table 5.8Parameter Analysis Results for Guided Weapons DevelopmentPrograms
ParametersResults from Regression
Analysis
CA year Outlier influenceMonths from CADT Not significant
Months from CAFGL Not significant
Months from CAFPD Not significant
DEN (weight / cross sectional area) Wrong sign
DIAM Not significant
TDEVLSEPM Included
WT Not significant
DVMOD binary or dummy Not significant

102 SE/PM: Trends and Costs for Aircraft and Guided Weapons Programs
(SRAM) and advanced medium-range air-to-air missile (AMRAAM)programs awarded in 1966 and 1981, respectively. These observa-tions are overly influential because of their size, and because they areolder programs, they distort analyses of trends.
The preferred CER for estimating guided weapons developmentSE/PM costs is a linear relationship with TDEVLSEPM. The CERforecasts contractor SE/PM costs (less G&A cost)14 in FY03 dollars.The CER (in boldface) and summary statistics are as follows:
Guided Weapon Development SE/PM Cost (FY03$K) =11870 + 0.2263 * TDEVLSEPM (FY03$K)Adj. R2 = 83.25 percentF-statistic = 179.94t-statistic of first independent variable = 13.41Standard error = $27.73 millionCoefficient of variation = 51.16 percentNumber of observations = 37
This CER suffers from the same problem as the aircraft devel-opment SE/PM CER. The weapons development data set of 37 pro-grams encompasses modification programs totaling a few tens of mil-lions of dollars to full-scale development programs of more than abillion dollars. Although the CER fits the data reasonably well, asshown in Figure 5.12, its standard error is more than 50 percent ofthe average SE/PM cost in the data set. Analysts who are estimatingsmall development programs such as minor modifications or proto-type efforts should be especially cautious in using this CER, and at aminimum should cross-check the results against the costs of an analo-gous historical program.____________14 The average G&A cost for guided weapons system development programs is 12 percent,with a standard deviation of 6 percent.

Analytic Approach for Estimating SE/PM Costs 103
Figure 5.12Actual Versus Predicted SE/PM Costs for Guided WeaponsDevelopment Programs (FY03 $)
RAND MG413-5.12
Pred
icte
d S
E/PM
co
st
Actual SE/PM cost
Guided Weapons Production SE/PM Cost-EstimatingAnalysis
Using the broad categories of cost drivers recommended by industrypersonnel as a way to estimate SE/PM costs, we developed a morespecific set of parameters. These parameters capture the general na-ture of the recommended cost drivers in a quantifiable fashion. Usingregression analysis, we used these parameters along with historicalcost data to generate cost-estimating relationships for guided weaponsin production.

104 SE/PM: Trends and Costs for Aircraft and Guided Weapons Programs
Guided Weapons Production SE/PM Cost-Estimating Parameters
Most of the parameters that we used in our analyses of weapons pro-duction programs are indicators of product complexity, or were in-cluded to explain changes in SE/PM costs from year to year duringthe production phase. The list of parameters is shown Table 5.9.
Three parameters were chosen to represent the scope of the pro-gram. The first two are different versions of measuring recurring unitcost15 of the weapon. One measures the value at the one-hundredthproduction unit (Weapon 100th unit cost [WPN T100]) and theother at the one-thousandth unit cost (WPN T1000). The SEPMDEV cost was also seen as a potential indicator of program scope andcomplexity.
The physical parameters of weight, diameter, and density wereexpected to be associated with SE/PM costs in production. As westated earlier, weight has traditionally been used in cost analysis as an
Table 5.9Variables Used for Guided Weapons Production Analysis
Cost Drivers Parameters for Analysis
Program scope WPN T100WPN T1000SEPM DEV
Physical size WTDIAMDEN
Programmatics LOT MPRATEQn/QmaxLLOT binary or dummy variable
____________15 The guided-weapon recurring unit cost came from Functional Cost Hour Reports(FCHR) for the various programs and production lots. It includes the manufacturing (laborplus purchased equipment), recurring engineering, sustaining tooling, quality control, andother recurring costs. It is separate from nonrecurring, engineering change order, SE/PM,systems test and evaluation (ST&E), training, data, support equipment, operational site acti-vation, fielding, and other procurement costs from the FCHRs. It does not include G&A,cost of money, or profit.

Analytic Approach for Estimating SE/PM Costs 105
indicator of complexity. We also believed that complexity could beindicated by the amount of miniaturization required in overall pack-aging of the weapon. We included analysis of the diameter and cross-sectional area of the weapons programs as a means for testing this hy-pothesis.
The last set of parameters is related to the programmatic aspectsof the dataset. We used the variable of lot midpoint (or cumulativequantity) to reflect the expectation that declining SE effort would berequired after deficiencies discovered in testing are corrected in earlyproduction lots. Thus, we expected that weapon production SE/PMcosts would be inversely associated with LOT MP. We expected thatthis relationship would be smoother and more consistent than we ob-served for SE/PM costs in aircraft production because guided weap-ons production programs tend to have fewer major configurationchanges. Major configuration changes in weapons programs are usu-ally the result of new development programs and are designated as anew and separate weapon production program. Algebraic LOT MPswere calculated using the average slope of the entire dataset.
We included the variable of rate per year to reflect the idea thatrecurring SE/PM is a fairly constant level of effort, so we would ex-pect that the amount of effort per weapon would increase as rate peryear decreased on a given program. As with our aircraft analysis, wealso used the production quantity rate ratio in our analysis.
The last lot binary or dummy parameter was used to reflect theincreased SE/PM effort often observed at the end of production pro-grams. Some observers have reasoned that there are “shut down” costsinherent in the last lot. We tried to test the significance of this theoryusing a binary or dummy variable.
Guided Weapons Production SE/PM Cost-Estimating Relationships
Using regression analysis, we determined the set of variables wewould use for developing cost-estimating relationships. Table 5.10shows the results of the analysis, along with the reason for each pa-rameter’s exclusion from the CER if it was excluded.

106 SE/PM: Trends and Costs for Aircraft and Guided Weapons Programs
Table 5.10Parameter Analysis Results for Guided Weapons ProductionPrograms
Parameters Results from Regression Analysis
DEN Not significant
DIAM Not significant
LOT MP Included
RATE Included
Qn/Qmax Included
SEPM DEV Not significant
WPN T100 Correlated with other parameter
WPN T1000 Included
WT Not significant
LLOT binary or dummy Not significant
As with the analysis to develop CERs for aircraft, we investi-gated several CERs in the functional form of Y = A * X ^ B * Q ^ Rfor weapons production programs using the different parameters asindependent variables. As mentioned previously, the A value repre-sents the cost of the first unit and provides a way of scaling the equa-tion on the y-axis. The X value is the algebraic midpoint of the lot inquestion, and the Q value is the quantity procured in the specific lot.The best results were obtained using the following two CERs.
For the first CER, used the above functional form utilizing therecurring cost of the T1000, the lot midpoint, and the yearly produc-tion rate as independent variables. The CER yields a SE/PM cost perunit (less G&A costs)16 in constant FY03 dollars. The regression ofthe 103 observations resulted in the following equation (in boldface)with the associated statistics.
Guided Weapon Production SE/PM Unit Cost (FY03$K) =19.42 * WPN T1000(FY03$K)^ 1.035 * LOT MP ^(–0.2238) * RATE ^ (–0.5831)
____________16 G&A costs varied by program and by production lot. The average G&A cost is 8.7 per-cent, with a standard deviation of 1.7 percent.

Analytic Approach for Estimating SE/PM Costs 107
Adj. R2 = 70.51 percentF-statistic = 501.42t-statistic of first independent variable = 17.15t-statistic of second independent variable = –5.25t-statistic of third independent variable = –7.93Standard error = $112.31 millionCoefficient of variation = 98.86 percentNumber of observations = 103 lots, 15 programs
As compared with the similar analysis performed on aircraftproduction data, the guided weapon CER did a much better job ofpredicting SE/PM costs using the learning and rate functional form.The resulting cumulative quantity curve is 85.6 percent, and the ratecurve is 66.8 percent. The recurring unit cost of the weapon is posi-tively associated with SE/PM cost per unit, indicating that more-expensive weapons require more associated SE/PM costs. Neverthe-less, the variance explained by the model as indicated by the R2 ismarginal, and the error remaining is high. The CER, like the others,should be used with caution. The plot of the actual costs versus thepredicted values is given in Figure 5.13.
As with our analysis for aircraft programs, we wanted to investi-gate what the results would be using the functional form that utilizesthe ratio of yearly lot size to the maximum lot size. We tried twovariations using this independent variable. The first version was againa logarithmic function using guided weapons’ recurring cost atT1000, lot midpoint, and the quantity ratio Qn/Qmax as the inde-pendent variables. The second was a linear-type equation using onlyWPN T1000 recurring cost and the quantity ratio as independentvariables, similar to the methodology used for aircraft productionprograms.
From the analysis using the logarithmic version of this func-tional form, we were able to improve the fit statistics of the resultingCER. In this formulation, the cumulative quantity curve is 74.7 per-cent (steeper than the first CER), and the rate efficiency curve is 87.1percent (flatter than the first CER). The recurring unit cost of the
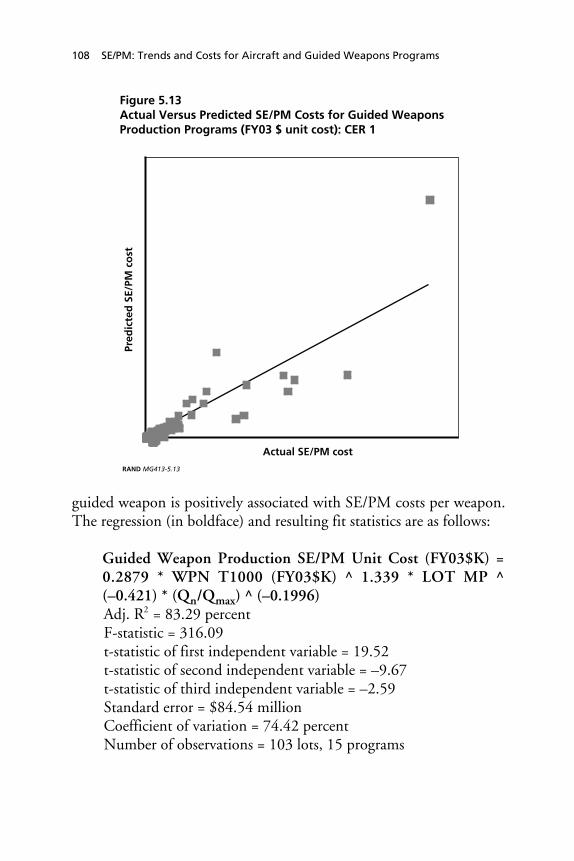
108 SE/PM: Trends and Costs for Aircraft and Guided Weapons Programs
Figure 5.13Actual Versus Predicted SE/PM Costs for Guided WeaponsProduction Programs (FY03 $ unit cost): CER 1
RAND MG413-5.13
Pred
icte
d S
E/PM
co
st
Actual SE/PM cost
guided weapon is positively associated with SE/PM costs per weapon.The regression (in boldface) and resulting fit statistics are as follows:
Guided Weapon Production SE/PM Unit Cost (FY03$K) =0.2879 * WPN T1000 (FY03$K) ^ 1.339 * LOT MP ^(–0.421) * (Qn/Qmax) ^ (–0.1996)Adj. R2 = 83.29 percentF-statistic = 316.09t-statistic of first independent variable = 19.52t-statistic of second independent variable = –9.67t-statistic of third independent variable = –2.59Standard error = $84.54 millionCoefficient of variation = 74.42 percentNumber of observations = 103 lots, 15 programs

Analytic Approach for Estimating SE/PM Costs 109
The second guided weapon production SE/PM CER fits thedata better than does the first guided weapon production SE/PMCER. The second CER explains more of the variation in the data andhas a smaller standard error than the first CER. The t-statistic for thequantity ratio variable is smaller than the t-statistic for the yearly ratevariable in the first CER, but it is significant above the 95 percentconfidence level. The plot of actual versus estimated values is shownin Figure 5.14.
The change in magnitude of the cumulative-quantity slopes andrate variables from the first production CER to the second CER isdue to the high correlation between these independent variables, acondition known as multi-collinearity. The total cost improvementcalculated using the rate and cumulative quantity variables is similarfor both CERs. In the first formulation, the regression attributes
Figure 5.14Actual Versus Predicted SE/PM Costs for Guided WeaponsProduction Programs (FY03 $ unit cost): CER 2
RAND MG413-5.14
Pred
icte
d S
E/PM
co
st
Actual SE/PM cost

110 SE/PM: Trends and Costs for Aircraft and Guided Weapons Programs
more cost improvement to the rate variable. In the second formula-tions, more cost improvement is attributed to cumulative quantity.Multi-collinearity between cumulative quantity and rate variables is acommon problem in analyzing production data, and although statis-tical techniques exist to compensate for this condition, determiningthe “true” contributions of rate variables and cumulative quantity inthese instances is often impossible.
The third formulation we tried for developing a guided weaponproduction CER uses a combination of the T1000 recurring cost andthe quantity ratio as independent variables in a linear-type equation.Because this formula produced the best results for aircraft productionprograms, we wanted to see how it performed for weapons produc-tion programs. Although all of the variables are significant at the 99-percent confidence level, the CER fit the guided weapons data muchworse than the logarithmic formulations we developed using lot mid-point and rate variables.
Even though the logarithmic versions of the above CERs fit thedata better than the linear version, there is still a large degree of varia-tion in the cost improvement slopes in our dataset. Figure 5.15 showsthe range and distribution of slopes calculated by cumulative quantityonly (without a rate effect). Note that the distribution of slopes ismuch tighter than the SE/PM production cost slopes for aircraft, asshown in Figure 5.11.
Summary of Aircraft and Guided Weapons SE/PM Cost-Estimating Relationships
Our analysis to derive CERs for estimating SE/PM costs for aircraftand weapons programs started with determining cost drivers logicallyassociated with SE/PM costs. These cost drivers were largely based ondiscussions with cost estimators in the government and industry. Wenext determined quantitative parameters that could be used to repre-sent the suggested cost drivers. Using historical cost data and regres-sion analysis, we developed several CERs that can be used to estimateSE/PM costs.

Analytic Approach for Estimating SE/PM Costs 111
Figure 5.15SE/PM Cost Improvement Slopes in Guided Weapons Production Programs
RAND MG413-5.15
51–60% 61–70% 71–80% 81–90% 91–100%
Cost improvement slope
Nu
mb
er o
f o
bse
rvat
ioin
s
6
4
5
3
2
1
0
Given the above analysis, we tend to prefer the overall fit pro-vided by the second CER. As with all the production CERs devel-oped in this study, the error remaining is high, and the CER shouldbe used with caution.
We found that SE/PM costs for aircraft development programswere related to the design duration (as measured by time from con-tract award to first flight) and to the overall program size (as meas-ured by the development program cost minus SE/PM costs). The re-sulting CER fit the data rather well, but showed somewhat largevariation.
Estimating the SE/PM costs for aircraft in production was diffi-cult due to the highly variable cost data. We investigated to see if cer-tain changes in the production program (such as the end of the initialmodel of aircraft and the onset of FMS) could be used to explain thisvariation. Unfortunately, neither of these changes explained the varia-tion in SE/PM production cost. We developed two CERs that usedthe logarithmic formulation and one CER that used a linear formula-tion. None of these formulations gave very good statistical results. Of

112 SE/PM: Trends and Costs for Aircraft and Guided Weapons Programs
the three, the linear formulation using T100 air vehicle cost and theratio of the lot quantity to the maximum production lot size providedthe best results.
For guided weapons programs, SE/PM development cost wasfound to be related to the overall development cost of the program(less the cost of SE/PM). The CER fit the data reasonably well, butthere was still quite a large amount of variation in the data.
The guided weapon production data showed much more consis-tency (similar to a traditional learning-curve shape), which allowed usto relate weapon production SE/PM unit costs to the overall weaponunit cost, lot midpoint, and the ratio of the lot quantity to the maxi-mum production lot size. The CER fit the data reasonably well, butas with the rest of the CERs, showed a large variance.
A few words of caution should be expressed regarding use ofthese CERs for estimating. First, the data used for these relationshipsshowed a wide amount of variability. Second, as mentioned in Chap-ter Two, there is also some difference in the definition of the costcontent among contractors and among programs performed by thesame contractor that could increase the variation. As such, cost ana-lysts should also consider the use of other techniques (such as analo-gies or a bottom-up approach) if more information is known about aprogram. Finally, another drawback of the CERs is that one of theinput variables in each of them is based on an estimate of the otherdevelopment or production costs. Uncertainty in the SE/PM estimateis increased by uncertainty of the estimates of other program costs asinputs to these CERs.
In the next chapter, we investigate how some of the new acquisi-tion approaches could affect how SE/PM costs are estimated. Thisinformation can be used to see if adjustments are required to esti-mating relationships based upon historical data.

113
CHAPTER SIX
How New Acquisition Practices Will Affect SE/PMCost Estimates
One of the objectives of this analysis was to determine if the DoD’srecent acquisition-process initiatives—i.e., acquisition reform—hadan effect on how SE/PM costs should be estimated for future pro-grams. The three main acquisition initiatives we investigated were theeffects of the reduction in the number of MILSPECs and MILSTDs;the use of IPTs; and the use of evolutionary acquisition, which recog-nizes, at the outset, the need for future improvements to improve ca-pability. Because there are limited cost data for programs that usedthese new practices and few programs completed post-acquisition re-form, determining what quantitative effects these initiatives have onSE/PM costs is especially challenging. It is also difficult to determineif the new acquisition practices or other program characteristics arecausing changes in SE/PM costs.
As discussed earlier in this report, our general method for de-termining differences in SE/PM costs between programs that haveused the new acquisition processes and those that have not was tocompare the cost data from programs using the new practices to theoverall sample of programs in that specific data group. We used uni-variate analysis1 to determine if the SE/PM cost for a program using____________1 Univariate analysis provides an analysis of the values for a single variable. It includes meas-ures of central tendency, dispersion, shape, and the predictive capability of the mean as asample estimator. This approach shows only how the data point of interest differs from therest of the data. It is not able to determine if the hypothesized cause for the difference is ac-tually the reason for the difference.

114 SE/PM: Trends and Costs for Aircraft and Guided Weapons Programs
the new acquisition approach was significantly different from that ofthe overall sample.
To examine the effect of the reduction in MILSPECs andMILSTDs, we compared the SE/PM cost from two programs usingthe new acquisition practices to the rest of the guided-weapons devel-opment cost dataset. To examine the effect of the use of IPTs, welooked at the SE/PM cost of two programs that were among the firstto use IPTs during their development and compared their SE/PMcost with the SE/PM cost from other historical aircraft programs. Forthe third new acquisition practice, the use of EA, we took a morequalitative approach to the analysis and investigated cost data from asurrogate program, discussed later in this chapter. Because the use ofEA on large aircraft or guided-weapons development contracts is arather recent occurrence, we were limited in the amount of quantita-tive analysis we could perform in this area. Our approach was to in-terview a cost analyst working on the Global Hawk program, which iscurrently using EA, to see what observations he could provide re-garding cost analysis of such a program. We also tried to see whatquantitative information could be gleaned from the JSOW program,which concurrently developed three variants of a missile, as a surro-gate for an EA program.
Reduction in Military Specifications and MilitaryStandards
One of the acquisition changes DoD instituted in the mid- to late-1990s was a push to reduce the number of MILSPECs andMILSTDs to alleviate what was perceived as overly restrictive andburdensome requirements placed on DoD contractors. The thinkingwas that significant savings could be realized if some restrictions wereeliminated. Two pilot programs—JDAM and JASSM—were used totest how this new acquisition approach worked.
We were interested in seeing if SE/PM costs were affected for aprogram with fewer MILSPEC and MILSTD restrictions. We testedthis hypothesis by comparing the SE/PM costs from the JDAM and

How New Acquisition Practices Will Affect SE/PM Cost Estimates 115
JASSM programs with the cost data in the rest of our sample ofguided weapons development programs.2 Figure 6.1 plots the SE/PMcost distribution for the guided weapons development programs inour dataset. When we compared the SE/PM costs for the JDAM andJASSM programs with the SE/PM costs for the rest of the sample, wefound that the costs for the two programs were within one standarddeviation of the mean of the SE/PM cost for the sample. We con-cluded that adjusting SE/PM estimates probably is not necessary forprograms that eliminate MILSPECS and MILSTDS.
Figure 6.1Guided Weapons Development SE/PM Costs for Comparison with Programswith Fewer MILSPEC and MILSTD Restrictions
RAND MG413-6.1
Guided weapons SE/PM development cost range (FY03 $M)
Nu
mb
er o
f p
rog
ram
s
14
12
10
6
8
4
2
05–24 24–43 43–62 62–81 81–100 100–119
Median$24 million
Mean$40 mllion
Minus onestandarddeviation
Plus onestandarddeviation
____________2 We used 35 of the 37 historical DoD guided-weapons programs for this analysis. Twoprograms were eliminated because their SE/PM cost was more than 2.5 standard deviationsfrom the sample median value.

116 SE/PM: Trends and Costs for Aircraft and Guided Weapons Programs
Our interviews with contractors seemed to corroborate thisfinding. They agreed that the reduction in MILSPECs and MILSTDsdecreased the amount of required documentation; however, reducingthe use of MILSPECs and MILSTDs did result in additional costs tothem. Because commercial practices are to largely replace the militarystandards, contractors conceded that more effort was required ontheir part to define an appropriate specification and to make sure thatall the subcontractors understood what was required, rather than re-lying on a government-imposed definition of requirements.
Use of Integrated Product Teams
We also performed a univariate analysis to determine if the use of in-tegrated product teams had any effect on SE/PM costs. Figure 6.2shows SE/PM cost divided by total program cost less SE/PM (labeledas “SE/PM cost percentage of non-SE/PM cost”) for the aircraft de-velopment programs in our dataset. We compared the SE/PM costpercentage for the F/A-18E/F and F/A-22 EMD programs to theoverall dataset of aircraft development programs. We found that theSE/PM cost percentages for these two programs was not very differ-ent from the SE/PM cost percentages of most of the programs in thedataset. One program was within one standard deviation from themean, and the other program was slightly higher than one standarddeviation from the mean.
One thing to keep in mind about these two programs is thatthey followed vastly different approaches to acquisition.3 Althoughthe F/A-18E/F program used IPTs in development, it benefited fromthe use of many previously developed technologies and was per-formed by the same contractor team that worked on the predecessorF/A-18C/D, reducing the overall complexity of program develop-ment. In contrast, the F/A-22 program pursued significantly new
____________3 For further discussion of the F/A-22 and F/A-18E/F development programs, see Younossiet al., 2005.

How New Acquisition Practices Will Affect SE/PM Cost Estimates 117
Figure 6.2Aircraft Development SE/PM Cost Percentages for Comparison withPrograms Using IPTs
4–7 7–11 11–15 15–19 19–23
RAND MG413-6.2
SE/PM cost percentage of non-SE/PM cost
Nu
mb
er o
f p
rog
ram
s
6
5
3
4
2
1
0
Median 11% Mean 12%
Minus onestandarddeviation
Plus onestandarddeviation
performance goals in several technologically challenging areas simul-taneously. Also, the F/A-22 required much more time to developthan the F/A-18E/F. If the SE/PM cost element contained level-of-effort tasks, the extension of the schedule in development would alsodrive up SE/PM costs.
Cost estimators from major prime contractor companies saidthat they believe the use of IPTs would result in a program costingmore than a traditional program.4 They attribute the additional costto an increase in SE/PM effort due to additional time in coordinatingwith the government counterpart in the IPT before proceeding with____________4 In addition, Cook and Graser (2001) quoted a contractor saying that IPTs as a rule add 10to 20 percent to the initial design cost.

118 SE/PM: Trends and Costs for Aircraft and Guided Weapons Programs
the design process. IPTs, in their opinion, tend to increase the scopeof the work that contractors must perform.
Boeing supplied us with a comparison of the engineering hoursfrom the F/A-18A/B development program (a non-IPT program) andthe F/A-18E/F program. The comparison showed that the F/A-18E/Fprogram used more engineering hours for SE. However, the overallengineering hours decreased from the A/B to the E/F program. Muchof the decrease was due to reduced test-and-evaluation engineering,probably the result of carryover of much of the avionics subsystemsfrom the prior version of the aircraft.
We conclude that it may be necessary to account for the use ofIPTs when performing an SE/PM cost estimate for a new program. Acost analyst needs to give careful consideration to the program beingused as the basis of the comparison estimate. Choosing a programwith a scope and technical complexity that are similar to those of thenew program should help to eliminate potential differences betweenthe two programs.
Use of Evolutionary Acquisition
Evolutionary acquisition attempts to speed delivery of a product tothe end user. EA can potentially shorten development time in orderto capture rapid technological improvements that might be incorpo-rated in the end product. As described in Chapter Three, the processrequires additional capability to be released in a series of overlapping“spirals”. Each spiral has some dependence on the work from the pre-ceding spiral but also adds unique capability. Each spiral also has itsown oversight review process that needs to be addressed.
EA would seem to increase the complexity of the effort requiredby SE/PM personnel because requirements must be redefined foreach successive iteration or spiral. Presumably, this constant changein the development baseline, in which one design will be fielded inthe short term while another design is being developed, makes it dif-ficult to maintain configuration control of the different systems re-sulting from each spiral. This situation results in a continual trade-off

How New Acquisition Practices Will Affect SE/PM Cost Estimates 119
between changing needs and desired capability and the finite re-sources to perform a task.
However, there is some logic in SE/PM programs’ use of EAleading to cost savings. As explained in Chapter Three, EA attemptsto incrementally deliver capability with the understanding that futuretechnological improvements will occur. If each increment representsdelivery of a mature technology, the process may reduce the com-plexity of the SE/PM tasks within a program.
Because EA is a relatively new approach to major weapons-systems development programs, the amount of quantification wecould perform in this area was limited. We used a combination ofthree approaches for analyzing the potential effects on SE/PM costestimating due to the use of EA. First, we had discussions with a costanalyst working on the Global Hawk program on how he took EAinto account when developing program estimates. Second, we askedcost analysts working for prime contractors what they believe are theimplications of EA for SE/PM costs. Finally, we investigated SE/PMcosts from the JSOW program as a surrogate for a true EA programto see if we could glean any quantitative results.
The Global Hawk cost analyst provided the following insightsand lessons learned from the program. Program engineers were ableto rapidly develop the basic air vehicle and achieve first flight within38 months of contract award. However, the rapid rate of develop-ment made it difficult for the regulatory and oversight groups to keepup with the program.5 The program managers were required to seekapproval for each spiral every time significant work content waschanged. Also complicating the situation was the division of each spi-ral into several smaller efforts (referred to as “increments”). Each in-crement had to be modular and estimated separately to allow an in-crement to be delayed to future spirals if it encountered budgetary,technical, or scheduling difficulties.____________5 The author of a briefing on the Global Hawk program said that, as of the date of thebriefing, the program had “experienced the equivalent workload of three milestone reviews,plus an independent full-scale engineering review all within the past 22 months” (Pingel,2003).

120 SE/PM: Trends and Costs for Aircraft and Guided Weapons Programs
Another complication mentioned by the Global Hawk costanalyst is that spiral development runs counter to the sequence of de-velopment, production, and operating and support lifecycle phases.Successive spirals being released to the end user result in overlap ofthe lifecycle phases. A change in design could affect the building ofunits that are currently in production or could require retrofits forunits that are already fielded. These concurrent phases require a largeamount of coordination at all times to ensure that the program strat-egy is continuously followed between the program phases.
The implications of the complexities of EA for cost estimatingare that while EA possibly reduces technical risk by allowing for par-tial solutions to be fielded more quickly, it may incur increased costsdue to increased coordination, integration, and logistics activities forSE/PM. Estimators should divide their SE/PM cost estimates intotwo parts: the SE/PM cost related to specific spirals or incrementsand the “overlay” SE/PM cost for the effort that continues acrossmultiple spirals and that provides consistency of overall program di-rection. Because each spiral or increment may be shifted in theschedule according to the priorities of the program’s end users, esti-mators must be able to determine the unique amount of SE/PM costrequired for each spiral or increment. This ability allows for rapid,modular changes to be made to the cost estimate. Also, logistics plan-ners prefer that design changes be “settled out” before performing afull LSA. However, the rush to field systems may push a system to theuser before a logistics infrastructure has been established to supportthe fielded units. Also, as various spirals are fielded, they may or maynot include retrofitting to bring older units in line with a commonconfiguration, making configuration control difficult to maintain.
Our discussions with contractor cost analysts indicated that EAwould require additional SE/PM effort. The contractors also believethat EA is similar to the P3I concept previously used on programs.Given this assumption, we investigated the JSOW program as a sur-rogate to a true EA program to see if any quantitative informationcould be drawn from the JSOW program data.
The JSOW program developed three guided-weapons variantsbased on a common “truck” airframe design. The initial JSOW A

How New Acquisition Practices Will Affect SE/PM Cost Estimates 121
version was to carry submunitions for soft targets, while the JSOW Bwas to carry fewer but larger submunitions for targets such as tanks.The JSOW C version used a unitary warhead for hard, fixed targets.The JSOW C version also added a seeker for more precise terminalguidance. Figure 6.3 shows the overlapping development schedulesfor the three JSOW variants.
We were able to collect historical cost information from the Na-val Air Systems Command cost department on the JSOW program.One difficulty we encountered was that the JSOW A and B variantswere developed on the same dispenser program contract, and theJSOW C was let on a separate contract. As such, the SE/PM costs forthe JSOW A and B development program are combined in much ofthe official cost data reports from the contractor. Nevertheless, theNaval Air Systems Command provided the breakout of the commonWBS elements, such as SE/PM, for each variant so that all threecould be compared.
We discovered from this information that all variants of theJSOW program experienced a higher SE/PM cost percentage than theaverage SE/PM cost percentage of other guided weapons develop-ment programs. Also, the JSOW A variant experienced a muchhigher SE/PM cost percentage than the two subsequent variants. This
Figure 6.3Overlapping Program Development Schedules of the Three JSOW Variants
RAND MG413-6.3
1992 1993 1994 1995 1996 1997 1998 1999 2000 2001 2002 2003 2004
JSOW A CA DT end1st
productiondelivery
1stproduction
delivery
1st productiondelivery
JSOW B CA DT end
JSOW C CA DT end

122 SE/PM: Trends and Costs for Aircraft and Guided Weapons Programs
may be indicative of the SE/PM effort that is associated with theJSOW A’s also providing the core SE/PM functions for the two latervariants. Unfortunately, we were not able to obtain a more detailedbreakout of the SE/PM costs by variant to clearly show how muchSE/PM is devoted to common tasks across all variants and to tasksthat apply solely to the specific variants.
Summary
Our investigation into the effects on SE/PM costs from new acquisi-tion initiatives produced mixed results. First, the reduction in mili-tary specifications and military standards does not seem to warrantadjustments to standard estimating methodologies employing histori-cal cost information from programs that used MILSPECs andMILSTDs. For programs utilizing IPTs, the results are inconclusive;one program showed no change in SE/PM cost and the other pro-gram showed an increase above the average cost. Because evolutionaryacquisition is still in its infancy, it was difficult to quantify its poten-tial effect on future SE/PM costs. Using a recent program as a surro-gate for evolutionary acquisition, we found an apparent increase inSE/PM costs for multiple variants of a weapon system being devel-oped simultaneously. Cost estimators should also consider whethertwo types of SE/PM effort should be estimated for programs utilizingEA—one associated with each capability increment and another asso-ciated with the overlay SE/PM effort for the program.

123
CHAPTER SEVEN
Conclusions
SE/PM is an important part of the total cost of developing and pro-ducing aircraft and guided weapons systems. While SE/PM costs arenot directly attributable to the specific work of designing or produc-ing the hardware or software content of an aircraft and weapons sys-tems program, they represent a significant portion of the “below-the-line” costs for program development and production.
Understanding the process of systems engineering and programmanagement provides a sense of the iterative development steps thatmatch customer needs with the final design and production output.Several tools (such as design reviews) are used by a systems engineerand program manager to monitor and adjust a design, while balanc-ing the necessary adjustments against the technological constraintsthey pose and the costs they may incur.
SE/PM Cost Trends
SE/PM represents about 12 percent of the total development costs foraircraft programs and about 28 percent of the overall developmentcosts for guided weapons programs. Aircraft development programshave experienced rising SE/PM costs over the past four decades, whileSE/PM costs for guided weapons programs have stayed relatively con-stant. There is an even split between SE and PM costs for aircraftprograms, and guided weapons have roughly a 60/40 split betweenSE and PM costs.

124 SE/PM: Trends and Costs for Aircraft and Guided Weapons Programs
SE/PM costs in production show a large degree of variationfrom one program to another and within a program from one pro-duction lot to the next. Throughout an aircraft program’s productionrun, SE/PM costs are constantly fluctuating. Although SE/PM costsfor guided weapons programs also exhibit much volatility, they tendto more closely follow the traditional cost-improvement curve (alsoknown as a “learning curve”; see Chapter Five).
Under the umbrella of acquisition reform, several changes to theacquisition process may affect SE/PM costs. We focused our effort onthe following three changes: the reduction in the number ofMILSPECS and MILSTDS, the use of IPTs, and the use of evolu-tionary acquisition.
SE/PM Definitions and Current Cost-EstimatingApproaches
One challenge in estimating SE/PM costs is determining what effortis contained in the SE/PM cost element. MIL-HDBK-881 spells outthe DoD definition for SE/PM, but there is ambiguity in the defini-tion that can make it difficult to implement consistently in cost-datacollection and, as a result, the inconsistency could affect SE/PM cost-estimating methods. The major weapons systems contractors we in-terviewed for this study had different ways of accounting for thesecosts, even among programs within the same company. Detailed in-formation from a few programs, however, indicates that many ofthe major categories of SE/PM costs were consistent among thecontractors.
Government and industry use different techniques to estimateSE/PM costs. Government’s current estimating techniques aggregateSE/PM costs with the rest of the engineering design costs. Dependingon the type of estimate required, contractors use a combination oftop-down and bottom-up estimating approaches, including factoringSE/PM costs against the engineering design hours.

Conclusions 125
New SE/PM Cost-Estimating Approaches
Our goal was to develop a way to directly estimate SE/PM costs usingparameters that are specifically related to those costs. By directly es-timating SE/PM costs, we hoped to better refine cost estimates andprovide a means for isolating any adjustments that are required toaccount for new acquisition methods. We also wanted to provide ameans for time-phasing SE/PM expenditures across a multiyear de-velopment program.
We chose to use parameters that are quantitative and readilyavailable early in a program’s life cycle. Through interviews withDoD government and industry cost analysts, we identified four gen-eral factors that drive SE/PM costs: program scope, program dura-tion, physical characteristics, and programmatic considerations.
Our next step was to determine which quantitative parameterscould be used to represent the SE/PM cost drivers and to develop,using regression analysis, cost-estimating relationships. The SE/PMCERs cover four areas of cost: aircraft development programs, aircraftproduction programs, guided weapons development programs, andguided weapons production programs.
For aircraft development programs, the best CER we could gen-erate is a log-linear function that relates SE/PM costs to the rest ofthe development cost of a program and the program’s design duration(months from contract award to first flight).1
Aircraft production programs presented a difficult challenge indeveloping accurate CERs for estimating SE/PM costs. We investi-gated the historical cost data to see if the variability was related tochanges in aircraft series or to the introduction of foreign militarysales, but we were unable to relate these two possible causes to varia-tions in the cost data. We developed three CERs to forecast SE/PMproduction costs, but all showed poor fit statistics to the historical____________1 We further found that SE/PM aircraft development costs are expended in the followingfashion: On average, the first third of the cost is expended between the contract award dateand critical design review, the second third is spent between CDR and first flight, and theremaining third is spent between first flight and the end of development testing. More detailson this analysis are in Appendix F.

126 SE/PM: Trends and Costs for Aircraft and Guided Weapons Programs
data. The SE/PM cost in production showed wide variation in costimprovement when the traditional learning-curve analysis is applied.Due to this uncertainty in the forecasts, caution should be exercisedwhen using the CERs we developed.
Similar to our findings on SE/PM costs for aircraft developmentprograms, SE/PM costs for guided weapons development are relatedto the total cost of a program (less SE/PM costs). The best functionalform was a linear one that fit the data rather well, but showed a largedegree of variation.
Because the historical data for guided weapons production pro-grams, our final area of parametric analysis, more closely resembledthe typical learning curve, the best CER we were able to develop wasa log-linear form that uses the T1000 cost, the lot midpoint, and theratio of the lot quantity to the maximum lot size as three independentparameters. As was the case with the CER for development cost, theproduction CER fit the data, but showed a large amount of variation.
To summarize, even though we were able to develop parametricCERs for directly estimating SE/PM costs, we advise cost analysts tocompare various techniques and use the one that best suits the par-ticular estimating situation. The data showed some large variations incost that were not captured by our CERs. Table 7.1 lists various es-timating techniques and the advantages and disadvantages of each.
SE/PM development costs can be spread across the developmentyears of a program using either the Weibull distribution (see Appen-dix F for more information) or a percentage of expenditures at spe-cific milestones.
New Acquisition Practices Have Mixed Effects on SE/PMCosts
When we investigated the effects of acquisition reform on SE/PMcosts, we focused on the following practices: reduction in the numberof military specifications and standards, the use of integrated productteams, and the use of evolutionary acquisition. Because these practices

Conclusions 127
Table 7.1Cost-Estimating Methods and Their Advantages and Disadvantages
Methods Advantages Disadvantages
Total engineeringCER
Includes all effortSimple to use
Does not identify amount forSE/PM except through allocation
May not directly relate to SE/PMcost drivers
Level of effort(bottom-up)
Better visibility of costsat a detailed level
Tailored to be programspecific
Government cost estimators do nothave sufficiently detailed data
Use of expert judgment toestimate level of effort does notutilize typical industry averageexperience
Content of detailed SE/PM costsmay be missed by a cost analystusing this approach
Percentage ofdesign effort
Can be tailored tospecifics of program
Possible vagueness in the DoDdefinition of the split betweendesign and SE/PM costs
RAND SE/PM CERs Takes into accountexperience frommany programs
Estimates SE/PMcosts directly usingparameters that arereadily available andthat are related toSE/PM effort
Assumes consistent definition ofSE/PM costs across contractorsand programs
Industry average may not accountfor specific program nuances
Does not provide details on costsbelow SE/PM cost element
CERs showed a high degree ofvariation, especially forproduction programs
are relatively new, there were limited data available to determine thequantitative effects on SE/PM costs. It was also difficult to determinecausality between the new practices and SE/PM costs. Overall, wedetermined, from what data we had, that these new practices havemixed results in changing SE/PM cost estimates from what theywould have been based on historical methods.
Using univariate analysis, we determined that programs with re-duced usage of military standards and specifications showed no ap-parent savings in SE/PM costs as compared with other programs inour dataset. We compared the SE/PM cost of the JDAM and JASSM

128 SE/PM: Trends and Costs for Aircraft and Guided Weapons Programs
development programs to the SE/PM cost of other guided weaponsprograms and found that the JDAM and JASSM costs were withinone standard deviation of the average for the guided weapons pro-grams in our dataset.
A similar analysis for programs using integrated product teamsprovided inconclusive results. Data from the F/A-18E/F and F/A-22development programs that were compared with data from other air-craft development programs showed that SE/PM costs for the twoprograms were not much different from the overall average SE/PMcosts for recent historical programs. Interviews with industry person-nel indicated that there may be increased SE/PM effort with IPTsdue to greater involvement between the contractor and the govern-ment. A comparison of detailed engineering hours for the F/A-18A/Band F/A-18E/F development programs showed an increase in SE en-gineering labor for the later program. When accounting for the effectof IPTs in new programs, cost estimators should carefully choose theprogram or programs used as the historical basis for estimates andconsider how those programs compare with the new IPT program.
Because programs done under evolutionary acquisition are stillin their infancy, we had limited data to determine the effects of a trueEA program on SE/PM cost. We performed a quantitative and aqualitative analysis of the possible effects of evolutionary acquisitionon SE/PM costs. For the former, we analyzed cost data from theJSOW program that utilized concurrent development of three weap-ons variants as a surrogate for an EA program. Cost data from thisprogram showed that all variants experience higher-than-averageSE/PM costs, with a significantly higher-than-average amount ofSE/PM required for the development of the first variant. For ourqualitative analysis, we interviewed a cost analyst on the Global Hawkprogram, one of the first major programs to implement EA. Based onthis discussion, we recommend that cost analysts should consider es-timating SE/PM costs in two parts. One part of the cost would bedirectly related to the capability increment or spiral being developedand another part would come from the core SE/PM activities cover-ing the entire program. Interviews with cost-estimating personnel inindustry also indicated that additional SE/PM effort is required on
Conclusions 129
EA programs. As more programs use this acquisition practice, moredata should be available to enable better evaluation of EA’s impact onSE/PM costs.
Given the large amount of resources required to perform SE/PMactivities on military systems, it would be wise to continue conduct-ing research in this area, especially given the desire of many tradi-tional prime contractors to become lead integrators of several com-plex weapons systems that are networked together. Two examples ofthis trend are the National Missile Defense System and the FutureCombat System, for which a contractor is selected to integrate severalprograms that are each large in their own right. Also, as is the casewith evolutionary acquisition, the systems engineering and programmanagement function may need to address new challenges that couldprove to be SE/PM cost drivers.


131
APPENDIX A
Relationship of Systems Engineering to theAcquisition Life-Cycle Process
The Defense Acquisition Management Framework, as described inDepartment of Defense Instruction 5000.2 (DoD, 2003b), providesa structured life-cycle process that is to be followed in the acquisitionof major programs.1 The systems engineering process continuesthroughout all of the life-cycle phases and determines the program’sprogress through a series of reviews. This appendix provides informa-tion on the focus and outcome of those reviews and how they relateto the acquisition life cycle.
As Figure A.1 shows, the Systems Engineering process is linkedto the acquisition life cycle through a series of reviews and audits (De-fense Acquisition University, 2004a). Milestones A, B, and C in thefigure indicate the major decision points at which the program is re-viewed for continuation into the next phase of the life cycle. Belowthe milestones are the life-cycle phases—Concept Refinement, Tech-nology Development, System Development and Demonstration(SD&D), Production and Deployment (P&D), and Operating andSupport (O&S). The P&D phase is further subdivided into the LRIPand Full Rate Production (FRP) phases.
____________1 In October 2003, the Deputy Secretary of Defense canceled the DoD 5000 series guidancedocuments, and the Joint Chiefs of Staff instituted a new capabilities-based process for iden-tifying current and future gaps in capability. The resulting Joint Capabilities Integration andDevelopment System defined a new process for determining department needs using top-down analyses rather than bottom-up requirement generation.

132 SE/PM: Trends and Costs for Aircraft and Guided Weapons Programs
Figure A.1Acquisition Life Cycle and Its Links to the Systems Engineering Process
RAND MG413-A.1
ConceptRefinement
TechnologyDevelopment
System Development and Demonstration
Productionand
DeploymentLRIP FRP
Operationsand
Support
Life cycle phase
Milestone A B C
Capabilitiesdocuments
ICD CDD CPD
Systemsengineeringreviews
ITR ASR SRR IBR TRA SRR IBRSFR PDR CDR
TRR SVR PRRTRA
DraftCDD
IBR OTRRPCA
ISR
A B C
Below the life-cycle phases is a series of capabilities documentsthat formally delineate capability needs and solutions to fill capabilitygaps. The Initial Capabilities Document (ICD) is prepared at the be-ginning of the Concept Refinement phase and documents the need toresolve a specific capability gap. It further defines the gap in measur-able terms and lists material and nonmaterial approaches to address-ing the gap. The ICD should be nonsystem specific. It is used to sup-port the decision at Milestone A to enter into the TechnologyDevelopment phase. The Capabilities Development Document(CDD) is based on the ICD. It outlines the capabilities to be deliv-ered in the first increment of the system and describes the overallstrategy for achieving full capability. The CDD provides the authori-tative guide for the attributes that are desired upon entering into theSD&D phase. These attributes define performance needs in measur-able and testable ways to support the development of the system be-fore the Milestone B decision. The final document, the CapabilityProduction Document (CPD), is used to address production attrib-utes and quantities for procurement. It is further used to support theMilestone C decision to move into the P&D phase. Below the capa-bilities documents are the Systems Engineering Reviews. We next ex-

Relationship of Systems Engineering to the Acquisition Life-Cycle Process 133
plain how those reviews relate to the activities being performed dur-ing each phase of the life cycle.
During the concept refinement phase, systems engineers per-form advanced studies of a broad array of approaches to meet the de-sired needs of the customer. Two SE reviews occur during this phase:the Initial Technical Review (ITR) and the Alternative Systems Re-view (ASR). The ITR is designed to assess the capability needs andthe approach to meeting those needs and to ensure that the program’stechnical baseline is sufficiently defined to support a valid cost esti-mate. The ASR is a comprehensive assessment of the preferred ap-proach to ensure that the resulting set of requirements agrees with thecustomer’s needs. The ASR should be completed before the Mile-stone A decision is made to enter the technology development phase.
During the technology development phase, systems engineershave the task of converting a required capability into a system per-formance specification. Three major reviews are conducted duringthis phase: the System Requirements Review (SRR), the IntegratedBaseline Review (IBR), and the Technology Readiness Assessment(TRA). The SRR is used to confirm that progress is being made onascertaining the technical requirements and that convergence on abalanced and complete solution is being achieved. Most important,this review should determine if all system requirements as stated inthe ICD or draft CDD are being met with an acceptable amount ofcost, schedule, and technical risk. The IBR establishes a project-performance baseline for measuring earned-value progress during exe-cution of a project. The TRA is a regulatory requirement for assessingthe maturity of critical technologies used by the system.
After the Milestone B decision, the program enters the SD&Dphase. During this phase, the concept for eventual production andfielding is further developed. Detailed design is performed, and de-velopmental units are produced to establish initial production meth-ods and to support testing.
The SRR and IBR may be repeated at the beginning of theSD&D phase to ensure baselines are well understood by both thegovernment and the contractor. The System Functional Review(SFR) ensures that the system can enter preliminary design and that it
134 SE/PM: Trends and Costs for Aircraft and Guided Weapons Programs
meets the system requirements defined in the CDD. The review en-sures that the system functional requirements are captured in the sys-tem specifications and fully decomposed into lower-level subsystems.The functional baseline is the document that describes the systemcharacteristics and how achievement of these characteristics will beverified.
The Preliminary Design Review (PDR) determines if the designcan enter the detailed design phase. It assesses whether the perform-ance specifications of each configuration item are fully captured andensures that each system function has been allocated to hardware orsoftware elements. The PDR establishes the system-allocated baseline.The allocated baseline documents the configuration items making upthe system and allocates the system-level performance requirements tothose items. The Critical Design Review (CDR) at this point furtherevaluates the completeness of the design and the interfaces betweeneach configuration item to ensure that the system can proceed intosystem fabrication, demonstration, and testing. The functional andallocated baselines again are reviewed and any necessary changes areincorporated into them. The CDR checks for completeness and toensure that initial builds of the hardware and coding of the softwaremay begin. A final check is made against the requirements to verifythe baseline design.
The final major reviews performed under SD&D are the TestReadiness Review (TRR), the System Verification Review (SVR), andthe Production Readiness Review (PRR). The TRR is designed toassess test readiness and review the test plans to ensure that theplanned test requirements track with the user’s needs. The SVR en-sures the system is ready to enter LRIP by verifying final product per-formance and providing inputs to the CPD. The PRR assesseswhether the design is ready for production and the contractor hasperformed adequate manufacturing planning. A second TRA mayalso be conducted during this phase prior to the Milestone C deci-sion.
Systems engineering during the P&D phase of the life cyclelooks for problems that may call for improvement or redesign of thesystem. An additional IBR may be conducted to once again ensure a

Relationship of Systems Engineering to the Acquisition Life-Cycle Process 135
performance baseline for measuring earned value. The OperationalTest Readiness Review (OTRR) is similar to the TRR, but it is con-ducted prior to entering formal OT&E. It ensures that the systemcan proceed into the operational test phase with a high probability ofsuccess. The objective is to test the system for suitability and effec-tiveness for service introduction. The decision to proceed to full-rateproduction may hinge upon a successful operational test. The Physi-cal Configuration Audit (PCA) is performed to ensure that the testunit representing a production item fully reflects the design baselinespecified in the contract. The PCA is usually conducted when thegovernment intends to control the detailed design by acquiring theTechnical Data Package. If the government does not plan to do so,the contractor should perform the PCA internally.
Finally, the O&S phase is focused on sustainment of the systemas it is fielded. In this phase, new threats are discovered, missions arechanged, and deficiencies are brought to light. New technologies andupgrades augment the original concept to meet the new require-ments. SE weighs these potential product improvements against theevolving baseline to continually meet the customer’s requirements. InService Reviews (ISRs) may be done to determine the technical statusand condition of the fielded system. Large changes to a system maylead to a new program that requires the systems engineering process(complete with formal baselines and reviews) to be repeated.


137
APPENDIX B
MIL-HDBK-881 Excerpt: Definitions of SE/PM forCost Reporting
H.3.2 Systems Engineering/Program Management
The systems engineering and technical control as well as the businessmanagement of particular systems and programs. Systems engineer-ing/program management elements to be reported and their levelswill be specified by the requiring activity.
Includes:the overall planning, directing, and controlling of the definition,
development, and production of a system or program including sup-portability and acquisition logistics, e.g., maintenance support, facili-ties, personnel, training, testing, and activation of a system.
Excludes:systems engineering/program management effort that can be as-
sociated specifically with the equipment (hardware/software) element.
Systems Engineering
The technical and management efforts of directing and controlling atotally integrated engineering effort of a system or program.
Includes but not limited to:• effort to define the system and the integrated planning and con-
trol of the technical program efforts of design engineering, spe-

138 SE/PM: Trends and Costs for Aircraft and Guided Weapons Programs
cialty engineering, production engineering, and integrated testplanning.
• effort to transform an operational need or statement of defi-ciency into a description of system requirements and a preferredsystem configuration.
• technical planning and control effort for planning, monitoring,measuring, evaluating, directing, and replanning the manage-ment of the technical program.
• (all programs, where applicable) value engineering, configurationmanagement, human factors, maintainability, reliability, surviv-ability/vulnerability, system safety, environmental protection,standardization, system analysis, logistic support analysis, etc.
• (for ships) the Extended Ship Work Breakdown Structure(ESWBS), Configuration Management (811), Human Factors(892), Standardization (893), Value Engineering (894), and Re-liability and Maintainability (895) elements.
Excludes:actual design engineering and the production engineering di-
rectly related to the WBS element with which it is associated.
Examples of systems engineering efforts are:
1. System definition, overall system design, design integrity analysis,system optimization, system/cost effectiveness analysis, and intra-system and inter-system compatibility assurance, etc.; the integra-tion and balancing of reliability, maintainability, producibility,safety, human health, environmental protection, and survivability;security requirements, configuration management and configura-tion control; quality assurance program, value engineering, prepa-ration of equipment and component performance specifications,design of test and demonstration plans; determination of softwaredevelopment or software test facility/environment requirements.
2. Preparation of the Systems Engineering Management Plan(SEMP), specification tree, program risk analysis, system plan-ning, decision control process, technical performance measure-

MIL-HDBK-881 Excerpt: Definitions of SE/PM for Cost Reporting 139
ment, technical reviews, subcontractor and vendor reviews, workauthorization, and technical documentation control.
3. Reliability engineering—the engineering process and series oftasks required to examine the probability of a device or systemperforming its mission adequately for the period of time intendedunder the operating conditions expected to be encountered.
4. Maintainability engineering—the engineering process and seriesof tasks required to measure the ability of an item or system to beretained in or restored to a specified condition of readiness, skilllevels, etc., using prescribed procedures and resources at specificlevels of maintenance and repair.
5. Human factors engineering—the engineering process and the se-ries of tasks required to define, as a comprehensive technical andengineering effort, the integration of doctrine, manpower, andpersonnel integration, materiel development, operational effec-tiveness, human characteristics, skill capabilities, training, man-ning implications, and other related elements into a comprehen-sive effort.
6. Supportability analyses—an integral part of the systems engineer-ing process beginning at program initiation and continuingthroughout program development. Supportability analyses formthe basis for related design requirements included in the systemspecification and for subsequent decisions concerning how tomost cost effectively support the system over its entire life cycle.Programs allow contractors the maximum flexibility in proposingthe most appropriate supportability analyses.
Program Management
The business and administrative planning, organizing, directing, co-ordinating, controlling, and approval actions designated to accom-plish overall program objectives [that] are not associated with specifichardware elements and are not included in systems engineering.
Includes, for example:

140 SE/PM: Trends and Costs for Aircraft and Guided Weapons Programs
• cost, schedule, performance measurement management, war-ranty administration, contract management, data management,vendor liaison, subcontract management, etc.
• support element management, defined as the logistics tasksmanagement effort and technical control, and the business man-agement of the support elements. The logistics managementfunction encompasses the support evaluation and supportabilityassurance required to produce an affordable and supportable de-fense materiel system.
• planning and management of all the functions of logistics.
Examples are:
– maintenance support planning and support facilities plan-ning; other support requirements determination; supportequipment; supply support; packaging, handling, storage,and transportation; provisioning requirements determina-tion and planning; training system requirements determi-nation; computer resource determination; organizational,intermediate, and depot maintenance determination man-agement; and data management.
– (for ships) the Extended Ship Work Breakdown Structure(ESWBS), Project Management (897); Data Management(896); and Supply Support (853) elements.

141
APPENDIX C
Contractor Questionnaire
RAND Systems Engineering and Program ManagementCost Estimating Methodologies Project
Background: As part of ongoing research activities under Project AIRFORCE, RAND has been tasked to investigate approaches to developcost estimates for systems engineering (SE) and program management(PM) for military aircraft and guided weapons programs. We are in-terested in investigating the nature of SE and PM costs, collectinghistorical cost data, and developing estimating methodologies thatcan be used to better estimate SE and PM costs for development andproduction programs.
1. Definitions and Breakout: Government contract cost reportinguses MIL-HDBK-881 to define the content of cost categories in-cluding Systems Engineering (SE) and Program Management(PM). Do you agree with this definition? If not, what are the dif-ferences in definitions used by your company? Do you combinethe costs for these functions, or do you estimate and track themseparately? If possible, please provide a more detailed breakout ofthese costs showing internal cost accounting categories under SEand PM. Are all SE and PM functions charged as direct cost, orare there any indirect costs that would be picked up in the over-head accounts?
2. Cost Drivers: What do you believe are the cost drivers for bothSE and PM (e.g., size of contract, complexity of program, teaming

142 SE/PM: Trends and Costs for Aircraft and Guided Weapons Programs
with other contractors, etc.)? If program complexity is considered,how is it measured (i.e., number of drawings, weight, SLOCcounts)? What role does the duration of the contract play in theestimate of SE and PM costs? How do major milestones (i.e., timeto first flight, time to first avionics flight, time to first guidedlaunch) affect SE/PM cost estimates? Does the number of reviewsaffect SE and PM costs? Does the amount of subcontracted workaffect SE and PM costs?
3. Methodology: When developing a proposal estimate for SE andPM costs, what approach is generally used? What independentvariables are used to estimate the overall SE and PM costs of atypical program? What adjustments need to be considered if usingan analogy to a previous program? If possible, please provide anexample of a recent estimate on a major program.
4. Phasing: During the development phase of a program, what dothe SE and PM expenditure profiles look like? For SE, is there asteep ramp up and ramp down leading to a low level-of-effort forthe duration of the development? Is the peak spending rate relatedto a key development milestone, such as Critical Design Review(CDR), first flight, or first guided launch? Is PM essentially alevel-of-effort throughout the development? What activities ac-count for this profile and how do they change through the devel-opment program? Are SE and PM costs related to the DoD mile-stone review process (Preliminary Design Review, CDR, DefenseAcquisition Board, etc.)? Please provide historical quantitative in-formation to support this profile. Also, if possible, please provide aprogram schedule that can be used to overlay on the profile toprovide the context of the program.
5. Transition from Development into Production: How do thetasks involved with SE and PM change when a program movesfrom the Development phase into the Production phase (sustain-ing engineering)? Does the SE staff from development continuewith the program into production, or are they replaced and reas-signed to new development efforts? How do you estimate SE andPM costs in production (percentage of manufacturing, cost im-provement curve, fixed headcount)? Are there fixed and variable

Contractor Questionnaire 143
aspects to SE and PM costs in production? What role does thenumber of units produced in a lot (rate) have on SE and PMcosts? How does the number of Engineering Change Orders(ECOs) affect SE and PM costs? How do you estimate theamount of SE and PM effort to support ECOs? Is there a smallercost since there is already an engineering staff supporting the mainprogram? Do multiyear contracts affect SE and PM costs at eitherthe prime or subcontract level?
6. Trends over Time: What has been the trend over time across dif-ferent programs on SE and PM costs? What has been the effect onSE and PM costs of pushing more of the design/trade-off analysisto suppliers? Has the concept of having preferred supplierschanged the amount of SE and PM required at the prime contrac-tor level? How do you estimate/verify subcontract/supplier SE andPM charges? Have new tools played a role in improving the pro-ductivity of SE and PM? Do these new tools allow for more de-sign iterations/trade-offs to be explored in the same amount oftime at the same cost as historical programs, or is there an actualreduction of effort required?
7. New Initiatives: How will the following acquisition initiativesaffect SE and PM costs?
• Commercial Off-the-Shelf (COTS) hardware and software• Total Systems Program Responsibility (TSPR)• Decreased used of MILSPECS and increased use of perform-
ance-based specs• Integrated Product Teams (IPTs)• Spiral Development and Evolutionary Acquisition• Systems-of-Systems concepts• What considerations should a cost estimator and program man-
ager have regarding these new initiatives? What work contenthas changed? If possible, please provide quantitative informationto support any estimates for cost savings projections.
8. Data: Please provide as much detailed cost data in dollars, workyears, and headcounts for SE and PM for both development and

144 SE/PM: Trends and Costs for Aircraft and Guided Weapons Programs
production for all programs at your company. Preferably, wewould like to see the efforts phased across program years. Pleaseshow headcount comparisons of the SE staff in the developmentphase as compared with the production phase on specificprograms.

145
APPENDIX D
Variables Used in Developing CERs
Table D.1 lists the independent variables that we chose to representthe potential cost drivers of SE/PM costs in aircraft and guided weap-ons development and production programs. We used these explana-tory variables to develop CERs for estimating SE/PM costs directly.(See Chapter Five for further information.)
Table D.1Aircraft Variables
Variable Description/Definition
FF First flight (FF) date of the aircraft that occurs during the devel-opment of the program. For this study, the year that FF took placewas used.
CAFF The duration of the design effort measured by months from con-tract award to FF date.
CADT The duration of the development effort measured by months fromcontract award to end of DT.
NRDEV NRDEV is the nonrecurring development cost and is normalized toFY03 constant dollars by applying an inflation index at the mid-point of the development program (contract award to end of DT)to the then-year cost reported in a CCDR or similar cost report. It isused as a measure of the size of the development effort. It ex-cludes recurring costs, which are mostly costs from production oftest assets.
TDEVLSEPM TDEVLSEPM is the total development cost less SE/PM and is normal-ized to FY03 constant dollars by applying an inflation index at themidpoint of the development program (contract award to end ofDT) to the then-year cost reported in a CCDR or similar cost report.It is used as a measure of the size of the development effort.

146 SE/PM: Trends and Costs for Aircraft and Guided Weapons Programs
Table D.1—Continued
Variable Description/Definition
AV/AF AV/AF is the ratio of development air vehicle cost divided by theairframe development cost. Larger AV/AF values indicate the po-tential for proportionally more engineering effort not related to ahardware item.
WE The weight empty parameter is used as an indication of the scopeof a program or product.
PROTO Prototype dummy or binary variable, where a value of 1 indicates aprototype program and a value of 0 indicates all other develop-ment programs.
AAD Airframe already developed dummy or binary variable, where avalue of 1 indicates a development program in which the airframehas already been developed and a value of 0 indicates all otherdevelopment programs.
PVF Previous version already fielded dummy or binary variable, where avalue of 1 indicates a development program in which a previousmodel of the airframe has already been developed and a value of 0indicates all other development programs.
AV AUC AV AUC is the air vehicle average unit cost per lot and is measuredin FY03 constant dollars. It is used as a measure of the scope andcomplexity of a product in production.
AV T100 AV T100 is the air vehicle cost at the one-hundredth unit. It ismeasured in FY03 constant dollars. The cost is calculated using acumulative quantity slope only; it does not include the cost of theengine. It is used as a measure of the scope and complexity of aproduct in production.
SEPM DEV SE/PM cost in the development program is measured in FY03 con-stant dollars and includes recurring and nonrecurring costs.
RATE The yearly production lot quantity for each year of production.
LOT NUM LOT NUM indicates the production lot of a specific aircraft. The firstin a yearly production lot is LOT NUM 1, and later lots are num-bered sequentially.
LOT MP Algebraic lot midpoint calculated using the slope of the cost-improvement curve for SE/PM.
SEPM UC SEPM UC is the unit cost of SE/PM in production for a given produc-tion lot.
SEPM LOT SEPM LOT is the lot cost of SE/PM in production for a given produc-tion lot.
Qn/Qmax The ratio of the quantity produced in a given lot divided by themaximum yearly lot quantity for the entire production buy.
LLOT Last lot binary or dummy variable, where 1 indicates the last pro-duction lot and 0 indicates all other production lots.

Variables Used in Developing CERs 147
Table D.2Guided Weapons Variables
Variable Description/Definition
CA The year in which the development contract was awarded.
CADT Duration of the development effort measured by months from con-tract award to end of DT.
CAFGL Duration of the design effort measured by months from contractaward to first guided launch date.
CAFPD Duration of the development effort measured in months from con-tract award to first production delivery.
DEN The DEN parameter is a ratio of the weight of a weapon divided bythe cross-sectional area. It is intended to indicate packaging com-plexity of a weapon, where weight is measured in pounds andcross-sectional area is calculated as Pi * (diameter in inches^2)/4.
DIAM Diameter of a weapon measured in inches.
TDEV TDEV is the total development cost measured in FY03 constant dol-lars, calculated by applying an inflation index at the midpoint ofthe development program (contract award to end of DT) to thethen-year cost reported in a CCDR or similar cost report. It is ameasure of the size of the development effort.
TDEVLSEPM TDEVLSEPM is the total development cost less SE/PM. It is measuredin FY03 constant dollars, calculated by applying an inflation indexat the midpoint of the development program (contract award toend of DT) to the then-year cost reported in a CCDR or similar costreport. It is a measure of the size of the development effort.
WT WT in pounds is an indication of the scope of a program or product.
DVMOD D&V or modification program dummy (or binary) variable, where avalue of 1 indicates a D&V or modification program and a value of 0indicates all other development programs.
LOT MP Algebraic lot midpoint calculated using the slope of the cost-im-provement curve for SE/PM.
RATE The yearly production lot quantity for each year of production.
SEPM DEV SE/PM cost in the development program is measured in FY03 con-stant dollar and includes recurring and nonrecurring costs.
WPN T100 The recurring cost of the one-hundredth weapon. It is measured inFY03 constant dollars and is calculated using cumulative quantityslope only. It is used as a measure of the scope and complexity ofthe product in production.
WPN T1000 The recurring cost of the one-thousandth weapon is measured inFY03 constant dollars and is calculated using the cumulative-quantity slope only. It is used as a measure of the scope and com-plexity of a product in production.

148 SE/PM: Trends and Costs for Aircraft and Guided Weapons Programs
Table D.2—Continued
Variable Description/Definition
Qn/Qmax The ratio of the quantity produced in a given lot divided by themaximum yearly lot quantity for the entire production buy.
SEPM UC SEPM UC is the unit cost of SE/PM in production for a given produc-tion lot.
SEPM LOT SEPM LOT is the lot cost of SE/PM in production for a given produc-tion lot.
LOT NUM The lot number indicating the specific aircraft yearly production lotnumber, where 1 is the first production lot and lots are numberedsequentially.
LLOT Last lot binary or dummy variable, where 1 indicates the last pro-duction lot and 0 indicates all other production lots.

149
APPENDIX E
Statistical Correlations for SE/PM CER Variables
The tables on the following pages provide the correlation matrices forthe SE/PM CER variables in the datasets used for this study. SeeChapter Five for a related discussion.

Table E.1Correlation Matrix: Aircraft Development
FF CAFF CADT SEPM DEV TDEVLSEPM NRDEV AV/AF WE PROTO AAD
FF 100% 47% 25% 32% 26% 30% –15% 16% 1% –12%
CAFF 47% 100% 83% 87% 81% 85% –11% 32% –12% –18%
CADT 25% 83% 100% 83% 81% 82% –16% 22% –12% –42%
SEPM DEV 32% 87% 83% 100% 95% 96% –2% 12% –20% –17%
TDEVLSEPM 26% 81% 81% 95% 100% 99% –3% 11% –29% –23%
NRDEV 30% 85% 82% 96% 99% 100% –1% 10% –28% –22%
AV/AF –15% –11% –16% –2% –3% –1% 100% –25% 47% 1%
WE 16% 32% 22% 12% 11% 10% –25% 100% 36% –27%
PROTO 1% –12% –12% –20% –29% –28% 47% 36% 100% –22%
AAD –12% –18% –42% –17% –23% –22% 1% –27% –22% 100%
150 SE/PM: Tren
ds an
d C
osts fo
r Aircraft an
d G
uid
ed W
eapo
ns Pro
gram
s

Table E.2Correlation Matrix: Aircraft Production
LOTNUM
SEPMLOT SEPM UC Qn/Qmax RATE
SEPMDEV NRDEV WE AV AUC AV T100 LOT MP
LOT NUM 100% –29% –25% –41% –26% –27% –7% –32% –31% –32% 40%
SEPM LOT –29% 100% 31% 29% 51% 25% 7% 8% 7% 12% 22%
SEPM UC –25% 31% 100% –5% –34% 52% 32% 54% 56% 71% –28%
Qn/Qmax –41% 29% –5% 100% 41% 18% –11% 9% –2% 16% –25%
RATE –26% 51% –34% 41% 100% –11% –5% –28% –26% –33% 51%
SEPM DEV –27% 25% 52% 18% –11% 100% 82% 63% 67% 82% –17%
NRDEV –7% 7% 32% –11% –5% 82% 100% 54% 58% 64% 1%
WE –32% 8% 54% 9% –28% 63% 54% 100% 85% 86% –30%
AV AUC –31% 7% 56% –2% –26% 67% 58% 85% 100% 81% –28%
AV T100 –32% 12% 71% 16% –33% 82% 64% 86% 81% 100% –36%
LOT MP 40% 22% –28% –25% 51% –17% 1% -30% –28% –36% 100%
Statistical Co
rrelation
s for SE/PM
CER
Variab
les 151
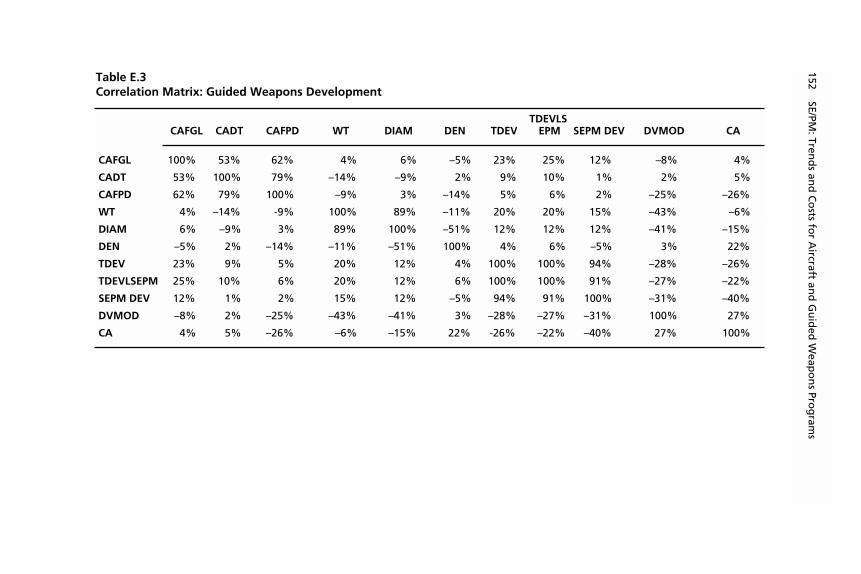
Table E.3Correlation Matrix: Guided Weapons Development
CAFGL CADT CAFPD WT DIAM DEN TDEVTDEVLS
EPM SEPM DEV DVMOD CA
CAFGL 100% 53% 62% 4% 6% –5% 23% 25% 12% –8% 4%
CADT 53% 100% 79% –14% –9% 2% 9% 10% 1% 2% 5%
CAFPD 62% 79% 100% –9% 3% –14% 5% 6% 2% –25% –26%
WT 4% –14% -9% 100% 89% –11% 20% 20% 15% –43% –6%
DIAM 6% –9% 3% 89% 100% –51% 12% 12% 12% –41% –15%
DEN –5% 2% –14% –11% –51% 100% 4% 6% –5% 3% 22%
TDEV 23% 9% 5% 20% 12% 4% 100% 100% 94% –28% –26%
TDEVLSEPM 25% 10% 6% 20% 12% 6% 100% 100% 91% –27% –22%
SEPM DEV 12% 1% 2% 15% 12% –5% 94% 91% 100% –31% –40%
DVMOD –8% 2% –25% –43% –41% 3% –28% –27% –31% 100% 27%
CA 4% 5% –26% –6% –15% 22% -26% –22% –40% 27% 100%
152 SE/PM: Tren
ds an
d C
osts fo
r Aircraft an
d G
uid
ed W
eapo
ns Pro
gram
s

Table E.4Correlation Matrix: Guided Weapons Production
LOTNUM RATE SEPM UC
SEPMLOT LOT MP
SEPMDEV WT DIAM DEN LLOT
WPNT100
WPNT1000 Qn/Qmax
LOT NUM 100% 14% –35% –1% 65% –8% –7% –8% 17% 32% 4% 18% 38%
RATE 14% 100% –36% –31% 55% –16% –27% –21% –8% 23% –46% –49% 37%
SEPM UC –35% –36% 100% 38% –35% 18% 34% 32% –15% –11% 38% 34% –42%
SEPM LOT –1% –31% 38% 100% –34% 31% 28% 31% –13% –9% 65% 78% 7%
LOT MP 65% 55% –35% –34% 100% –34% –26% –31% 23% 34% –41% –38% 22%
SEPM DEV –8% –16% 18% 31% –34% 100% 16% 24% –34% 4% 60% 40% 7%
WT –7% –27% 34% 28% –26% 16% 100% 92% –25% 6% 33% 51% 6%
DIAM –8% –21% 32% 31% –31% 24% 92% 100% –57% 8% 34% 52% 5%
DEN 17% -8% –15% –13% 23% –34% –25% –57% 100% –11% –18% –17% –3%
LLOT 32% 23% –11% –9% 34% 4% 6% 8% –11% 100% –1% –3% 18%
WPN T100 4% –46% 38% 65% -41% 60% 33% 34% –18% –1% 100% 81% 0%
WPN T1000 18% –49% 34% 78% –38% 40% 51% 52% –17% –3% 81% 100% 12%
Qn/Qmax 38% 37% –42% 7% 22% 7% 6% 5% –3% 18% 0% 12% 100%
Statistical Co
rrelation
s for SE/PM
CER
Variab
les 153

155
APPENDIX F
Techniques for Developing Expenditure Profilesfor SE/PM Development Costs
Cost estimators are sometimes asked for budgetary purposes to spreadpoint estimates of weapons system development costs across a year-by-year spending profile. We reviewed our cost data for informationthat would be helpful in providing guidance for spreading point esti-mates of aircraft development programs. Please note that the follow-ing discussion relates to expenditure profiles for SE/PM costs. A sec-ond step is required to translate these expenditure profiles intobudgeting profiles.1
For this analysis, we collected expenditure information on someof the more recent tactical aircraft development programs.2 Unfortu-nately, we did not have CCDR data in regular increments for all oreven most of the programs in our dataset. We decided to analyze thefighter aircraft development programs as a subset of our larger dataset____________1 Within government, there is a time delay from when budget authority is granted to whencontracts are signed, funds are obligated, and finally funds are expended or there is an outlayof funds. DoD development programs are typically funded under Research, Development,Test, & Evaluation (RDT&E) appropriation, which allows funds appropriated in a singleyear to be expended over multiple years. The Under Secretary of Defense (Comptroller)typically estimates the outlay rates for each appropriation in budget estimates. Based on theNational Defense Budget Estimate for FY 2004, the RDT&E defense-wide outlays arespread over four years in the following percentages: 46, 42, 10, and 2. Given the expenditureprofile and the outlay rates, a system of linear equations can be used to determine theamounts that should be budgeted in each year. For more information, see Lee, Hogue, andGallagher (1997).2 The names of the programs were withheld from this discussion to avoid supplying proprie-tary information. A supplemental, limited-distribution RAND report (TR-311-AF) suppliesthe name and data for each of the programs used for this analysis.

156 SE/PM: Trends and Costs for Aircraft and Guided Weapons Programs
because we had incremental cost data on several older, full-scale de-velopment fighter programs as well as a few recent programs. Thissubset would allow us to hold constant the type of aircraft and natureof the development effort, while focusing on changes in duration andtime.
Because the durations of the programs varied widely, we ana-lyzed the rate of SE/PM expenditures using two approaches. The firstapproach uses a time scale based on the number of months from con-tract award. For this approach, we normalized the monthly time scaleto a percentage of time, such that the duration starts with 0 percentof time completed at CA and ends with 100 percent of time com-pleted at end of DT. The second approach uses milestone points as ameans of gauging the amount of SE/PM costs expended at thosepoints in the program schedule. Either approach can then be usedagainst the total SE/PM development-cost point estimate to deter-mine an expenditure profile.
Table F.1 shows the number of months to CDR, FF, and end ofDT for the programs we analyzed. The first two programs showed arather short duration of time to first flight. Upon investigation ofthese programs, we determined that the short schedule was due towork that was performed prior to the contract full-scale developmentprogram. We decided to not use the first two programs in our
Table F.1Time to Development Milestones
ProgramMonths to
CDRMonths
to FFMonths to
DT EndMonthsto CDR
Monthsto FF
Months toDT End
A 17 22 67 — — —B 3 23 48 — — —C 15 30 89 15 30 89D 16 35 75 16 35 75E 25 41 81 25 41 81F 42 73 150 42 73 150
Average 20 37 85 25 45 99
StandardDeviation 13.0 18.9 34.8 12.5 19.4 34.6

Techniques for Developing Expenditure Profiles for SE/PM Development Costs 157
analysis and concentrate on the other four programs that had sched-ules that seemed more consistent with recent aircraft developmentprograms.
Using the first approach for determining the expenditure profile,we started the analysis by developing a Weibull3 distribution for eachprogram to model the actual expenditure profile against a normalizedtime scale. The plotted data for the four programs modeled by theWeibull distribution appear in Figure F.1. The modeled data are veryclose to the actual data points. Any missing data points, such as wasthe case for Programs E and F, were interpolated by the Weibullcurve. The Weibull distribution essentially performed an optimiza-tion of distribution parameters to best fit the curve to the data points.
The next step was to determine an average Weibull curve thatcould be used to model SE/PM expenditures in a general fashion.The Weibull curves for each program were used to generate expendi-tures at common incremental points in the program’s duration. Thedata at each increment were averaged across the four programs to de-velop an average SE/PM expenditure profile. By iteratively choosingshape and scale parameters for the average distribution and minimiz-ing the error between a predicted expenditure curve and the averagecurve, we were able to generate average Weibull parameters. TableF.2 shows the Weibull shape and scale parameters generated for eachprogram and for the average program.
A cost analyst can use these alpha and beta parameters to createa cumulative expenditure profile at desired increments of time in aspreadsheet program such as Microsoft Excel. Excel has a Weibull
____________3 The Weibull distribution is similar to the Rayleigh distribution often used by cost estima-tors to estimate expenditure profiles of development programs. The Weibull is a more gener-alized form than the Rayleigh, with one additional adjustable parameter. The Weibull cu-mulative distribution function is: F(x,a,b) = 1 – e^ – (x/b)^a, where x is a point in theprogram’s duration between 0 and 1, e is the constant 2.71828182845904 (the base of thenatural logarithm), and a and b are adjustable parameters to the distribution that describe itsscale and shape. The additional adjustable parameter in the Weibull allowed a slightly betterfit of the historical data than the Rayleigh. Both functions fit the historical data closely andwill provide a reasonably shaped budget profile for a development program.

158 SE/PM: Trends and Costs for Aircraft and Guided Weapons Programs
Figure F.1SE/PM Cost Spreads for Four Fighter Aircraft Development Programs, Nor-malized Durations
Duration of full-scale development
SE/P
M c
ost
s sp
ent
for
5% o
f to
tal d
ura
tio
n 16%
14%
12%
10%
8%
6%
4%
2%
0%
RAND MG413-F.1
0% 20% 40% 60% 80% 100%
Program CProgram DProgram EProgram F
Table F.2Weibull Parameters for Modeling SE/PMDevelopment Expenditures
Program Alpha-Shape
ParameterBeta-ScaleParameter
C 1.6605 0.3418
D 1.6470 0.3952
E 1.7722 0.4127
F 1.9025 0.4839
Average program profile 1.7047 0.4079
function that requires an analyst to input the cumulative time elapsedand the alpha and beta parameters. The function returns the cumula-tive amount of funds spent at the specified time.

Techniques for Developing Expenditure Profiles for SE/PM Development Costs 159
As stated above, with the second approach, we compared costs atcommonly used milestone points. Table F.3 shows the cumulativepercentage of elapsed program time at each milestone (with 0 percentbeing the contract award milestone and 100 percent being the end ofDT milestone) and the cumulative percentage of SE/PM expended byCDR and FF on the four aircraft development programs. These dataindicate that at CDR, which happens on average when 23 percent ofthe program’s duration has elapsed, about one-third of the SE/PMfunding is expended. At first flight, which occurs on average at 43percent of the way through a program, about two-thirds of theSE/PM funds are spent. These findings indicate that the SE/PMfunding is somewhat front-loaded against the schedule and that CDRand FF milestones can be used as good benchmarks for determiningthe amount of SE/PM expenditures expected at each milestone.
We used the same method of analysis for guided weapons devel-opment programs, but we had complete CCDR data for only oneguided weapons full-scale development program. The expenditureprofile for the guided weapons development program looked muchlike the profile for the aircraft programs. The Weibull shape and scalevalues were 1.920 and 0.4534, respectively. For this guided weaponprogram, the CDR and first guided launch dates occurred almost atthe same time; CDR occurred 46 percent of the way through theprogram, and first guided launch occurred 48 percent of the waythrough the program. By the first guided launch, 62 percent of
Table F.3Cumulative SE/PM Expenditures by Development Milestone
CDR First Flight
Program Elapsed TimeSE/PM Funds
Expended Elapsed TimeSE/PM Funds
Expended
C 17% 27% 34% 62%D 21% 30% 47% 73%E 30% 44% 49% 75%F 24% 30% 42% 64% Average 23% 33% 43% 69%

160 SE/PM: Trends and Costs for Aircraft and Guided Weapons Programs
SE/PM funds had been expended. Figure F.2 shows the plot of theWeibull expenditure profile for this program, normalizing the elapsedtime to 0 percent at contract award and 100 percent at the end ofDT.
In this appendix, we discussed methods for generating expendi-ture profiles for point estimates of SE/PM costs for aircraft andguided weapons development programs. An analyst may use eitherthe Weibull function with the parameters listed above or the mile-stone approach. Average values can be used, or, if an analogous ap-proach is deemed more appropriate, values from a specific program ofinterest can be used.
Figure F.2SE/PM Cost Spreads for One Guided Weapons Development Program,Normalized Duration
Duration of full-scale development
SE/P
M c
ost
s sp
ent
for
5% o
f to
tal d
ura
tio
n 16%
14%
12%
10%
8%
6%
4%
2%
0%
RAND MG413-F.2
0% 20% 40% 60% 80% 100%
161
Bibliography
Armament Product Group Manager, Weapons File, Eglin Air Force Base,Fla.: Air Armament Center, 1999.
Ball, Robert E., The Fundamentals of Aircraft Combat Survivability Analysisand Design, New York: American Institute of Aeronautics and Astronau-tics (AIAA) Education Series, 1985.
Book, Stephan A., and Philip H. Young, “The Trouble with R2,” Journal ofParametrics, forthcoming.
Chambers, George J., “The System Engineering Process: A Technical Bibli-ography,” INCOSE (International Council on Systems Engineering),reprinted from IEEE Transactions on Systems, Man, and Cybernetics, Vol.SMC-16, No. 5, September/October 1986, pp. 712–722 (http://www.incose.incose.propagation.net/lib/sebib.html last accessed Aug 25, 2003).
Chromicz, J., The Tri-Service Missiles and Munitions Automated Cost Data-base, Arlington, Va.: Tecolote Research, Inc., 2001.
Cook, Cynthia R., and John C. Graser, Military Airframe Acquisition Costs:The Effects of Lean Manufacturing, Santa Monica, Calif.: RAND Corpo-ration, MR-1325-AF, 2001.
Defense Acquisition University, Defense Acquisition Acronyms and Terms,Fort Belvoir, Va.: DAU, 2003.
——, Defense Acquisition Guidebook, Section 4.2.2, “Standards and Mod-els,” Fort Belvoir, Va.: DAU, December 2004a.
——, Defense Acquisition Guidebook, Section 4.3, “Systems EngineeringActivities in the System Life Cycle,” Fort Belvoir, Va.: DAU, December2004b.

162 SE/PM: Trends and Costs for Aircraft and Guided Weapons Programs
——, Defense Acquisition Guidebook, Section 10.3.3, “Industry Participa-tion,” Fort Belvoir, Va.: DAU, December 2004c.
——, Program Managers Toolkit, Washington D.C.: DAU, 2000.
Defense Systems Management College, “Concurrent/Systems EngineeringFact Sheet,” The Program Manager’s Notebook, Fort Belvoir, Va.: DSMC,July 1995.
DoD, Military Standard 499A, Engineering Management, 1974.
——, Military Standard 1521, Technical Reviews and Audits for Systems,Equipments, and Computer Software, 1995.
——, DoD Handbook—Work Breakdown Structure, MIL-HDBK-881,January 2, 1998 (dcarc.pae.osd.mil/881handbook/milhdbk881_cover_chap1.pdf; last accessed October 2005).
——, The Defense Acquisition System, DoD Directive 5000.1, May 12,2003a.
——, Operation of the Defense Acquisition System, Department of DefenseDirective 5000.2, May 12, 2003b.
DoD, Office of Undersecretary of Defense (Acquisition, Technology, andLogistics), DoD Guide to Integrated Product and Process Development,Version 1.0, February 1996 (http://www.acq.osd.mil/io/se/ippd/guide/ippd_concept.html; last accessed November 19, 2003).
——, Rules of the Road, A Guide for Leading Successful Integrated ProductTeams, October 1999.
——, “Policy for Systems Engineering in DoD,” memorandum, February20, 2004a.
——, “Policy Addendum for Systems Engineering,” memorandum, Octo-ber 2004b.
DoD, Office of Undersecretary of Defense (Acquisition, Technology, andLogistics), Logistics Plans and Programs, MILSPEC Reform: Final Report,Fort Belvoir, Va.: April 2001.
DoD Directive 5000.4M, Cost Analysis Guidance and Procedures, December11, 1992.
Fox, Bernard, Michael Boito, John C. Graser, and Obaid Younossi, Testand Evaluation Trends and Costs for Aircraft and Guided Weapons, SantaMonica, Calif.: RAND Corporation, MG-109-AF, 2004.
Bibliography 163
Freeman, J. V., Naval Weapons Handbook, China Lake, Calif.: TechnicalInformation Division, Naval Air Warfare Center Weapons Division,1999.
Harmon, Bruce R., J. Richard Nelson, Mitchell S. Robinson, Kathryn L.Wilson, and Steven R. Shyman, Military Tactical Aircraft DevelopmentCosts, PA&E, Alexandria, Va.: Institute for Defense Analyses, 1988.
Harmon, Bruce R., and Lisa M. Ward, Methods for Assessing AcquisitionSchedules of Air-Launched Missiles, Alexandria, Va.: Institute for DefenseAnalyses, 1989.
Harmon, Bruce R., Lisa M. Ward, and Paul R. Palmer, Assessing AcquisitionSchedules for Tactical Aircraft, Alexandria, VA: Institute for DefenseAnalyses, 1989.
Hess, Ronald Wayne, and H. P. Romanoff, Aircraft Airframe Cost Estimat-ing Relationships: Study Approach and Conclusions, R-3255-AF, SantaMonica, Calif.: RAND Corporation, 1987.
Hoshour, Guy, et al., SMC Systems Engineering Primer & Handbook, LosAngeles, Calif.: U.S. Air Force, 2003.
Joint Chiefs of Staff Instruction, Joint Capabilities Integration and Develop-ment System, CJCSI 3170.01E, May 2005.
JSF Program Office, “JSF EMD Estimate Briefing,” supplied to authors byJSF program office personnel, Arlington, Va., 1999.
Kain, Shawn M., Alternative Methodologies for Estimating Systems Engineer-ing/Program Management (SE/PM), Wright-Patterson Air Force Base,Ohio: Aeronautical Systems Division, 1990.
Lee, David A., The Cost Analyst’s Companion, McLean, Va.: The LogisticsManagement Institute, 1997.
Lee, David A., Michael R. Hogue, and Mark A. Gallagher, “Determining aBudget Profile from a R&D Cost Estimate,” Journal of Cost Analysis,Nos. 29-41, Fall 1997.
Lorell, Mark A., and John C. Graser, An Overview of Acquisition ReformCost Savings Estimates, Santa Monica, Calif.: RAND Corporation, MR-1329-AF, 2001.
Lowell, Stephen, “Beyond MilSpec Reform,” presentation at the Senior Ex-ecutive Service 2001 conference, Defense Standardization ProgramOffice, 2001.

164 SE/PM: Trends and Costs for Aircraft and Guided Weapons Programs
Luman, Ronald R., and Richard S. Scotti, “The System Architect Role inAcquisition Program Integrated Product Teams,” Acquisition QuarterlyReview, Fall 1996, pp. 83–96.
Martin, James N., “Overview of the EIA 632 Standard—Processes for En-gineering a System,” presentation to EIA 632 Working Group,September 1998.
McBride, Samuel W., Missile and Munitions CER Development Study: Pro-duction Below-the-Line Cost Research, Goleta, Calif., and Huntsville, Ala.:Tecolote Research, 2001.
Mendenhall, William, Statistics for Management and Economics, Sixth Edi-tion, Boston: PWS-Kent, 1989.
Pagliano, Gary J., and Ronald O’Rourke, Evolutionary Acquisition and Spi-ral Development in DoD Programs: Policy Issues for Congress, Washington,D.C.: Congressional Research Service, 2003.
Perry, William, Secretary of Defense, “Specifications and Standards—ANew Way of Doing Business,” memorandum, June 29, 1994 (http://www.sae.org/standardsdev/military/milperry.htm; last accessed October2005).
Pfleeger, Shari Lawrence, Felicia Wu, Rosalind Lewis, Software Cost Estima-tion and Sizing Methods, Issues, and Guidelines, Santa Monica, Calif.:RAND Corporation, MG-269, 2004.
Pingel, Walt, Global Hawk Program Office, “Estimating Implications ofSpiral Acquisition: Global Hawk Case Study,” DoD Cost Analysis Sym-posium briefing, Williamsburg, Va., January 29, 2003.
Przemieniecki, J. S., Acquisition of Defense Systems, Washington, D.C.:American Institute of Aeronautics and Astronautics, Inc., 1993.
Resetar, Susan A., J. Curt Rogers, and Ronald W. Hess, Advanced AirframeStructural Materials: A Primer and Cost Estimating Methodology, SantaMonica, Calif.: RAND Corporation, R-4016-AF, 1991.
SAS Institute, SAS/STAT User’s Guide, Cary, N.C.: SAS Institute, Inc.,1999.
Sheard, Sarah A., and Jerome G. Lake, “Systems Engineering Standards andModels Compared,” paper on Software Productivity Consortium, Sys-tems and Software Consortium, Inc., Herndon, Va., 1997 (http://www.

Bibliography 165
software.org/pub/externalpapers/9804-2.html; last accessed August 25,2003).
Wideman, Max R., Wideman Comparative Glossary of Project ManagementTerms, V2.1, May 2001 (http://www.pmforum.org/library/glossary/PGM_P07.htm; last accessed August 2004).
Younossi, Obaid, Mark V. Arena, Richard M. Moore, Mark A. Lorell,Joanna Mason, and John C. Graser, Military Jet Engine Acquisition:Technology Basics and Cost-Estimating Methodology, Santa Monica, Calif.:RAND Corporation, MR-1596-AF, 2002.
Younossi, Obaid, Michael Kennedy, and John C. Graser, Military AirframeCosts: The Effects of Advanced Materials and Manufacturing Processes,Santa Monica, Calif.: RAND Corporation, MR-1370-AF, 2001.
Younossi, Obaid, David E. Stem, Mark A. Lorell, and Frances M. Lussier,Lessons Learned from the F/A-22 and F/A-18E/F Development Programs,Santa Monica, Calif.: RAND Corporation, MG-276, 2005.