Support RAND For More Information · American adults receive just half of recommended health care...
83
This PDF document was made available from www.rand.org as a public service of the RAND Corporation. 6 Jump down to document This document and trademark(s) contained herein are protected by law as indicated in a notice appearing later in this work. This electronic representation of RAND intellectual property is provided for non-commercial use only. Permission is required from RAND to reproduce, or reuse in another form, any of our research documents for commercial use. Limited Electronic Distribution Rights CHILD POLICY CIVIL JUSTICE EDUCATION ENERGY AND ENVIRONMENT HEALTH AND HEALTH CARE INTERNATIONAL AFFAIRS NATIONAL SECURITY POPULATION AND AGING PUBLIC SAFETY SCIENCE AND TECHNOLOGY SUBSTANCE ABUSE TERRORISM AND HOMELAND SECURITY TRANSPORTATION AND INFRASTRUCTURE The RAND Corporation is a nonprofit research organization providing objective analysis and effective solutions that address the challenges facing the public and private sectors around the world. Visit RAND at www.rand.org Explore RAND Health View document details For More Information Browse Books & Publications Make a charitable contribution Support RAND
Transcript of Support RAND For More Information · American adults receive just half of recommended health care...

This PDF document was made available from www.rand.org as a public
service of the RAND Corporation.
6Jump down to document
This document and trademark(s) contained herein are protected by law as indicated in a notice appearing later in this work. This electronic representation of RAND intellectual property is provided for non-commercial use only. Permission is required from RAND to reproduce, or reuse in another form, any of our research documents for commercial use.
Limited Electronic Distribution Rights
CHILD POLICY
CIVIL JUSTICE
EDUCATION
ENERGY AND ENVIRONMENT
HEALTH AND HEALTH CARE
INTERNATIONAL AFFAIRS
NATIONAL SECURITY
POPULATION AND AGING
PUBLIC SAFETY
SCIENCE AND TECHNOLOGY
SUBSTANCE ABUSE
TERRORISM AND HOMELAND SECURITY
TRANSPORTATION ANDINFRASTRUCTURE
The RAND Corporation is a nonprofit research organization providing objective analysis and effective solutions that address the challenges facing the public and private sectors around the world.
Visit RAND at www.rand.org
Explore RAND Health
View document details
For More Information
Browse Books & Publications
Make a charitable contribution
Support RAND

This product is part of the RAND Corporation corporate publication series.
Corporate publications describe or promote RAND divisions and programs,
summarize research results, or announce upcoming events.

D A N A P. G O L D M A N ■ E L I Z A B E T H A . M C G LY N N
U.S. HEALTH CARE Facts About Cost, Access,
and Quality

The RAND Corporation is a nonprofit research organization providing objective analysis and effective solutions that address the challenges facing
the public and private sectors around the world.
The Communications Institute is a nonprofit organization that enhances the ability of society to confront critical issues through the knowledge and
application of objective, nonpartisan research and perspectives.
© Copyright 2005 RAND Corporation
R® is a registered trademark.
RAND Corporation1776 Main Street, P.O. Box 2138, Santa Monica, CA 90407-2138
phone: 310-451-7002; fax: 310-451-6915http://www.rand.org/
The Communications Institute55 South Grand Avenue, Pasadena, CA 91105
phone: 626-796-4747; fax: 626-609-2339http://www.communicationsinstitute.org

D A N A P. G O L D M A N ■ E L I Z A B E T H A . M C G LY N N
U.S. HEALTH CARE Facts About Cost, Access,
and Quality


P R E F A C E
The United States spends approximately 15 percent of its gross domestic product on health care, making health care the largest single sector of the U.S. economy. Despite these levels of expenditure, Americans are not healthier and do not live longer than citizens in many other nations (World Health Report 2000—Health Systems: Improving Performance, online at http://w3.whosea.org/healthreport/main.htm). Nearly 45 million Americans are uninsured—about 18 percent of Americans under 65. American adults receive just half of recommended health care services. And we find that quality of care does not vary much by socioeconomic factors: Quality is similar in cities with higher and lower rates of those without insurance, poverty, penetration of managed care, and supply of hospital beds and doctors.
Health policy experts at RAND Health, a division of the RAND Corporation, have assem- bled this chart book to provide a factual basis for addressing the nation’s health care challenges. It is based on material prepared by RAND Health for a series of public meetings in California orga- nized by the Communications Institute as part of its program of educational conferences for com- munity leaders, policymakers, journalists, business executives, and government and labor officials. We wish to acknowledge the leadership of California State Assembly Members Joseph Nation, PhD (D-San Rafael), and Keith Richman, MD (R-Northridge), who provided the impetus for the Califor-nia project.
The Communications Institute is a consortium of academic and research institutions and scholars dedicated to improving public policy decisionmaking based on objective, nonpartisan analy-sis. Information about the Communications Institute and its programs can be found on its web site at www.communicationsinstitute.com.
In compiling this chart book, the authors have drawn on the most recent data available and have used longitudinal data wherever possible to give a comprehensive view of the health care sector and how it has evolved. The book should be of interest to both state and national leaders as they pursue innovative and sustainable approaches to improving the health care system.
Much of the RAND work described in this book was conducted in the RAND Health Eco- nomics Research Program and in the Center for Research on Quality in Health Care. More informa-tion about this research can be found on the RAND Health web site at www.rand.org/health.
RAND has developed two clinically based systems for assessing quality of care. The Quality Assessment (QA) Tools—developed over the last decade with funding from the Health Care Financ-ing Administration (now the Centers for Medicare & Medicaid Services), the Agency for Healthcare Research and Quality, the California HealthCare Foundation, and the Robert Wood Johnson Foun-dation—is a comprehensive system for assessing quality of care for children and adults. ACOVETM (Assessing Care of Vulnerable Elders)—developed as part of RAND’s strategic relationship with Pfizer—is a quality-of-care assessment system for the elderly who are at high risk of functional decline. These systems are the basis of RAND’s quality assessment research reported in this chart book.
Health care is a critical public policy issue at every level of government. We hope that this book and the educational programs associated with it will help leaders in the public, private, and nonprofit sector make better decisions about the future of America’s health care.
Michael D. Rich John E. Cox, Jr.Executive Vice President PresidentThe RAND Corporation The Communications Institute
iii

T A B L E O F C O N T E N T S
Costs and Insurance . . . . . . . . . . . . . . . . . . . . . . . . . . . . . . . . . . . . . . . . . . . . . . . . . . . . . . . . . 1
Health Care Spending as a Share of U.S. Economic Output Has Been Rising Steadily . . . . . . . 3
Richer Countries Spend More on Health Care; the United States Is a Clear Outlier . . . . . . . . . 4
The United States Is Not an Outlier with Respect to How Fast Health Care Costs Are Rising . . . . . . . . . . . . . . . . . . . . . . . . . . . . . . . . . . . . . . . . . . . . . . . . . . . . . . . . . . . . . . . . . 5
We Spend More Than One-Half of Our Health Care Dollars on Hospital and Physician Services . . . . . . . . . . . . . . . . . . . . . . . . . . . . . . . . . . . . . . . . . . . . . . . . . . . . . . . . 6
The Elderly Spend Much More on Health Care, and the Services They Buy Are Different . . . . . 7
Age Is a Powerful Predictor of Health Care Use . . . . . . . . . . . . . . . . . . . . . . . . . . . . . . . . . . . . . 8
The Elderly Are a Rising Share of the U.S. Population . . . . . . . . . . . . . . . . . . . . . . . . . . . . . . . . 9
The Federal Share of Total Health Care Spending Has Been Rising Steadily . . . . . . . . . . . . . . . 10 Medicare Is the Dominant Payer for the Elderly, Private Insurance for Those Under 65 . . . . . . . 11 The Elderly Spend a Larger Share of Income on Health Care Services . . . . . . . . . . . . . . . . . . . . 12
The Share of Health Care Paid Out-of-Pocket Is Falling . . . . . . . . . . . . . . . . . . . . . . . . . . . . . . 13
Most of the Nonelderly Receive Their Health Care Coverage from Their Employer . . . . . . . . . . 14 Large Firms Almost Always Offer Health Insurance; Smaller Firms Often Do Not . . . . . . . . . . 15
Health Insurance for a Family of Four Cost $9,950 in 2004; Workers Contributed About 27 Percent of the Total . . . . . . . . . . . . . . . . . . . . . . . . . . . . . . . . . . . . . . . . . . . . . . . . . . . . . . . . 16
Health Insurance Premiums Are Rising Rapidly Nationwide . . . . . . . . . . . . . . . . . . . . . . . . . . 17
HMO Premiums Are Rising, but Profits Are Not . . . . . . . . . . . . . . . . . . . . . . . . . . . . . . . . . . . 18 The Uninsured Population Is Rising Nationwide . . . . . . . . . . . . . . . . . . . . . . . . . . . . . . . . . . . . 19
Over One-Third of the Uninsured Nationwide Earn More Than 200 Percent of the Federal Poverty Level . . . . . . . . . . . . . . . . . . . . . . . . . . . . . . . . . . . . . . . . . . . . . . . . . . . . . . . . . 20
Most of the Uninsured Live in Families with at Least One Worker . . . . . . . . . . . . . . . . . . . . . . 21
Young Adults Are Most Likely to Be Uninsured . . . . . . . . . . . . . . . . . . . . . . . . . . . . . . . . . . . . 22
The Price of a Day in the Hospital Rose Tenfold over the Past 40 Years . . . . . . . . . . . . . . . . . . . 23
The Number of MRI Machines and MRI Procedures Has Increased . . . . . . . . . . . . . . . . . . . . . 24
Employees Enrolled in HMOs Are Facing Higher Co-Payments for Physician Office Visits . . . . . . . . . . . . . . . . . . . . . . . . . . . . . . . . . . . . . . . . . . . . . . . . . . . . . . . . . . . . . . . . 25
v
Cost Sharing Has No Effect on Functioning or General Health . . . . . . . . . . . . . . . . . . . . . . . . 26
Prescription Drug Expenditures Have Been Rising at Double-Digit Rates . . . . . . . . . . . . . . . . . 27
Prescription Drugs Are a Rising Share of Health Care Expenditures . . . . . . . . . . . . . . . . . . . . . 28
Private Insurance Is the Predominant Payer for Prescription Drugs . . . . . . . . . . . . . . . . . . . . . . 29
The Share Paid Out-of-Pocket for Prescription Drugs Has Fallen . . . . . . . . . . . . . . . . . . . . . . . . 30
The Share of Workers Facing Three-Tier Co-Payments for Prescription Drugs Has Increased . . . . . . . . . . . . . . . . . . . . . . . . . . . . . . . . . . . . . . . . . . . . . . . . . . . . . . . . . . . . . . . 31
Co-Payments Can Have a Large Effect on Service Use—Including Prescription Drugs . . . . . . . 32
Quality of Care . . . . . . . . . . . . . . . . . . . . . . . . . . . . . . . . . . . . . . . . . . . . . . . . . . . . . . . . . . . . . 33 The Multiple Dimensions of Quality . . . . . . . . . . . . . . . . . . . . . . . . . . . . . . . . . . . . . . . . . . . . . 35
Rates of Common Cardiac Procedures Vary Widely Nationwide (2001) . . . . . . . . . . . . . . . . . . 36
About One-Third of Common Surgical Procedures May Not Benefit Patients . . . . . . . . . . . . . . 37
Variation in Inappropriateness of Hospital Admission Is Not Related to Admission Rates . . . . . 38
Overall, About One-Half of Recommended Care Is Received . . . . . . . . . . . . . . . . . . . . . . . . . . 39
Underuse Is a Greater Problem Than Overuse . . . . . . . . . . . . . . . . . . . . . . . . . . . . . . . . . . . . . . 40
There Is Substantial Room for Improvement Across All Types of Care . . . . . . . . . . . . . . . . . . . . 41
Quality of Care for Heart and Lung Problems Varies Widely . . . . . . . . . . . . . . . . . . . . . . . . . . . 42
Significant Variation Exists in Management of Adults’ General Medical Problems . . . . . . . . . . 43
Remarkably Little Variation Is Found Across Major Metropolitan Areas . . . . . . . . . . . . . . . . . . 44
Quality for Selected Chronic Conditions Varies by Community . . . . . . . . . . . . . . . . . . . . . . . . 45
What Are the Consequences of Poor Quality? . . . . . . . . . . . . . . . . . . . . . . . . . . . . . . . . . . . . . . 46
Care for Geriatric Conditions Is Poorer Than Care for General Medical Conditions . . . . . . . . . 47
Quality of Preventive Care for the Elderly Is the Poorest . . . . . . . . . . . . . . . . . . . . . . . . . . . . . . 48
Quality of Care for the Elderly Varied by Condition . . . . . . . . . . . . . . . . . . . . . . . . . . . . . . . . . 49
Vulnerable Elders Do Not Receive Recommended Care After a Fall . . . . . . . . . . . . . . . . . . . . . 50
Medication Management for Vulnerable Elders Is Poor . . . . . . . . . . . . . . . . . . . . . . . . . . . . . . . 51
The Multiple Dimensions of Quality . . . . . . . . . . . . . . . . . . . . . . . . . . . . . . . . . . . . . . . . . . . . . .52
Problems with Patient Safety Occur in All Types of Hospitalizations . . . . . . . . . . . . . . . . . . . . . 53 Preventable Adverse Events Occur Most Often in Ordering and Administration of Drugs . . . . . . . . . . . . . . . . . . . . . . . . . . . . . . . . . . . . . . . . . . . . . . . . . . . . . . . . . . . . . . . . . . . 54
vi

Expected Mortality Rate Can Be Compared with the Rate Observed . . . . . . . . . . . . . . . . . . . . 55
Medicare Beneficiaries Report Least Problems with Receiving Timely Care . . . . . . . . . . . . . . . 56
Medicare Beneficiaries Give Their Personal Physicians High Ratings for Communication . . . . . . . . . . . . . . . . . . . . . . . . . . . . . . . . . . . . . . . . . . . . . . . . . . . . . . . . . . . . . 57
Medicare Beneficiaries Rate Their Overall Health Care Higher . . . . . . . . . . . . . . . . . . . . . . . . . 58
Women Are Less Likely to Get Effective Drug Therapies for Heart Attacks . . . . . . . . . . . . . . . . 59
African Americans Are Less Likely to Have Access to Kidney Transplants . . . . . . . . . . . . . . . . . 60
Minority Patients Are Less Likely to Receive Adequate Cancer Pain Management . . . . . . . . . . . 61
African American Children Are Less Likely Than Whites to Be Diagnosed and Treated for ADHD . . . . . . . . . . . . . . . . . . . . . . . . . . . . . . . . . . . . . . . . . . . . . . . . . . . . . . . . . . 62
Use of Anesthesia Drugs Demonstrates One Type of System Inefficiency . . . . . . . . . . . . . . . . . . 63
References . . . . . . . . . . . . . . . . . . . . . . . . . . . . . . . . . . . . . . . . . . . . . . . . . . . . . . . . . . . . . . . . .65
vii


C o s t s a n d I n s u r a n c e
Dana P. Goldman
Abby E. Alpert

Source: Centers for Medicare & Medicaid Services, 2004.
A4606d- 3 0503
0
2
4
6
8
10
12
14
16
1960 1965 1970 1975 1980 1985 1990 1995 2000
5.1
14.9
Health carespending
as apercentage
of GDP
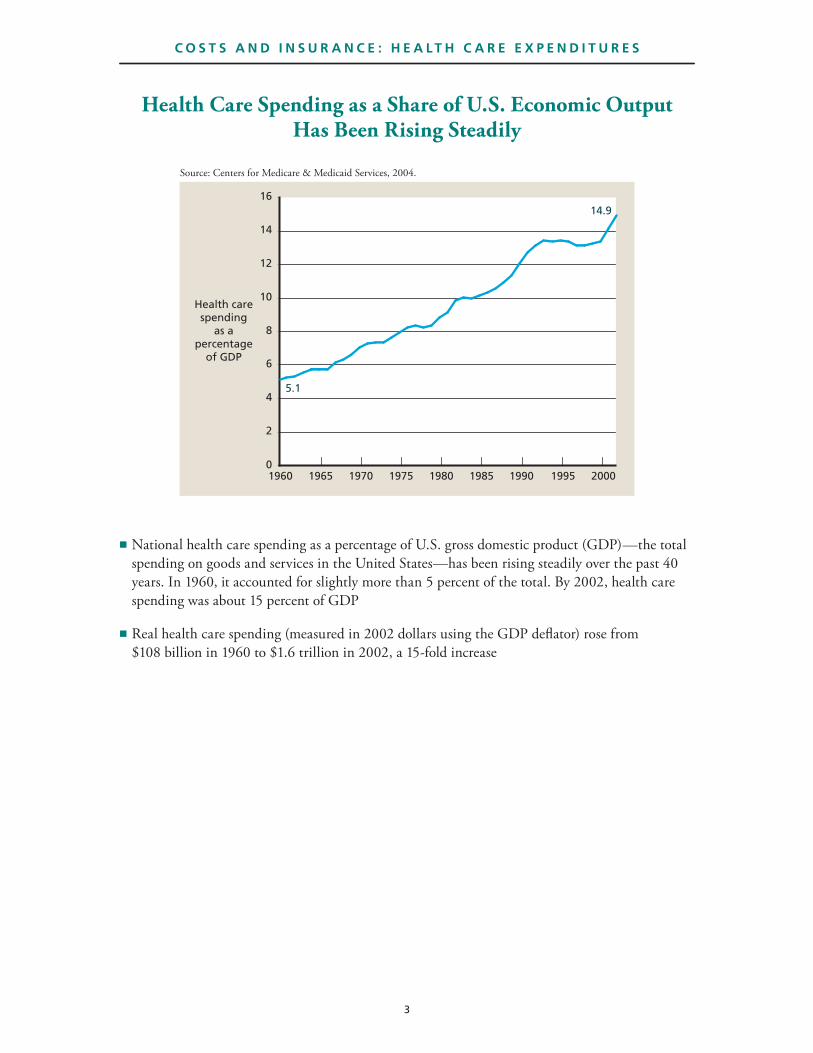
■ National health care spending as a percentage of U.S. gross domestic product (GDP)—the total spending on goods and services in the United States—has been rising steadily over the past 40 years. In 1960, it accounted for slightly more than 5 percent of the total. By 2002, health care spending was about 15 percent of GDP
■ Real health care spending (measured in 2002 dollars using the GDP deflator) rose from $108 billion in 1960 to $1.6 trillion in 2002, a 15-fold increase
Health Care Spending as a Share of U.S. Economic Output Has Been Rising Steadily
C O S T S A N D I N S U R A N C E : H E A L T H C A R E E X P E N D I T U R E S
3
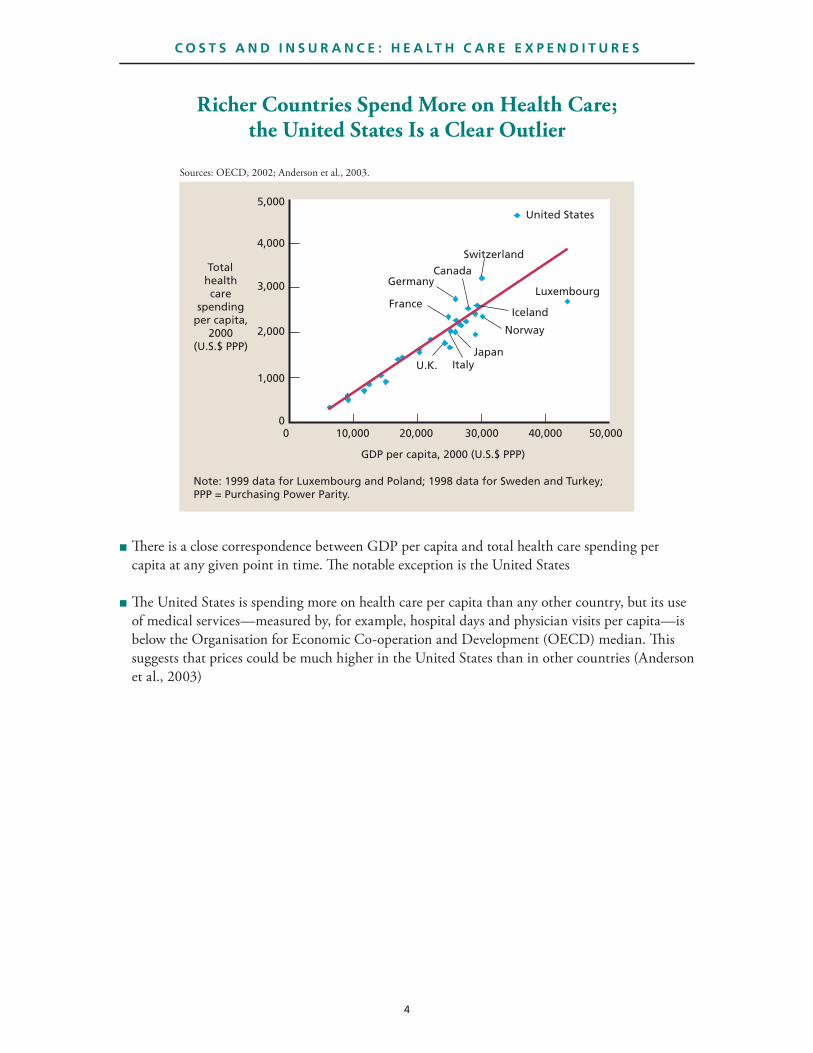
■ There is a close correspondence between GDP per capita and total health care spending per capita at any given point in time. The notable exception is the United States
■ The United States is spending more on health care per capita than any other country, but its use of medical services—measured by, for example, hospital days and physician visits per capita—is below the Organisation for Economic Co-operation and Development (OECD) median. This suggests that prices could be much higher in the United States than in other countries (Anderson et al., 2003)
Richer Countries Spend More on Health Care; the United States Is a Clear Outlier
4
C O S T S A N D I N S U R A N C E : H E A L T H C A R E E X P E N D I T U R E S
Sources: OECD, 2002; Anderson et al., 2003.
0 10,000 20,000 30,000 40,000 50,000
Totalhealthcare
spendingper capita,
2000(U.S.$ PPP)
GDP per capita, 2000 (U.S.$ PPP)
5,000
1,000
0
2,000
3,000
4,000
Note: 1999 data for Luxembourg and Poland; 1998 data for Sweden and Turkey; PPP = Purchasing Power Parity.
United States
Luxembourg
Switzerland
JapanItalyU.K.
France
GermanyCanada
Iceland
Norway

5
Source: OECD, 2004.
Growthin totalhealthcare
spendingper
capita
1.0
1.1
1.2
1.3
1.4
1.5
1.6
0.91990 1992 1994 1996 1998 2000 2002
NorwayUnited Kingdom
Japan
Canada
United States
SwitzerlandGermany
Italy
Iceland
Luxembourg
France
Note: Adjusted to constant 2002 U.S. dollars (PPP) with U.S. GDP deflator.
■ Eight of the countries shown on this graph had the highest health spending per capita in 2002 (U.S.$ PPP)
■ Between 1990 and 2002, growth in real health care spending per capita for these countries ranged from 9 percent in Italy to 57 percent in Norway
The United States Is Not an Outlier with Respect to How Fast Health Care Costs Are Rising
C O S T S A N D I N S U R A N C E : H E A L T H C A R E E X P E N D I T U R E S

Source: California HealthCare Foundation, 2004a.
A4606d- 3 0503
Hospital care (31%)
Physician and clinical services (22%) Prescription drugs (10%)
Dental/other professional (10%)
Other (10%)
Nursing home/ home health care (9%)
Administration (7%)
Total spending (2002)$1.6 trillion
■ In 2002, 53 cents of every health care dollar was spent on hospital and physician services
■ Nursing home/home health care and prescription drugs each accounted for about 10 cents of each dollar spent
We Spend More Than One-Half of Our Health Care Dollars on Hospital and Physician Services
6
C O S T S A N D I N S U R A N C E : H E A L T H C A R E E X P E N D I T U R E S

7
Source: Meara, White, and Cutler, 2004, Exhibit 4.
0 5 10 15 20 25 30 35 40 0 5 10 15 20 25 30 35 40
Hospital care
Physician andclinical care
Prescriptiondrugs
Home healthcare
Other
Nursing home
Percentage of health care spending (2000)
• Under age 65• Average per person spending = $2,761
• Age 65 and older• Average per person spending = $12,271
■ People 65 and over spend much more on health care—about four times more than those under 65
■ Both groups spend the majority of their health care dollars on hospital care and physician services: 64 percent for those under 65, 54 percent for those 65 and over
■ The elderly spend a higher fraction of their health care dollar on nursing home care: Twenty-two percent versus 2 percent for people under 65
The Elderly Spend Much More on Health Care, and the Services They Buy Are Different
C O S T S A N D I N S U R A N C E : H E A L T H C A R E E X P E N D I T U R E S
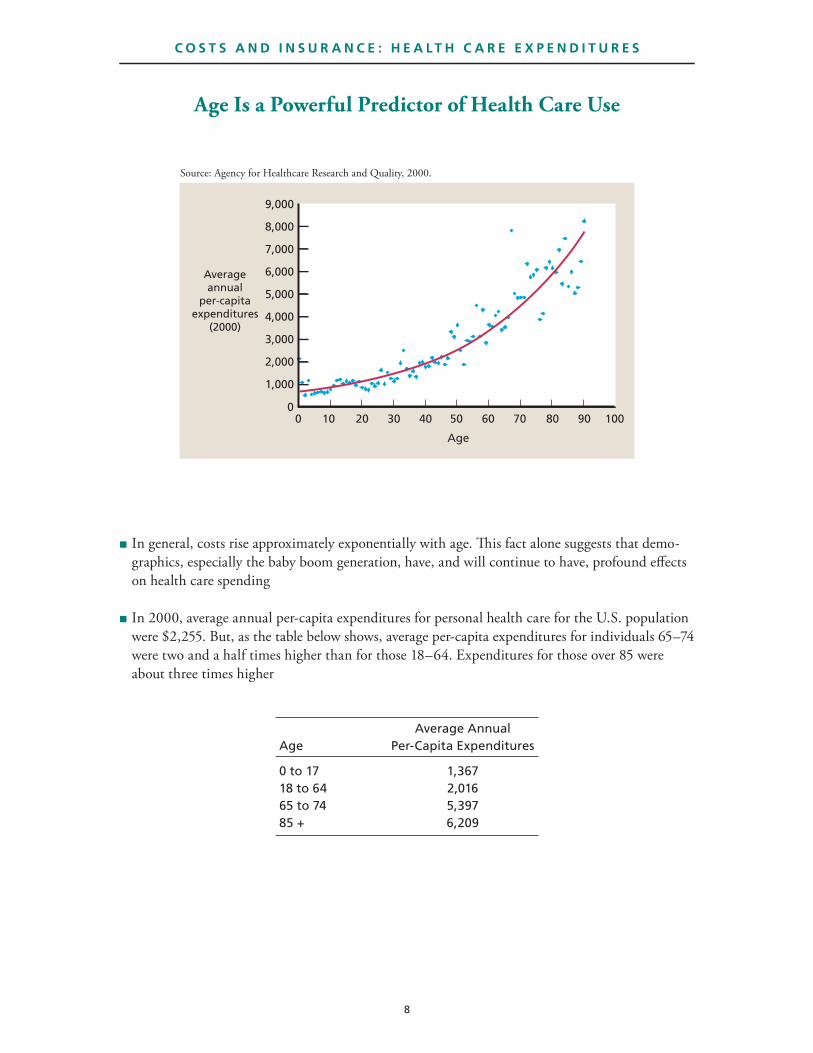
■ In general, costs rise approximately exponentially with age. This fact alone suggests that demo-graphics, especially the baby boom generation, have, and will continue to have, profound effects on health care spending
■ In 2000, average annual per-capita expenditures for personal health care for the U.S. population were $2,255. But, as the table below shows, average per-capita expenditures for individuals 65–74 were two and a half times higher than for those 18–64. Expenditures for those over 85 were about three times higher
Age Is a Powerful Predictor of Health Care Use
8
C O S T S A N D I N S U R A N C E : H E A L T H C A R E E X P E N D I T U R E S
Source: Agency for Healthcare Research and Quality, 2000.
Averageannual
per-capitaexpenditures
(2000)
0
1,000
2,000
3,000
4,000
5,000
6,000
7,000
8,000
9,000
0 10 20 30 40 50 60 70 80 90 100
Age
Average Annual Age Per-Capita Expenditures
0 to 17 1,36718 to 64 2,01665 to 74 5,39785 + 6,209
9
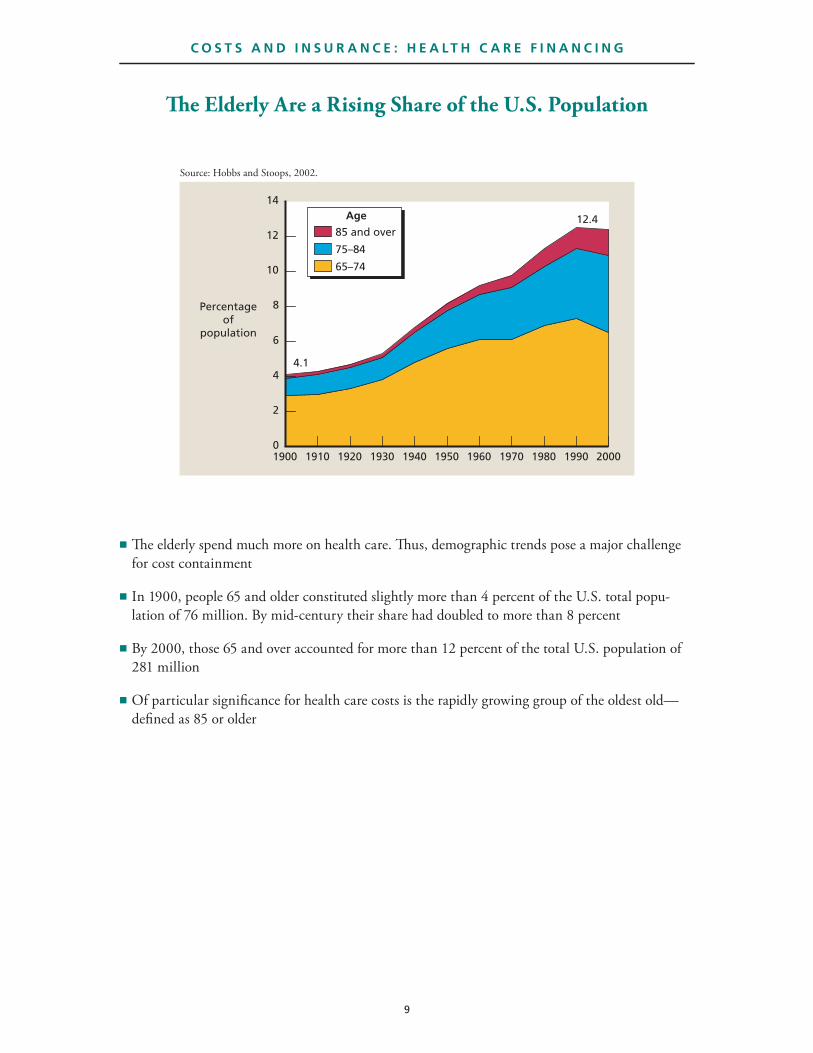
■ The elderly spend much more on health care. Thus, demographic trends pose a major challenge for cost containment
■ In 1900, people 65 and older constituted slightly more than 4 percent of the U.S. total popu- lation of 76 million. By mid-century their share had doubled to more than 8 percent
■ By 2000, those 65 and over accounted for more than 12 percent of the total U.S. population of 281 million
■ Of particular significance for health care costs is the rapidly growing group of the oldest old— defined as 85 or older
The Elderly Are a Rising Share of the U.S. Population
C O S T S A N D I N S U R A N C E : H E A L T H C A R E F I N A N C I N G
Source: Hobbs and Stoops, 2002.
0
2
4
6
8
10
12
14
1900 1910 1920 1930 1940 1950 1960 1970 1980 1990 2000
4.1
12.4
Percentageof
population
85 and over
75–84
65–74
Age

10
Source: Centers for Medicare & Medicaid Services, 2004.
0
20
40
60
80
100
1960 1964 1968 1972 1976 1980 1984 1988 1992 1996 2000
Medicare and Medicaid enacted 1965
Percentage of total
health care spending
PrivateFederalState and local
■ The federal share of total spending jumped sharply after the creation of Medicare and Medicaid, rising from about 10 percent in 1964 to nearly 25 percent after their enactment in 1965*
■ Since then, the federal share has continued to rise. In 2002, the federal government paid 32 of every 100 dollars spent on health care
■ Health care spending from private sources has fallen since 1960, from about 75 percent at the beginning of the period to about 55 percent in 2002
■ Over the same period, state and local contributions have remained basically unchanged at about 12 percent of total health care spending
The Federal Share of Total Health Care Spending Has Been Rising Steadily
C O S T S A N D I N S U R A N C E : H E A L T H C A R E F I N A N C I N G
* People 65 and over who are eligible for Social Security are automatically enrolled, without a premium, in Medicare Part A, which covers hospital costs. They can pay a monthly premium to enroll in Medicare Part B, which covers outpatient care. Generally Medicare does not pay for long-term care. It does cover some disabled individuals under 65.
A Medicare drug benefit (Medicare Part D) begins January 2006; until then, there is an interim Medicare- endorsed drug discount card and transitional assistance program.
Medicaid provides care for the indigent. It is a jointly funded federal-state program. The federal government sets certain requirements for all Medicaid programs, but the states have some latitude in implementing the program. In California, the Medicaid program is called Medi-Cal. In June of 2003, Medi-Cal covered 6.4 million low-income children, adults, blind, disabled, and elderly individuals in California (California HealthCare Foundation, 2004b).
10

Source: Olin and Machlin, 2003.
Source of payment (1999)
Private insurance(54%)
Medicare(5%)
Medicaid(11%)
Other(10%) Out of pocket
(21%)
Privateinsurance
(14%)
Medicare(56%)
Medicaid(5%)
Other(8%) Out of pocket
(16%)
Age 65 and overUnder age 65
■ We can expect the federal government to continue to play a predominant role in the financing of health care, since Medicare pays for 56 percent of the elderly’s health care bills and the nation’s elderly population is growing as a share of the total population
■ Together, Medicaid and Medicare account for more than 60 percent of health care expenditures for those 65 and over. Private insurance accounts for only 14 percent
■ For those under 65, the payment pattern is nearly a mirror image. Private insurance accounts for 54 percent of the total, while Medicaid and Medicare constitute only 16 percent
Medicare Is the Dominant Payer for the Elderly, Private Insurance for Those Under 65
11
C O S T S A N D I N S U R A N C E : H E A L T H C A R E F I N A N C I N G
11

12
Source: Centers for Medicare & Medicaid Services, 2003.
0 2 4 6 8 10 12 14
Under 35
Age
35–54
55–64
65 and over
Out-of-pocket health care spending as a percentage of income (2000)
■ The elderly use a larger proportion of their income on health care services—more than double the proportion used by those under 65
■ Possible reasons are that the elderly are in frailer health and use more services such as prescription drugs and long-term care, which are not covered by insurance
The Elderly Spend a Larger Share of Income on Health Care Services
C O S T S A N D I N S U R A N C E : H E A L T H C A R E F I N A N C I N G
12

13
Source: Centers for Medicare & Medicaid Services, 2004.
Note: Adjusted to constant 2002 dollars with GDP deflator.
$280 $287$319
$397
$494
$657
$766
$687 $705 $724 $744
0
100
200
300
400
500
600
700
800
900
1960 1965 1970 1975 1980 1985 1990 1995 2000 2001 2002
Out-of-pocketspending
per person
Out-of-pocket spendingas a percentage of allpersonal health care
spending
0
10
20
30
40
50
60
Percentageof total
spending
■ Out-of-pocket expenditures (the share of health care spending that consumers must pay out of their own pockets) as a share of all personal health care spending fell over three decades until the mid-1990s, and they are now steady at about 15 percent
■ Real out-of-pocket health care spending, excluding insurance premiums, was about $744 per person, per year in 2002, up from $280 in 1960
The Share of Health Care Paid Out-of-Pocket Is Falling
13
C O S T S A N D I N S U R A N C E : H E A L T H C A R E F I N A N C I N G

1414
Source: Kaiser Commission on Medicaid and the Uninsured, 2003a.
Employersponsored
63%
Medicaid/other public
14%
Uninsured17%
Private nongroup5%
Total population under 65 (2002)250.8 million
■ The predominant source of health insurance for the nonelderly is their employer
■ Employers offer insurance through the workplace because of the tax advantages of doing so, the increase in worker productivity that results from improved health, or because a health benefit allows them to recruit and retain high-quality workers. Employers also offer a convenient way to pool risks—that is, spread health care costs across both healthy and sick employees
Most of the Nonelderly Receive Their Health Care Coverage from Their Employer
C O S T S A N D I N S U R A N C E : H E A L T H I N S U R A N C E

15
0 20 40 60 80 100
3–9
25–49
10–24
50–199
200+
Percentage of U.S. employers offering health benefits (2004)
Number of workers
Source: The Henry J. Kaiser Family Foundation and Health Research and Educational Trust, 2004b.
■ In 2004, nearly two-thirds of U.S. firms offered health insurance to their employees. The size of the firm is a major factor in whether the employer offers insurance ■ About 24 percent of workers were employed in firms with fewer than 50 employees in 2004. These firms are least likely to offer health benefits
■ Almost all firms with 50 or more workers offer health insurance to their employees
Large Firms Almost Always Offer Health Insurance; Smaller Firms Often Do Not
15
C O S T S A N D I N S U R A N C E : H E A L T H I N S U R A N C E
1616
Sources: The Henry J. Kaiser Family Foundation and Health Research and Educational Trust, 2004a and 2004b.
2004
2003
Single
2004
2003
Family
Average annual workercontribution
Average annual employercontribution
$558 $3,137 $3,695
$2,661 $7,289 $9,950
$2,412 $6,656 $9,068
$508 $2,875 $3,383
Health insurance premiums
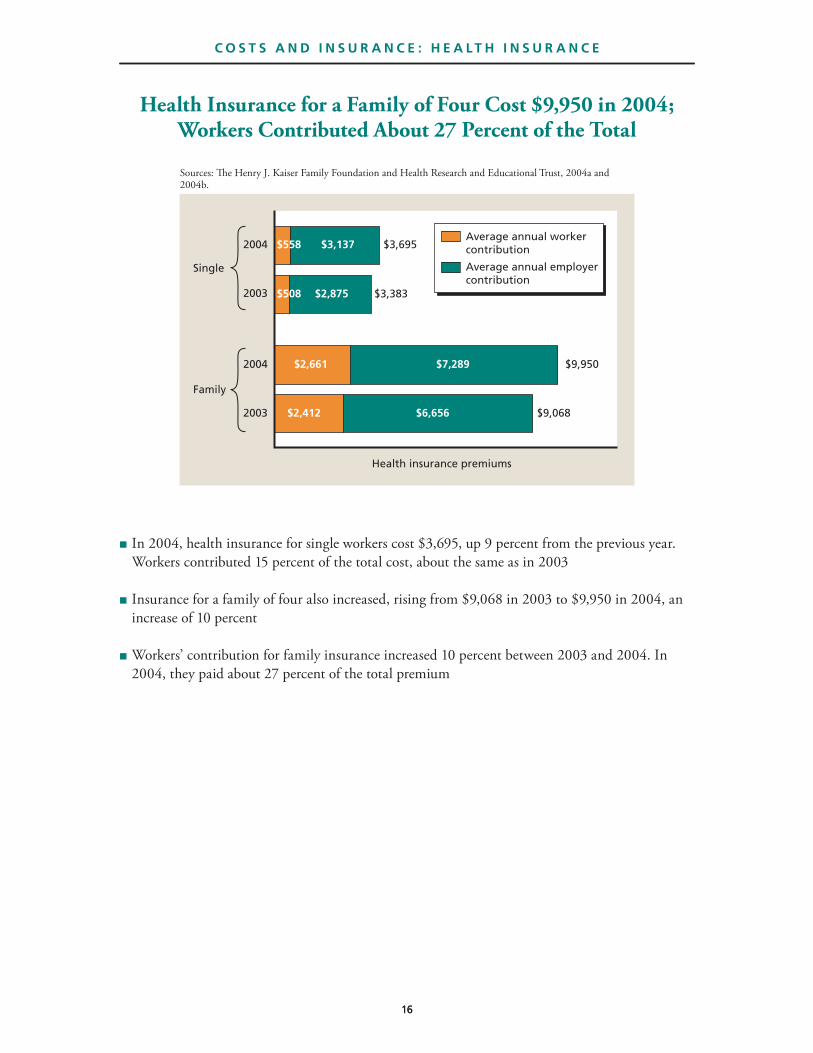
■ In 2004, health insurance for single workers cost $3,695, up 9 percent from the previous year. Workers contributed 15 percent of the total cost, about the same as in 2003
■ Insurance for a family of four also increased, rising from $9,068 in 2003 to $9,950 in 2004, an increase of 10 percent
■ Workers’ contribution for family insurance increased 10 percent between 2003 and 2004. In 2004, they paid about 27 percent of the total premium
Health Insurance for a Family of Four Cost $9,950 in 2004; Workers Contributed About 27 Percent of the Total
C O S T S A N D I N S U R A N C E : H E A L T H I N S U R A N C E

17
Source: The Henry J. Kaiser Family Foundation and Health Research and Educational Trust, 2003a.
0
4
8
12
16
20
1988 1989 1990 1993 1996 1999 2000 2001 2002 2003
Average percentage growth in
private health insurance premiums
United States 14%
■ Since 1988, the annual nationwide increase in private health insurance has fluctuated quite a bit but has averaged about 11 percent
■ The growth rate peaked at 18 percent in 1989, then slid quickly over the next several years. In part, this may reflect competitive trends: Health maintenance organizations (HMOs) gained a larger share of the health insurance market and implemented a variety of strategies for promot- ing cost control, including gatekeepers and prior approval for certain procedures. HMOs also used their market power to negotiate lower prices from hospitals, physicians, and other service providers
Health Insurance Premiums Are Rising Rapidly Nationwide
17
C O S T S A N D I N S U R A N C E : H E A L T H I N S U R A N C E

1818
Source: Baumgarten, 2004.
$112
$166
100
110
120
130
140
150
160
170 100
90
80
70
60
50
40
30
20
10
01997 1998 1999 2000 2001 2002
Average premium
revenue per person, per month inCalifornia (dollars)
Percentage of total
premium revenue
Medicalexpenses
Profits and administrative expenses
■ One possible reason for increased health insurance premiums could be that insurers are making more money. However, for example, HMO premiums in California suggest that this is not the case. California HMOs cover about 50 percent of the market (The Henry J. Kaiser Family Foun-dation, 2004)
■ HMO premiums have been rising quite sharply, from $112 per month, per person in 1997 to $166 in 2002, an increase of nearly 50 percent
■ However, HMOs are also providing more services. As a result, their gross profitability has remained basically flat since 1997 at 10–12 percent. For example, in 1997, 88 cents of every premium dollar went toward medical expenses, while the remaining 12 cents went toward profits and administrative expenses. In 2002, the comparable numbers are 89 cents versus 11 cents
HMO Premiums Are Rising, but Profits Are Not
C O S T S A N D I N S U R A N C E : H E A L T H I N S U R A N C E

19
Source: California HealthCare Foundation, 2004c.
0
4
8
12
16
20
24
1987 1989 1991 1993 1995 1997 1999 2001 2003
United States 18%
Percentageof populationunder age 65
who are uninsured
■ The percentage of the nonelderly—defined as those under age 65—who are uninsured has risen nationwide since 1987 from about 13 percent to 18 percent in 2003—about 45 million Americans
The Uninsured Population Is Rising Nationwide
C O S T S A N D I N S U R A N C E : T H E U N I N S U R E D

Source: Kaiser Commission on Medicaid and the Uninsured, 2000, 2002, 2003a, and 2003b.
0 2 4 6 8 10 12 14 16 18
1999
2000
2001
2002
<100% Federal poverty level100–199% 200+%
Number of U.S. population under age 65 who are uninsured (millions)
■ Many people believe that the uninsured are poor, unemployed, and elderly. The next three charts demonstrate that this image is not completely accurate
■ Nationwide, over one-third of the nonelderly uninsured earn more than 200 percent of the fed- eral poverty level—$14,348 for a family of three in 2002
Over One-Third of the Uninsured Nationwide Earn More Than 200 Percent of the Federal Poverty Level
20
C O S T S A N D I N S U R A N C E : T H E U N I N S U R E D
21
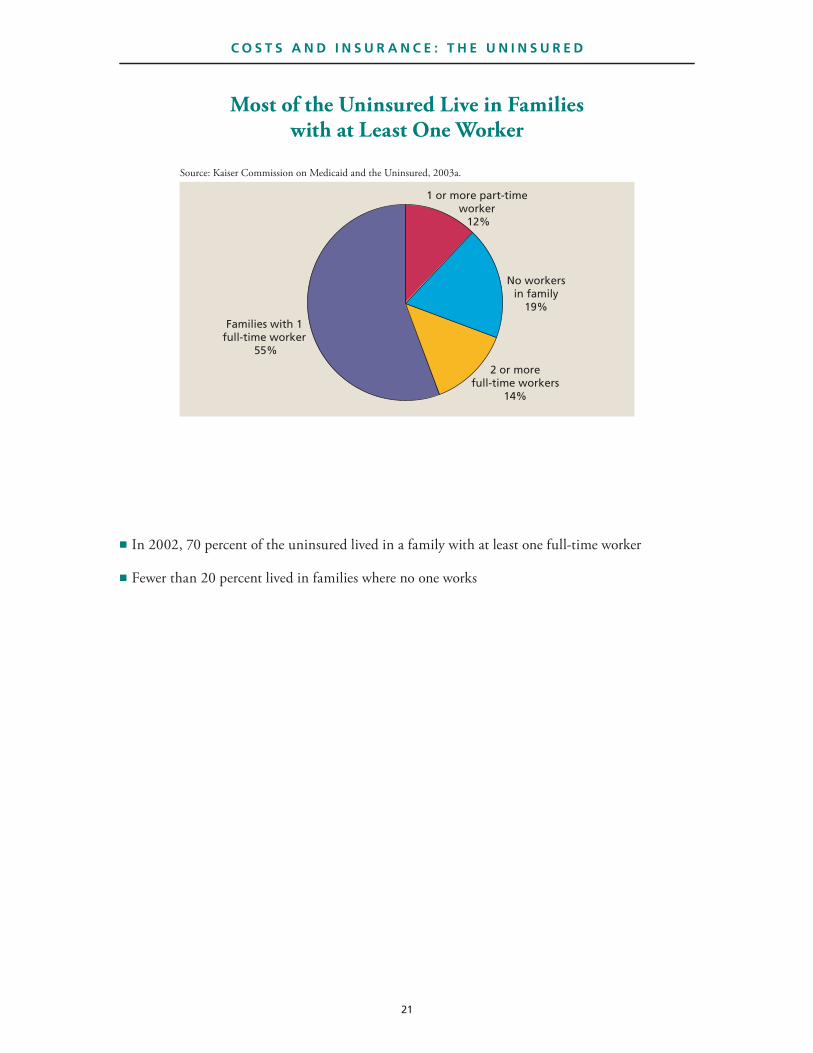
Source: Kaiser Commission on Medicaid and the Uninsured, 2003a.
Families with 1 full-time worker
55%
No workersin family
19%
1 or more part-time worker
12%
2 or morefull-time workers
14%
■ In 2002, 70 percent of the uninsured lived in a family with at least one full-time worker
■ Fewer than 20 percent lived in families where no one works
Most of the Uninsured Live in Families with at Least One Worker
C O S T S A N D I N S U R A N C E : T H E U N I N S U R E D

Source: Institute of Medicine, 2004.
0 5 10 15 20 25 30 35
Under 18
Age
18–24
25–34
35–54
55–64
Percentage of age group who are uninsured (2002)
■ The young and the near elderly—those under 18 and those 55–64—are least likely to be uninsured
■ Medicaid provides coverage for many children
■ Individuals ages 55–64 have lower labor force participation rates than other working age groups, but they are also more likely to purchase health insurance directly from an insurance company (Fronstin, 2004)
Young Adults Are Most Likely to Be Uninsured
22
C O S T S A N D I N S U R A N C E : T H E U N I N S U R E D

23
Source: American Hospital Association, 1983 and 2004.
*Includes total nonfederal “short-term general” and “other special” hospitals.Note: Adjusted to constant 2002 dollars with GDP deflator.
0
200
400
600
800
1,000
1,200
1,400
1965 1969 1973 1977 1981 1985 1989 1993 1997 2001
Cost per inpatient
day(dollars)*
■ The cost trend for a day in the hospital illustrates the steady increase in the price of health care services in the United States over the past four decades
■ In 1965, the real cost per hospital day was about $128. In 2002, the cost had risen to $1,289— a tenfold increase. Much of this increase reflects that we are delivering more technologically advanced care in the hospital
The Price of a Day in the Hospital Rose Tenfold over the Past 40 Years
23
C O S T S A N D I N S U R A N C E : C O S T S H A R I N G

2424
Source: Baker and Atlas, 2004; Canadian Institute for Health Information, 2003.
MRI sites per
100,000 population
MRIprocedures per 100,000 population
0.0
0.4
0.8
1.2
1.6
2.0
1993 1997 1999 20010
1,000
2,000
3,000
4,000
5,000
1993 1997 1999
■ One source of rising health care costs is the use of more expensive technology. The increasing use of magnetic resonance imaging (MRI) technology illustrates this trend. MRIs are used in a variety of diagnostic applications
■ In the early 1990s, MRI machines were still relatively scarce. There was less than one MRI site for every 100,000 persons in the United States. By the end of the decade, the number of sites for every 100,000 persons had increased by about 130 percent
■ The number of MRI procedures increased proportionately. In 1993, there were about 2,900 procedures per 100,000 persons. Six years later, the rate increased by more than 50 percent to 4,600 procedures
The Number of MRI Machines and MRI Procedures Has Increased
C O S T S A N D I N S U R A N C E : C O S T S H A R I N G
25
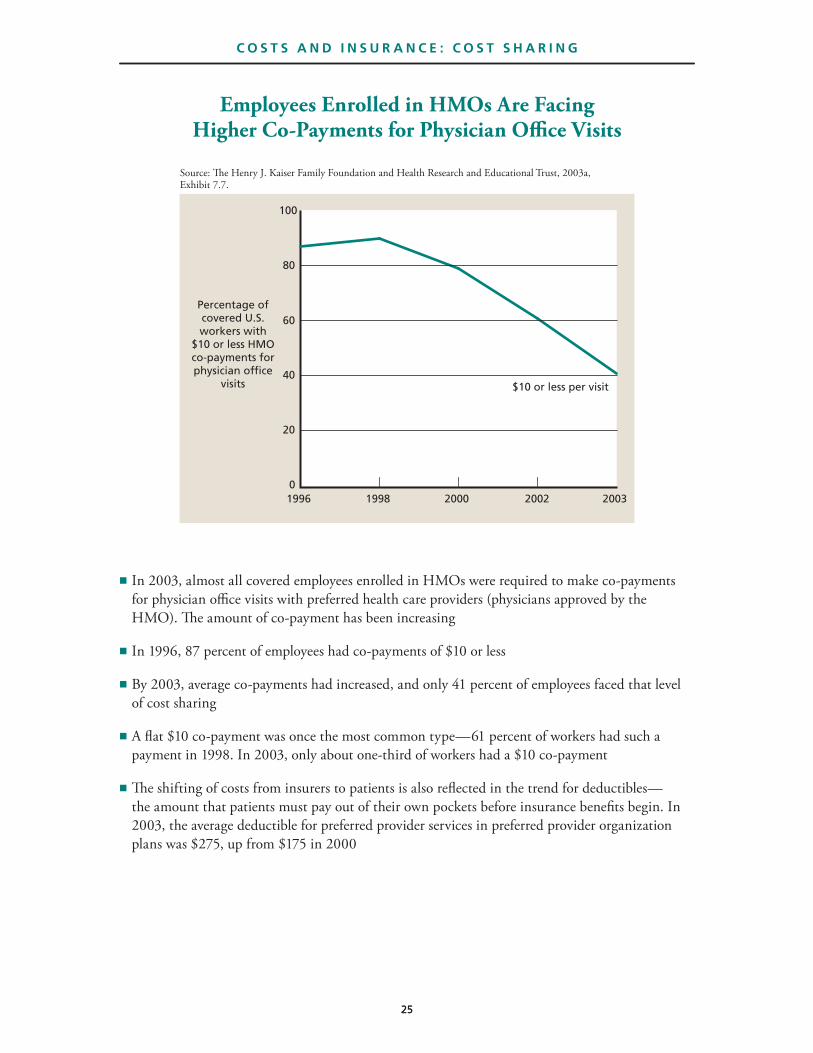
Source: The Henry J. Kaiser Family Foundation and Health Research and Educational Trust, 2003a, Exhibit 7.7.
0
20
40
60
80
100
1996 1998 2000 2002 2003
$10 or less per visit
Percentage of covered U.S. workers with
$10 or less HMO co-payments for physician office
visits
■ In 2003, almost all covered employees enrolled in HMOs were required to make co-payments for physician office visits with preferred health care providers (physicians approved by the HMO). The amount of co-payment has been increasing
■ In 1996, 87 percent of employees had co-payments of $10 or less
■ By 2003, average co-payments had increased, and only 41 percent of employees faced that level of cost sharing
■ A flat $10 co-payment was once the most common type—61 percent of workers had such a payment in 1998. In 2003, only about one-third of workers had a $10 co-payment
■ The shifting of costs from insurers to patients is also reflected in the trend for deductibles— the amount that patients must pay out of their own pockets before insurance benefits begin. In 2003, the average deductible for preferred provider services in preferred provider organization plans was $275, up from $175 in 2000
Employees Enrolled in HMOs Are Facing Higher Co-Payments for Physician Office Visits
25
C O S T S A N D I N S U R A N C E : C O S T S H A R I N G

2626
Source: Newhouse and the Insurance Experiment Group, 1993.
0 20 40 60 80 100
General health
Mental health
Physicalfunctioning
Rolefunctioning
95% cost sharing
25–50% cost sharing
Free care
Score on health status measure
■ For people with insurance, does cost sharing affect health? The RAND Health Insurance Experiment,* a large multiyear study, examined how different levels of cost sharing—ranging from none to 95 percent—affected both use of health care and health care outcomes
■ Cost sharing consistently reduced spending. Patients didn’t find lower prices for treatment; they sought treatment less often
■ Those who had free care spent an average of 50 percent more per person per year than those with the highest level of cost sharing ($1,019 versus $700). Even mild cost sharing—25 percent— reduced average per-person spending from $1,019 to $826
■ Cost sharing had few adverse health effects. There were no significant differences between those with free care and those with cost sharing on any general health measures, such as people’s ability to function in their usual daily roles, physical functioning (e.g., self-care and mobility), mental health, or general health
■ However, people with certain conditions might do better with less cost sharing. At the end of the study, those with free care had better blood pressure control, corrected vision, and oral health. With the advent of more-effective medications, these results raise the question about how cost sharing for prescription drugs affects outcomes
Cost Sharing Has No Effect on Functioning or General Health
C O S T S A N D I N S U R A N C E : C O S T S H A R I N G
* The RAND Health Insurance Experiment, a 15-year (1971–1986) multimillion-dollar effort, was funded by the Department of Health, Education, and Welfare (now the Department of Health and Human Services).

27
Source: Berndt, 2001.
0
2
4
6
8
10
12
14
16
18
20
1987 1989 1991 1993 1995 1997 1999
Utilizationgrowth
Pricegrowth
Percentage annual
increase in prescription
drug spending
■ Prescription drugs are an increasingly important component of modern health care treatment. Drug spending has been rising at double-digit rates since the mid-1980s. However, the composi- tion of that growth has shifted
■ From 1987 to 1993, about one-half of the annual increase in prescription drug spending was due to higher prices. However, over the past ten years, about 80 percent of the increase is due to higher drug use per capita
Prescription Drug Expenditures Have Been Rising at Double-Digit Rates
27
C O S T S A N D I N S U R A N C E : P R E S C R I P T I O N D R U G S

2828
Source: California HealthCare Foundation, 2004a.
Category 1982 2001 2002 Billions Percentage
National HealthExpenditures 100% 100% 100% $132 9%
Hospital care 42% 31% 31% $ 42 9%
Physician and clinical services 19% 22% 22% $ 24 8%
Dental/other professional 8% 10% 10% $ 13 9%
Nursing home/home health care 8% 9% 9% $ 6 5%
Prescription drugs 5% 10% 10% $ 22 15%
Administration 5% 6% 7% $ 15 16%
Other 13% 10% 10% $ 10 7%
Spending distribution Growth (’02 versus ’01)
■ Over the last two decades, spending on hospital care has fallen as a percentage of total health care expenditures but spending on prescription drugs is an increasing share
■ Between 1982 and 2002, hospital care dropped from 42 percent of total expenditures to 31 percent. Recent increases in hospital costs of $42 billion suggest some of the cost-cutting gains during the 1980s and 1990s will not continue
■ Over the same period, expenditures on prescription drugs as a share of total expenditures doubled, rising from 5 percent to 10 percent. Total expenditures on prescription drugs grew by $22 billion between 2001 and 2002, a 15 percent increase
Prescription Drugs Are a Rising Share of Health Care Expenditures
C O S T S A N D I N S U R A N C E : P R E S C R I P T I O N D R U G S

29
Source: Centers for Medicare & Medicaid Services, 2004.
0 20 40 60 80 100
Nursing home/home health
care
Prescriptiondrugs
Physician andclinical services
Hospital carePublic funds
Share of spending in 2002 (percentage)
Notes: Categories may not sum to 100. The category “other private funds,” whichincludes other sources such as philanthropy, is excluded.
Out-of-pocket paymentsPrivate health insurance
■ Private insurance picks up the largest share of the cost for prescription drugs and physician services—about one-half in each case
■ About two-thirds of health care provided in hospitals and nursing homes is paid for by public sources, which is not surprising since Medicare and Medicaid are the predominant payers for the elderly
Private Insurance Is the Predominant Payer for Prescription Drugs
29
C O S T S A N D I N S U R A N C E : P R E S C R I P T I O N D R U G S

3030
Source: Centers for Medicare & Medicaid Services, 2004.
0
20
40
60
80
100
1960 1965 1970 1975 1980 1985 1990 1995 2000
Private 48%
Public 22%
Out of pocket 30%
Percentage of prescription
drug spending
■ Private insurers now cover about one-half of all spending for prescription drugs. That reflects a major change over the past four decades
■ In 1960, the out-of-pocket share of drug expenditures was close to 100 percent, while the private share was essentially zero
■ As firms began to add prescription drugs to benefit packages for their employees, the out-of- pocket share of drug expenditures fell
■ Public funding for drugs has also risen steadily since 1960
The Share Paid Out-of-Pocket for Prescription Drugs Has Fallen
C O S T S A N D I N S U R A N C E : P R E S C R I P T I O N D R U G S
31
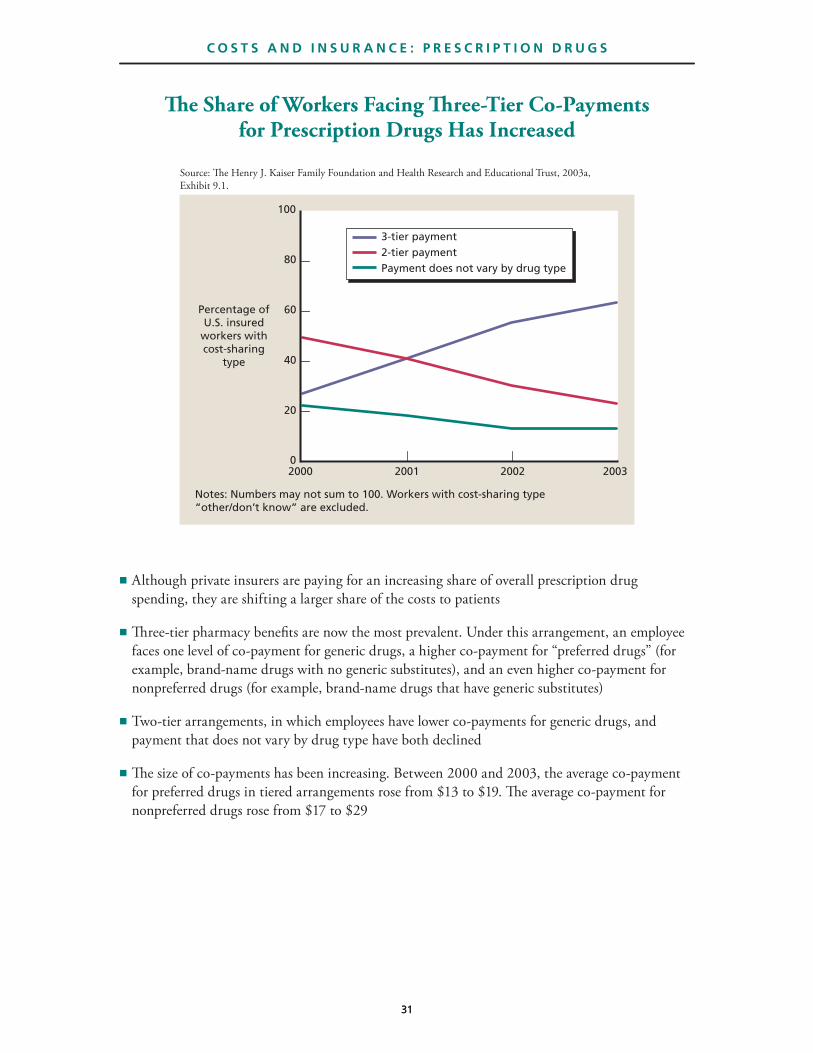
Source: The Henry J. Kaiser Family Foundation and Health Research and Educational Trust, 2003a, Exhibit 9.1.
Percentage of U.S. insured
workers with cost-sharing
type
0
20
40
60
80
100
2000 2001 2002 2003
Notes: Numbers may not sum to 100. Workers with cost-sharing type “other/don’t know” are excluded.
3-tier payment 2-tier paymentPayment does not vary by drug type
■ Although private insurers are paying for an increasing share of overall prescription drug spending, they are shifting a larger share of the costs to patients
■ Three-tier pharmacy benefits are now the most prevalent. Under this arrangement, an employee faces one level of co-payment for generic drugs, a higher co-payment for “preferred drugs” (for example, brand-name drugs with no generic substitutes), and an even higher co-payment for nonpreferred drugs (for example, brand-name drugs that have generic substitutes)
■ Two-tier arrangements, in which employees have lower co-payments for generic drugs, and payment that does not vary by drug type have both declined
■ The size of co-payments has been increasing. Between 2000 and 2003, the average co-payment for preferred drugs in tiered arrangements rose from $13 to $19. The average co-payment for nonpreferred drugs rose from $17 to $29
The Share of Workers Facing Three-Tier Co-Payments for Prescription Drugs Has Increased
31
C O S T S A N D I N S U R A N C E : P R E S C R I P T I O N D R U G S

3232
Source: Goldman et al., 2004.
26
26
34
33
32
25
45
44
0 10 20 30 40 50
Antidepressants
Antihypertensives
Antihyperlipidemics
Antiulcerants
Antiasthmatics
Therapeutic class
Antidiabetics
NSAIDs
Antihistamines
Reduction in days supplied when co-payments double (%)
Note: NSAID=nonsteroidal anti-inflammatory drug, such as ibuprofen.
■ Doubling patients’ co-payments for drugs can reduce their use of the most common classes of medications by 25 to 45 percent
■ The patients most sensitive to price changes are those who are taking medications but are not receiving regular care for their conditions
■ Even the chronically ill who are receiving routine care cut their drug use between 8 percent and 23 percent when their co-payments are doubled
Co-Payments Can Have a Large Effect on Service Use— Including Prescription Drugs
C O S T S A N D I N S U R A N C E : P R E S C R I P T I O N D R U G S

Q u a l i t y o f C a r e
Elizabeth A. McGlynn

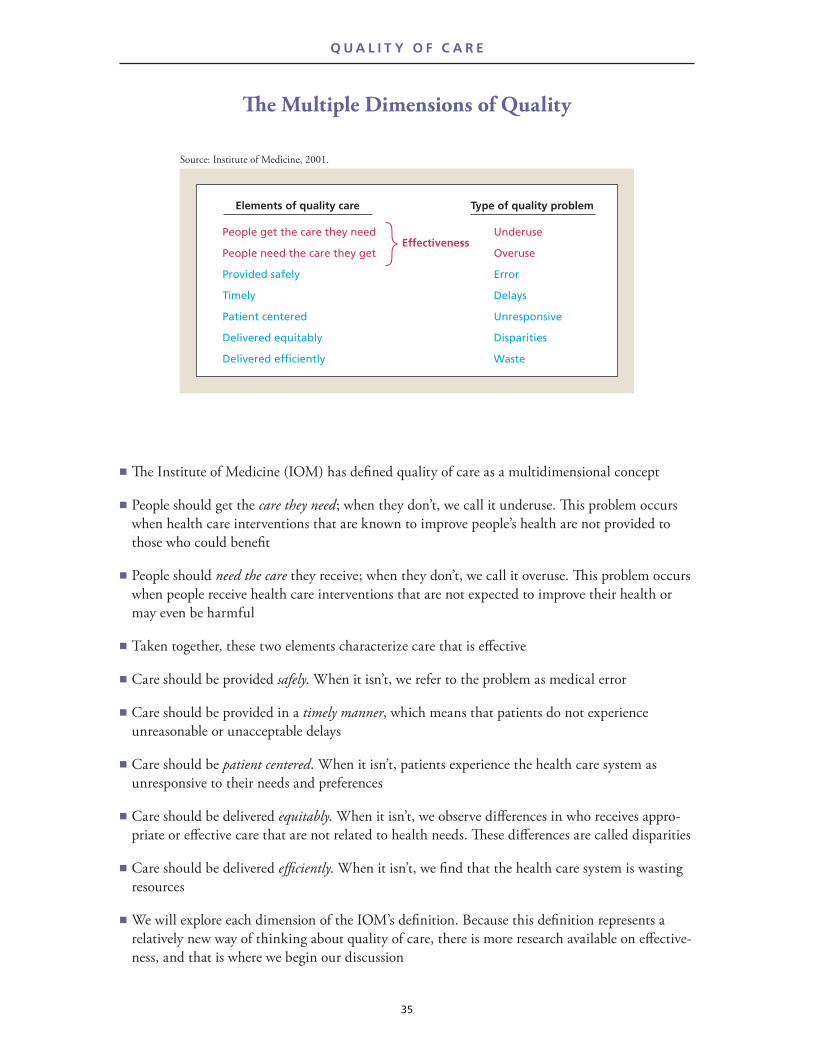
■ The Institute of Medicine (IOM) has defined quality of care as a multidimensional concept
■ People should get the care they need; when they don’t, we call it underuse. This problem occurs when health care interventions that are known to improve people’s health are not provided to those who could benefit
■ People should need the care they receive; when they don’t, we call it overuse. This problem occurs when people receive health care interventions that are not expected to improve their health or may even be harmful
■ Taken together, these two elements characterize care that is effective
■ Care should be provided safely. When it isn’t, we refer to the problem as medical error
■ Care should be provided in a timely manner, which means that patients do not experience unreasonable or unacceptable delays
■ Care should be patient centered. When it isn’t, patients experience the health care system as unresponsive to their needs and preferences
■ Care should be delivered equitably. When it isn’t, we observe differences in who receives appro- priate or effective care that are not related to health needs. These differences are called disparities
■ Care should be delivered efficiently. When it isn’t, we find that the health care system is wasting resources
■ We will explore each dimension of the IOM’s definition. Because this definition represents a relatively new way of thinking about quality of care, there is more research available on effective- ness, and that is where we begin our discussion
The Multiple Dimensions of Quality
35
Q U A L I T Y O F C A R E
Source: Institute of Medicine, 2001.
Elements of quality care Type of quality problem
People get the care they need Underuse
People need the care they get Overuse
Provided safely Error
Timely Delays
Patient centered Unresponsive
Delivered equitably Disparities
Delivered efficiently Waste
Effectiveness

0
5
10
15
20
25
30
35
40
Hospital referral regions
Number of procedures per 1,000 Medicare
beneficiaries
Angiography
Angioplasty
CABG
Source: The Dartmouth Atlas of Health Care, 2004.
■ Work first published in the early 1970s identified substantial variation in the rates at which different surgical and diagnostic procedures were used and patients were admitted to hospitals
■ This variation is not related to the health care needs of the population
■ For example, three common cardiac procedures have different rates of use in hospital referral regions* across the country
• Coronary angiography rates range from 7.5 per 1,000 Medicare beneficiaries in Hawaii to 35.5 in Alabama • Percutaneous transluminal coronary angioplasty rates range from 3.4 per 1,000 Medicare beneficiaries in Hawaii to 15.8 per 1,000 in Louisiana • Coronary artery bypass graft (CABG) surgery rates range from 2.6 per 1,000 Medicare beneficiaries in Hawaii to 8.3 per 1,000 in Kentucky
■ Identification of substantial variation in rates of service delivery led to research on the underlying causes.
Rates of Common Cardiac Procedures Vary Widely Nationwide (2001)
36
Q U A L I T Y O F C A R E : E F F E C T I V E N E S S
* Hospital referral regions represent regional health care markets for tertiary medical care.

37
Sources: Bernstein et al., 1993; Winslow et al., 1988; Chassin et al., 1987; Hilborne et al., 1993; Tobacmanet al., 1996.
0 20 40 60 80 100
Angiography
CABG
Angioplasty
Hysterectomy
Cataract surgery
Proportion of procedures performed
OverusePotential overuse
■ Several RAND studies conducted in the 1980s and early 1990s investigated whether patients who received common surgical procedures would be expected to have experienced significant health benefits from them
■ On average, about one-third of procedures were provided for reasons that were not supported by clinical research and may have been harmful to patients
■ The proportion of procedures performed for inappropriate (overuse) or equivocal (potential overuse) reasons ranged in these studies from 9 percent (cataract surgery) to 44 percent (coro- nary artery bypass graft [CABG] surgery) ■ We have no current information on the appropriateness with which common surgical or diagnostic procedures are used
About One-Third of Common Surgical Procedures May Not Benefit Patients
37
Q U A L I T Y O F C A R E : E F F E C T I V E N E S S
38
Source: Siu et al., 1986.
0
5
10
15
20
25
30
35
40
Rates of hospital admissionsLow High
Percentageof admissions
judgedinappropriate
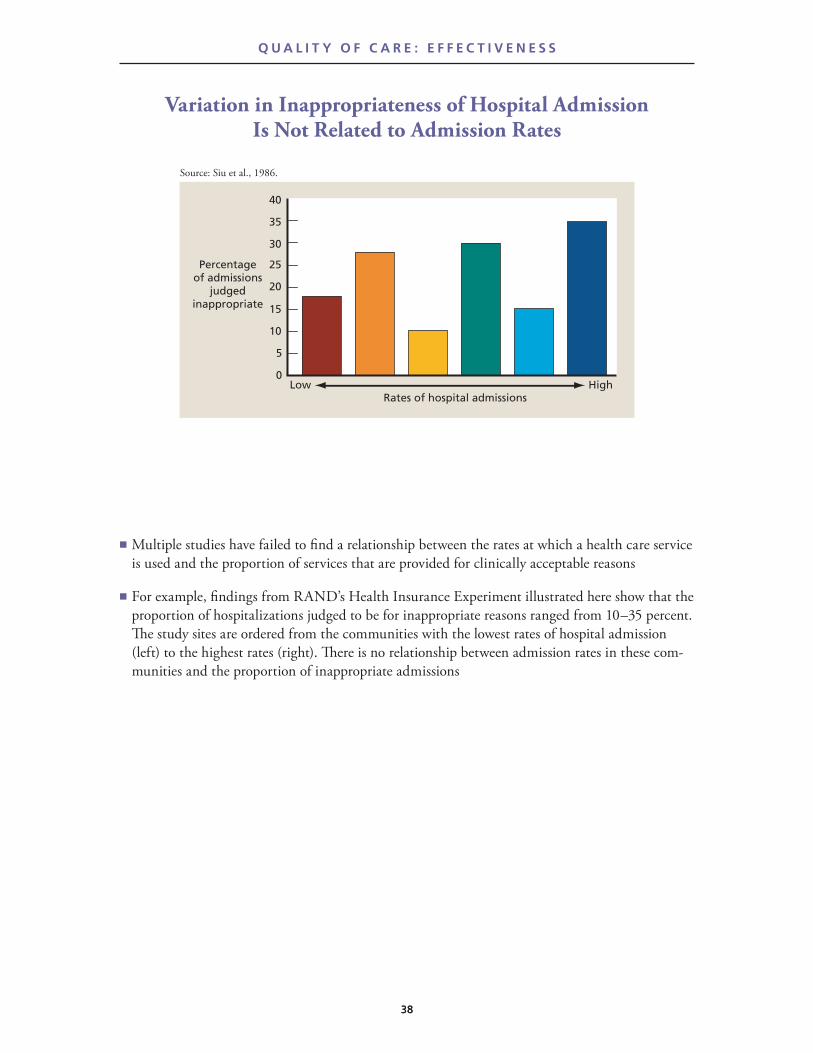
■ Multiple studies have failed to find a relationship between the rates at which a health care service is used and the proportion of services that are provided for clinically acceptable reasons
■ For example, findings from RAND’s Health Insurance Experiment illustrated here show that the proportion of hospitalizations judged to be for inappropriate reasons ranged from 10–35 percent. The study sites are ordered from the communities with the lowest rates of hospital admission (left) to the highest rates (right). There is no relationship between admission rates in these com- munities and the proportion of inappropriate admissions
Variation in Inappropriateness of Hospital Admission Is Not Related to Admission Rates
38
Q U A L I T Y O F C A R E : E F F E C T I V E N E S S
39
Source: McGlynn et al., 2003.
Care that meets quality
standards
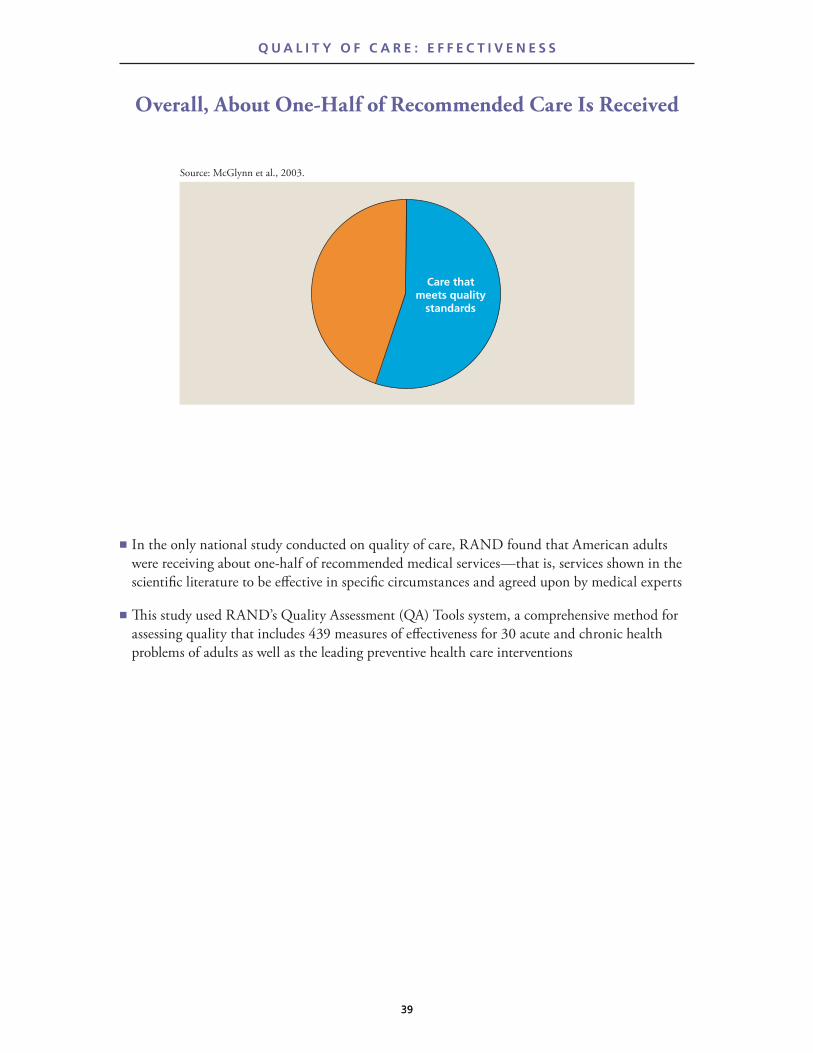
■ In the only national study conducted on quality of care, RAND found that American adults were receiving about one-half of recommended medical services—that is, services shown in the scientific literature to be effective in specific circumstances and agreed upon by medical experts
■ This study used RAND’s Quality Assessment (QA) Tools system, a comprehensive method for assessing quality that includes 439 measures of effectiveness for 30 acute and chronic health problems of adults as well as the leading preventive health care interventions
Overall, About One-Half of Recommended Care Is Received
39
Q U A L I T Y O F C A R E : E F F E C T I V E N E S S

Source: McGlynn et al., 2003.
0 20 40 60 80 100
Overuse
Underuse
Overall
Percentage of quality standards failed
■ RAND’s national study found that failure to deliver needed services (underuse) occurred more often than delivering services that were not needed or harmful (overuse)
■ Patients failed to receive needed services 46 percent of the time
■ Patients received services they did not need 11 percent of the time. This rate of overuse is consistent with previous findings about the rates of use for surgical procedures that were clearly inappropriate but may underrepresent the total rates of overuse in the population
Underuse Is a Greater Problem Than Overuse
40
Q U A L I T Y O F C A R E : E F F E C T I V E N E S S

Source: McGlynn et al., 2003.
0 20 40 60 80 100
Acute
Preventive
Chronic
Percentage of quality standards passed
■ RAND’s national study found deficits in quality of care across all types of care—chronic, preventive, and acute
■ Recommended care for managing chronic conditions (e.g., diabetes and hypertension) was provided 56 percent of the time
■ Preventive care (e.g., flu shots, mammograms and smoking cessation counseling) met quality standards 55 percent of the time
■ Recommended care for acute health problems (e.g., pneumonia and urinary tract infections) was provided 54 percent of the time
There Is Substantial Room for Improvement Across All Types of Care
41
Q U A L I T Y O F C A R E : E F F E C T I V E N E S S
Source: McGlynn et al., 2003.
0 20 40 60 80 100
Atrial fibrillation
Pneumonia
High cholesterol
Asthma
Chronic lung disease
Stroke
Heart failure
Hypertension
Coronary artery disease
Percentage of quality standards passed
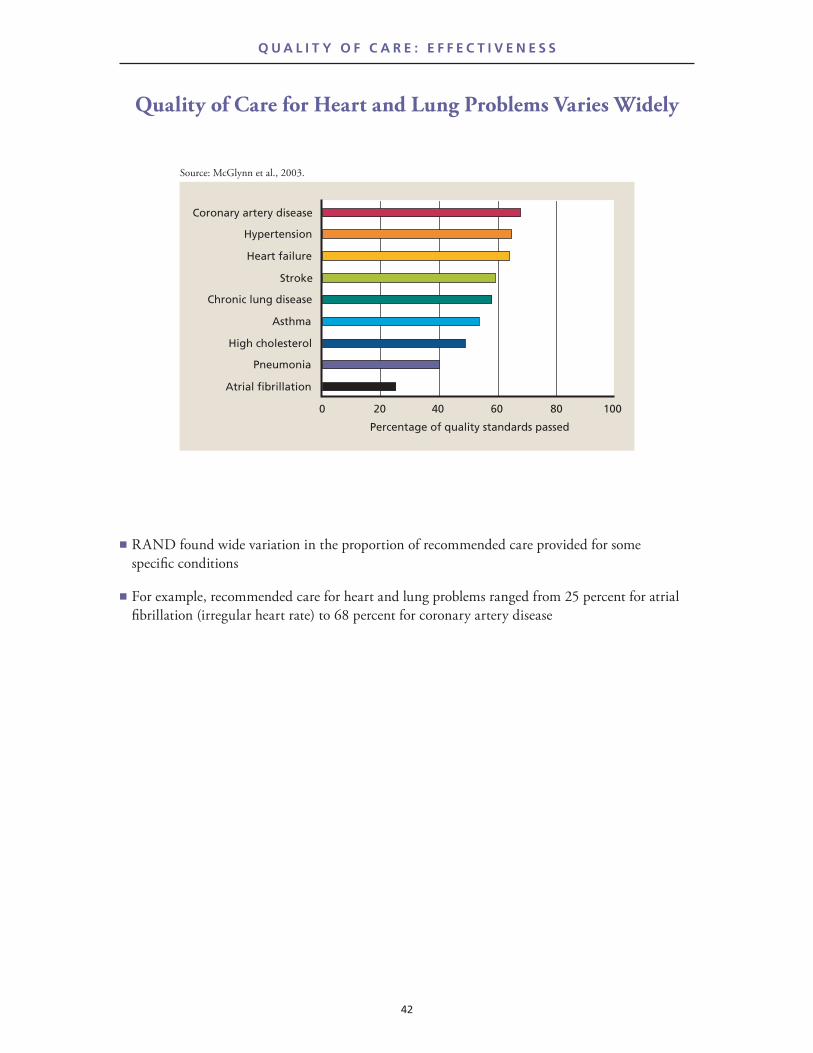
■ RAND found wide variation in the proportion of recommended care provided for some specific conditions
■ For example, recommended care for heart and lung problems ranged from 25 percent for atrial fibrillation (irregular heart rate) to 68 percent for coronary artery disease
Quality of Care for Heart and Lung Problems Varies Widely
42
Q U A L I T Y O F C A R E : E F F E C T I V E N E S S

■ RAND found wide variability in the quality of care provided to patients with other common medical problems ranging from 11 percent for alcohol dependence to 79 percent for cataracts
■ The poor quality of care delivered to persons with diabetes is especially troubling because it is associated with significantly increased risk of death and disability
■ The performance rates for both depression and alcohol dependence were limited to persons who had one of these diagnoses noted in their medical chart. We know from other work (and this is supported in RAND’s national study) that many people with these problems are not identified or diagnosed—so the quality deficit is actually much greater in these two areas
Significant Variation Exists in Management of Adults’ General Medical Problems
43
Q U A L I T Y O F C A R E : E F F E C T I V E N E S S
Source: McGlynn et al., 2003.
0 20 40 60 80 100
Percentage of quality standards passed
Alcohol dependence
Ulcers
Diabetes
Headache
Benign prostatic hyperplasia
Osteoarthritis
Depression
Low back pain
Cataracts
Source: Kerr et al., 2004.
Percentage of recommended care received
30 40 50 60 70 80 90 100
Boston
Cleveland
Greenville
Indianapolis
Lansing
Little Rock
Miami
Newark
Orange County
Phoenix
Seattle
Syracuse
Overall
Preventive
Acute
Chronic
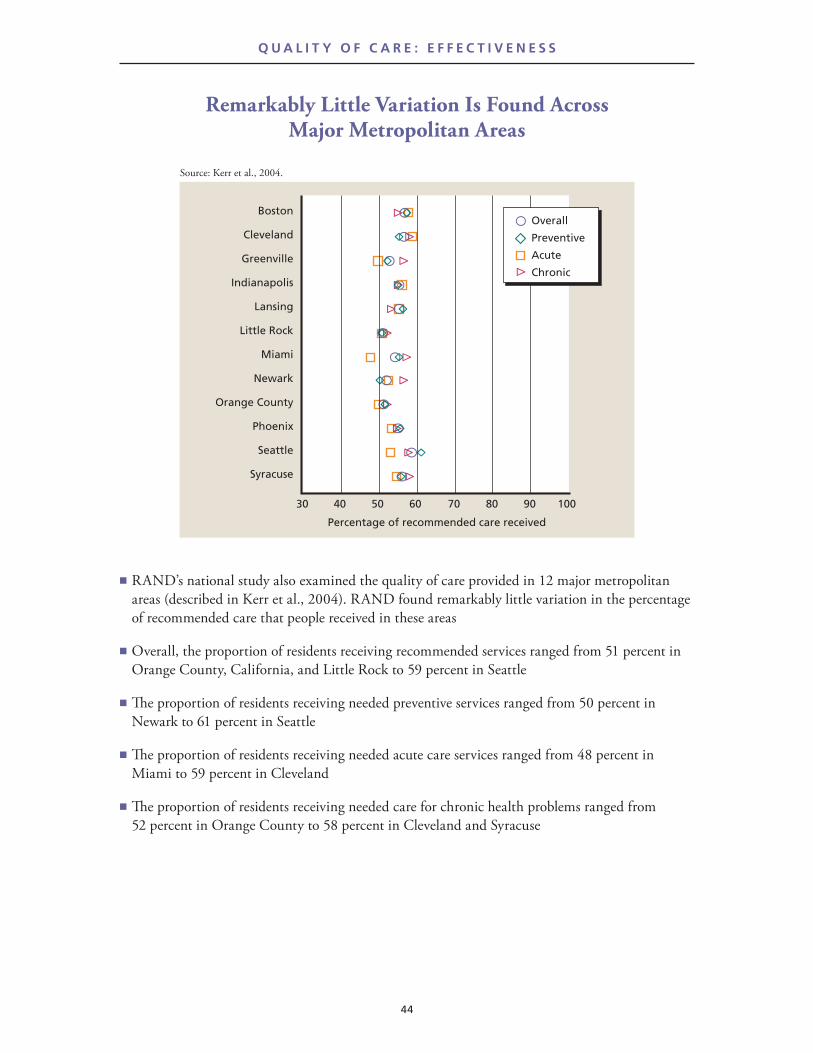
■ RAND’s national study also examined the quality of care provided in 12 major metropolitan areas (described in Kerr et al., 2004). RAND found remarkably little variation in the percentage of recommended care that people received in these areas
■ Overall, the proportion of residents receiving recommended services ranged from 51 percent in Orange County, California, and Little Rock to 59 percent in Seattle
■ The proportion of residents receiving needed preventive services ranged from 50 percent in Newark to 61 percent in Seattle
■ The proportion of residents receiving needed acute care services ranged from 48 percent in Miami to 59 percent in Cleveland
■ The proportion of residents receiving needed care for chronic health problems ranged from 52 percent in Orange County to 58 percent in Cleveland and Syracuse
Remarkably Little Variation Is Found Across Major Metropolitan Areas
44
Q U A L I T Y O F C A R E : E F F E C T I V E N E S S

Source: Kerr et al., 2004.
Percentage of recommended care received
Boston
Cleveland
Greenville
Indianapolis
Lansing
Little Rock
Miami
Newark
Orange County
Phoenix
Seattle
Syracuse
30 40 50 60 70 80 90 100
Hypertension
Diabetes
Pulmonary problems
Cardiac problems
Depression
■ The 12 metropolitan areas in the study had similar overall rates of recommended care for chronic conditions. However, there were some differences across communities
■ Care for diabetes ranged from 39 percent in Little Rock to 59 percent in Miami
■ Care for depression ranged from 47 percent in Newark to 63 percent in Seattle
■ Care for hypertension ranged from 54 percent in Little Rock to 69 percent in Cleveland
■ Care for cardiac problems ranged from 52 percent in Indianapolis and Orange County to 70 percent in Syracuse
■ Care for pulmonary problems ranged from 45 percent in Orange County to 64 percent in Miami
■ No community was consistently best or worst in the provision of recommended services
Quality for Selected Chronic Conditions Varies by Community
45
Q U A L I T Y O F C A R E : E F F E C T I V E N E S S

46
Estimated preventable Condition What we found complications/deaths (annual)
Diabetes Blood sugar not measured for 2,500 blind; 40%; 24% uncontrolled 29,000 kidney failure
Hypertension Blood pressure uncontrolled 68,000 deaths in 58%
Heart attack 39–55% did not receive needed 37,000 deaths medications
Pneumonia 36% no vaccine 10,000 deaths
Colon cancer 62% not screened 9,600 deaths
■ The deficits in care documented in RAND’s national study pose serious threats to the health of the American public and translate into thousands of preventable complications and deaths each year
■ People with diabetes received only 45 percent of the care they needed. Blood sugar was not measured in the two years of the study in 40 percent of patients with diabetes. One-quarter of those with their blood sugar measured demonstrated poor control, which can lead to kidney failure, blindness, and amputation of limbs
■ Patients with hypertension received less than 65 percent of recommended care. Uncontrolled blood pressure is associated with increased risk for heart disease and stroke and has been esti- mated to cause 68,000 preventable deaths annually (Woolf, 1999)
■ People with coronary artery disease received 68 percent of recommended care, but just 45 per- cent of heart attack patients received beta blockers and 61 percent got aspirin. This gap has been estimated to cause 37,000 preventable deaths annually (Woolf, 1999)
■ Fewer than two-thirds of elderly Americans were vaccinated against pneumonia. Nearly 10,000 deaths from pneumonia could be prevented annually through proper vaccinations (Woolf, 1999)
■ Just 38 percent of adults over age 50 were screened for colorectal cancer. Routine tests and appropriate follow-up could prevent 9,600 deaths a year (Woolf, 1999)
What Are the Consequences of Poor Quality?
46
Q U A L I T Y O F C A R E : E F F E C T I V E N E S S

47
Source: Wenger et al., 2003.
Medical conditions
52% ofstandards
met
Geriatric conditions
31% ofstandards
met
■ RAND’s national assessment of quality described the epidemiology for the country. Other RAND quality assessment efforts using the ACOVETM (Assessing Care of Vulnerable Elders) quality measurement system have focused on individuals 65 or over who are at increased risk for functional decline or death
■ The study findings for this subset of the population were the same as for the national study: Overall, vulnerable elders received about one-half of recommended care, as measured by the percentage of time that providers met standards for quality care
■ Adherence to standards of care was even poorer for geriatric conditions. For example, RAND found that recommended care was provided 31 percent of the time for geriatric conditions such as dementia, urinary incontinence, and falls, which affect primarily the elderly. This finding is particularly troublesome given that early attention to geriatric conditions such as falls and gait disorders may avoid functional decline and even death
Care for Geriatric Conditions Is Poorer Than Care for General Medical Conditions
Q U A L I T Y O F C A R E : E F F E C T I V E N E S S

48
Source: Wenger et al., 2003.
0 20 40 60 80 100
Follow-up
Prevention
Treatment
Diagnosis
Overall
Percentage of recommended care received
■ The percentage of quality standards met varies for different types of care
■ Standards were met least often for preventive care—43 percent of the time. Standards met for diagnosis were only slightly higher at 46 percent
■ Standards were met most often for treatment (80 percent)
■ This difference might be explained by the nature of the U.S. health care system, which reimburses providers for time spent performing procedures and prescribing medications, but not for time spent taking thorough histories or providing preventive counseling
■ Researchers also found that providers administered proper care to patients with conditions that needed immediate treatment (acute conditions) far more frequently than to those with chronic health problems—83 percent of the time versus 51 percent
Quality of Preventive Care for the Elderly Is the Poorest
Q U A L I T Y O F C A R E : E F F E C T I V E N E S S

49
Source: Wenger et al., 2003.
0 20 40 60 80 100
End-of-life care
Pneumonia
Osteoarthritis
Falls
Stroke
Percentage of recommended care received
■ As was the case in the national assessment, quality of care for the elderly varied widely by condition
■ Quality standards were met in treatment for stroke 82 percent of the time. In contrast, standards were met in end-of-life care only 9 percent of the time
Quality of Care for the Elderly Varies by Condition
Q U A L I T Y O F C A R E : E F F E C T I V E N E S S
50
Percentage of recommended care received
Source: Rubenstein et al., 2004.
0 20 40 60 80 100
Blood pressure
Vision
Gait and balance
Neurological
Type of exam
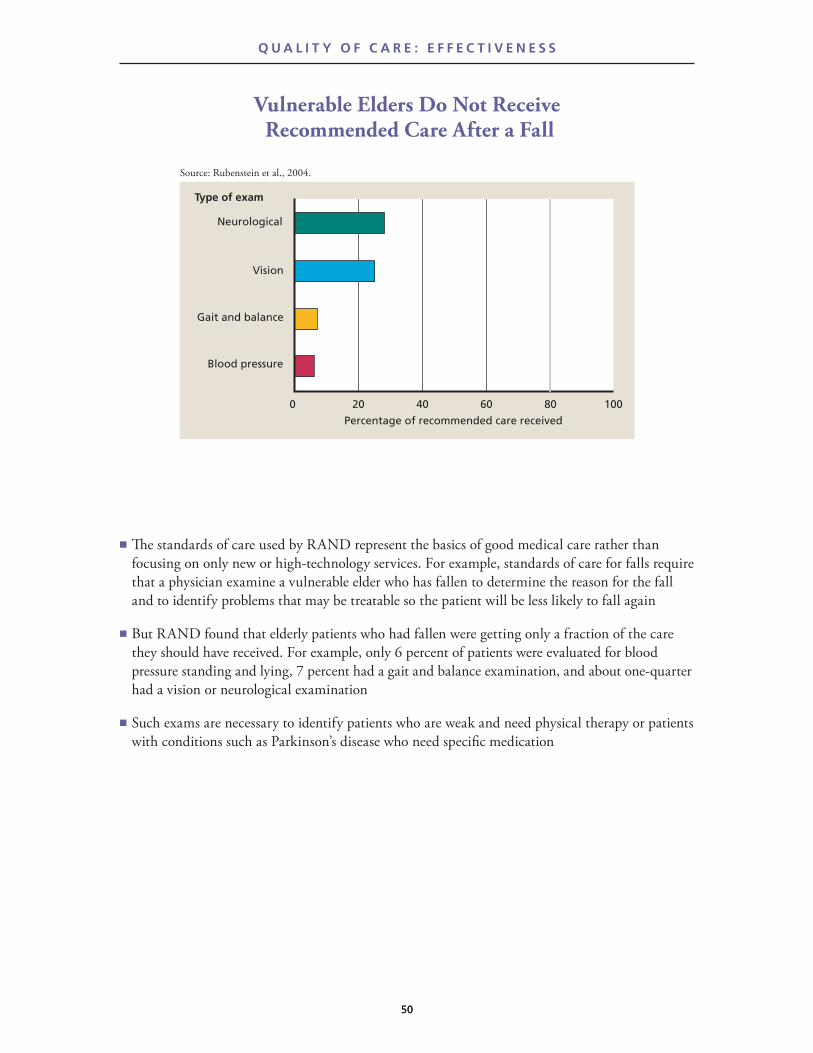
■ The standards of care used by RAND represent the basics of good medical care rather than focusing on only new or high-technology services. For example, standards of care for falls require that a physician examine a vulnerable elder who has fallen to determine the reason for the fall and to identify problems that may be treatable so the patient will be less likely to fall again
■ But RAND found that elderly patients who had fallen were getting only a fraction of the care they should have received. For example, only 6 percent of patients were evaluated for blood pressure standing and lying, 7 percent had a gait and balance examination, and about one-quarter had a vision or neurological examination
■ Such exams are necessary to identify patients who are weak and need physical therapy or patients with conditions such as Parkinson’s disease who need specific medication
Vulnerable Elders Do Not Receive Recommended Care After a Fall
50
Q U A L I T Y O F C A R E : E F F E C T I V E N E S S

Percentage of quality standards failed
Source: Higashi et al., 2004.
0 20 40 60 80 100
Inappropriate medication
Inadequate education/continuity/documentation
Inadequate monitoring
Not prescribed indicatedmedication
■ Despite concerns about inappropriate use of medication, RAND has found that among the vulnerable elderly, the greatest problems with medication management are failure to prescribe needed medications and failure to monitor patients’ response to (or side effects from) the medi- cations that are prescribed
■ This underscores the importance of comprehensive evaluations of quality problems—so that priorities can be set across the broad range of quality issues
Medication Management for Vulnerable Elders Is Poor
51
Q U A L I T Y O F C A R E : E F F E C T I V E N E S S

Source: Institute of Medicine, 2001.
Elements of quality care Type of quality problem
People get the care they need Underuse
People need the care they get Overuse
Provided safely Error
Timely Delays
Patient centered Unresponsive
Delivered equitably Disparities
Delivered efficiently Waste
■ We have been focusing on the effectiveness of care. We now turn our attention to the other five dimensions of quality defined by the Institute of Medicine: safety, timeliness, patient centered- ness, equity, and efficiency
The Multiple Dimensions of Quality
52
Q U A L I T Y O F C A R E

Source: Agency for Healthcare Research and Quality, 2004.
Medical Surgical
Obstetrics
■ The Institute of Medicine focused national attention on quality problems related to medical errors in its recent report To Err Is Human (Kohn, Corrigan, and Donaldson, 2000)
■ The Agency for Healthcare Research and Quality has found that 1.12 million problems with patient safety occurred in 1.07 million hospitalizations—about one per hospitalization
■ The problems were distributed relatively equally across the three major types of hospitalizations: • 34 percent in surgical admissions • 31 percent in obstetrics admissions • 35 percent in medical admissions ■ Other studies have found that 45–48 percent of adverse events are attributable to surgical admissions (Leape et al., 1991; Thomas et al., 2000)
■ About 17 percent of adverse events in surgery were the result of negligence (Leape et al., 1991; Thomas et al., 2000)
Problems with Patient Safety Occur in All Types of Hospitalizations
53
Q U A L I T Y O F C A R E : S A F E T Y
Source: Bates et al., 1995.
Ordering
Other
Administration
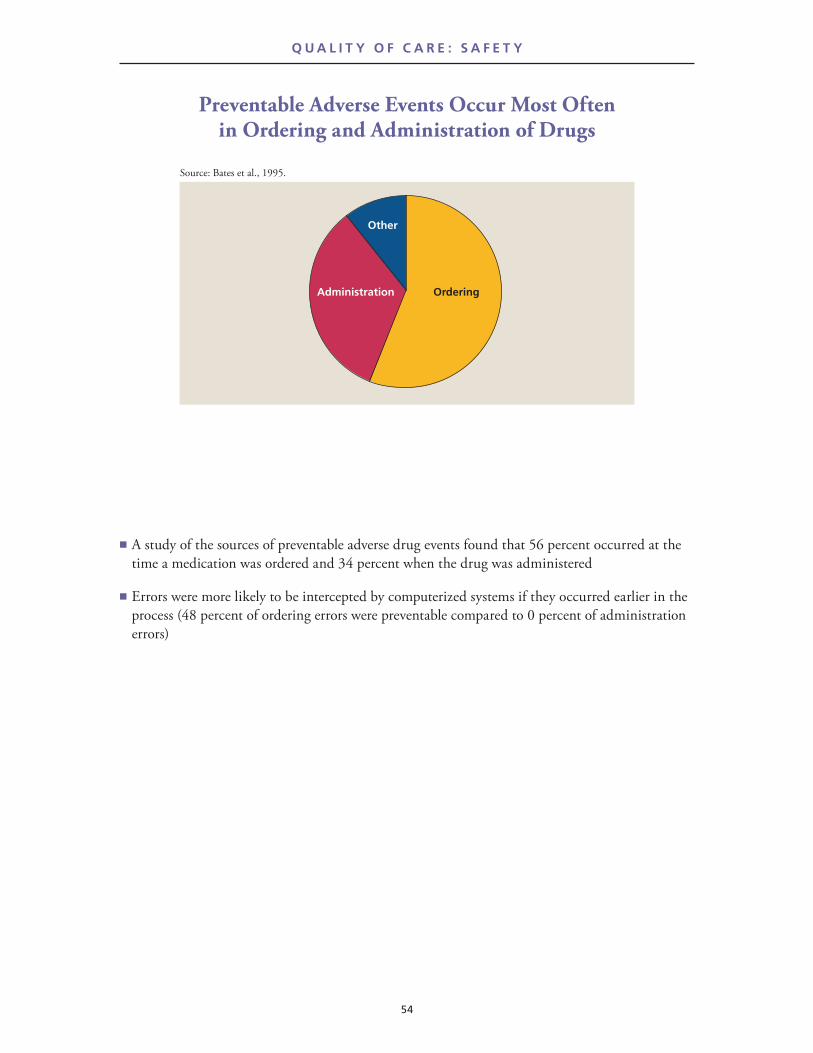
■ A study of the sources of preventable adverse drug events found that 56 percent occurred at the time a medication was ordered and 34 percent when the drug was administered
■ Errors were more likely to be intercepted by computerized systems if they occurred earlier in the process (48 percent of ordering errors were preventable compared to 0 percent of administration errors)
Preventable Adverse Events Occur Most Often in Ordering and Administration of Drugs
54
Q U A L I T Y O F C A R E : S A F E T Y

55
Source: California CABG Mortality Reporting Program, 2003.
Greater Los Angeles Area
Cedars-Sinai Medical Center
Daniel Freeman Memorial Hospital
Kaiser Foundation Hospital—Los Angeles
Long Beach Memorial Medical Center
Methodist Hospital of Southern California
Presbyterian Intercommunity Hospital
Santa Monica–UCLA Hospital Medical Center
St. Francis Medical Center
St. John’s Hospital—Santa Monica
St. Vincent Medical Center
Hospital of the Good Samaritan
Torrance Memorial Medical Center
UCLA Medical Center
USC University Hospital
352
156
1,597
363
282
73
58
96
148
282
649
202
177
105
1999volume
•
•
•
•
•
•
•
•
•
•
•
•
•
•
•
0 10 128642Mortality rateObserved mortality rate
Expected mortality rateRange of expected mortality rate(95% confidence level)
■ Public reporting of quality data is one way to make the public more aware of, and concerned about, quality issues and to give providers an incentive to provide quality care. For example, the Office of Statewide Health Planning and Development and the Pacific Business Group on Health established a voluntary statewide reporting program to collect and publicly report mortality data from California hospitals for coronary artery bypass graft (CABG)
■ This chart compares the expected mortality rate for CABG—that is, the number of patients one would expect to die following surgery, given the severity of their illness—and the actual mortal- ity rate for hospitals in the Greater Los Angeles Area in calendar year 1999 that participated in the program
■ None of these hospitals had a significant difference between the expected mortality rate and the actual rate—in either direction. That is, the hospitals did not perform either better or worse than one would expect, given the kind of patients they treat
Expected Mortality Rate Can Be Compared with the Rate Observed
55
Q U A L I T Y O F C A R E : S A F E T Y

56
Source: The National CAHPS® Benchmarking Database, 2002–2003.
0 20 40 60 80 100
Medicare
Medicaid
Privateinsurance
Percentage reporting always receiving timely care
■ Quality care is also timely and patient centered. A standardized national survey known as CAHPS® (originally, Consumer Assessment of Health Plans) gathers annual data about aspects of consumer experiences with obtaining medical care, including these two dimensions
■ CAHPS data show that Medicare beneficiaries were significantly more likely than individuals covered by Medicaid or private insurance to report that they always got the care they needed (appointments, treatments, and seeing a doctor when scheduled) in a timely manner
Medicare Beneficiaries Report Least Problems with Receiving Timely Care
56
Q U A L I T Y O F C A R E : T I M E L I N E S S

57
Source: The National CAHPS® Benchmarking Database, 2002–2003.
Medicare
Medicaid
Privateinsurance
Percentage of respondents
Never/sometimes
Usually Always
0 20 40 60 80 100
■ One dimension of patient-centered care that CAHPS measures is a physician’s ability to communicate with his or her patients. Patients rated how often (never or sometimes, usually, or always) physicians communicated well
■ Medicare beneficiaries were more likely than other patient groups to give their physicians high marks on communication
Medicare Beneficiaries Give Their Personal Physicians High Ratings for Communication
57
Q U A L I T Y O F C A R E : P A T I E N T - C E N T E R E D C A R E

58
Source: The National CAHPS® Benchmarking Database, 2002–2003.
Medicare
Medicaid
Privateinsurance
Percentage of respondents
0–6 7–8 9–10
0 20 40 60 80 100
■ The CAHPS survey asks patients to rate their overall care, on a ten-point scale, where zero is the worst possible and ten is best possible
■ Medicare beneficiaries were more likely than other groups to rate their overall care as a 9 or 10
Medicare Beneficiaries Rate Their Overall Health Care Higher
58
Q U A L I T Y O F C A R E : P A T I E N T - C E N T E R E D C A R E

59
Percentage of ideal candidates for therapy who received it
Source: Gan et al., 2000.
0 20 40 60 80 100
Thrombolytictherapy, any time
Thrombolytictherapy, in 1 hour
Aspirin within24 hours
ACE inhibitor atdischarge
Aspirin at discharge
MenWomen
■ Many studies have identified disparities in care between men and women and between different ethnic or socioeconomic groups
■ For example, data from 1994–1995 show disparities in care between men and women who have had heart attacks
■ Female Medicare patients hospitalized for heart attacks were less likely than men to receive drug therapies known to be effective in improving survival
■ They were also less likely to receive time-sensitive therapies on a timely basis
Women Are Less Likely to Get Effective Drug Therapies for Heart Attacks
59
Q U A L I T Y O F C A R E : E Q U I T Y

60
Percentage of kidney dialysis patients age 18–54
Source: Ayanian et al., 1999; Epstein et al., 2000.
0 20 40 60 80 100
Referred for transplant evaluation
Received a transplant
White
African American
■ Almost all end-stage renal disease (ESRD) patients have Medicare coverage, which should minimize disparities in financial access to care
■ But among ESRD patients age 18–54 who started kidney dialysis, African Americans were less likely than white patients to be referred for evaluation or to receive a kidney transplant
■ African Americans were also less likely to be placed on a waiting list for a transplant
■ There were no differences between men and women in access to kidney transplants
African Americans Are Less Likely to Have Access to Kidney Transplants
60
Q U A L I T Y O F C A R E : E Q U I T Y

61
Percentage of respondents
Sources: Bernabei et al., 1998; Cleeland et al., 1994.
0 20 40 60 80 100
Percentage of nursing home residents in daily
pain who received no pain medication, 1992–1995
Percentage of outpatient cancer patients with
inadequate pain management, 1990–1991
White
African American
White
Minority
■ Two studies in the last decade found that many cancer patients did not receive adequate medi- cation for their pain
■ Among elderly nursing home residents who reported being in daily pain, 34 percent of African Americans and 25 percent of white residents did not receive any pain medication (Bernabei et al., 1998)
■ Among cancer patients visiting 54 outpatient clinics, 59 percent of minority patients and 38 percent of white patients had inadequate pain management (Cleeland et al., 1994)
■ The overall level of inadequate pain management among cancer patients is troubling; the greater inadequacy among minorities is even more disturbing
Minority Patients Are Less Likely to Receive Adequate Cancer Pain Management
61
Q U A L I T Y O F C A R E : E Q U I T Y

62
Percentage of parents reporting received care
Source: Bussing et al., 2003.
0 20 40 60 80 100
Behavior problem
Evaluated forADHD
Diagnosed withADHD
Treated for ADHD
WhiteAfrican American
■ In 1998, most elementary school children with symptoms of attention-deficit/hyperactivity disorder (ADHD) were recognized by their parents as having behavior problems
■ White children were more likely than African American children to have been professionally evaluated and subsequently diagnosed and treated for ADHD
■ Boys were also more likely than girls to be diagnosed and treated
African American Children Are Less Likely Than Whites to Be Diagnosed and Treated for ADHD
62
Q U A L I T Y O F C A R E : E Q U I T Y

63
Source: Gillerman and Browning, 2000.
Atracurium
Thiopental
Succinylcholine
Propofol
Midazolam
Rocuronium
0 20 40 60 80 100
Efficiency index(amount of drug administered divided by amount ordered)
Drug class
■ One dimension of waste in the health care system is supplies that are ordered and not used, particularly when those supplies cannot be reused
■ Use of six high-volume or high-cost anesthesia drugs was studied over a one-year period in one hospital. The authors compared the amount of medication ordered to the amount that was actually administered
■ The total cost of unadministered drugs was $165,667 or 26 percent of what was spent on all drugs in the anesthesia department
■ The main reason for waste was disposal of syringes that were full or partially full
■ We have no national estimates of the amount of health care spending that can be attributed to waste
Use of Anesthesia Drugs Demonstrates One Type of System Inefficiency
63
Q U A L I T Y O F C A R E : E F F I C I E N C Y


Costs and Insurance
Agency for Healthcare Research and Quality, Center for Financing, Access, and Cost Trends, Medical Expenditure Panel Survey, 2000.
American Hospital Association, American Hospital Associa-tion Hospital Statistics, Chicago, IL, 2004.
American Hospital Association, American Hospital Associa-tion Hospital Statistics, Chicago, IL, 1983.
Anderson, G, Reinhardt, U, et al., “It’s the Prices, Stupid: Why the United States Is So Different from Other Coun-tries,” Health Affairs, Vol. 22, No. 3, 2003, pp. 89–105.
Baker LC, and Atlas SW, “Relationship Between HMO Market Share and the Diffusion and Use of Advanced MRI Technologies,” Journal of the American College of Radiology, Vol. 1, No. 7, 2004, pp. 478–487.
Baumgarten, A, California HealthCare Market Report 2004, California HealthCare Foundation, Oakland, CA, April 2004.
Berndt ER, “The U.S. Pharmaceutical Industry: Why Major Growth in Times of Cost Containment?” Health Affairs, Vol. 20, 2001, pp. 100–114.
California HealthCare Foundation, Health Care Costs 101, Oakland, CA, May 2004a.
California HealthCare Foundation, Medi-Cal Facts and Figures: A Look at California’s Medicaid Program, Oakland, CA, January 2004b.
California HealthCare Foundation, Snapshot: California’s Uninsured, 2003, Oakland, CA, January 2004c.
Canadian Institute for Health Information, Medical Imag-ing in Canada, 2003.
Centers for Medicare & Medicaid Services, The CMS Chart Series, An Overview of the U.S. Healthcare System: Two Decades of Change, 1980–2000, Baltimore, MD, October 2, 2003. Online at http://www.cms.hhs.gov/charts/ healthcaresystem/ (as of August 18, 2004).
Centers for Medicare & Medicaid Services, Health Accounts, “National Health Expenditures Aggregate, Per Capita, Per-cent Distribution, and Annual Percent Change by Source of Funds: Calendar Years 1960–02,” “National Health Expenditures by Type of Service and Source of Funds: Calendar Years 1960–02,” “National Health Expenditure
65
(NHE) Amounts by Type of Expenditure and Source of Funds: Calendar Years 1965–2013,” Baltimore, MD: Centers for Medicare & Medicaid Services, Office of the Actuary, 2004. Online at http://www.cms.hhs.gov/statistics/nhe/#download (as of August 24, 2004).
Fronstin P, “Health Insurance Coverage of Individuals Ages 55–64, 1994–2002,” Employee Benefit Research Institute (EBRI) Notes, Vol. 25, No. 3, March 2004, pp. 6–16.
Goldman DP, Joyce GF, Escarce JJ, Pace JE, Solomon MD, Laouri M, Landsman PB, and Teutsch SM, “Pharmacy Benefits and the Use of Drugs by the Chronically Ill,” Journal of the American Medical Association, Vol. 291, No. 19, May 18, 2004, pp. 2344–2350.
Hobbs F, and Stoops N, Demographic Trends in the 20th Century, Washington, DC: U.S. Census Bureau, November 2002. Online at http://www.census.gov/prod/2002pubs/censr-4.pdf (as of August 18, 2004).
Institute of Medicine, Insuring America’s Health: Principles and Recommendations, Fact Sheet 1 and 2, Washington, DC: National Academies Press, January 2004. Online at http://www.iom.edu/report.asp?id=17632 (as of August 18, 2004).
Kaiser Commission on Medicaid and the Uninsured, Health Insurance Coverage in America: 2002 Data Update, Menlo Park, CA: The Henry J. Kaiser Family Foundation, December 2003a. Online at http://www.kff.org/uninsured/kcmuchartbookpkg.cfm (as of August 18, 2004).
Kaiser Commission on Medicaid and the Uninsured, Health Insurance Coverage in America: 2001 Data Update, Menlo Park, CA: The Henry J. Kaiser Family Foundation, January 2003b. Online at http://www.kff.org/uninsured/kcmuchartbookpkg.cfm (as of August 18, 2004).
Kaiser Commission on Medicaid and the Uninsured, Health Insurance Coverage in America: 2000 Data Update, Menlo Park, CA: The Henry J. Kaiser Family Foundation, February 2002. Online at http://www.kff.org/uninsured/kcmuchartbookpkg.cfm (as of August 18, 2004).
Kaiser Commission on Medicaid and the Uninsured, Health Insurance Coverage in America: 1999 Data Update, Menlo Park, CA: The Henry J. Kaiser Family Foundation, December 2000. Online at http://www.kff.org/uninsured/kcmuchartbookpkg.cfm (as of August 18, 2004).
The Henry J. Kaiser Family Foundation, State Health Facts Online, Menlo Park, CA: The Henry J. Kaiser Family Foundation, August 2004. Online at www.statehealthfacts.org (as of August 18, 2004).
References
The Henry J. Kaiser Family Foundation and Health Research and Educational Trust, California Employer Health Benefits Survey 2003, Menlo Park, CA: The Henry J. Kaiser Family Foundation, March 2004a.
The Henry J. Kaiser Family Foundation and Health Research and Educational Trust, Employer Health Benefits Survey, 2004, Menlo Park, CA: The Henry J. Kaiser Fam-ily Foundation, August 2004b.
The Henry J. Kaiser Family Foundation and Health Research and Educational Trust, Employer Health Benefits 2003 Annual Survey, Menlo Park, CA: The Henry J. Kaiser Family Foundation, September 2003a.
The Henry J. Kaiser Family Foundation and Health Research and Educational Trust, The Health Insurance Act of 2003 (SB2): Updated Findings from the 2002 California Employer Health Benefits Survey, #3376, Menlo Park, CA: The Henry J. Kaiser Family Foundation, October 2003b. Online at http://www.kff.org/statepolicy/california.cfm (as of August 18, 2004).
66
Meara E, White C, and Cutler D, “Trends in Medical Spending by Age, 1963–2000,” Health Affairs, Vol. 23, No. 4, July/August 2004, pp. 176–183.
Newhouse JP, and the Insurance Experiment Group, Free for All? Lessons from the RAND Health Insurance Experi-ment, Cambridge, MA: Harvard University Press, 1993.
Organisation for Economic Co-operation and Development (OECD), OECD Health Data 2002, Paris: OECD, 2002.
Organisation for Economic Co-operation and Development (OECD), OECD Health Data 2004, Paris: OECD, 2004.
Olin G, and Machlin S, Health Care Expenses in the Com-munity Population, 1999, Rockville, MD: Agency for Healthcare Research and Quality, MEPS Chartbook No. 11, AHRQ Pub. No. 03-0038, August 2003.

Quality of Care
Agency for Healthcare Research and Quality, web site, http://www.ahcpr.gov/, 2004.
Ayanian JZ, Cleary PD, Weissman JS, and Epstein AM, “The Effect of Patients’ Preferences on Racial Differences in Access to Renal Transplantation,” New England Journal of Medicine, Vol. 341, No. 22, November 25, 1999, pp. 1661–1669.
Bates DW, Cullen DJ, Laird N, Petersen LA, Small SD, Servi D, Laffel G, Sweitzer BJ, Shea BF, Hallisey R, Vliet MV, Nemeskal R, and Leape LL, “Incidence of Adverse Drug Events and Potential Adverse Drug Events. Implica- tions for Prevention,” ADE Prevention Safety Group, Journal of the American Medical Association, Vol. 274, No. 1, July 5, 1995, pp. 29–34.
Bernabei R, Gambassi G, Lapane K, et al., “Management of Pain in Elderly Patients with Cancer,” Journal of the American Medical Association, Vol. 279, No. 22, June 17, 1998, pp. 1877–1882.
Bernstein SJ, McGlynn EA, Siu AL, Roth CP, Sherwood MJ, Keesey J, Kosecoff JB, Hicks NR, and Brook RH, “The Appropriateness of Hysterectomy: A Comparison of Care in Seven Health Plans,” Journal of the American Medical Asso-ciation, Vol. 269, No. 18, May 12, 1993, pp. 2398–2402 (also available from RAND Corporation as RP-204, 1993).
Bussing et al., “Barriers to Detection, Help-Seeking and Service Use for Children with ADHD Symptoms, Journal of Behavioral Health Services Research, Vol. 30, 2003, pp. 176–189.
California CABG Mortality Reporting Program, The California Report on Coronary Artery Bypass Graft Surgery: 1999 Hospital Data, Summary Report, Sacramento, CA, 2003. Online at http://www.oshpd.cahwnet.gov/HQAD/HIRC/hospital/Outcomes/CABG/index.htm (as of August 16, 2004).
Chassin MR, Kosecoff J, Solomon DH, and Brook RH, “How Coronary Angiography Is Used: Clinical Determi-nants of Appropriateness,” Journal of the American Medi-cal Association, Vol. 258, No. 18, November 13, 1987, pp. 2543–2547 (also available from RAND Corporation as RP-152, 1987).
Cleeland, CED, Gonin R, Hatfield, AK, et al., “Pain and Its Treatment in Outpatients with Metastatic Cancer,” New England Journal of Medicine, Vol. 330, No. 9, March 3, 1994, pp. 592–596.
67
The Dartmouth Atlas of Health Care, Hanover, NH: Center for the Evaluative Clinical Sciences at Dartmouth Medical School. Online at http://www.dartmouthatlas.org/ (as of August 16, 2004).
Epstein AM, Ayanian JZ, Keogh JH, Noonan SJ, Armi-stead N, Cleary PD, Weissman JS, David-Kasdan JA, Carlson D, Fuller J, Marsh D, and Conti RM, “Racial Dis-parities in Access to Renal Transplantation,” New England Journal of Medicine, Vol. 343, No. 21, November 23, 2000, pp. 1537–1544.
Gan SC, Beaver SK, Houck PM, MacLehose RF, Lawson HW, and Chan L., “Treatment of Acute Myocardial Infarc-tion and 30-Day Mortality Among Women and Men,” New England Journal of Medicine, Vol. 343, No. 1, July 6, 2000, pp. 8–15.
Gillerman RG, and Browning RA. “Drug Use Inefficiency: A Hidden Source of Wasted Health Care Dollars,” Anes-thesia and Analgesia, Vol. 91, No. 4, October 2000, pp. 921–924.
Higashi T, Shekelle PG, Solomon DH, Knight EL, Roth C, Chang JT, Kamberg CJ, MacLean CH, Young RT, Adams J, Reuben DB, Avorn J, and Wenger NS, “The Quality of Pharmacologic Care for Vulnerable Older Patients,” Annals of Internal Medicine, Vol. 140, No. 8, May 4, 2004, pp. 714–720.
Hilborne LH, Leape LL, Bernstein SJ, Park RE, Fiske ME, Kamberg CJ, Roth CP, and Brook RH, “The Appropriate-ness of Use of Percutaneous Transluminal Coronary Angio-plasty in New York State,” Journal of the American Medical Association, Vol. 269, No. 6, February 10, 1993, pp. 761–765 (also available from RAND Corporation as RP-186, 1993).
Institute of Medicine, Committee on Quality of Health Care in America, Crossing the Quality Chasm: A New Health System for the 21st Century, Washington DC: National Academies Press, 2001, p. 364.
Kerr EA, McGlynn EA, Adams J, Keesey J, and Asch SM, “Profiling the Quality of Care in Twelve Communities: Results from the CQI Study,” Health Affairs, Vol. 23, No. 3, May/June 2004, pp. 247–256.
Kohn LT, Corrigan JM, and Donaldson MS, eds., To Err Is Human: Building a Safer Health System, Institute of Medi-cine, Committee on Quality of Health Care in America, Washington DC: National Academies Press, 2000.
68
Leape LL, Brennan TA, Laird N, Lawthers AG, Localio AR, Barnes BA, Hebert L, Newhouse JP, Weiler PC, and Hiatt H, “The Nature of Adverse Events in Hospitalized Patients. Results of the Harvard Medical Practice Study,” New England Journal of Medicine, Vol. 324, No. 6, February 7, 1991, pp. 377–384.
McGlynn EA, Asch SM, Adams J, Keesey J, Hicks J, DeCristofaro A, and Kerr EA, “The Quality of Health Care Delivered to Adults in the United States,” New England Journal of Medicine, Vol. 348, No. 26, June 26, 2003, pp. 2635–2645.
The National CAHPS® Benchmarking Database, 2002–2003. Online at http://ncbd.cahps.org/pdf/NCBD2003Chartbook_Vol1.pdf (as of August 16, 2004).
Rubenstein LZ, Solomon DH, Roth CP, Young RT, Shekelle PG, Chang JT, MacLean CH, Kamberg CJ, Saliba D, and Wenger NS, “Detection and Management of Falls and Instability in Vulnerable Elders by Community Physi-cians,” Journal of the American Geriatrics Society, Vol. 52, No. 9, September 2004, pp. 1527–1531.
Siu AL, Sonnenberg FA, Manning WG, Goldberg GA, Bloomfield ES, Newhouse JP, and Brook RH, “Inappro-priate Use of Hospitals in a Randomized Trial of Health Insurance Plans,” New England Journal of Medicine, Vol. 20, No. 315, 1986, pp.1259–1266.
Thomas EJ, Studdert DM, Burstin HR, Orav EJ, Zeena T, Williams EJ, Howard KM, Weilder PC, and Brennan TA, “Incidence and Types of Adverse Events and Negligent Care in Utah and Colorado,” Medical Care, Vol. 38, No. 3, 2000, pp. 261–271.
Tobacman JK, Lee P, Zimmerman B, Kolder H, Hilborne L, and Brook RH, “Assessment of Appropriateness of Cata-ract Surgery in Ten Academic Medical Centers in 1990,” Ophthalmology, Vol. 103, No. 2, 1996, pp. 207–215.
Wenger NS, Solomon DH, Roth CP, MacLean CH, Saliba D, Kamberg CJ, Rubenstein LZ, Young RT, Sloss EM, Louie R, Adams J, Chang JT, Venus PJ, Schnelle JF, and Shekelle PG, “The Quality of Medical Care Provided to Vulnerable Community-Dwelling Older Patients,” Annals of Internal Medicine, Vol. 139, No. 9, November 4, 2003, pp. 740–747, E-748–E-759.
Winslow CM, Kosecoff JB, Chassin M, Kanouse DE, and Brook RH, “The Appropriateness of Performing Coronary Artery Bypass Surgery,” Journal of the American Medical Association, Vol. 260, No. 4, July 1988, pp. 505–509.
Woolf SH, “The Need for Perspective in Evidence-Based Medicine,” Journal of the American Medical Association, Vol. 282, No. 24, December 22, 1999, pp. 2358–2365.
Costs and Insurance
Reprinted by permission of the California HealthCare Foundation, pp. 6, 28. Reprinted by permission of The Henry J. Kaiser Family Foundation, p. 15. The Kaiser Family Foundation, based in Menlo Park, California, is a nonprofit, independent national health care philanthropy and is not associated with Kaiser Permanente or Kaiser Industries. Reprinted by permission of the National Academy of Sciences, courtesy of the National Academies Press, Washington, D.C., from Insuring America’s Health: Principles and Recommendations, © 2004, p. 22.
Quality of Care Reprinted by permission of The Dartmouth Atlas of Health Care, courtesy of the Trustees of Dartmouth College, © 2004, p. 37.
Chart Permissions

RAND HealthRAND Health, a research division of the RAND Corporation, is the nation’s most trusted source of objective health policy research. Its mission is to advance understanding of health and health behaviors and to exam-ine how the organization and financing of care affect costs, quality, and access. The focus of its agenda is on policy research to promote a better health care system. RAND Health’s research staff of more than 180 experts includes physicians, economists, psychologists, mathematicians, organizational analysts, political scientists, psychometricians, medical sociologists, policy analysts, and statisticians. Many of the staff physicians hold joint appoint-ments at the University of California, Los Angeles, Medical Center and/or the Department of Veterans Affairs. RAND Health is directed by RAND Vice President Robert H. Brook, MD, ScD, FACP. Dr. Brook is also Director of the Robert Wood Johnson Clinical Scholars Program at UCLA and Professor of Medicine and Health Services at UCLA’s Center for Health Sciences. He is an internationally known expert on health care quality assessment and assur-ance, development and use of health status measurement in health policy, efficiency and effectiveness of care, and geographic variation in the use of health care services.
The Communications InstituteThe Communications Institute, based in Pasadena, California, was founded to enhance the ability of society to confront critical issues through the knowledge and application of objective, nonpartisan research and perspec-tives. The institute is a consortium of academic and research institutions and scholars with expertise in economics, science, engineering, and the law. It provides programs and resources for policymakers and journalists along with leaders in the private and independent sectors of society. The institute is governed by a board with members from institu-tions such as the RAND Corporation, Harvard University, the California Institute of Technology, Dartmouth College, the University of Southern California, and the University of Rochester. The Communications Insti-tute staff has three decades of international experience in program develop- ment on public policy and technology issues for thousands of policymakers, business executives, community leaders, and journalists.

CP-484-1 (1/05)