Support for victims: Findings from the Crime Survey for ... Reporting to the police 42 6.4 Crime...
74
Support for victims: Findings from the Crime Survey for England and Wales Laura Freeman Ministry of Justice Ministry of Justice Analytical Series 2013
Transcript of Support for victims: Findings from the Crime Survey for ... Reporting to the police 42 6.4 Crime...
Support for victims: Findings from the Crime Survey for England and Wales
Laura Freeman Ministry of Justice
Ministry of Justice Analytical Series 2013

Analytical Services exists to improve policy making, decision taking and practice by
the Ministry of Justice. It does this by providing robust, timely and relevant data and
advice drawn from research and analysis undertaken by the department’s analysts
and by the wider research community.
Disclaimer
The interpretations of findings and results expressed are those of the author and are not
necessarily shared by the Ministry of Justice (nor do they represent Government policy).
First published 2013
© Crown copyright 2013
You may re-use this information (excluding logos) free of charge in any format or medium,
under the terms of the Open Government Licence. To view this licence, visit
http://www.nationalarchives.gov.uk/doc/open-government-licence/ or email:
Where we have identified any third party copyright material you will need to
obtain permission from the copyright holders concerned.
Any enquiries regarding this publication should be sent to us at
This publication is available for download at http://www.justice.gov.uk/publications/research-
and-analysis/moj
ISBN 978-1-84099-595-4

Acknowledgements
The author would like to thank Anna Upson, Tracey Budd, Rachel Dubourg, Krista Jansson
and Ramona Franklyn in Ministry of Justice Analytical Services for their contributions to this
project.
The author would also like to thank Catriona Mirrlees-Black and the independent peer
reviewer for their valuable comments on an earlier version of the report.
Finally, thanks go to the members of the public who agreed to take part in the survey.

Contents
List of tables
List of figures
1. Summary 1
1.1 Overview 1
1.2 Main findings 2
2. Introduction 8
2.1 Background 8
2.2 The Crime Survey for England and Wales 9
2.3 Report outline 13
3. Public perceptions of support for victims 14
3.1 Introduction 14
3.2 Public perceptions of victim and witness experience of the Criminal Justice
System 15
3.3 Public awareness of Victim Support 16
3.4 Public awareness of the Victims’ Code of Practice 20
4. Do victims of crime want and receive support? 21
4.1 Introduction 21
4.2 Support wanted and received 22
4.3 Reporting to the police 23
4.4 Crime type 24
4.5 Personal, household and incident characteristics 26
5. Types of support, information and advice wanted by victims 34
5.1 Introduction 34
5.2 National data 35
5.3 Reporting to the police 36
5.4 Crime type 37
5.5 Personal, household and incident characteristics 39
6. Types of support, information and advice received by victims 41
6.1 Introduction 41
6.2 National data 41

6.3 Reporting to the police 42
6.4 Crime type 43
6.5 Personal, household and incident characteristics 45
6.6 Support received by victims who wanted support 46
7. Victim contact with Victim Support 48
7.1 Introduction 48
7.2 Contact with Victim Support 49
7.3 Support provided by Victim Support 53
7.4 Victim satisfaction with contact with Victim Support 54
7.5 Opportunity to make a Victim Personal Statement 55
8. Implications for service provision 56
References 60
Appendix A 62
Methodological Annex 62
Appendix B 64
Development of Crime Survey for England and Wales questions on support services
for victims from 2010/11 64

List of tables
Table 1.1 Incidents where the victim wanted support and received support by personal, household and incident characteristics (2007/08 and 2008/09 CSEW, all incidents) 4
Table 3.1: Perceptions of victim and witness experiences by victim status (2007/08 and 2008/09 CSEW, all respondents)1,2,3 15
Table 5.1: Type of information, advice or support victims wanted by crime type (2007/08 and 2008/09 CSEW, reported incidents) 38
Table 6.1: Type of information, advice or support victims received by crime type (2007/08 and 2008/09 CSEW, reported incidents) 44
Table 7.1: Contact with Victim Support (2007/08 and 2008/09 CSEW, all incidents)1 49
Table 7.2: Type of contact with Victim Support: a comparison by crime type (2007/08 and 2008/09 CSEW, all incidents where victim had contact with Victim Support)1,2,3
51
Table 7.3: Whether victim wanted further contact with Victim Support (2007/08 and 2008/09 CSEW, all incidents where the victim only had initial contact with Victim Support)1 52
Table 7.4: Victim satisfaction with contact with Victim Support (2007/08 and 2008/09 CSEW, all incidents where the victim had contact with Victim Support)1 54
Further tables can be found in the accompanying ‘Supplementary Tables’ file.

List of figures
Figure 3.1: Awareness of Victim Support by victim status (2001/02 to 2008/09 CSEW, all respondents) 16
Figure 3.2: Source of information about Victim Support (2007/08 and 2008/09 CSEW, all non-victims who were aware of Victim Support) 18
Figure 3.3: Awareness of Victim Support services by victim status (2007/08 and 2008/09 CSEW, all respondents) 19
Figure 4.1: Incidents where the victim wanted or received information, advice or support (2001/02 to 2008/09 CSEW, all incidents) 23
Figure 4.2: Incidents where the victim wanted or received information, advice or support by crime type (2007/08 and 2008/09 CSEW, all incidents) 25
Figure 5.1: Type of information, advice or support victims wanted (2007/08 and 2008/09 CSEW, all incidents) 35
Figure 5.2: Type of information, advice or support victims wanted by whether the incident was reported (2007/08 and 2008/09 CSEW, all incidents) 36
Figure 6.1: Type of information, advice or support victims received (2007/08 and 2008/09 CSEW, all incidents) 42
Figure 6.2: Type of information, advice or support victims received for reported incidents (2007/08 and 2008/09 CSEW, all incidents) 43
Figure 7.1: Type of support provided by Victim Support (2007/08 and 2008/09 CSEW, all incidents where Victim Support provided support) 53

1. Summary
1.1 Overview Victims are crucial in ensuring the delivery of justice. The Criminal Justice System (CJS)
relies on victims and witnesses to report crime to the police, make statements and, in some
cases, give evidence in court. Ensuring that victims are supported to participate in the CJS is
essential to this end. It is also important that victims are offered the appropriate support they
need to overcome the effects of the crime they experienced. This report looks at public
perceptions of support for victims of crime, the various types of information, advice and
support wanted and received by victims of crime and their contact with the organisation
Victim Support, and it aims to draw out some of the key implications for service delivery in
the victim support sector.
The findings are based on analysis of the Crime Survey for England and Wales (CSEW),1
a nationally representative face-to-face household survey. The main CSEW covers adult
victims2 and the following crime types: vehicle-related thefts, burglary, other household theft,
vandalism, bike theft, theft from the person, assault, wounding and robbery. Some of the
individuals or crime types excluded from the survey (e.g. students, families bereaved by
homicide) may be especially likely to be victims of crime or to have very specific needs
arising from the crime, and therefore the conclusions drawn about support for victims
throughout this report are limited in that respect.
To allow for in-depth analysis, two years of data from the survey were combined and, with
the exception of trend data, the data presented in this report is based on the 2007/08 and
2008/09 CSEW because this is the most recent period that the questions of interest were
included in the survey. In total, 93,123 respondents were surveyed over these two years.
Some analyses are based on questions asked once for each respondent (data is presented
as the percentage of respondents) and some analyses are based on questions asked once
for each incident that the respondent experienced (data is presented as the percentage of
incidents).
1 The British Crime Survey (BCS) is now known as the Crime Survey for England and Wales to better reflect its
geographical coverage. While the survey did previously cover the whole of Great Britain, it ceased to include Scotland in its sample in the 1980s. There is a separate survey – the Scottish Crime and Justice Survey – covering Scotland. The name change took effect from 1 April 2012, when the responsibility for the survey transferred to the Office for National Statistics.
1
1.2 Main findings
Public perceptions of support for victims
There was a high level of awareness of the organisation Victim Support for both victims of
crime and non-victims (84 per cent and 81 per cent respectively). However, this did vary, with
those living in higher-income households, those from a White ethnic background, those aged
25 and over, and those who had a long-standing illness or disability being more likely to be
aware of Victim Support. For non-victims, the most common method of hearing about Victim
Support was through the media, such as newspapers and television (50 per cent), or from a
friend or family member (12 per cent).
There were variations in the public’s perceptions of the way the CJS treats and supports
victims. Overall, people were more likely to agree that the CJS takes into account the views
of victims and witnesses (62 per cent) than to agree that it gives victims and witnesses the
support they need (46 per cent) or that it achieves the correct balance between the rights of
the offender and the rights of the victim (31 per cent).
Support wanted and received by victims of crime
Overall in the 2008/09 CSEW, victims said they wanted some form of support, information or
advice in 19 per cent of incidents and they received some form of support, information or
advice in 9 per cent of incidents. The types of support wanted most often were information
from the police (10 per cent of all incidents), protection from further victimisation (6 per cent
of all incidents) or someone to talk to or moral support (5 per cent of all incidents). The types
of support that were most received were information from the police (3 per cent of all
incidents),3 someone to talk to or moral support (3 per cent of all incidents) and information
about security or crime prevention (2 per cent of all incidents).
Analysis comparing whether victims who said they wanted a specific type of support then
said they received it was undertaken to explore the issue of unmet need. The data showed
that, across the different types of support, a number of victims said they received the support
they wanted. However, the majority of victims (who said they wanted a certain type of
support) then said they didn’t receive it. For example, for those incidents that were reported
to the police where the victims wanted someone to talk to, this was received in 41 per cent of
2 The CSEW data throughout this report is based on 2007/08 and 2008/09. From January 2009, the CSEW
began to interview 10–15 year olds. These are excluded from this report. For further information, see http://www.homeoffice.gov.uk/science-research/research-statistics/crime/crime-statistics/bcs-10-15-year-olds/
2

3
incidents, and in 18 per cent of reported incidents where the victims wanted protection from
further victimisation, they then said they received it. However, the design of the questions
means it is unclear what the consequences of the victim not receiving these types of support
were, for example whether an alternative form of support was provided, and therefore
whether this need remained unmet.
Incidents reported to the police and incidents of burglary and violent crimes were most likely
to lead to both the victim wanting support and receiving it. There was also some variation by
personal, household and incident characteristics. Table 1.1 provides a summary of the
variation in wanting and receiving support by these characteristics; those listed in bold were
strongly independently associated4 with wanting or receiving support. The factors most
strongly associated with wanting and receiving support were predominantly characteristics of
the incident itself and the victim’s perception of and reaction to the incident. In particular,
victims were more likely to want support if they:
were more emotionally affected by the incident
perceived the incident to have been serious.
Victims whose cases progressed to a later stage of the CJS (charge or court) were also more
likely to want and receive support. However, in terms of receiving support, this finding should
be interpreted with caution, as it could be that some victims progress further through the CJS
as a result of receiving support. This analysis also found that, in incidents of personal crime,
victims who perceived that the incident was motivated by an offender’s attitude to their race
were less likely to say they received some form of support, information or advice. Again,
however, it is not possible with this question set to explore further whether there were unmet
needs and, if so, what the consequences were.
3 In 3 per cent of all incidents (including those not reported to the police), the victim received information from
the police. However, when only looking at incidents that were reported to the police, this percentage was slightly higher (8 per cent).
4 Logistic regression analyses were carried out to explore which factors were independently associated with wanting support, taking into account the effect of other factors/variables. See Appendix A for further details.

4
Table 1.1 Incidents where the victim wanted support and received support by personal, household and incident characteristics (2007/08 and 2008/09 CSEW, all incidents)
Wanted Support Received Support Personal crime incidents Household crime incidents Personal crime incidents Household crime incidents
Perceiving the incident to be more serious (strongly associated)
Perceiving the incident to be more serious (strongly associated)
Perceiving the incident to be more serious
Perceiving the incident to be more serious (strongly associated)
Being emotionally affected by the incident (strongly associated)
Being emotionally affected by the incident (strongly associated)
Perceiving the incident to be motivated by the offender's attitude to their age, disability, religion or sexual orientation (strongly associated)
Perceiving the incident to be motivated by the offender's attitude to their age, disability, religion or sexual orientation
Perceiving the incident not to have been motivated by the offender's attitude to their race (strongly associated)
Perceiving the incident to be motivated by the offender's attitude to their race
Reaching a later stage of the CJS (strongly associated)
Reaching a later stage of the CJS (strongly associated)
Reaching a later stage of the CJS (strongly associated)
Reaching a later stage of the CJS (strongly associated)
Being a victim of a series of incidents
Being a victim of a series of incidents (strongly associated)
Being a victim of a violent crime Being a victim of burglary Being a victim of a violent crime Being a victim of burglary (strongly associated)
Living in a household with an income less than £10,000 per year
Living in a household with an income less than £10,000 per year
Living in a household with an income less than £10,000 per year
Being a social renter Being a social renter Being a private renter (strongly associated)
Living in a deprived area Living in a deprived area Being female Being female Being aged 16–24 (strongly associated)
Being from a Black, Mixed or Asian ethnic background
Being separated Having a degree or diploma (strongly associated)
Having no educational qualifications (strongly associated)
1. The table lists characteristics which vary based on bivariate analysis; those characteristics which were strongly independently associated with wanting or receiving support (based on multivariate analysis) are listed in bold text.

Victim contact with Victim Support
Victims of crime covered by the CSEW recalled having contact with Victim Support in 5 per
cent of incidents; of those incidents where the victim had contact, in 57 per cent the victim
did not want any information, advice or support. In incidents where the victims recalled
contact, the types of support most likely to be provided by Victim Support were someone to
talk to or moral support (25 per cent of incidents) and information on security and crime
prevention (12 per cent of incidents). There were a number of incidents where the victims
only had initial contact with Victim Support but said they would have wanted further contact
(12 per cent of incidents). In terms of victim satisfaction with the contact they had with Victim
Support, in 83 per cent of incidents the victim was very or fairly satisfied (41 per cent very
satisfied and 43 per cent fairly satisfied).5
Trend data from the measures
Public awareness of Victim Support remained reasonably stable between the 2001/02 CSEW
and the 2008/09 CSEW, with the exception of an increase in the percentage of victims who
were aware of Victim Support between the 2003/04 and 2004/05 CSEW (77 per cent
compared with 85 per cent).
The percentages of incidents where the victim wanted and received support both decreased
over the period from the 2001/02 CSEW to the 2008/09 CSEW. In terms of those incidents
where the victim wanted support, there was a decrease from 23 per cent of incidents in the
2007/08 CSEW to 19 per cent in the 2008/09 CSEW. The data also shows that over this
period while there was a decrease in the percentage of violent incidents where the victim
wanted support, the percentage of burglary incidents where the victim wanted support
remained stable.6
The proportion of incidents where victims recalled having contact with Victim Support was
also relatively stable over this period (a slight increase from 4 per cent in the 2001/02 CSEW
to 6 per cent in the 2008/09); as was the high level of victim satisfaction with their contact
with Victim Support (77 per cent in 2004/05 and 84 per cent in 2008/09; this difference was
not statistically significant).
5 The percentage of incidents where the victim had contact with Victim Support and was very or fairly satisfied
with that contact was 83 per cent. In order to avoid rounding errors, this percentage has been recalculated for the single category of ‘very or fairly satisfied’ and differs by one percentage point from the sum of the percentages where the victim was ‘very satisfied’ (41 per cent) and ‘fairly satisfied’ (43 per cent).
6 See Table S1 in Supplementary Tables.
5

Policy implications
There are a number of implications that can be drawn from these findings. Although support
was wanted in a relatively low proportion of incidents there may be room to improve support
provision for victims of crime:
The analysis undertaken indicates that there may be a degree of unmet need.
One possible reason for this unmet need may be victims’ needs changing over
time following the crime. This suggests a follow-up mechanism is needed to
ensure any needs that develop over time can be dealt with. This could be through
providing victims with details of how they can self-refer themselves for support,
signposting them to sources of support, or through CJS staff making follow-up
contact to reassess the victim’s needs at a set time point following the
victimisation.
The types of characteristics that are strongly independently associated with
wanting support –namely the victim’s emotional reaction to and perception of the
crime and the stage that the case reached in the CJS – suggests that the victims
who are most likely to want support may be better identified according to these
incident characteristics than by crime type or the victims’ personal characteristics.
Although demographic characteristics were not independently associated with
wanting support (with the exception of age and educational level), there were
statistically significant differences between some of the demographic and crime
type groups. Therefore, as these characteristics may be more easily identifiable
at an initial needs assessment, demographics and crime type could be a useful
proxy identifier of victims that may be more likely to want support.
Once a victim has been identified as needing support, the types of support that
they want are likely to vary. However, information, moral support and protection
were wanted most often. Although, using the CSEW, it is not possible to examine
in detail whether certain victims want certain types of support, the data does
suggest that victims do not all have the same ‘set’ of needs and therefore an
individually tailored approach to support provision may be the most effective.
The findings suggest that Victim Support’s current approach proactively to
contact all victims referred by the police may not be the most effective method,
when resources are limited, to reach victims who want support. .However, if
Victim Support did not contact all victims who reported the crime to the police,
there is a possibility that some of the victims who reported the crime and wanted
support would not be reached. Awareness-raising and outreach work by Victim
Support may be best focused upon certain groups that are less likely to be aware
6

of the organisation and, in some cases, more likely to be victims of crime, such
as those living in lower-earning households, those aged 16–24 and those who
are Black or Asian. Alternatively, there may be more of a role for the police in
discussing a potential referral to Victim Support with the victim to ascertain
whether the victim does feel they would like support and would like to be
contacted by Victim Support.
7
2. Introduction
2.1 Background In ‘Breaking the Cycle’,7 the Government proposed that reforms to the punishment,
rehabilitation and sentencing of offenders should result in a better outcome for victims,
compensating victims for the harm or damage that has been caused to them or their
property. The Government has expressed its commitment to supporting victims of the most
serious crimes, victims who are most vulnerable and those who are persistently targeted,
and is proposing to focus funding for support on these groups, so that those in most need of
help have access to the right services as and when they need them.8
Provision of services for victims of crime is complex. There are a wide range of statutory and
voluntary organisations that have responsibility for providing different types of support to
victims and witnesses of crime, such as emotional and practical support. The Government
provides funding to a number of support services including Victim Support, which is the
largest provider of general support services to victims and witnesses of crime in the UK. In
addition, at the beginning of 2011, the Government announced three-year grant funding for
voluntary sector groups providing more specialist support to victims and witnesses, such as
rape support centres.
Victims play a crucial role in the delivery of justice. The Criminal Justice System (CJS) relies
on victims and witnesses to report crimes to the police, make statements and, in some
cases, give evidence in court. Ensuring that victims are properly supported to participate in
the CJS is essential to this end.
Previous research by Franklyn (2012) using data from the 2009/10 Witness and Victim
Experience Survey (WAVES), which covered victims and prosecution witnesses (aged 18
and over) involved in cases where someone was charged, showed that there was some
variation in the support services provided by the CJS. A high proportion of victims and
witnesses said they had received information leaflets, information about the case, and the
offer of a pre-trial court familiarisation visit. However, fewer victims and witnesses recalled
being offered the opportunity to make a Victim Personal Statement or watch the ‘Going to
Court’ DVD.
7 Breaking the cycle: effective punishment, rehabilitation and sentencing of offenders (2010) Ministry of Justice:
London. 8 Getting it right for victims and witnesses (2012) Ministry of Justice: London.
8

Franklyn (2012) also found that the majority of victims and witnesses whose case resulted in
a charge were satisfied with their overall contact with the CJS (84 per cent), with multivariate
analysis9 suggesting that the strongest factors associated with satisfaction were related to
the services and information provided by the CJS to keep victims and witnesses informed.
WAVES did not, however, cover those victims and witnesses whose cases did not result in a
charge but may still have had contact with, and received support from, the CJS or other
statutory or voluntary agencies that support victims.
Ringham and Salisbury (2004) used data from the 2002/03 Crime Survey for England and
Wales (CSEW) to look at support for a wider group of victims of crime including victims
whose case did not lead to a charge and victims who did not report the incident to the police.
Their analysis found that in 75 per cent of incidents the victim did not want any form of advice
or support. Where the victim did want support (in 25 per cent of incidents) information from
the police and protection from further victimisation were the types of support wanted most.
Overall, victims received information, support or advice in 11 per cent of all incidents and in
20 per cent of incidents that were reported to the police.
This report looks at more recent CSEW data (2007/08 and 2008/09) to update the analysis
undertaken by Ringham and Salisbury. The report examines the various types of information,
advice and support wanted and received by victims of crime in further detail and draws out
the key messages for victim support service delivery and provision. It also examines public
perceptions of support for victims and victims’ contact with Victim Support, and again draws
out key implications in these areas.
2.2 The Crime Survey for England and Wales
Overview
The CSEW is a nationally representative face-to-face household survey that was first
conducted in 1982. In the 2008/09 CSEW, approximately 46,000 adults were interviewed
between April 2008 and March 2009. The response rate for the 2008/09 CSEW was 76 per
cent. The main purpose of the CSEW is to measure the extent and nature of criminal
victimisation against adults, aged 16 or over, living in private households in England and
Wales. It covers victimisation incidents in the 12 months before the interview. However, the
CSEW also includes questions on a range of other areas relating to victimisation, crime and
the Criminal Justice System.
9 Multivariate analyses (or logistic regression analyses) were used to explore the factors that were
independently associated with satisfaction, taking into account the effect of other factors or variables.
9

As a survey of adults living in private households, the CSEW does not cover all offences or
all population groups. The 2007/08 and 2008/09 CSEW covered adult victims (those aged 16
and over)10 and the following crime types: vehicle-related thefts, burglary, vandalism, bike
theft, thefts from the person, assault, wounding and robbery. As a survey that asks people
about their experiences of victimisation, homicides cannot be included. Also, due to the
sensitivity of reporting in the context of a face-to-face interview, the main CSEW
questionnaire does not include rape and other sexual offences.11 The CSEW is a sample
survey and therefore relatively few victims of low volume crimes (such as robbery) are
interviewed, so findings for these rarer crime types should be treated with caution. In terms of
population groups, those living in group residences (e.g. care homes or halls of residence) or
other institutions are not covered.12 Some individuals in the populations excluded from the
survey (for example, students living in halls of residence and homeless people) and victims
of crime types that the survey does not cover (for example, families bereaved by homicide)
may be especially likely to have specific needs arising from victimisation and therefore the
conclusions that can be drawn about the support wanted and received by victims of crime
throughout this report are limited in that respect.
Data used in this report
The following sets of questions are used in this report:
Public perceptions There are a number of questions asked of all CSEW respondents, including those who have
not been a victim of crime. The findings presented in Chapter 3 are from questions on
perceptions and awareness of the support that is offered to victims of crime. These questions
are asked of each respondent and therefore the results reported are based upon the
percentage of respondents. To allow for more in-depth analysis of some of the other
measures included in this report, two years of data from the survey were combined for
analysis purposes. For consistency, the analysis throughout this report (with the exception of
trend data) uses a combined dataset covering the 2007/08 and 2008/09 CSEW.
10 The CSEW data throughout this report is based on 2007/08 and 2008/09 interviews. From January 2009, the
CSEW began to interview 10–15 year olds, but these are excluded from this report. For further information, see http://www.homeoffice.gov.uk/science-research/research-statistics/crime/crime-statistics/bcs-10-15-year-olds/
11 These offences are covered in a separate self-completion module (see Smith et al, 2012). 12 Although excluding the minority of the population that live in such establishments is thought to have little effect
on CSEW estimates (see Pickering et al, 2008).
10

Support wanted and received by victims of crime Chapters 4 to 6 focus on two questions asked of respondents who have been victims of
crime about the support they wanted and received following the victimisation incident. These
questions are asked for each of the incidents that the respondent experienced and therefore
the results are based upon the percentage of incidents (not the percentage of victims).
These questions were only asked about the three ‘most serious’ incidents13 that the
respondent experienced to minimise the amount of time taken to complete the questionnaire
for respondents. For incidents of household crime (for example, burglary), the experiences
and perceptions captured are those of the person interviewed in that household and may not
represent the experience of all the victims in that household.
There are some issues with the design of these two questions that need to be considered
(see Section 4.1 for question wording). Firstly, it is not clear what types of support the
respondents would have considered when answering, for example whether they would have
been thinking about only formal support provided by the Government or CJS agencies or
whether they would have considered informal support provided by friends and family
members. Secondly, respondents may have been answering the question some time after
the incident occurred and therefore the answer may not reflect what the respondent wanted
at the time of the victimisation incident. Finally, there is a question over whether asking about
the support or advice that was wanted following the incident necessarily reflects a need for
support. In particular, this could have been influenced by the provision of a list of types of
information, advice or support as answer options to choose from. Maguire (1991) notes that
the way questions are put can affect the results and the level of ‘unmet need’ found is much
higher when questions are asked using prompts or a ‘list’ of needs.14
Victim contact with Victim Support The data presented in Chapter 7 is based on a set of questions asked of all victims of crime
about the contact they had with Victim Support and their satisfaction with that contact. As
with the questions on the support wanted and received by victims, these questions are asked
once for each of the three most serious incidents that the respondent experienced and
therefore the results reported are based upon the percentage of incidents. Again, for
incidents of household crime, the experiences captured are those of the person interviewed
and may not be representative of all the victims in the household.
13 See the ‘User Guide to Home Office Crime Statistics’ for further details on the definition of the ‘most serious’
incidents: http://www.homeoffice.gov.uk/publications/science-research-statistics/research-statistics/crime-research/user-guide-crime-statistics/
14 See Appendix B for further details on the question set, and the list of the types of information provided to respondents.
11

Statistical significance testing
All analyses were conducted using weighted data; weighting the data makes the findings
more representative of the adult population in England and Wales. Unweighted bases, the
number of respondents who answered each question, are shown in tables. Since the CSEW
estimates are subject to sampling error, differences between estimates from successive
years of the survey or between sample subgroups may occur by chance. Tests of statistical
significance are used to identify which differences are unlikely to have occurred by chance.
In this report, tests at the 5 per cent significance level have been applied (the level at which
there is a 1 in 20 chance of an observed difference being solely due to chance). Any
differences reported in the text are significant at this level. Design factors were used in
statistical tests to account for the fact that the survey design did not use a simple random
sample.
Conventions used in figures and tables
Table abbreviations ‘0’ indicates no response in that particular category or less than 0.5 per cent.
‘n/a’ indicates that the CSEW question was not applicable to that subgroup of respondents or
not asked in that particular year.
‘-' indicates that data is not reported because the unweighted base was less than 100.
Unweighted bases All CSEW percentages presented in the tables are based on data weighted to compensate
for differential non-response and difference in the probability of being selected for interview.15
Tables show the unweighted base which represents the number of people/households
interviewed in the specified group.
Percentages Row or column percentages may not add up to 100 per cent due to rounding. Questions with
multiple response answers will also not add up to 100 per cent.
A percentage may be quoted in the text for a single category that is identifiable in the tables
only by summing two or more component percentages. In order to avoid rounding errors, the
15 See the ‘User Guide to Home Office Crime Statistics’ for further explanation of differential non response:
http://www.homeoffice.gov.uk/publications/science-research-statistics/research-statistics/crime-research/user-guide-crime-statistics/
12
percentage has been recalculated for the single category and therefore may differ by one
percentage point from the sum of the percentages derived from the rounded numbers in the
tables.
‘No answers’ (missing values) All analyses exclude ‘don’t know’ and refusal responses unless otherwise specified.
Further information
The first results from the 2007/08 survey were published in Crime in England and Wales
2007/2008 (Walker et al., eds., 2008) and those from the 2008/09 survey in Crime in England
and Wales 2008/2009 (Walker et al., eds., 2009). For further information about the CSEW
and access to recent publications, refer to http://www.ons.gov.uk/ons/guide-
method/surveys/list-of-surveys/survey.html?survey=Crime+Survey+for+England+and+Wales
2.3 Report outline This report covers the following:
Chapter 3: Public perceptions of support for victims
Chapter 4: Do victims of crime want and receive support?
Chapter 5: Types of support, information and advice wanted by victims
Chapter 6: Types of support, information and advice received by victims
Chapter 7: Victim contact with Victim Support
13

3. Public perceptions of support for victims
Key points
Overall, people were more likely to agree that the Criminal Justice System (CJS)
takes into account the views of victims and witnesses (62 per cent) than to agree that
it achieves the correct balance between the rights of the offender and the rights of the
victim (31 per cent). Figures were similar for victims and non-victims.
Those who had been a victim in the last year were more likely to agree that the CJS
gives victims and witnesses the support that they need (49 per cent) than non-victims
(45 per cent).
Public awareness of Victim Support was high among both victims (84 per cent) and
non-victims (81 per cent), although awareness of specific services offered by Victim
Support was substantially lower.
Non-victims were most likely to have heard about Victim Support from the media (50
per cent) or a friend or relative (12 per cent).
3.1 Introduction The public’s awareness and perceptions of the support available to victims of crime is
important. If the public are aware of the support and services available, they are more likely
to be able to access the services they need if they become a victim of crime. This is
especially true for those types of support that do not require a referral from the police, such
as the services provided by voluntary organisations, including Victim Support or rape support
centres.
From 2001/02, the CSEW included a series of questions on people’s perceptions and
awareness of support for victims and the organisation Victim Support.16,17 These questions
were asked of all respondents, and not only those who had been a victim of crime in the
previous 12 months. This chapter presents data on the responses from these questions over
16 Victim Support is a national charity which offers information, advice and support to victims of crime, such as
someone to talk to in confidence; information on the CJS; compensation and insurance; help in dealing with other organisations and links to other sources of help and support. Support is predominantly provided via trained volunteers.
17 The full question set reported in Section 3.2 was included in the BCS from 2003/04. However, the question on overall awareness of Victim Support was included from the 1998 survey and the question on awareness of Victim Supportline from the 2002/03 survey. However, for consistency all trend data is shown from 2001/02 to 2008/09 throughout this report.
14
time, and it also looks at whether the responses differed if people had been a victim of crime
in the previous 12 months.
3.2 Public perceptions of victim and witness experience of the Criminal Justice System
In their journey through the CJS, victims and witnesses may have contact with a number of
criminal justice agencies, such as the police and the courts, and support providers, including
Victim Support. From 2007/08, the CSEW included a series of questions on the respondents’
perception of victims and witnesses experiences through the CJS. Respondents were asked
whether they agreed or disagreed with the following statements:
The CJS gives victims and witnesses the support they need.
The CJS takes into account the views of victims and witnesses.
The CJS achieves the correct balance between the rights of the offender and the
rights of the victim.
The data from these questions is provided in Table 3.1.
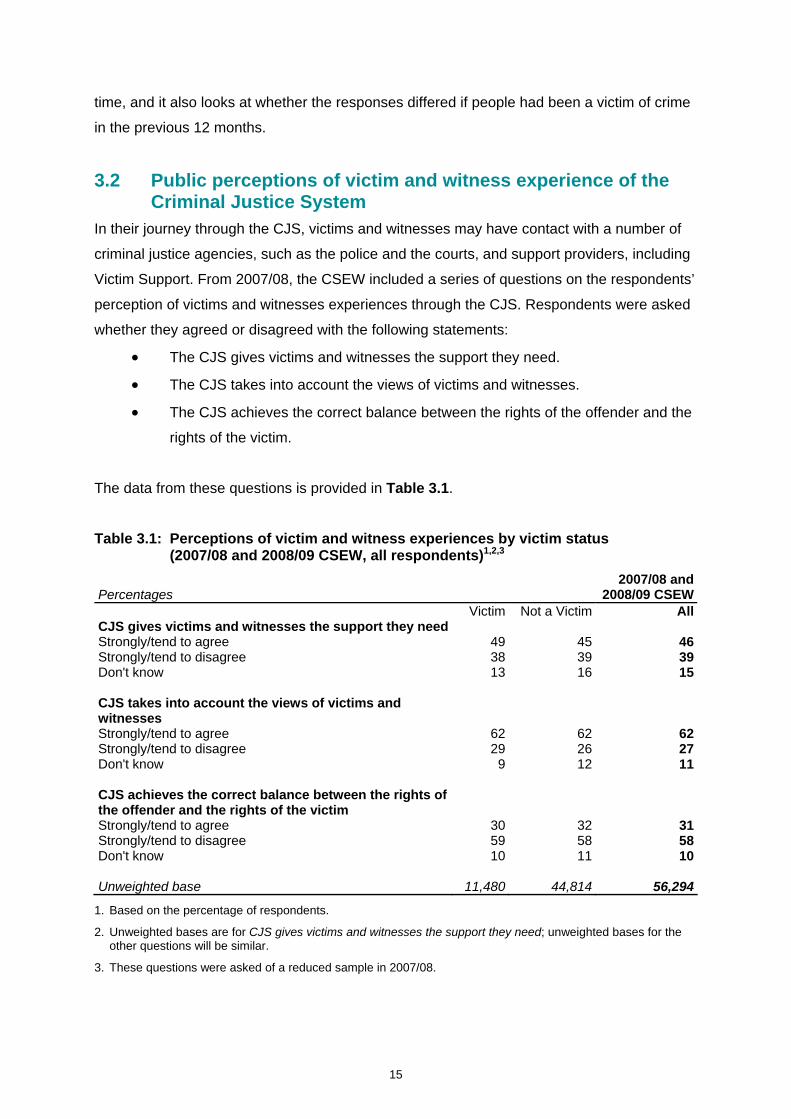
Table 3.1: Perceptions of victim and witness experiences by victim status (2007/08 and 2008/09 CSEW, all respondents)1,2,3
Percentages 2007/08 and
2008/09 CSEW Victim Not a Victim AllCJS gives victims and witnesses the support they need Strongly/tend to agree 49 45 46Strongly/tend to disagree 38 39 39Don't know 13 16 15 CJS takes into account the views of victims and witnesses Strongly/tend to agree 62 62 62Strongly/tend to disagree 29 26 27Don't know 9 12 11 CJS achieves the correct balance between the rights of the offender and the rights of the victim Strongly/tend to agree 30 32 31Strongly/tend to disagree 59 58 58Don't know 10 11 10 Unweighted base 11,480 44,814 56,294
1. Based on the percentage of respondents.
2. Unweighted bases are for CJS gives victims and witnesses the support they need; unweighted bases for the other questions will be similar.
3. These questions were asked of a reduced sample in 2007/08.
15
Both victims and non-victims were more likely to agree that the CJS takes into account the
views of victims and witnesses (62 per cent of all respondents) than to agree that the CJS
gives victims and witnesses the support they need (46 per cent of all respondents) or that the
CJS achieves the correct balance between the rights of the offender and the rights of the
victim (31 per cent of all respondents). However, there were some differences between
victims and non-victims. Victims were more likely to agree that the CJS gives victims and
witnesses the support they need (49 per cent) than non-victims (45 per cent). This difference
could be explained by the fact that victims may have experienced support in the CJS
whereas non-victims were less likely to have done so.
3.3 Public awareness of Victim Support Respondents were asked if they had heard of Victim Support. Figure 3.1 shows the data
from this question from the 2001/02 CSEW to the 2008/09 CSEW.
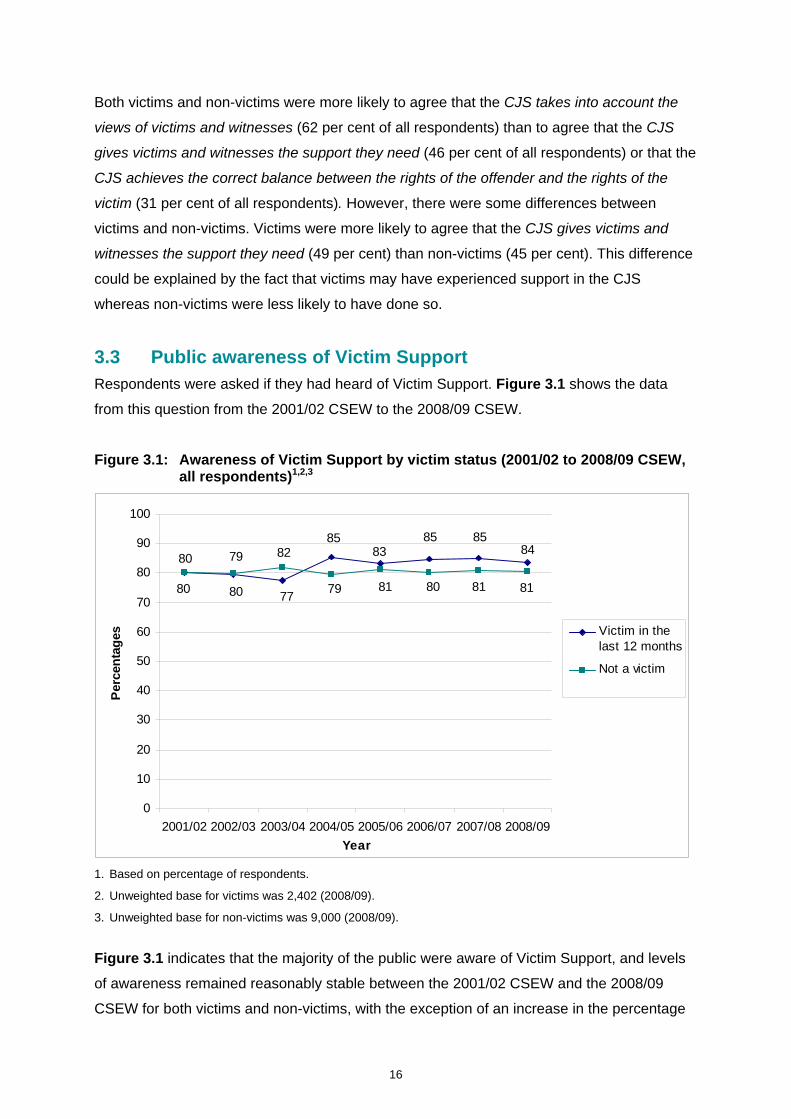
Figure 3.1: Awareness of Victim Support by victim status (2001/02 to 2008/09 CSEW, all respondents)1,2,3
80 79
77
8583
85 8584
80 80
82
79 81 80 81 81
0
10
20
30
40
50
60
70
80
90
100
2001/02 2002/03 2003/04 2004/05 2005/06 2006/07 2007/08 2008/09
Year
Per
cen
tag
es Victim in thelast 12 months
Not a victim
1. Based on percentage of respondents.
2. Unweighted base for victims was 2,402 (2008/09).
3. Unweighted base for non-victims was 9,000 (2008/09).
Figure 3.1 indicates that the majority of the public were aware of Victim Support, and levels
of awareness remained reasonably stable between the 2001/02 CSEW and the 2008/09
CSEW for both victims and non-victims, with the exception of an increase in the percentage
16

of victims who were aware between the 2003/04 CSEW and the 2004/05 CSEW (from 77 per
cent to 85 per cent). In the 2008/09 CSEW, victims of crime were more likely to have heard
of Victim Support than those who had not been a victim (84 per cent and 81 per cent
respectively). However, in the 2003/04 CSEW, non-victims were more likely to be aware of
Victim Support (82 per cent) than victims (77 per cent).
Ringham and Salisbury’s (2004) analysis of the 2002/03 CSEW showed that levels of
awareness of Victim Support varied by personal and household characteristics. For example,
those living in higher-earning households were more likely to be aware, as were those in the
30–59 age group and those from a White ethnic background. Similar findings emerge from
the 2007/08 and 2008/09 analysis, with those living in higher-income households and those
from a White ethnic background were also more likely to be aware of Victim Support. In
terms of age, those aged 16–24 were least likely to be aware of Victim Support (65 per cent
of victims and 54 per cent of non-victims) while those aged 45–64 were most likely (94 per
cent of victims and 91 per cent of non-victims).18,19 There was also variation depending on
the respondent’s disability status, with those who did not have a long-standing illness or
disability being less likely to be aware of Victim Support (83 per cent of victims and 80 per
cent of non-victims) than those who did have a long-standing illness or disability (89 per cent
of victims and 83 per cent of non-victims).
Respondents who had not been a victim of crime and had heard of Victim Support were
asked how they heard about the organisation. Non-victims were most likely to have heard
about Victim Support from newspapers, television or other media (50 per cent) (see
Figure 3.2).
18 With the exception that there was not a statistically significant difference between those who were victims
aged 45–64 who were aware of Victim Support (94 per cent) and those who were victims aged 65–74 (90 per cent).
19 See Tables S2 and S3 in Supplementary Tables.
17

Figure 3.2: Source of information about Victim Support (2007/08 and 2008/09 CSEW, all non-victims who were aware of Victim Support)1,2,3
50
12 10 10 8 63 2 1
0
10
20
30
40
50
60N
ewsp
aper
s/T
V/O
ther
med
ia
Frie
nd/F
amily
mem
ber
Pol
ice
Wor
d of
mou
th
Thr
ough
pre
viou
sco
ntac
t with
Vic
timS
uppo
rt
Thr
ough
wor
k/jo
b
Vic
tim S
uppo
rtad
vert
isin
g
Oth
er
Oth
er a
genc
y
Per
cen
tag
es
1. Based on percentage of respondents.
2. Respondents could select as many answer options as were applicable to them so percentages do not sum.
3. Unweighted base was 14,641 (combined 2007/08 and 2008/09 CSEW).
The CSEW did not ask those who had been a victim of crime and had heard of Victim
Support how they had heard of it, but the higher proportion of victims who had heard of
Victim Support, compared with those who had not been a victim, may be explained by the
victims’ increased likelihood of having direct contact with Victim Support or because Victim
Support had been mentioned to them by the police or their friends or family.
Victim Support provides a number of support services for victims and witnesses. One service
is the Victim Supportline, a national telephone helpline staffed by volunteers who provide
emotional support and information over the phone, and put victims in touch with local Victim
Support offices and other support organisations. Another service offered is the Witness
Service which supports witnesses who attend court through the justice process by using
trained volunteers and staff to provide practical and emotional support at court. The CSEW
included questions on public awareness of these two services (see Figure 3.3).
18

Figure 3.3: Awareness of Victim Support services by victim status (2007/08 and 2008/09 CSEW, all respondents)1,2,3
84
50
41
81
4236
0
10
20
30
40
50
60
70
80
90
100
Heard of VictimSupport
Heard of VictimSupportline
Heard about theWitness Service
Per
cen
tag
e o
f re
spo
nd
ents
wh
o h
ad h
eard
of
serv
ice
Victim in the last 12months
Not a Victim
1. Based on the percentage of respondents.
2. Overall awareness of Victim Support unweighted base for victims was 2,439 and for non-victims was 9,196.
3. The questions on Victim Supportline and Witness Service were asked in two separate sub-modules of the survey. Unweighted base for awareness of Victim Supportline question was 2,439 for victims and 9,196 for non-victims. The unweighted base for awareness of Witness Service question will be similar.
As with awareness of Victim Support as an organisation overall, those who had been a victim
of crime in the last 12 months were more likely to have heard of both these services than
non-victims. For example, 50 per cent of victims had heard of the Victim Supportline, in
comparison with 42 per cent of non-victims. More respondents (both victims and non-victims)
had heard of Victim Supportline than the Witness Service. This may be explained by the fact
that these services are targeted at different groups: the Victim Supportline aims to provide
support to all victims of crime regardless of whether they have reported the crime to the
police, whereas the Witness Service only provides support to witnesses who attend court.
Compared with awareness of Victim Support as an organisation overall, awareness of these
two specific services was lower. This was the case for both those who had been a victim of
crime and those who had not.20
20 See Table S4 in Supplementary Tables.
19

3.4 Public awareness of the Victims’ Code of Practice The Code of Practice for Victims of Crime – also known as the Victims’ Code – is a statutory
code introduced in 2006.21 It sets out the minimum standards of services which criminal
justice agencies are obliged to provide for victims of crime in England and Wales. The
Victims’ Code includes requirements relating to keeping victims and witnesses informed of
the progress in their case and information about the CJS process. The CSEW asked
respondents (both victims and non-victims) whether they had heard of the Code of Practice
for Victims: 19 per cent of victims had heard of the Code in comparison with 15 per cent of
non-victims.22
21 In July 2012, the Government announced that it will undertake a review of the Victims’ Code to consider how it
can be improved. 22 See Table S5 in Supplementary Tables.
20

4. Do victims of crime want and receive support?
Key points
Overall, almost a fifth of incidents resulted in the victim wanting support (19 per cent
of incidents in the 2008/09 CSEW); the proportion of incidents where the victim
reported receiving support was lower (9 per cent of incidents).
In incidents reported to the police, the victim was more likely to want and receive
support (39 per cent and 19 per cent of incidents respectively) than in those incidents
not reported to the police (10 per cent and 3 per cent of incidents respectively).
There was variation in levels of support wanted and received by crime type. Victims
were more likely to want support and receive support in incidents of burglary and
violent crime.
Characteristics of the incident, such as whether the case proceeded to charge or court
and the victim’s reaction to and perception of the incident, were strongly associated
with both wanting and receiving support. With the exception of age, educational level
and housing tenure, victim demographics were not strongly associated with wanting or
receiving support.
4.1 Introduction The Government has said it is committed to supporting victims of the most serious crimes,
those who are the most vulnerable and those who are persistently targeted.23 Providing the
appropriate support to these victims of crime is important to ensure they deal with the effects
of the crime and participate in the Criminal Justice System.
As discussed in Chapter 2, Ringham and Salisbury (2004) found in their analysis of the
2002/03 CSEW that, in the majority of all incidents, the victims did not want any form of
advice or support, and in the majority of all incidents they did not receive any information,
advice or support. This chapter looks at more recent data from these two questions in the
CSEW on support that victims wanted and received following their experience of crime.24
For each incident experienced, victims were asked what types of information, advice or
23 Getting it right for victims and witnesses (2012), Ministry of Justice: London. 24 These questions were only asked about the three ‘most serious’ incidents that the respondent experienced to
minimise the amount of time taken to complete the questionnaire for respondents.
21

support they wanted following the incident.25 They could choose from the following response
options listed in this order:
None of these/did not want any support
Information from the police
Information about security/crime prevention
Practical help
Someone to talk to/moral support
Help with insurance/compensation claim
Protection from further victimisation/harassment
Help in reporting the incident/dealing with the police
Other.
All victims were then asked what types of information, advice or support they actually
received following the incident and could choose from the same list of response options.
This chapter also looks at the variation in the proportion of victims that wanted and received
support by type of crime and by personal, household and incident characteristics.
4.2 Support wanted and received Figure 4.1 provides an overview of the data from the 2001/02 CSEW to the 2008/09 CSEW,
showing the proportion of incidents where the victim wanted and received support.
25 For household crimes, it is the views of the person interviewed that are captured; the support they wanted and
received may be different from other people in the household.
22

Figure 4.1: Incidents where the victim wanted or received information, advice or support (2001/02 to 2008/09 CSEW, all incidents) 1,2
19
9
2825
24
22 22
23
23
1311
109 8 9 9
0
5
10
15
20
25
30
35
40
20
01
/02
20
02
/03
20
03
/04
20
04
/05
20
05
/06
20
06
/07
20
07
/08
20
08
/09
Year
Pe
rce
nta
ge
of
inc
ide
nts
Wanted support
Received support
1. Based on the percentage of incidents, not victims.
2. Unweighted base for wanted support was 12,671 (2008/09); unweighted base for received support will be similar.
The percentage of incidents where the victim wanted support was consistently higher than
the percentage of incidents where they received support over the 2001/02 to 2008/09 CSEW
period. However, the percentage of incidents where the victim wanted support decreased
over this period from 28 per cent in the 2001/02 CSEW to 19 per cent in the 2008/09 CSEW.
Over the 2001/02 to 2008/09 CSEW period, the percentage of incidents where the victim
received support also decreased from 13 per cent to 9 per cent.
4.3 Reporting to the police Overall, 39 per cent of all incidents were reported to the police26,27,28 and the most common
reasons given by victims for reporting was that all crimes should be reported or that it was
the right thing to do (46 per cent of reported incidents) or because the victim hoped that the
offenders would be caught or punished (32 per cent of reported incidents).29 The proportion
of incidents where the victim wanted and received support varied by whether the incident
26 Incidents reported to the police also include a small number of incidents where the police were present when
the incident occurred or where the police found out by another means. This definition applies throughout the report.
27 Based on analysis of the 2007/08 and 2008/09 BCS, see Section 2.2 of Chapter 2 for further information. 28 See Table S6 in Supplementary Tables. 29 See Table S7 in Supplementary Tables.
23

was reported to the police. Victims were more likely to want some form of support in
incidents reported to the police (39 per cent compared with 10 per cent of incidents not
reported to the police).30 Some form of information, advice or support was received in 19 per
cent of incidents reported to the police compared with 3 per cent of incidents not reported.31
The difference between the support received by victims in incidents that were reported
compared with incidents where the victims did not report them is likely to be due to the fact
that referral to formal support services from the police and other criminal justice agencies can
only be offered to victims they are aware of (i.e. who have reported the incident).
4.4 Crime type There was some variation in the proportions of incidents in which the victim wanted or
received support by crime type (see Figure 4.2).
30 See Table S8 in Supplementary Tables. 31 See Table S8 in Supplementary Tables.
24
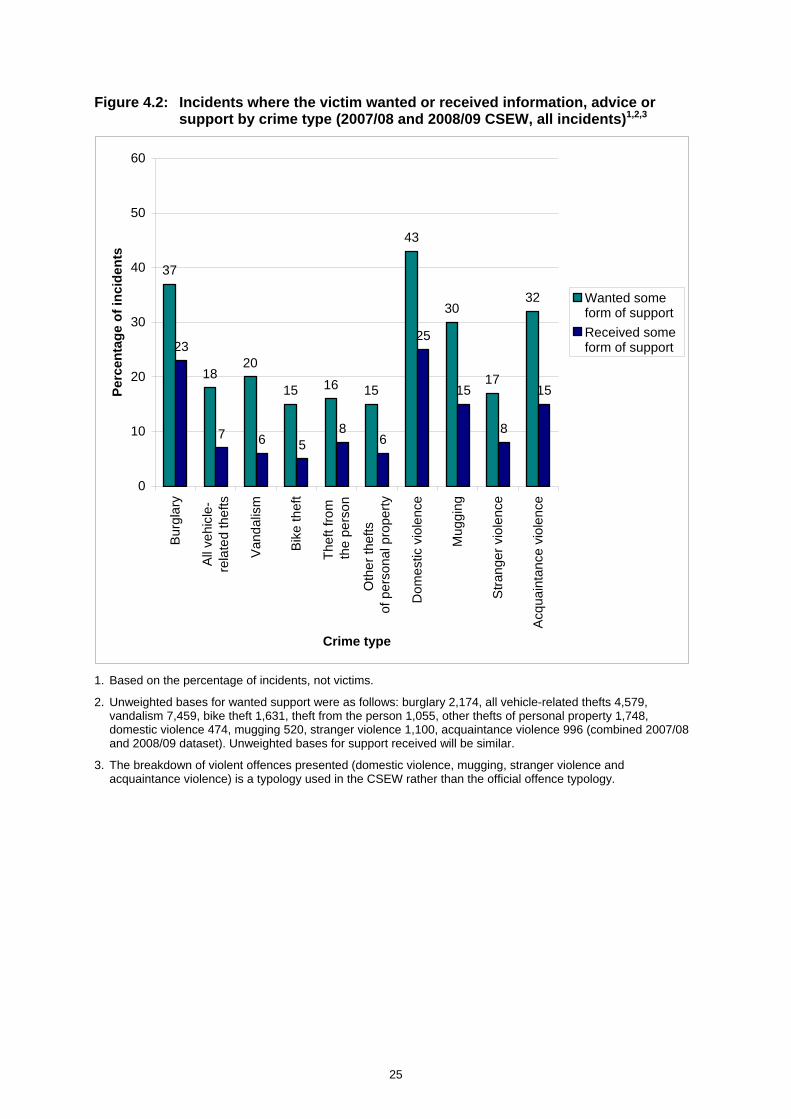
Figure 4.2: Incidents where the victim wanted or received information, advice or support by crime type (2007/08 and 2008/09 CSEW, all incidents)1,2,3
37
1820
15 16 15
43
30
17
32
23
7 6 58
6
25
15
8
15
0
10
20
30
40
50
60B
urgl
ary
All
vehi
cle-
rela
ted
the
fts
Van
dal
ism
Bik
e th
eft
Th
eft f
rom
th
e pe
rso
n
Oth
er
thef
ts
of p
ers
ona
l pro
pert
y
Do
me
stic
vio
len
ce
Mug
ging
Str
ange
r vi
ole
nce
Acq
uain
tan
ce v
iole
nce
Crime type
Per
cen
tag
e o
f in
cid
ents
Wanted some form of support
Received some form of support
1. Based on the percentage of incidents, not victims.
2. Unweighted bases for wanted support were as follows: burglary 2,174, all vehicle-related thefts 4,579, vandalism 7,459, bike theft 1,631, theft from the person 1,055, other thefts of personal property 1,748, domestic violence 474, mugging 520, stranger violence 1,100, acquaintance violence 996 (combined 2007/08 and 2008/09 dataset). Unweighted bases for support received will be similar.
3. The breakdown of violent offences presented (domestic violence, mugging, stranger violence and acquaintance violence) is a typology used in the CSEW rather than the official offence typology.
25

In incidents of domestic violence, burglary, acquaintance violence and mugging, the victim
was more likely to want support than in incidents of other crime types.32 This may be
because, in incidents of some of these crime types, the victim was more likely to report being
‘very much’ affected by the incident (in 46 per cent and 28 per cent of domestic violence and
burglary incidents respectively) than in incidents of other crime types33 and therefore the
victim may be more likely to ask for support or to take up support if it is offered. The victim
was also more likely to receive support in incidents of burglary and domestic violence than in
incidents of other crime types.34,35 The crime types presented in Figure 4.2 include
attempted incidents. When attempted incidents were excluded,36 the percentage of burglary
incidents where the victim wanted support was slightly higher (in 43 per cent of incidents).
However, for incidents of other crime types, the percentages were broadl
y similar.
4.5 Personal, household and incident characteristics Support wanted As well as the variation by type of crime, the proportion of incidents in which the victim
wanted some form of information, advice or support also varied by personal, household and
incident characteristics.37,38,39
Incidents involving victims of personal and household crime who perceived the
incident to be very serious were associated with the victim wanting support (48
per cent and 47 per cent of incidents respectively) than incidents involving victims
who perceived the incident not to be serious (14 per cent of personal crime
incidents and 13 per cent of household crime incidents respectively).
Personal crime incidents involving victims ‘very much’ affected by the incident
were associated with the victim wanting some form of support or information in 46
per cent of incidents, in comparison with 12 per cent of incidents where the victim
was ‘a little’ affected by the incident.
32 See Table S10 in Supplementary Tables. 33 See Table S11 in Supplementary Tables. 34 See Table S10 in Supplementary Tables. 35 The differences between incidents of mugging and acquaintance violence where the victim received support
(both 15 per cent of incidents) and incidents of other crime types were not statistically significant. 36 See Table S12 in Supplementary Tables. 37 Personal characteristics refer to the demographic characteristics of the respondent (for example their age,
gender or marital status). Household characteristics include the household income and geographic area-level characteristics such as whether the area is urban or rural. Incident characteristics refer to the respondent’s experiences of the victimisation, for example whether they were injured as a result of the incident and whether they were emotionally affected.
38 See Tables S13 to S17 in Supplementary Tables. 39 It is only appropriate to look at personal characteristic comparisons for personal crime as these are only
representative of the survey respondent and not the whole household.
26
For both personal and household crime incidents where the victim perceived that
the crime was motivated by the offender’s attitude to their age, disability, religion
or sexual orientation, the victim was more likely to want support (43 per cent and
44 per cent of incidents respectively) than in incidents where the victim did not
perceive the crime to be motivated by these factors (21 per cent of personal
crime incidents and 19 per cent of household crime incidents).
Personal crime incidents that the police did not come to know about were less
likely to lead to the victim wanting support (12 per cent of incidents) than
incidents which reached later stages of the CJS, such as those that were
reported but an offender was not identified (35 per cent of incidents) or where the
offender went to court (42 per cent of incidents).
Household incidents where the police did not come to know about the matter or
where the police knew about the matter but did not identify an offender were less
likely to lead to the victim wanting support (8 per cent of incidents and 34 per
cent of incidents respectively) than household crime incidents which reached
later stages of the CJS (for example, in 55 per cent of incidents where the police
identified an offender but did not charge or caution them or in 52 per cent of
incidents where the offender was charged or cautioned but did not go to court).
In both personal and household incidents that were part of a series of crimes, the
victim was more likely to want support (28 per cent and 24 per cent of incidents
respectively) than in single incidents (21 per cent of personal crime incidents and
17 per cent of household crime incidents).
Incidents of both personal and household crime involving victims living in a
household with an income of £30,000 or more were less likely to lead to the
victim wanting support (18 per cent and 17 per cent of incidents respectively)
than incidents involving victims living in households with an income of less than
£10,000 per year (32 per cent and 26 per cent of incidents respectively).
Incidents of both personal and household crime involving victims who were social
renters were more likely to lead to the victim wanting some form of support or
advice (32 per cent and 25 per cent of incidents respectively) than incidents
involving victims who were homeowners (20 per cent and 18 per cent of incidents
respectively) or who were private renters (22 per cent of incidents and 21 per
cent of incidents respectively).
27

Personal and household crime incidents involving victims who lived in the most
deprived areas40 were more likely to lead to the victim wanting support (28 per
cent of incidents and 25 per cent of incidents respectively) than incidents
involving victims who lived in the least deprived areas41 (16 per cent of incidents
and 19 per cent of incidents respectively).
Personal crime incidents involving female victims were more likely to lead to the
victim wanting support (in 28 per cent of incidents) than incidents involving male
victims (in 19 per cent of incidents).
Incidents of personal crime involving White victims were less likely to lead to the
victim wanting support (21 per cent of personal crime incidents) than incidents of
personal crime involving Black or Asian victims (38 per cent of incidents and 34
per cent of incidents respectively).
Personal crime incidents involving victims who were separated were more likely
to lead to the victim wanting some form of support (42 per cent of personal crime
incidents) than incidents involving victims who had another marital status (for
example, in 21 per cent of incidents where the victim was married).
In personal crime incidents involving victims who had no educational
qualifications, the victim was more likely to want support (27 per cent of personal
crime incidents) than in incidents where the victim had an apprenticeship or A/AS
level qualification or a degree or diploma (21 per cent of personal crime
incidents).
The analyses above show that wanting support varies depending on various characteristics
such as whether the incident was a personal or household crime, the age of the victim, and
the impact the incident had on the victim. However, these characteristics may not be the key
factors associated with wanting support, as different victims may have different experiences,
and some characteristics can co-vary. For example, the emotional impact of the incident
upon the victim and the victim’s perception of the severity of the incident are likely to be
related, and these in turn could be related to the victim’s household income as the costs of
dealing with the impact of the incident (for example, replacing stolen items) may be harder to
meet for victims living in low-income households.
40 Those living in the most deprived Lower Super Output Areas (LSOAs). See the following link for further
information on LSOAs: http://www.idea.gov.uk/idk/core/page.do?pageId=7175806 41 Those living in the least deprived LSOAs.
28

Logistic regression analyses were carried out to explore which factors were independently
associated with wanting support. It should be noted that these analyses explore associations
between different factors and characteristics, but they do not necessarily imply causal
relationships between them.
Separate analyses were carried out for personal crime and household crime because it was
not appropriate to include personal characteristics in the household crime analysis.42 There
may be further factors associated with wanting support that are not included in these
analyses or in the CSEW questionnaire. For more information on the logistic regression
analysis, see Appendix A.
The findings of the logistic regression indicated that the factors that were strongly
independently associated with wanting support for personal crime were:
Emotional impact of the incident: being emotionally affected by the incident.
Perceived seriousness of the incident: perceiving the incident to be very serious.
Perceived motivation for the incident: perceiving that the incident was motivated
by the perpetrator’s attitude to their religion, sexual orientation, age or disability.
Age: incidents involving victims aged 16–24 had higher odds of the victim
wanting support than incidents involving older victims.
Progress through the Criminal Justice System: incidents where the offender was
charged or cautioned or where the offender went to court had higher odds of
involving victims who wanted support than incidents where an offender was not
identified.
Educational level: incidents involving victims who had a degree or diploma had
higher odds of the victim wanting support than incidents where the victim had
O-Levels or A-Levels but not incidents where the victim had no qualifications.
The factors that were strongly independently associated, when other factors were taken into
account, with wanting support for household crime were:
Perceived seriousness of the incident: perceiving the incident to be very serious.
Progress through the Criminal Justice System: incidents where an offender was
identified but not charged or cautioned or incidents where the offender was
charged or cautioned or incidents where the offender went to court had higher
42
The household crime logistic regression model did not include any personal characteristics as these are only representative of the survey respondent and not the whole household.
29

odds of involving victims who wanted support than incidents where an offender
was not identified.
Incident type: being a victim of a series of incidents.
For both personal and household crime other variables were also associated with wanting
support to a lesser extent.43 Crime type was included in the analyses and was found to be
associated with wanting support (although not strongly associated) in incidents of household
crime. However, it was not found to be independently associated with wanting support in
incidents of personal crime.
Apart from age and educational level, none of the demographic characteristics were strongly
associated with wanting support, indicating that the characteristics of the incident, such as
whether it was part of a series and whether the case proceeded to charge or court and the
victim’s reaction to and perception of the incident, were more important in explaining whether
the victim wanted support.
Support received The proportion of incidents in which the victim received some form of information, advice or
support also varied by personal, household and incident characteristics.44,45
For both personal and household crime incidents involving victims who perceived
the incident to be very serious, the victim was more likely to have received
support or information (21 per cent of incidents for both) than for incidents
involving victims who perceived the incident not to be serious (8 per cent of
personal crime incidents and 5 per cent of household crime incidents).
Incidents of personal crime involving victims who were ‘very much’ affected by
the incident were more likely to lead to the victim receiving support (22 per cent
of incidents) than incidents involving victims who were ‘a little’ affected (6 per
cent of incidents).
In incidents of household crime where the victim perceived the crime to be
motivated by the offender’s attitude to their race, the victim was more likely to
have received support (17 per cent of household crime incidents) than in
incidents where the victim did not perceive the crime to be motivated by the
offender’s attitude (8 per cent of household crime incidents).
43 See Tables S18 and S19 in Supplementary Tables. 44 See Tables S20 to S24 in Supplementary Tables. 45 It is only appropriate to look at personal characteristic comparisons for personal crime as these are only
representative of the survey respondent and not the whole household.
30

Incidents of both personal and household crime that the police did not come to
know about were less likely to involve victims that received support (4 per cent
and 2 per cent of incidents respectively) than incidents that reached later stages
of the CJS, such as incidents that the police came to know about but did not
identify an offender (16 per cent and 13 per cent of incidents respectively) or
incidents where the offender went to court (42 per cent and 44 per cent of
incidents respectively).
In 16 per cent of incidents of personal crime where the victim lived in a household
with an income of less than £10,000 per year, the victim received some form of
support, in comparison with 9 per cent of incidents where the victim lived in a
household with an income of £30,000 or more per year.
Incidents involving victims of personal crime who were social renters were more
likely to lead to the victim receiving support (14 per cent of incidents) than
incidents involving victims who were homeowners (9 per cent of incidents).
Personal crime incidents where the victim was a woman were more likely to lead
to the victim receiving some form of support (14 per cent of incidents) than
personal crime incidents involving men (8 per cent of incidents).
In personal crime incidents where the victim had an apprenticeship or A/AS level
qualification, the victim was less likely to have received support (7 per cent) than
in personal crime incidents where the victim had no qualifications (12 per cent) or
where the victim had a degree or diploma (11 per cent).
As with wanting support, the characteristics presented above may not be the key factors
associated with receiving support, as different victims may have different experiences and
some characteristics can co-vary. Logistic regression analyses were carried out to explore
which factors were independently associated with receiving support. Although these
analyses explore associations between different factors and characteristics, they do not
necessarily imply causal relationships between them.46
46 For information on the logistic regression analysis, see Appendix A.
31

Again, the results presented are for all incidents and are split into personal crime and
household crime.47 The findings indicated that the factors that were strongly independently
associated, when other factors were taken into account, with receiving support for personal
crime were:
Progress through the Criminal Justice System: incidents that led to a charge or
caution or the perpetrator going to court involved victims who had higher odds of
receiving support than incidents where an offender was identified. This finding
should be treated with caution as it could be that some victims progress further
through the CJS as a result of receiving support, rather than progress through the
CJS leading to a victim receiving support.
Emotional impact of the incident: being emotionally affected by the incident.
Housing tenure: incidents where the victim was a private renter had higher odds
of receiving support than incidents where the victim was a homeowner.
Educational level: incidents involving victims who had a degree or diploma had
higher odds of the victim receiving support than incidents where the victim had
lower or no qualifications.
Perceived motivation for the incident: perceiving that the incident was not
motivated by the perpetrator’s attitude to their race or not knowing whether the
incident was motivated by this attitude.
The factors that were strongly independently associated, when other factors were taken into
account, with receiving support for household crime were:
Progress through the Criminal Justice System: incidents that led to a caution or
charge or the perpetrator going to court involved victims who had higher odds of
receiving support than incidents that did not result in the police identifying an
offender. Again, this finding should be treated with caution due to the possibility
that progress through the CJS occurred as a result of the victim receiving
support.
Crime type: incidents of burglary involved victims who had higher odds of
receiving support than victims of bike theft.
Perceived seriousness of the incident: perceiving the incident to be very serious.
47 Two separate logistic regressions were run, one for personal crime and one for household crime. The
household crime logistic regression model did not include any person-level characteristics as these are only representative of the survey respondent and not the whole household.
32

For both personal and household crime, other variables were also associated with receiving
support to a lesser extent.48,49 Again, although crime type was included in the analysis for
personal crime incidents, it was not found to be independently associated with receiving
support.
These analyses show that the factors strongly associated with receiving support are similar
to those associated with wanting support. The characteristics of the incident, for example
whether the case proceeded to charge or court and the victim’s reaction to and perception of
the incident, such as the victim having a more serious emotional reaction to the incident and
perceiving the incident to be more serious, were again more important than demographic
characteristics.
48 See Tables S25 and S26 in Supplementary Tables. 49 There may also be further factors that are associated with wanting support that were not included in these
analyses or the BCS questionnaire.
33

5. Types of support, information and advice wanted by victims
Key points
Overall, the types of support, information or advice wanted most often were
information from the police (in 10 per cent of incidents), protection from further
victimisation (in 6 per cent of incidents), or moral support or someone to talk to
(in 5 per cent of incidents).
All types of support were more likely to be wanted in relation to those incidents
reported to the police than unreported incidents.
There were variations in the types of support wanted by crime type. For example,
reported incidents of burglary were more likely to lead to the victim wanting
information from the police, and reported incidents of domestic violence were more
likely to lead to the victim wanting moral support or someone to talk to.
5.1 Introduction The type of support that victims want following a crime can range from information from the
police, for example on the progress of the case, through to some type of emotional support,
such as counselling, or practical support, such as help changing locks. ten Boom and
Kuijpers (2012) found, in a systematic review of empirical studies into the needs of victims of
crime, that these needs could be categorised into the following broad clusters: emotional
needs, needs concerning the criminal proceedings, information needs, practical needs,
financial needs and primary needs (for example, safety and prevention of revictimisation).
The CSEW question on the support that victims (of a variety of crime types) wanted following
the incident gave a number of possible answer options covering this range (see Section 4.1
of Chapter 4).
This chapter looks at the different types of support, advice or information that victims of crime
wanted and examines how this varied by whether the incident was reported to the police and
by the type of crime experienced.
34

5.2 National data Figure 5.1 shows the type of information, advice or support wanted by victims of crime for
the combined 2007/08 and 2008/09 CSEW data.50
Figure 5.1: Type of information, advice or support victims wanted (2007/08 and 2008/09 CSEW, all incidents)1,2,3
10
65
2 21
24
02468
101214161820
Info
rma
tion
fr
om
th
e
po
lice
Pro
tect
ion
fro
m
furt
he
r vi
ctim
isa
tion
So
me
on
e
to t
alk
to
/mo
ral s
up
po
rt
Ad
vice
on
se
curi
ty
Pra
ctic
al
he
lp
He
lp in
re
po
rtin
g
Oth
er
He
lp w
ith in
sura
nce
/co
mp
en
satio
n
Type of support wanted
Pe
rce
nta
ge
of
inc
ide
nts
1. Based on the percentage of incidents, not victims.
2. Respondents could select as many answer options as were applicable to them so percentages do not sum.
3. Unweighted base was 25,275.
Overall, information from the police, protection from further victimisation and someone to talk
to or moral support were the types of advice or support that were wanted most often.
However, the percentages of incidents where these were wanted were low. This was also
found in Ringham and Salisbury’s (2004) analysis of the 2002/03 CSEW which showed that
the same three forms of support were most popular, and in the ten Boom and Kuijpers (2012)
systematic review which found that the need for someone to talk to is often one of the most
mentioned needs by both victims of violent crimes and victims of property crimes. The ten
Boom and Kuijpers systematic review also sought to examine needs over time according to
the victims themselves. They found that some needs exist immediately after the offence and
some arise during the criminal justice process, although from the studies reviewed it was not
clear how and when needs may change.
50 See Section 2.2 of Chapter 2 for further information.
35

5.3 Reporting to the police The proportion of incidents where the victim wanted the various types of information,
advice or support varied depending on whether the incident was reported to the police or not
(see Figure 5.2).
Figure 5.2: Type of information, advice or support victims wanted by whether the incident was reported (2007/08 and 2008/09 CSEW, all incidents)1,2,3,4
1 1 1 1 1
23
3
8
3 3
12
7
22 3 3
0
5
10
15
20
25
30
Info
rmat
ion
from
the
po
lice
Adv
ice
on
secu
rity
Pra
ctic
al
help
Som
eone
to
tal
k to
Hel
p w
ith in
sura
nce/
com
pens
atio
n
Pro
tect
ion
from
fu
rthe
r vi
ctim
isat
ion
Hel
p in
re
port
ing
Oth
er
Type of support wanted
Per
cen
tag
e o
f in
cid
ents
Reported
Not reported
1. Based on the percentage of incidents, not victims.
2. Respondents could select as many answer options as were applicable to them, so percentages do not sum.
3. Unweighted base for reported incidents was 10,264.
4. Unweighted base for non-reported incidents was 14,892.
Incidents that were reported to the police were more likely to lead to the victim wanting some
form of information, advice or support. For example, in reported incidents the victim wanted
information from the police in 23 per cent of incidents compared with 1 per cent of
non-reported incidents, and in 12 per cent of reported incidents the victim wanted protection
from further victimisation compared with 3 per cent of non-reported incidents. In 37 per cent
of reported incidents, the victim felt very or fairly well informed by the police on the progress
of the case. However, in 34 per cent of reported incidents, the victim did not feel well
informed (in the remaining 29 per cent of incidents, the victim said it was not necessary to be
kept informed).51
51 See Table S9 in Supplementary Tables.
36

37
5.4 Crime type The proportion of incidents where the victim wanted the various types of support or
information also varied depending on the type of crime (see Table 5.1).

38
Table 5.1: Type of information, advice or support victims wanted by crime type (2007/08 and 2008/09 CSEW, reported incidents)
Percentage of reported incidents 2007/08 and
2008/09 CSEW
Information from the
policeAdvice on
securityPractical
helpSomeone to talk to
Help with insurance/
compensation
Protection from further
victimisationHelp in
reporting Other Unweighted
base Burglary 30 16 7 14 3 14 4 2 1,479 All vehicle-related thefts 22 6 2 2 4 4 2 2 2,258 Vandalism 23 6 3 5 2 16 3 3 2,517 Bike theft 22 7 3 2 2 2 1 1 663 Theft from the person 20 5 2 6 2 2 2 1 409 Other thefts of personal property
ence19 5 2 2 3 3 3 2 579
All viol 21 6 3 15 2 21 6 3
stic 11 7 6 35 0 31 7 4
3 8 2 12 1 35 8 4
1,343 Of which:
Dome 226 Mugging 29 10 4 10 4 6 4 2 274 Stranger 20 2 1 9 4 8 4 1 466 Acquaintance 2 451

Reported incidents of burglary were more likely to lead to the victim wanting information from
the police (30 per cent of reported incidents) than incidents of other crime types. In terms of
moral support or someone to talk to, victims of domestic violence were more likely to want
this type of support (35 per cent of reported incidents) than victims of other crime types. Also,
incidents of domestic violence or acquaintance violence were more likely to involve victims
who wanted protection from further victimisation (31 per cent and 35 per cent of reported
incidents) than other incidents.52 The ten Boom and Kuijpers (2012) systematic review also
looked at the variation in expressed needs between victims of violent crimes and property
crimes. This showed that victims of violent crimes were more likely to express a need for
someone to talk to, protection, effective preventative measures and a need for a verdict/court
decision, whereas victims of property crimes were more likely to express a need for practical
help and financial compensation.
5.5 Personal, household and incident characteristics Similar findings to those reported in Section 4.5 of Chapter 4, on the variation by personal,
household and incident characteristics in which the victim wanted some form of support,
were found for the individual types of support, information or advice that were wanted (see
Tables S13 to S17 in Supplementary Tables). In particular, the variation by some of the
characteristics found to be independently strongly associated with wanting support (see
Section 4.5 of Chapter 4) was as follows:
Overall, the variation by personal, household and incident characteristics was
mainly in relation to information from the police, someone to talk to or protection
from further victimisation. There was little or no variation for the other types of
information, advice or support (for example, practical help).
In personal crime incidents where the victim was very much affected by the
incident, the victim was more likely to want someone to talk to or protection from
further victimisation (in 22 per cent and 18 per cent of incidents respectively) than
in incidents where the victim was only a little affected (in 2 per cent of incidents).
For both personal and household incidents, where the victim perceived the
incident to be very serious, the victim was more likely to want information from
the police, someone to talk to or protection from further victimisation than in
incidents where the victim perceived the incident not to be serious.
In incidents of both personal and household crime where the offender went to
court, the victim was more likely to want someone to talk to (16 per cent and
52 For the crime type breakdown for non-reported incidents, see Table S27 in Supplementary Tables.
39
18 per cent respectively) than in incidents not reported to the police (5 per cent
and 2 per cent of incidents respectively) or incidents that were reported but the
police didn’t identify an offender (8 per cent and 4 per cent of incidents
respectively). Also, for incidents of personal crime where an offender was
charged but didn’t go to court, the victim was also more likely to want someone to
talk to (23 per cent of personal crime incidents).
In incidents of household crime where the police knew about the incident but
didn’t identify an offender, the victim was less likely to want protection from
further victimisation (2 per cent of household crime incidents) than in incidents
that reached a later stage of the CJS, for example where the offender was
identified but not charged or cautioned (29 per cent of household crime incidents)
or where the offender was charged (17 per cent of household crime incidents).
40

6. Types of support, information and advice received by victims
Key points
Overall, the types of support, information or advice most commonly received were
information from the police, moral support or someone to talk to, or information about
security or crime prevention.
Incidents reported to the police were more likely to lead to the victim receiving
support, advice or information. With the exception of moral support or someone to talk
to, there were no unreported incidents that led to the victim receiving information,
advice or support.
The proportion of incidents where the victim received the various types of support
varied by crime type. For example, incidents of domestic violence were particularly
likely to lead to the victim receiving moral support or someone to talk to or protection
from further victimisation.
6.1 Introduction As discussed in Sections 5.3 and 5.4 in Chapter 5, the types of support wanted by victims
varied depending on the type of crime experienced and whether the incident was reported to
the police. Following on from the CSEW question on the support that victims wanted, victims
were also asked about the types of information, advice or support they received following the
incident (see Section 4.1 of Chapter 4). This chapter looks at the different types of support,
advice or information that victims of crime received and also examines how this varied by
whether the incident was reported to the police and by the type of crime experienced.
6.2 National data Figure 6.1 shows the type of information, advice or support that was received using the
combined 2007/08 and 2008/09 CSEW data.53
53 See Section 2.2 of Chapter 2 for further information.
41
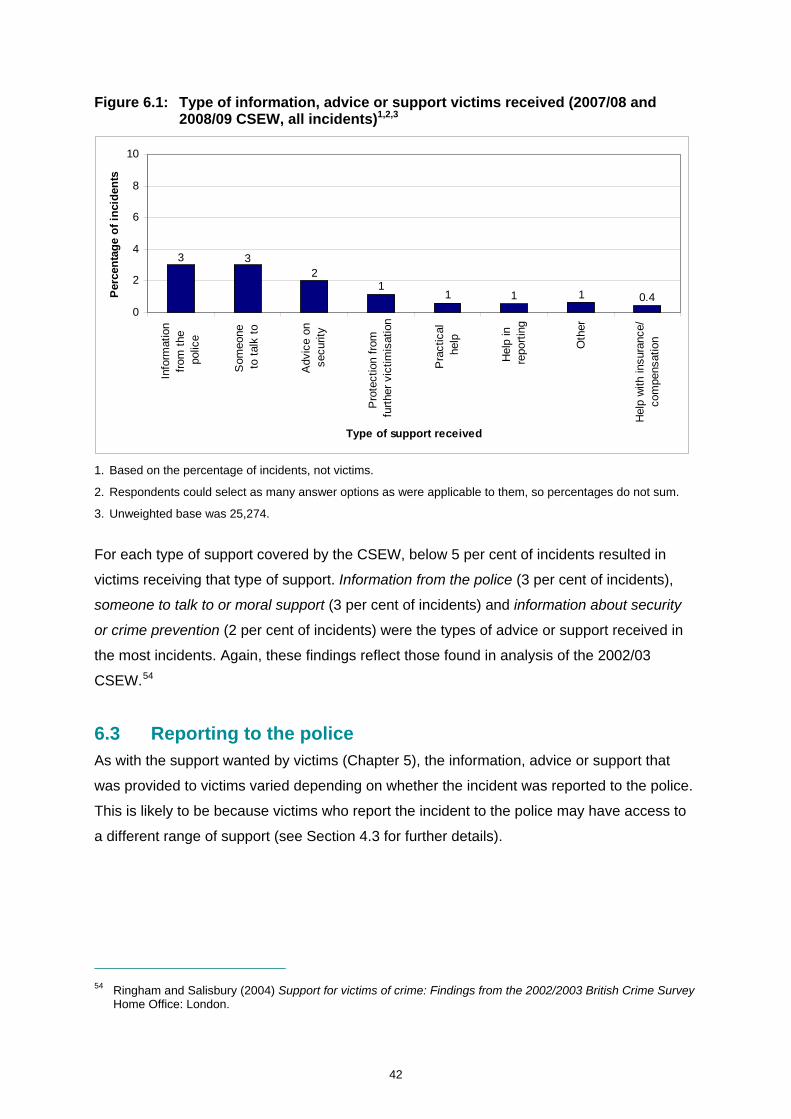
Figure 6.1: Type of information, advice or support victims received (2007/08 and 2008/09 CSEW, all incidents)1,2,3
1
23
0.4111
3
0
2
4
6
8
10In
form
atio
n fr
om t
he
polic
e
Som
eone
to
tal
k to
Adv
ice
on
secu
rity
Pro
tect
ion
from
fu
rthe
r vi
ctim
isat
ion
Pra
ctic
al
help
Hel
p in
re
port
ing
Oth
er
Hel
p w
ith in
sura
nce/
com
pens
atio
n
Type of support received
Per
cen
tag
e o
f in
cid
ents
1. Based on the percentage of incidents, not victims.
2. Respondents could select as many answer options as were applicable to them, so percentages do not sum.
3. Unweighted base was 25,274.
For each type of support covered by the CSEW, below 5 per cent of incidents resulted in
victims receiving that type of support. Information from the police (3 per cent of incidents),
someone to talk to or moral support (3 per cent of incidents) and information about security
or crime prevention (2 per cent of incidents) were the types of advice or support received in
the most incidents. Again, these findings reflect those found in analysis of the 2002/03
CSEW.54
6.3 Reporting to the police As with the support wanted by victims (Chapter 5), the information, advice or support that
was provided to victims varied depending on whether the incident was reported to the police.
This is likely to be because victims who report the incident to the police may have access to
a different range of support (see Section 4.3 for further details).
54 Ringham and Salisbury (2004) Support for victims of crime: Findings from the 2002/2003 British Crime Survey
Home Office: London.
42
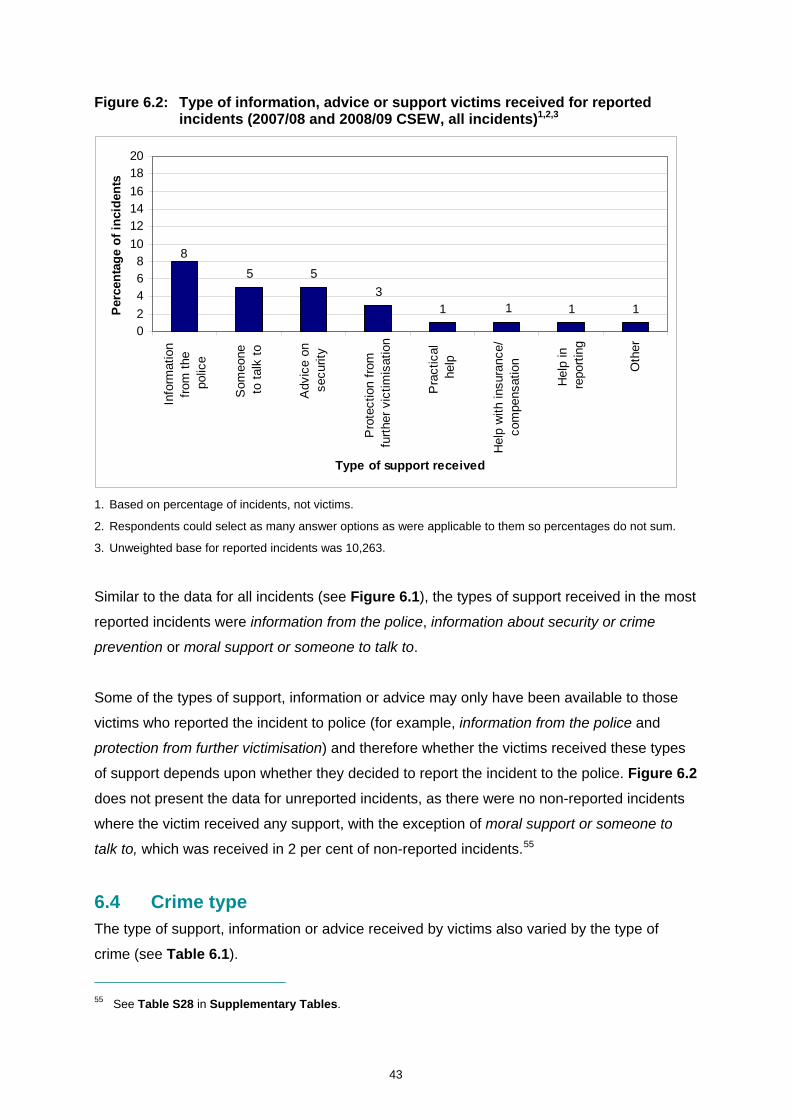
43
Figure 6.2: Type of information, advice or support victims received for reported incidents (2007/08 and 2008/09 CSEW, all incidents)1,2,3
5 5
31 11
8
02
468
10
121416
1820
Info
rmat
ion
from
the
po
lice
Som
eone
to
tal
k to
Adv
ice
on
secu
rity
Pro
tect
ion
from
fu
rthe
r vi
ctim
isat
ion
Pra
ctic
al
help
Hel
p w
ith in
sura
nce/
com
pens
atio
n
Hel
p in
re
port
ing
Oth
er
Type of support received
Per
cen
tag
e o
f in
cid
ents
1
1. Based on percentage of incidents, not victims.
2. Respondents could select as many answer options as were applicable to them so percentages do not sum.
3. Unweighted base for reported incidents was 10,263.
Similar to the data for all incidents (see Figure 6.1), the types of support received in the most
reported incidents were information from the police, information about security or crime
prevention or moral support or someone to talk to.
Some of the types of support, information or advice may only have been available to those
victims who reported the incident to police (for example, information from the police and
protection from further victimisation) and therefore whether the victims received these types
of support depends upon whether they decided to report the incident to the police. Figure 6.2
does not present the data for unreported incidents, as there were no non-reported incidents
where the victim received any support, with the exception of moral support or someone to
talk to, which was received in 2 per cent of non-reported incidents.55
6.4 Crime type The type of support, information or advice received by victims also varied by the type of
crime (see Table 6.1).
55 See Table S28 in Supplementary Tables.

44
Table 6.1: Type of information, advice or support victims received by crime type (2007/08 and 2008/09 CSEW, reported incidents)
Percentage of reported incidents 2007/08 and
2008/09 CSEW
Information from the
policeAdvice on
securityPractical
helpSomeone to talk to
Help with insurance/
compensation
Protection from further
victimisationHelp in
reporting Other Unweighted
base Burglary 13 14 3 9 1 3 1 1 1,479 All vehicle-related thefts 6 3 1 2 1 0 1 1 2,258 Vandalism 7 3 1 3 1 2 1 2 2,517 Bike theft 3 5 1 1 0 0 0 1 663 Theft from the person 7 5 0 5 1 1 1 1 409 Other thefts of personal property
ence5 4 1 2 0 0 2 1 579
All viol 11 3 1 10 1 7 2 1
stic 6 6 2 24 0 16 5 2
1,342 Of which:
Dome 226 Mugging 15 8 3 8 1 2 1 0 274 Stranger 9 2 1 7 1 1 1 1 465 Acquaintance 13 2 0 7 1 11 2 2 451

Incidents of domestic violence reported to the police were more likely to lead to the victim
receiving moral support or someone to talk to or protection from further victimisation (24 per
cent and 16 per cent of reported incidents) compared with incidents of other crime types.56
Incidents of burglary were more likely to involve victims who received information from the
police (13 per cent of incidents) than incidents of other crime types, except mugging and
acquaintance violence (15 per cent and 13 per cent respectively).57,58
6.5 Personal, household and incident characteristics Similar findings to those reported in Section 4.5 of Chapter 4, on the variation by personal,
household and incident characteristics in which the victim received some form of support,
were found for the individual types of support, information or advice received (see Tables
S20 to S24 in Supplementary Tables). In particular, the variation by some of the
characteristics that were found to be independently strongly associated with receiving
support (see Section 4.5 of Chapter 4) was as follows:
As with the type of support wanted, overall the variation by personal, household
and incident characteristics was mainly in the incidents where the victims
received information from the police, someone to talk to or protection from further
victimisation; there was little or no variation for the other types of information,
advice or support (for example, practical help).
In personal crime incidents where the victim was very much affected by the
incident, the victim was more likely to receive information from the police,
someone to talk to, or protection from further victimisation (6 per cent, 12 per
cent, and 6 per cent of incidents respectively) than in incidents where the victim
was only a little affected (2 per cent, below 0.5 per cent and 2 per cent of
incidents respectively).
For both personal and household crime incidents, where the victim perceived the
incident to be very serious, the victim was more likely to receive information from
the police or someone to talk to than in incidents where the victim perceived the
incident not to be serious. In addition, for personal crime incidents that the victim
perceived to be very serious, the victim was more likely to receive protection from
further victimisation, and for household crime incidents that the victim perceived
56 With the exception of victims of acquaintance violence who received protection from further victimisation in
11 per cent of incidents, which was not statistically significantly different from victims of domestic violence. 57 For the crime type breakdown for non-reported incidents, see Table S29 in Supplementary Tables. 58 The differences between incidents of mugging and acquaintance violence in which the victim wanted
information from the police (in 15 per cent of incidents and 13 per cent of incidents respectively) and incidents of other crime types were not all statistically significant.
45

to be very serious, the victim was more likely to receive information or advice on
security.
In incidents of personal and household crimes where the offender went to court,
the victim was more likely to receive information from the police or someone to
talk to than in incidents that were not reported to the police, were reported but an
offender was not identified or where an offender was identified but not charged.
Also, in incidents of personal crime where the offender went to court, the victim
was more likely to receive protection from further victimisation (17 per cent of
personal crime incidents) than in incidents that were not reported to the police
(below 0.5 per cent of personal crime incidents), were reported but an offender
was not identified (1 per cent of personal crime incidents) or where an offender
was identified but not charged (4 per cent of personal crime incidents).
6.6 Support received by victims who wanted support In Ringham and Salisbury (2004), the data on wanting and receiving specific types of support
was compared to determine whether in incidents where the victims said they wanted a
specific type of support, they then said they received it. This comparison on the combined
2007/08 and 2008/09 data indicates that:
for those incidents reported to the police where the victim wanted someone to
talk or moral support, it was received in 41 per cent of incidents
for those reported incidents where the victim wanted information on security and
crime prevention, it was received in 34 per cent of incidents
for those reported incidents where the victim wanted help with their insurance or
compensation claim, it was received in 21 per cent of incidents
for those reported incidents where the victim wanted protection from further
victimisation, it was received in 18 per cent of incidents.59
The design of the questions means that the issue of support provision and whether victims
are receiving the support they wanted cannot be fully explored. There were no follow-up
questions to ask the victim about the consequences of not receiving a particular type of
support they wanted. Therefore, it is not possible to understand whether it mattered that they
did not receive the particular type of support they wanted or whether the other types of
support or information they received were adequate to address what they wanted. It is also
59 See Table S30 in Supplementary Tables.
46

not possible to explore whether the support was received at the time it was wanted.60
Findings from Simmonds’ (2009) research in one local Victim Support scheme in the South
West of England, designed specifically to compare whether victims received the support they
wanted, suggested that the majority of burglary victims who stated that they needed
‘personal support’ received it. However, these findings are based on a limited sample of
burglary victims in one region of the UK.
60 See Appendix B for further details.
47

7. Victim contact with Victim Support
Key points
In 5 per cent of incidents, the victim recalled having contact with Victim Support.
In 7 per cent of incidents where the victim did not have contact with Victim Support,
the victim said it would have been helpful to have had contact with Victim Support.
In the majority of incidents where the victims had contact with Victim Support, they
had been contacted initially either by letter or leaflet (62 per cent) or by telephone
(21 per cent).
In 57 per cent of incidents where the victim had contact with Victim Support, the victim
did not want any information, advice or support from the organisation.
Someone to talk to or moral support and information about security were the types of
support most likely to be provided by Victim Support (25 per cent of incidents and 12
per cent of incidents where the victim had contact with Victim Support respectively).
In 83 per cent of incidents where the victim had contact with Victim Support, the victim
was very or fairly satisfied with the contact.
7.1 Introduction Established in 1974, Victim Support is one of the largest providers of support to victims of
crime in England and Wales, providing support predominantly via trained volunteers. While it
is independent from Government, Victim Support is principally funded through an annual
grant from the Ministry of Justice.61 Support is provided to victims referred by the police when
they reported the crime or to victims who have contacted Victim Support directly (self-
referrals). Victim Support offers a range of information, advice and support, such as
someone to talk to in confidence, information on the CJS, compensation and insurance, help
in dealing with other organisations, and links to other sources of help and support.62 From
2001/02,63 the CSEW asked victims whether they recalled having contact with Victim
Support and this chapter looks in more detail at those incidents where they did have contact
and in particular at the type of contact with Victim Support, the support that was provide
,
d and
61 Getting it right for victims and witnesses (2012) Ministry of Justice: London. 62 http://www.victimsupport.org/About-us 63 Some of the questions (including the overall question on whether the victim had contact with Victim Support)
were also asked in the 1998 survey and some of the questions (for example on the victim’s satisfaction with the contact with Victim Support) were not introduced until 2004/05.
48
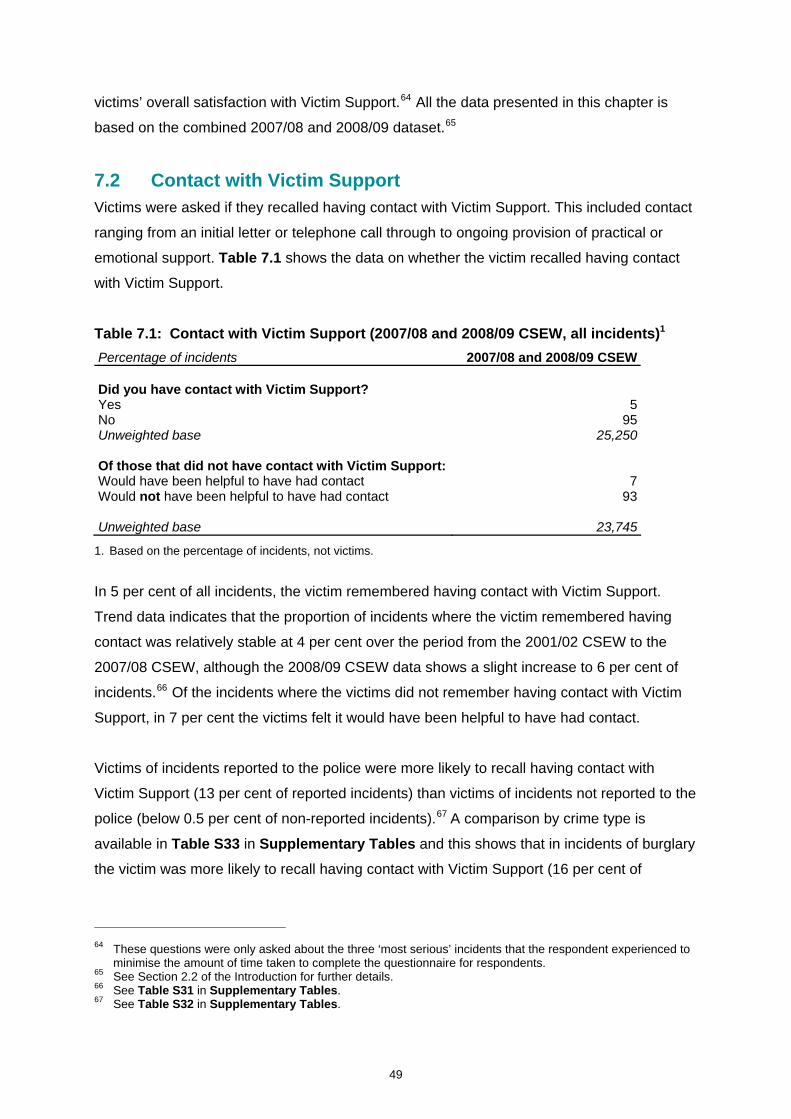
victims’ overall satisfaction with Victim Support.64 All the data presented in this chapter is
based on the combined 2007/08 and 2008/09 dataset.65
7.2 Contact with Victim Support Victims were asked if they recalled having contact with Victim Support. This included contact
ranging from an initial letter or telephone call through to ongoing provision of practical or
emotional support. Table 7.1 shows the data on whether the victim recalled having contact
with Victim Support.
Table 7.1: Contact with Victim Support (2007/08 and 2008/09 CSEW, all incidents)1
Percentage of incidents 2007/08 and 2008/09 CSEW Did you have contact with Victim Support? Yes 5 No 95 Unweighted base 25,250 Of those that did not have contact with Victim Support: Would have been helpful to have had contact 7 Would not have been helpful to have had contact 93 Unweighted base 23,745
1. Based on the percentage of incidents, not victims.
In 5 per cent of all incidents, the victim remembered having contact with Victim Support.
Trend data indicates that the proportion of incidents where the victim remembered having
contact was relatively stable at 4 per cent over the period from the 2001/02 CSEW to the
2007/08 CSEW, although the 2008/09 CSEW data shows a slight increase to 6 per cent of
incidents.66 Of the incidents where the victims did not remember having contact with Victim
Support, in 7 per cent the victims felt it would have been helpful to have had contact.
Victims of incidents reported to the police were more likely to recall having contact with
Victim Support (13 per cent of reported incidents) than victims of incidents not reported to the
police (below 0.5 per cent of non-reported incidents).67 A comparison by crime type is
available in Table S33 in Supplementary Tables and this shows that in incidents of burglary
the victim was more likely to recall having contact with Victim Support (16 per cent of
64 These questions were only asked about the three ‘most serious’ incidents that the respondent experienced to
minimise the amount of time taken to complete the questionnaire for respondents. 65 See Section 2.2 of the Introduction for further details. 66 See Table S31 in Supplementary Tables. 67 See Table S32 in Supplementary Tables.
49

50
incidents) compared with incidents of other crime types (for example, 3 per cent of theft from
the person incidents and 9 per cent of violent incidents).
Bradford (2011) carried out some analysis of the 2007/08 and 2008/09 CSEW and found that
there were a number of factors strongly associated with having contact with Victim Support.
These included being female, living in socially-rented housing, living in less well-off areas
and, most strongly associated, being more emotionally affected by the incident.
Of those reported incidents where the victim did not recall having contact with Victim
Support, in 12 per cent the victim felt it would have been helpful to have had contact,
in comparison with 4 per cent of non-reported incidents.68
The CSEW asked about the type of first contact the victim had with Victim Support
(see Table 7.2).
68 See Table S32 in Supplementary Tables.

51
Table 7.2: Type of contact with Victim Support: a comparison by crime type (2007/08 and 2008/09 CSEW, all incidents where victim had contact with Victim Support)1,2,3
Percentage of incidents 2007/08 and
2008/09 CSEW
Which of these happened on your first contact with Victim Support?
Victim Support
sent a letter/leaflet
Victim Support came to
home
Victim Support
telephoned home
Victim/ Household
member contacted
Victim Support
Victim/ Household
member contacted the
Witness Service OtherUnweighted
base Burglary 52 12 31 2 0 2 344 All vehicle-related thefts 80 4 10 1 0 5 157 Vandalism 73 5 14 4 0 4 216 Bike theft - - - - - - 44 Theft from the person - - - - - - 51 Other thefts of personal property - - - - - - 45 All violence 57 4 22 4 0 13 282 Non-reported incidents - - - - - - 21 Reported incidents 63 5 22 3 0 7 1,215 All incidents 62 6 21 3 0 8 1,236
1. Based on percentage of incidents, not victims.
2. Unweighted bases for some crime types are small and therefore the estimates should be treated with caution. Percentages are not shown where the unweighted base is less than 100.
3. The ‘All violence’ category has not been split into the different types of violence because the base sizes were too small.
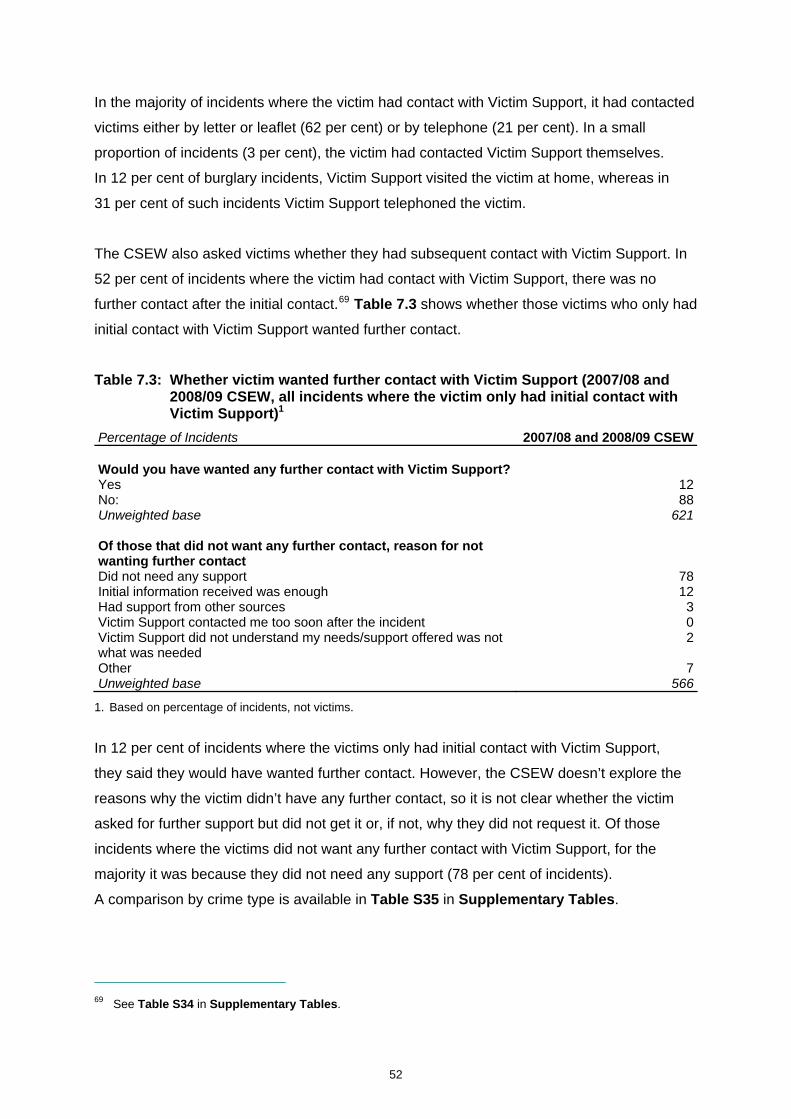
In the majority of incidents where the victim had contact with Victim Support, it had contacted
victims either by letter or leaflet (62 per cent) or by telephone (21 per cent). In a small
proportion of incidents (3 per cent), the victim had contacted Victim Support themselves.
In 12 per cent of burglary incidents, Victim Support visited the victim at home, whereas in
31 per cent of such incidents Victim Support telephoned the victim.
The CSEW also asked victims whether they had subsequent contact with Victim Support. In
52 per cent of incidents where the victim had contact with Victim Support, there was no
further contact after the initial contact.69 Table 7.3 shows whether those victims who only had
initial contact with Victim Support wanted further contact.
Table 7.3: Whether victim wanted further contact with Victim Support (2007/08 and 2008/09 CSEW, all incidents where the victim only had initial contact with Victim Support)1
Percentage of Incidents 2007/08 and 2008/09 CSEW Would you have wanted any further contact with Victim Support? Yes 12No: 88Unweighted base 621 Of those that did not want any further contact, reason for not wanting further contact
Did not need any support 78Initial information received was enough 12Had support from other sources 3Victim Support contacted me too soon after the incident 0Victim Support did not understand my needs/support offered was not what was needed
2
Other 7Unweighted base 566
1. Based on percentage of incidents, not victims.
In 12 per cent of incidents where the victims only had initial contact with Victim Support,
they said they would have wanted further contact. However, the CSEW doesn’t explore the
reasons why the victim didn’t have any further contact, so it is not clear whether the victim
asked for further support but did not get it or, if not, why they did not request it. Of those
incidents where the victims did not want any further contact with Victim Support, for the
majority it was because they did not need any support (78 per cent of incidents).
A comparison by crime type is available in Table S35 in Supplementary Tables.
69 See Table S34 in Supplementary Tables.
52

7.3 Support provided by Victim Support For incidents where the victims said they had at least initial contact with Victim Support, they
were asked about the type of support provided. In 57 per cent of incidents where the victims
had contact with Victim Support, they did not want any information, support or advice. Of the
43 per cent of incidents with contact that led to the victim receiving support, the most
commonly received type of support was someone to talk to or moral support (25 per cent of
incidents), followed by information about security or crime prevention (12 per cent of
incidents) (see Figure 7.1).
Figure 7.1: Type of support provided by Victim Support (2007/08 and 2008/09 CSEW, all incidents where Victim Support provided support)1,2,3
Type of information, advice or support provided by Victim Support (2007/08 and 2008/09 BCS)
25
12
6
5
5
5
4
4
3
2
1
1
0 5 10 15 20 25 30 35 40
Help with insurance
Referred me to the Witness Service
Don't know
Help with CICA claim
Help in reporting the incident
Information about the Witness Service
Protection from further victimisation
Other
Practical help
Information from the police
Information about security
Someone to talk to/moral support
Percentage of incidents where the victim had contact with Victim Support
1. Based on the percentage of incidents, not victims.
2. Respondents could select as many answer options as were applicable to them, so percentages do not sum.
3. Unweighted base for reported incidents was 1,253.
This reflects the pattern of overall support the victims said they received, where the types of
support received in the most incidents were information from the police, information on
security and crime prevention and someone to talk to or moral support.70 Again, similar to the
pattern for overall support provided,71 victims of burglary and violent crime were more likely
70 See Section 5.2 of Chapter 5 for further details. 71 See Section 5.4 of Chapter 5 for further details.
53

to have been provided with someone to talk to or moral support (in 33 per cent of incidents
and 32 per cent of incidents where the victim had contact with Victim Support) than victims
of vehicle-related thefts (8 per cent of incidents) or vandalism (17 per cent of incidents).
A comparison by crime type is available in Table S36 in Supplementary Tables.
7.4 Victim satisfaction with contact with Victim Support Victims who had contact with Victim Support were also asked how satisfied they were with
that contact (see Table 7.4).
Table 7.4: Victim satisfaction with contact with Victim Support (2007/08 and 2008/09 CSEW, all incidents where the victim had contact with Victim Support)1
Percentage of incidents where the victim had contact with Victim Support
2007/08 and 2008/09 CSEW
Overall satisfaction/dissatisfaction with Victim Support contact Very satisfied 41Fairly satisfied 43A bit dissatisfied 4Very dissatisfied 5Too early to say 2Don't know 6Unweighted base 1,252
1. Based on the percentage of incidents, not victims.
In 83 per cent72 of incidents where the victim had contact with Victim Support, the victim was
very or fairly satisfied with that contact.73 Trend data indicates that the proportion of incidents
where the victim was very or fairly satisfied was stable between the 2004/05 CSEW and the
2008/09 CSEW.74 Bradford’s (2011) analysis of the CSEW also looked at the association
between satisfactory contact with Victim Support and confidence in the procedural fairness
and the effectiveness of the CJS. This analysis suggested that satisfactory contact with
Victim Support may be associated with increased confidence in the effectiveness of the CJS
because it enhances the victim’s trust in the procedural fairness of the CJS. This may be
because the interaction generates trust. An alternative explanation offered, however, was
that some victims have a higher level of ‘generalised trust’ and were therefore more likely to
72 The percentage of incidents where the victim had contact with Victim Support and was very or fairly satisfied
with that contact was 83 per cent. In order to avoid rounding errors, this percentage has been recalculated for the single category of ‘very or fairly satisfied’ and differs by one percentage point from the sum of the percentages derived from Table 7.4 (‘very satisfied’ 41 per cent, and ‘fairly satisfied’ 43 per cent).
73 A comparison by crime type is available in Table S37 in Supplementary Tables. 74 The difference between the 2004/05 BCS (in 77 per cent of incidents the victim was very or fairly satisfied)
and the 2008/09 BCS (in 84 per cent of incidents the victim was very or fairly satisfied) was not statistically significant. See Table S38 in Supplementary Tables.
54

think that the CJS was effective and procedurally fair and more likely to access Victim
Support’s services. The nature of the CSEW does not enable us to explore this further.
7.5 Opportunity to make a Victim Personal Statement All victims of crime should be offered the opportunity to make a Victim Personal Statement
(VPS) to explain how the crime impacted on them financially, physically or emotionally, and
enable their views to be taken account of in the criminal justice process. The CSEW asked
victims who reported the crime to the police whether they were given the opportunity to make
a VPS and in 9 per cent of reported incidents the victim recalled being offered the
opportunity.75 The VPS is usually offered and taken by the police at the same time and on
the same form as the witness evidence statement, so some victims may not have realised
they had been offered it. Victims who said they were given the opportunity to make a VPS
were then asked whether they took up this opportunity. In 61 per cent of incidents where the
victims recalled being offered the opportunity to make a VPS, they made one.76
75 See Table S39 in Supplementary Tables. 76 See Table S40 in Supplementary Tables.
55

8. Implications for service provision
There are a number of conclusions about victim support service provision that can be drawn
from the findings presented in Chapters 2 to 7, and a number of implications to be
considered. Local commissioning of victim support services is aiming to come into place by
2014, with responsibility for the majority of service provision and funding devolved to local
Police and Crime Commissioners (PCCs).77,78 PCCs will need to decide how to best identify
victims’ needs in their local area and how to provide support services to meet those needs.
This report provides some initial evidence on some of these issues.
Are victims getting the support that they want? Overall, the percentage of incidents where the victim wanted support was low. The design of
the CSEW questions on the support the victim wanted and the support the victim received
means that the issue of whether victims were receiving the support they wanted and when
they wanted it could not be fully explored. The data suggests that across the different types
of support a number of victims said they received the support they wanted. However, the
majority of victims who said they wanted a certain type of support then said they didn’t
receive it. For example, for those incidents that were reported to the police, where the victim
wanted someone to talk to, it was received in 41 per cent of incidents, and in 34 per cent of
reported incidents where the victims wanted information on security and crime prevention,
they then said they received it. This may indicate a degree of unmet need and therefore that
there may be room for improvement in terms of support provision to victims of crime.
77 Local Police and Crime Commissioners (PCCs) will be responsible for setting policing priorities and improving
community safety in their neighbourhoods. 78 Some commissioning, for example for support for families bereaved by homicide and rape crisis centres, will
continue to be commissioned at the national level. These crime types are not, however, covered by the CSEW (see Chapter 2 for further details).
56
The design of the CSEW means that all respondents are asked about their victimisation
experiences in the last year, and therefore their perception of the support they wanted
following the incident may be different at the time of the CSEW interview from their
perception of their needs immediately after the incident and at the point when they may have
been offered support. Research suggests that a victim’s needs may change over time
following the incident (ten Boom and Kuijpers, 2012). Therefore, although the victims may
have said they wanted information from the police, for example, in their response to the
CSEW question, they may not have articulated this immediately after the incident or may
have refused an offer of support at this point. This suggests that a follow-up mechanism is
needed to ensure that any needs that develop over time can be dealt with. This could be
through providing victims with details of how they can self-refer themselves for support,
signposting them to sources of support or through CJS staff making a follow-up phone call to
reassess the victim’s needs at a set time after the victimisation.
How to target support? Incidents reported to the police and incidents of burglary and violent crimes were more likely
to be those where the victim both wanted support and received it. There was also some
variation by personal and household characteristics. However, the factors strongly
associated with wanting support and with receiving support were predominantly
characteristics of the incident itself and the victim’s perception of and reaction to the incident.
In particular, victims who were more emotionally affected by the incident and perceived the
incident to have been more serious and victims of a series of incidents were more likely to
want support. Victims whose cases reached later stages of the CJS (charge or court) were
also more likely to want support.
These findings would suggest that victims with the greatest need for support may be better
identified according to these incident characteristics than by crime type or victims’ personal
characteristics. There was, however, some variation in wanting support by victim personal
characteristics, and age and educational level were found to be strongly associated with
wanting support. Although the demographic characteristics were not indicators of wanting
support in the analyses (with the exception of age and educational level), there were
statistically significant differences between some of the demographic and crime type groups.
Therefore, as these may be more easily identifiable at an initial needs assessment,
demographics and crime type could be a useful proxy for identifying victims with a need for
support in the absence of this information.
57

In addition to the variation in the types of victim wanting some form of support, information or
advice in general, for those victims who did want support the types of support they wanted
also varied. The types of support most commonly wanted were information from the police,
someone to talk to or moral support and protection from further victimisation. The analysis in
this report showed that, although there was variation in the victim characteristics of those
wanting the three most common types of support (information from the police, someone to
talk to and protection), there was little variation for the other types of support (for example,
practical help or help with an insurance or compensation claim). However, due to the small
number of respondents who said they wanted support overall (and in particular certain types
of support), the CSEW cannot be used to look in detail at whether certain victims are more
likely to want certain types of support, information or advice, but the data does suggest that
victims do not all have the same ‘set’ of needs and therefore a ‘one size fits all’ approach
may not be the most effective method of support provision.
Support provided by Victim Support The support provided by Victim Support to victims of crime was well received with the
majority (83 per cent) saying they were satisfied with the contact they had. Other research
has shown that this is associated with confidence in the effectiveness and fairness of the
CJS as a whole. However, in 52 per cent of incidents where the victim had contact with
Victim Support, this was only initial contact (for example, Victim Support sent the victim a
letter or telephoned) and in 57 per cent of incidents where the victim had contact, the victim
did not want any information, advice or support from the organisation. There were also a
smaller number of incidents where the victim only had initial contact with Victim Support but
said they would have wanted further contact (12 per cent of incidents). These findings
suggest that Victim Support’s current approach proactively to contact all victims referred to
them by the police may not be the most effective method, when resources are limited, to
reach those victims who need support. However, if Victim Support did not contact all victims
who reported the crime to the police, there is a possibility that some of the victims who
reported the crime and wanted support would not be reached (in 39 per cent of reported
incidents, the victim wanted support).
Greater reliance on victims to self-refer may be one way to approach this. However, the
findings show that, in only a small percentage of incidents, the victims had contacted Victim
Support or the Witness Service themselves. One way to tackle this may be to increase
awareness of Victim Support and its role in accepting self-referrals. The findings showed that
in general public awareness of Victim Support was high (84 per cent of victims and 81 per
cent of non-victims). However, there were certain groups less likely to say they were aware
58

of Victim Support – for example, those living in lower-earning households, those aged 16–24
and those from a Black or Asian background. Other analysis of the CSEW79 has shown that
some of these groups are also more likely to be victims of crime and therefore there may
need to be some targeted awareness-raising to ensure they know about Victim Support and
the services it provides – for example, leaving leaflets and displaying posters about Victim
Support’s services in public places such as supermarkets and venues for community group
meetings.
Another approach may be to look at the role of the police in referring or signposting victims to
Victim Support. In only a small percentage of non-reported incidents (0.5 per cent), the victim
had contact with Victim Support; therefore, the majority of the victims who said they only had
initial contact with Victim Support or didn’t want any information, advice or support will have
been referred by the police. There may be more of a role for police staff to discuss the
support that can be offered by Victim Support with the victim before a referral to ascertain
whether the victim would like to be contacted, because this may help to ensure that Victim
Support’s resources are directed to helping those victims who require some form of support,
information or advice.
79 Flatley et al (2010).
59

References Bradford, B (2011) Voice, neutrality and respect: Use of Victim Support services, procedural
fairness and confidence in the criminal justice system. Criminology and Criminal Justice
pg 1–22.
Flatley, J., Kershaw, C., Smith, K., Chaplin, R., and Moon, D. (2010) Crime in England and
Wales 2009/10: Findings from the British Crime Survey and police recorded crime. Home
Office: London.
Franklyn, R (2012) Satisfaction and willingness to engage with the Criminal Justice System:
Findings from the Witness and Victim Experience Survey, 2009–10. Ministry of Justice:
London.
Maguire, M (1991) The needs and rights of victims of crime. Crime and Justice 14 pg 363–
433.
McCart, MR., Sawyer, GK., and Smith, DW. (2010) Help seeking among victims of crime:
A review of the empirical literature Journal of Traumatic Stress 23(2) pg 198–206.
Ministry of Justice (2010) Breaking the cycle: effective punishment, rehabilitation and
sentencing of offenders. Ministry of Justice: London.
Ministry of Justice (2012) Getting it right for victims and witnesses. Ministry of Justice:
London.
Pickering, K., Smith, P., Bryson, C., and Farmer, C. (2008). British Crime Survey: options for
extending the coverage to children and people living in communal establishments. Home
Office Research Report 06. London: Home Office.
Ringham, L. and Salisbury, H. (2004) Support for victims of crime: findings from the
2002/2003 British Crime Survey. Home Office: London.
Simmonds, L. (2009) What victims want! Victim Support, an objective or relative approach to
victims’ needs. Social and Public Policy Review 3(2) pg 11–29.
60

Smith, K., Osborne, S., Lau, I., and Britton, A. (2012) Homicides, Firearm Offences and
Intimate Violence 2010/11: Supplementary Volume 2 to Crime in England and Wales
2010/11. Home Office: London.
ten Boom, A. and Kuijpers, K. (2012) Victims’ needs as basic human needs. International
Review of Victimology 18(2) pg 155–179.
Walker, A., Flatley, J., Kershaw, C. and Moon, D. (2009) Crime in England and Wales
2008/09: Findings from the British Crime Survey and police recorded crime. Home Office:
London.
61
Appendix A
Methodological Annex
Analysis All analysis was conducted using weighted data. Unweighted bases, the number of
respondents who answered each question, are shown in tables. Survey findings are subject
to a margin of error. Findings were statistically tested at the 5 per cent significance level, and
only differences that were statistically significant differences are referred to in the text.
Design factors were used in statistical tests to correct for the fact that the survey design did
not use a simple random sample.
Logistic regression analysis Logistic regression analyses were carried out to explore which factors were independently
associated with wanting support and receiving support, taking into account the effect of other
variables/factors.
Forward stepwise logistic regression methods were used, as the analysis was exploratory
rather than testing a theory.80 Separate models were run for personal and household crime
because it was only appropriate to enter personal characteristic variables into the personal
crime models. Four models were run to explore wanting support and receiving support:
Support wanted in personal crime incidents
Support wanted in household crime incidents
Support received in personal crime incidents
Support received in household crime incidents.
Only questions which were asked of all respondents in the model were included in that
model. There may be further factors associated with wanting support or receiving support
that are not included in these analyses for these reasons, or there may be factors that were
not included in the CSEW questionnaire.
80 The analyses were conducted on incidents, rather than respondents, and therefore some individuals will be
double-counted. This violates one of the basic assumptions of regression modelling. However, in practice, with the CSEW the number of individuals who would be double-counted is small and therefore the impact of this is likely to be small.
62

Data preparation Prior to running the regression analyses, the data was prepared and many variables were
recoded. The dependent variables for each model were recoded into binary variables. In
addition, ‘don’t knows’ and refusals were coded as missing (and therefore excluded from the
analyses) unless they formed 5 per cent or more of the responses, in which case they were
recoded into a single category to ensure that the base size was large enough to run the
analysis.
The relationships between the dependent variable and the explanatory, independent
variables were then explored (using crosstabs), and reference categories for each variable
were selected. Correlations were then run to test for multicollinearity, to ensure that the
independent variables were not highly correlated with one another (none had an absolute
correlation score greater than 0.4).
The tables showing the results of the logistic regressions can be found in Tables S18, S19,
S25 and S26 in Supplementary Tables. Variables are listed in order of the strength of their
association with the dependent variable (that is, in the order they were included in the
model). Variables found to be strongly associated with the dependent variable (that is, they
explained more than 1 per cent of the total variance) are listed in a footnote to each table.
Variables included in the analysis but not found to be statistically significantly associated with
the dependent variable are also listed in a footnote to each table.
63

Appendix B
Development of Crime Survey for England and Wales questions on support services for victims from 2010/11
This report focuses upon a set of questions in the Crime Survey for England and Wales
(CSEW) about the support wanted and received by victims of crime. The question set in the
2007/08 and 2008/09 surveys was as follows:
QUESTION 1
This card lists some of the types of information, advice or support that people sometimes need after being the victim of a crime. What types of information, advice or support would you say you/(the victim)/the household) WANTED following the incident?
1. None of these/did not want any support 2. Information from the police (e.g. whether a suspect has been identified and
what happened if the case had been to court) 3. Information about security/crime prevention 4. Practical help (e.g. with clearing up or making a list of what was stolen) 5. Someone to talk to for support 6. Help with insurance/compensation claim (not including making a list of what
was stolen) 7. Protection from further victimisation/harassment 8. Help in reporting the incident/dealing with the police 9. Something else
QUESTION 2
And which of these did you/(the victim/the household) actually RECEIVE following the incident?
1. None of these/did not want any support 2. Information from the police (e.g. whether a suspect has been identified and
what happened if the case had been to court) 3. Information about security/crime prevention 4. Practical help (e.g. with clearing up or making a list of what was stolen) 5. Someone to talk to for support 6. Help with insurance/compensation claim (not including making a list of what
was stolen) 7. Protection from further victimisation/harassment 8. Help in reporting the incident/dealing with the police 9. Something else
There were a number of issues with this question set, as explained below. A new set of
questions that attempted to address these issues was added to the CSEW in October 2010,
with further amendments made in April 2011.
64
1. For both the support wanted and the support received by victims of crime, it is not clear
whether the type of support, information or advice was formal or informal. For example,
for the answer option ‘moral support or someone to talk to’, this could refer to an
informal chat with a friend or relative or formal counselling sessions. It is also not clear
whether the support was wanted or received from state-funded sources (for example,
the police or Victim Support) or from individuals in the victim’s informal support network
(for example, friends, relatives or colleagues). The new question set provides an
extended list of answer options for the possible types of support that could be wanted
or received. It also includes a follow-up question on who provided the support that was
received.
2. Although it is possible to analyse the questions to look at whether those victims who
said they wanted a particular type of support then said they received it, the questions
were not designed to assess whether there were unmet needs and there are a number
of issues with the interpretation of this analysis. The new question set specifically asks
victims whether there were any types of support they wanted but did not receive. There
is not, however, a follow-up question for those victims who said there were types of
support they wanted but didn’t receive to assess the impact of not receiving the
support. It was not possible to design a survey question on this that respondents could
easily answer. In-depth qualitative interviews may be a more appropriate method to
gather data on this area.
3. The revised question set also includes a follow-up question to ask victims who received
some form of information, advice or support whether they found that support useful or
not.
The revised set of questions is as follows.
QUESTION 1
This card lists some of the types of information, advice or support that people sometimes need after being the victim of a crime. What types of information, advice or support, if any, did you (or anyone else in your household) RECEIVE following the incident?
1. Did not receive any information, advice or support 2. Chance to talk to someone either formally or informally 3. Help with reporting the incident/dealing with the police 4. Help with insurance or compensation claims 5. Help related to the case going through the Criminal Justice System (e.g.
attending court, giving evidence)
65

6. Financial support 7. Other practical help (e.g. clearing up, making a list of what was stolen, fitting
locks) 8. Help accessing other services (e.g. health care, housing, refuge) 9. Information on the progress of the case or how the Criminal Justice System
works 10. Information on preventing further crime 11. Something else (SPECIFY)
QUESTION 2 (Asked if they did not receive anything at QUESTION 1)
Even though you didn’t receive any information, advice or support following the incident, would you have LIKED to receive any of the things listed on the card?
1. Would not have liked to receive any (more) information, advice or support 2. Chance to talk to someone either formally or informally 3. Help with reporting the incident/dealing with the police 4. Help with insurance or compensation claims 5. Help related to the case going through the Criminal Justice System (e.g.
attending court, giving evidence) 6. Financial support 7. Other practical help (e.g. clearing up, making a list of what was stolen, fitting
locks) 8. Help accessing other services (e.g. health care, housing, refuge) 9. Information on the progress of the case or how the Criminal Justice System
works 10. Information on preventing further crime 11. Something else (SPECIFY)
QUESTION 3 (Asked if stated that they did receive something at QUESTION 1)
Apart from what you have already mentioned, would you have LIKED to receive any other types of information, advice or support?
1. Would not have liked to receive any (more) information, advice or support 2. Chance to talk to someone either formally or informally 3. Help with reporting the incident/dealing with the police 4. Help with insurance or compensation claims 5. Help related to the case going through the Criminal Justice System (e.g.
attending court, giving evidence) 6. Financial support 7. Other practical help (e.g. clearing up, making a list of what was stolen, fitting
locks) 8. Help accessing other services (e.g. health care, housing, refuge) 9. Information on the progress of the case or how the Criminal Justice System
works 10. Information on preventing further crime 11. Something else (SPECIFY)
66
67
QUESTION 4
Thinking about the [responses from Question 3] you received, which people or organisations provided this?
1. Police 2. Victim Support (including the Witness Service) 3. Any other criminal justice agency (e.g. Magistrates’/Crown/Juvenile Court,
Crown Prosecution Service, Probation Service, Youth Offending Team, Witness Care Unit)
4. A charity/community group 5. A friend or relative 6. Any other person or organisation (SPECIFY)
QUESTION 5
And how useful was this support in meeting your needs?
1. Very useful 2. Fairly useful 3. Not very useful 4. Not at all useful 5. Did not want this support 6. Too early to say


![Reproduction 6.6 ;]](https://static.fdocuments.in/doc/165x107/568165e5550346895dd904fc/reproduction-66-.jpg)