Support for this research was Foundation. Is a Dental ...
17
Adele Shartzer, Anuj Gangopadhyaya, John Holahan, Bowen Garrett, and Nikhil Rao September 2021 The fiscal year 2022 budget resolution proposes to expand Medicare coverage to include dental, vision, and hearing services. To better understand the context around a new proposed dental benefit, we examine dental care utilization and spending overall and for the Medicare population using two national databases. We first show that dental care utilization and spending increase with age. The highest spending levels, aside from those in teenage years, occur at ages 65 to 79. Out-of-pocket spending is highest at the same ages. Traditional Medicare excludes dental coverage, but beneficiaries can access such coverage through employer plans, Medigap coverage, Medicaid, or Medicare Advantage (MA) plans. Still, only about 27 percent of Medicare enrollees’ total dental expenditures are paid by an insurer. We also find substantial differences in dental utilization and spending by race and ethnicity and income. Black Medicare enrollees have lower expenditures than other racial and ethnic groups. People with incomes above 400 percent of the federal poverty level (FPL) have far greater expenditures than those with incomes below the FPL. Most enrollees who use any dental services use preventive services, but those with the highest expenditures have greater utilization of extensive procedures (e.g., fillings and extractions). These findings suggest Medicare enrollees could benefit substantially from policies that would expand dental coverage. Spending burdens would likely be lessened for those with significant spending now, and more enrollees would likely obtain needed dental care. US HEALTH REFORM—MONITORING AND IMPACT Is a Dental Benefit Needed in Medicare? Patterns of Dental Care Spending and Use Support for this research was provided by the Robert Wood Johnson Foundation. The views expressed here do not necessarily reflect the views of the Foundation.
Transcript of Support for this research was Foundation. Is a Dental ...

Adele Shartzer, Anuj Gangopadhyaya, John Holahan, Bowen Garrett, and Nikhil Rao
September 2021
The fiscal year 2022 budget resolution proposes to expand Medicare coverage to
include dental, vision, and hearing services. To better understand the context around a
new proposed dental benefit, we examine dental care utilization and spending overall
and for the Medicare population using two national databases. We first show that
dental care utilization and spending increase with age. The highest spending levels,
aside from those in teenage years, occur at ages 65 to 79. Out-of-pocket spending is
highest at the same ages. Traditional Medicare excludes dental coverage, but
beneficiaries can access such coverage through employer plans, Medigap coverage,
Medicaid, or Medicare Advantage (MA) plans. Still, only about 27 percent of Medicare
enrollees’ total dental expenditures are paid by an insurer. We also find substantial
differences in dental utilization and spending by race and ethnicity and income. Black
Medicare enrollees have lower expenditures than other racial and ethnic groups. People
with incomes above 400 percent of the federal poverty level (FPL) have far greater
expenditures than those with incomes below the FPL. Most enrollees who use any
dental services use preventive services, but those with the highest expenditures have
greater utilization of extensive procedures (e.g., fillings and extractions). These findings
suggest Medicare enrollees could benefit substantially from policies that would expand
dental coverage. Spending burdens would likely be lessened for those with significant
spending now, and more enrollees would likely obtain needed dental care.
U S H EA L T H R EF O R M—MO N I T O R I N G A N D I MP A C T
Is a Dental Benefit Needed in
Medicare? Patterns of Dental Care Spending and Use
Support for this research was provided by the Robert Wood Johnson Foundation. The views expressed here do not necessarily reflect the views of the Foundation.

2 I S A D E N T A L B E N E F I T N E E DE D I N M E D I C A R E ?
About US Health Reform—Monitoring and Impact
With support from the Robert Wood Johnson Foundation, the Urban Institute is undertaking a comprehensive monitoring and tracking project to examine the implementation and effects of health reform. Through the US Health Reform—Monitoring and Impact project, which began in May 2011, Urban researchers are using microsimulation modeling to project the cost and coverage implications of proposed health reforms, documenting the implementation of national and state health reforms, and providing technical assistance to states. More information and publications can be found at www.rwjf.org and www.urban.org.
Background
People eligible for Medicare in the US have high rates of oral diseases. A 2019 report from the Centers
for Disease Control and Prevention’s Oral Health Division documented the widespread prevalence of
dental caries, dental decay, and tooth loss among adults ages 65 and older, who constitute the largest
share of the Medicare-eligible population (CDC 2019). The report showed that between 2011 and
2016 almost all adults ages 65 and older had dental caries (96.2 percent), and 17.3 percent had lost all
of their natural teeth. Further, 15.9 percent of dentate adults (those with some or all of their natural
teeth) ages 65 and older had untreated tooth decay, and this rate was higher among Black adults (29.1
percent), Mexican Americans (35.9 percent), elderly adults with low incomes (28.6 percent), and
current smokers (33.9 percent). Less is known about the prevalence of oral diseases among nonelderly
adults with disabilities, who also may be eligible for Medicare benefits. Adults with disabilities have
poorer oral health than their nondisabled counterparts (Armour et al. 2008; Owens et al. 2006; Wilson
et al. 2018). Poor oral health is also linked with adverse health outcomes in nonoral indicators,
including cardiovascular diseases (DeStefano et al. 1993; Dietrich et al. 2013, 2017; Schenkein and
Loos 2013; Tonetti and Van Dyke 2013), kidney diseases (Akar et al. 2011; Ruokonen et al. 2017), and
mental health (Kisely 2016; Kisely et al. 2015). An analysis of the predictors of unmet dental health
needs using 2018 Behavioral Risk Factor Surveillance System data found that men, elderly adults,
adults with lower incomes, and adults with lower educational attainment were less likely to have seen
a dentist within the past five years and more likely to have lost their permanent teeth (Gaskin et al.
2021).
Despite the burden of oral disease among Medicare beneficiaries, traditional Medicare does not
cover dental care. Some beneficiaries have access to dental coverage outside traditional Medicare,
such as through employer-sponsored retiree plans or supplemental dental benefit policies. MA plans
can also offer dental benefits as a supplemental benefit to enrollees, sometimes charging an additional
premium for the coverage. The various sources through which Medicare-eligible adults receive dental
benefits create a patchwork of coverage for this population. As of 2019, 23.6 million Medicare
beneficiaries (47 percent) lacked dental coverage (Freed et al. 2021).

I S A D E N T A L B E N E F I T N E E DE D I N M E D I C A R E ? 3
For Medicare beneficiaries with supplemental dental coverage, dental benefits vary across plans.
For the 29 percent of Medicare beneficiaries with access to dental benefits through MA plans in 2019,
nearly all were in plans that covered most preventive services, such as cleanings and x-rays (Freed et
al. 2021). A smaller share were in plans that covered services such as extractions (83 percent) or
endodontics (63 percent). In addition to MA, 16 percent of Medicare enrollees had coverage for dental
services through private plans, including employer-sponsored retiree coverage and individually
purchased insurance. Dental coverage through Medicaid for eligible Medicare beneficiaries also varies
by state; in 2019, 3 states provided no coverage for dental services, whereas 19 states provided more
comprehensive dental benefits covering major procedures (CHCS 2019).
Given the lack of comprehensive dental coverage in traditional Medicare, several policymakers
have introduced legislation in recent years to fill this gap. In August 2021, the Senate passed the fiscal
year 2022 budget resolution, adding dental, vision, and hearing benefits to Medicare, among other
initiatives.1 In 2019, the US House of Representatives passed the Elijah E. Cummings Lower Drug
Costs Now Act,2 which included a provision adding dental benefits under Medicare Part B. In July
2021, Representative Lloyd Doggett (D-TX) introduced the Medicare Dental, Vision, and Hearing
Benefit Act of 2021, which would cover the total cost of preventive dental services (i.e., require no
cost sharing for beneficiaries) and phase in coverage for minor and major services up to 80 percent
over four years.3 Many iterations of comprehensive single-payer coverage also include dental benefits,
one of which the Urban Institute evaluated in 2019 (Blumberg et al. 2019).
To explore the context surrounding proposed legislation that would extend dental benefits to
Medicare beneficiaries and guide development of an expanded dental benefit, we describe utilization
of and spending on dental services among Medicare beneficiaries. Our brief augments previous recent
work (Freed et al. 2021; Willink et al. 2020) by incorporating analysis of the Medical Expenditure Panel
Survey (MEPS) alongside the Urban Institute’s Medicare policy simulation model (MCARE-SIM) to
portray a more complete picture of dental service utilization among Medicare beneficiaries.
Data and Methods
We use two data sources in this analysis. We first use data from the 2015–18 MEPS to assess dental
use and spending across people of all ages.4 The MEPS is a nationally representative panel survey of
households, clinicians, and employers administered by the Agency for Healthcare Research and
Quality. Specifically, the MEPS provides information on respondents’ use of dental care services,
including whether they had any dental visits in the past year and the number of total dental visits they
had in the past year. The MEPS further reports total dental expenditures and total out-of-pocket
dental expenditures accrued over the past year. We present per capita averages of these outcomes by
age group.
We use the Urban Institute’s MCARE-SIM to investigate 2020 dental use and spending patterns
among Medicare enrollees. MCARE-SIM uses data from the 2015 Medicare Current Beneficiary
Survey (MCBS) and projects Medicare enrollment and spending estimates to 2020. The MCBS
4 I S A D E N T A L B E N E F I T N E E DE D I N M E D I C A R E ?
provides nationwide information on demographic characteristics, medical expenditures, use of medical
services, health status, access to health care, and sources of supplemental insurance coverage for
Medicare enrollees. To project dental spending to 2020, we assume a growth rate that is the average
of Parts A, B, and D growth rate projections from the 2019 Medicare Trustees report (Medicare
Trustees 2019). We estimate 2020 dental care utilization and both total and out-of-pocket dental
expenditures for Medicare beneficiaries overall. We further examine these outcomes by the following
subgroups: Medicare coverage type (fee-for-service coverage versus MA plans), race and ethnicity
(white, Black, Hispanic, or other non-Hispanic race),5 income group (below the FPL, between 100 and
200 percent of FPL, between 200 and 400 percent of FPL, and at or above 400 percent of FPL), and
dual Medicaid enrollment status.6
Finally, about 57 percent of dental events reported in the 2015 MCBS provide information on the
types of procedures beneficiaries undergo during their visits, including bonding, bridges, cleaning,
crowns, exams, extractions, fillings, orthodontic care, periodontal care, root canals, surgery, x-rays, and
other procedures. Among MCBS respondents who had any dental use and responded to the dental
procedures question, we estimate the share who experienced each of these procedures.
Results
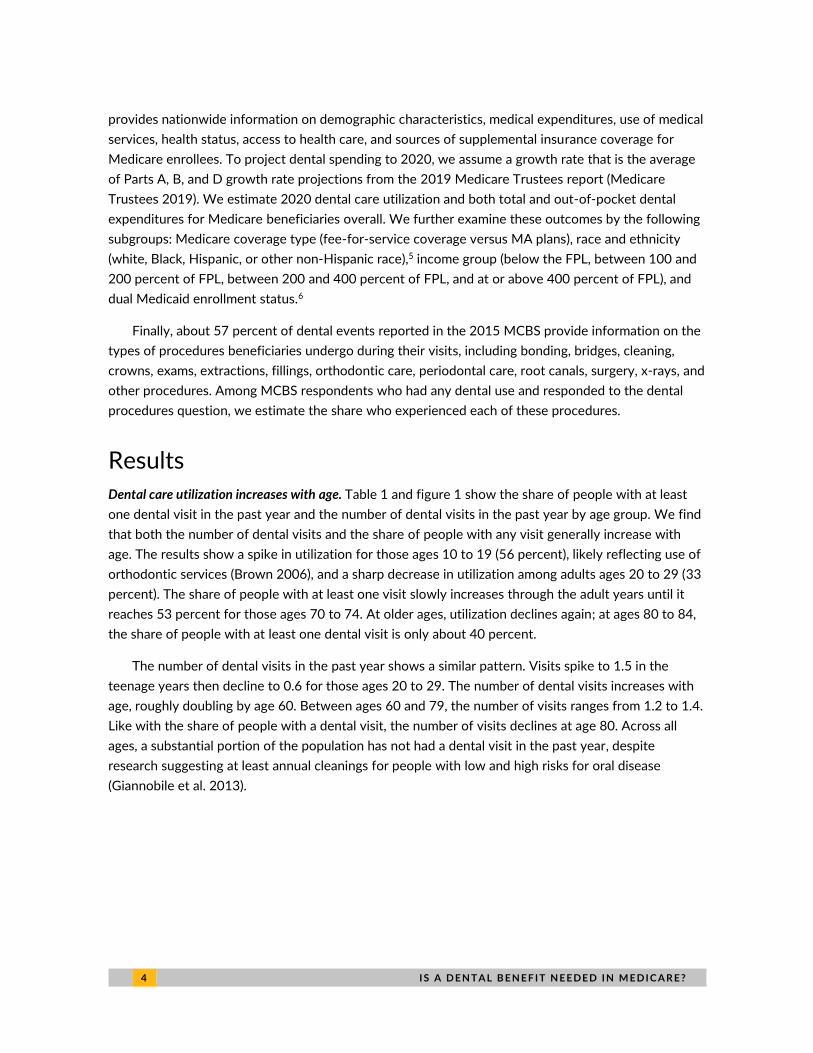
Dental care utilization increases with age. Table 1 and figure 1 show the share of people with at least
one dental visit in the past year and the number of dental visits in the past year by age group. We find
that both the number of dental visits and the share of people with any visit generally increase with
age. The results show a spike in utilization for those ages 10 to 19 (56 percent), likely reflecting use of
orthodontic services (Brown 2006), and a sharp decrease in utilization among adults ages 20 to 29 (33
percent). The share of people with at least one visit slowly increases through the adult years until it
reaches 53 percent for those ages 70 to 74. At older ages, utilization declines again; at ages 80 to 84,
the share of people with at least one dental visit is only about 40 percent.
The number of dental visits in the past year shows a similar pattern. Visits spike to 1.5 in the
teenage years then decline to 0.6 for those ages 20 to 29. The number of dental visits increases with
age, roughly doubling by age 60. Between ages 60 and 79, the number of visits ranges from 1.2 to 1.4.
Like with the share of people with a dental visit, the number of visits declines at age 80. Across all
ages, a substantial portion of the population has not had a dental visit in the past year, despite
research suggesting at least annual cleanings for people with low and high risks for oral disease
(Giannobile et al. 2013).

I S A D E N T A L B E N E F I T N E E DE D I N M E D I C A R E ? 5
TABLE 1
Dental Care Use in the Past Year, by Age, 2015–18
Age group Any dental visits in the
past year (%) Number of dental visits in
the past year
9 and younger 43 0.7 10–19 56 1.5 20–29 33 0.6 30–39 37 0.8 40–49 41 0.8 50–59 46 1.0 60–64 50 1.2 65–69 52 1.3 70–74 53 1.4 75–79 50 1.3 80–84 40 1.1 85 and older 42 1.1
Source: 2015–18 Medical Expenditure Panel Survey.
Note: Estimates are weighted using Medical Expenditure Panel Survey weights.
FIGURE 1
Average Total Dental Care Expenditures per Person, by Age, 2015–18
URBAN INSTITUTE
Source: 2015–18 Medical Expenditure Panel Survey.
Note: Estimates are weighted using Medical Expenditure Panel Survey weights and reflect dental services used in the past year.
6 I S A D E N T A L B E N E F I T N E E DE D I N M E D I C A R E ?
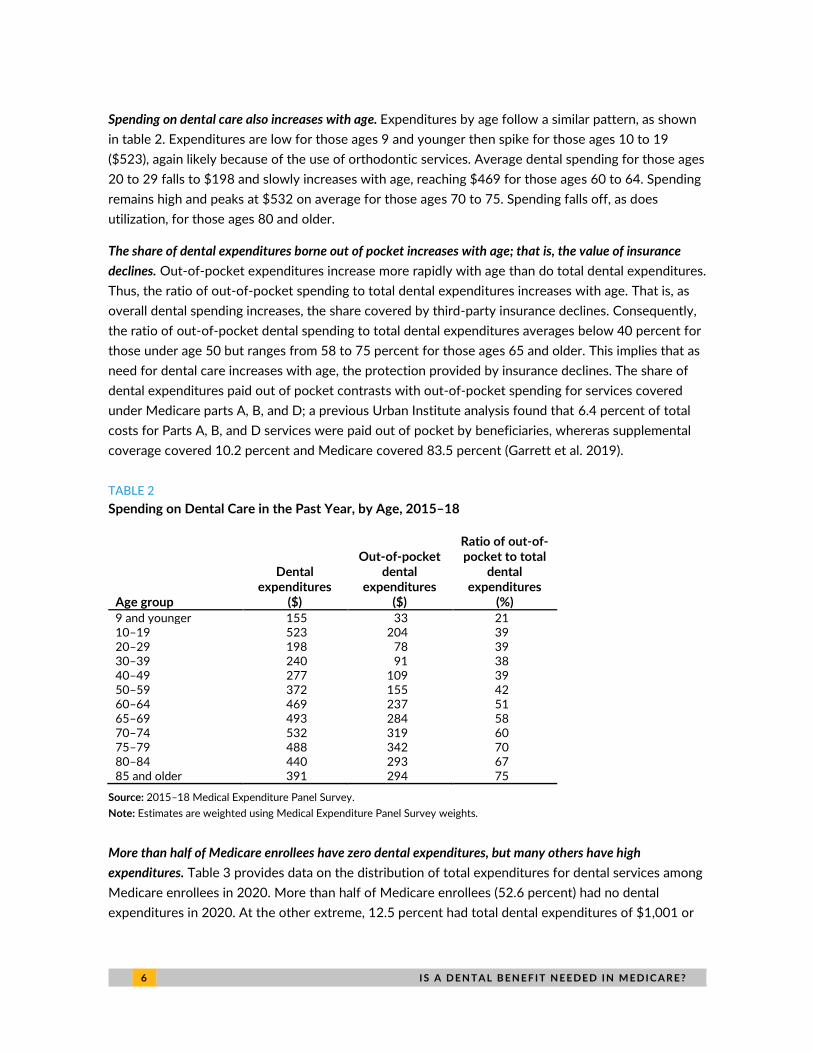
Spending on dental care also increases with age. Expenditures by age follow a similar pattern, as shown
in table 2. Expenditures are low for those ages 9 and younger then spike for those ages 10 to 19
($523), again likely because of the use of orthodontic services. Average dental spending for those ages
20 to 29 falls to $198 and slowly increases with age, reaching $469 for those ages 60 to 64. Spending
remains high and peaks at $532 on average for those ages 70 to 75. Spending falls off, as does
utilization, for those ages 80 and older.
The share of dental expenditures borne out of pocket increases with age; that is, the value of insurance
declines. Out-of-pocket expenditures increase more rapidly with age than do total dental expenditures.
Thus, the ratio of out-of-pocket spending to total dental expenditures increases with age. That is, as
overall dental spending increases, the share covered by third-party insurance declines. Consequently,
the ratio of out-of-pocket dental spending to total dental expenditures averages below 40 percent for
those under age 50 but ranges from 58 to 75 percent for those ages 65 and older. This implies that as
need for dental care increases with age, the protection provided by insurance declines. The share of
dental expenditures paid out of pocket contrasts with out-of-pocket spending for services covered
under Medicare parts A, B, and D; a previous Urban Institute analysis found that 6.4 percent of total
costs for Parts A, B, and D services were paid out of pocket by beneficiaries, whereras supplemental
coverage covered 10.2 percent and Medicare covered 83.5 percent (Garrett et al. 2019).
TABLE 2
Spending on Dental Care in the Past Year, by Age, 2015–18
Age group
Dental expenditures
($)
Out-of-pocket dental
expenditures ($)
Ratio of out-of-pocket to total
dental expenditures
(%)
9 and younger 155 33 21 10–19 523 204 39 20–29 198 78 39 30–39 240 91 38 40–49 277 109 39 50–59 372 155 42 60–64 469 237 51 65–69 493 284 58 70–74 532 319 60 75–79 488 342 70 80–84 440 293 67 85 and older 391 294 75
Source: 2015–18 Medical Expenditure Panel Survey.
Note: Estimates are weighted using Medical Expenditure Panel Survey weights.
More than half of Medicare enrollees have zero dental expenditures, but many others have high
expenditures. Table 3 provides data on the distribution of total expenditures for dental services among
Medicare enrollees in 2020. More than half of Medicare enrollees (52.6 percent) had no dental
expenditures in 2020. At the other extreme, 12.5 percent had total dental expenditures of $1,001 or
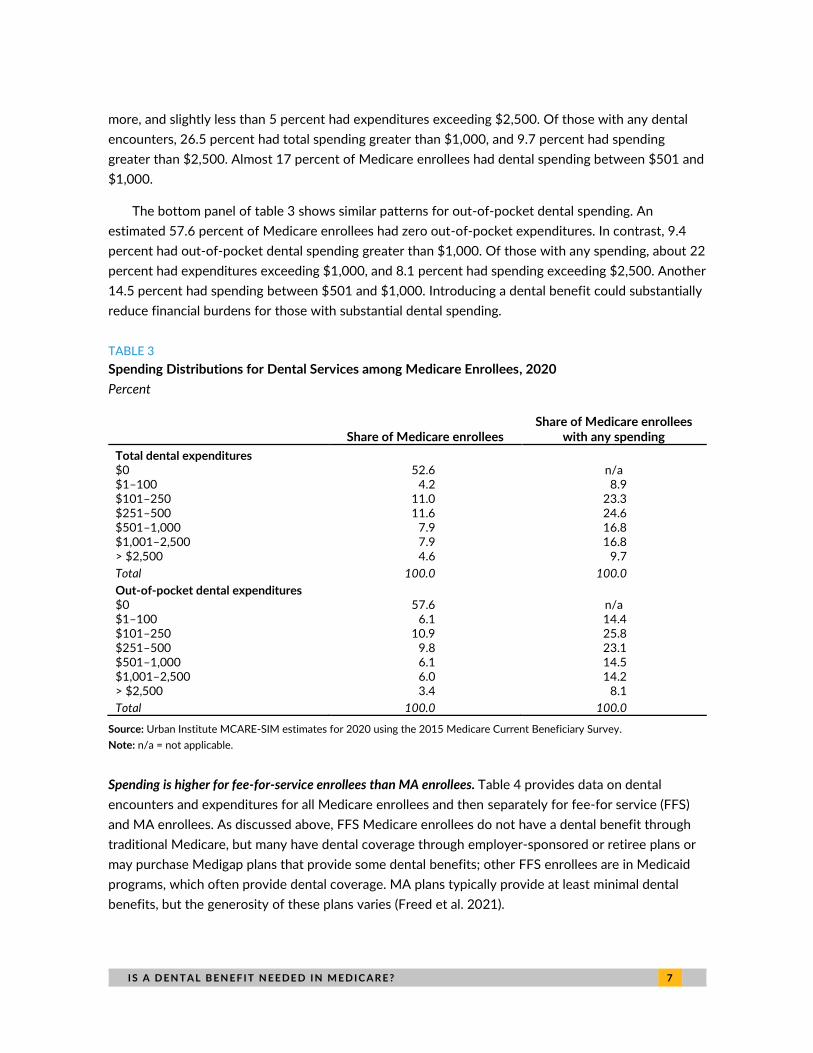
I S A D E N T A L B E N E F I T N E E DE D I N M E D I C A R E ? 7
more, and slightly less than 5 percent had expenditures exceeding $2,500. Of those with any dental
encounters, 26.5 percent had total spending greater than $1,000, and 9.7 percent had spending
greater than $2,500. Almost 17 percent of Medicare enrollees had dental spending between $501 and
$1,000.
The bottom panel of table 3 shows similar patterns for out-of-pocket dental spending. An
estimated 57.6 percent of Medicare enrollees had zero out-of-pocket expenditures. In contrast, 9.4
percent had out-of-pocket dental spending greater than $1,000. Of those with any spending, about 22
percent had expenditures exceeding $1,000, and 8.1 percent had spending exceeding $2,500. Another
14.5 percent had spending between $501 and $1,000. Introducing a dental benefit could substantially
reduce financial burdens for those with substantial dental spending.
TABLE 3
Spending Distributions for Dental Services among Medicare Enrollees, 2020
Percent
Share of Medicare enrollees Share of Medicare enrollees
with any spending
Total dental expenditures
$0 52.6 n/a $1–100 4.2 8.9 $101–250 11.0 23.3 $251–500 11.6 24.6 $501–1,000 7.9 16.8 $1,001–2,500 7.9 16.8 > $2,500 4.6 9.7
Total 100.0 100.0
Out-of-pocket dental expenditures $0 57.6 n/a $1–100 6.1 14.4 $101–250 10.9 25.8 $251–500 9.8 23.1 $501–1,000 6.1 14.5 $1,001–2,500 6.0 14.2 > $2,500 3.4 8.1
Total 100.0 100.0
Source: Urban Institute MCARE-SIM estimates for 2020 using the 2015 Medicare Current Beneficiary Survey.
Note: n/a = not applicable.
Spending is higher for fee-for-service enrollees than MA enrollees. Table 4 provides data on dental
encounters and expenditures for all Medicare enrollees and then separately for fee-for service (FFS)
and MA enrollees. As discussed above, FFS Medicare enrollees do not have a dental benefit through
traditional Medicare, but many have dental coverage through employer-sponsored or retiree plans or
may purchase Medigap plans that provide some dental benefits; other FFS enrollees are in Medicaid
programs, which often provide dental coverage. MA plans typically provide at least minimal dental
benefits, but the generosity of these plans varies (Freed et al. 2021).
8 I S A D E N T A L B E N E F I T N E E DE D I N M E D I C A R E ?
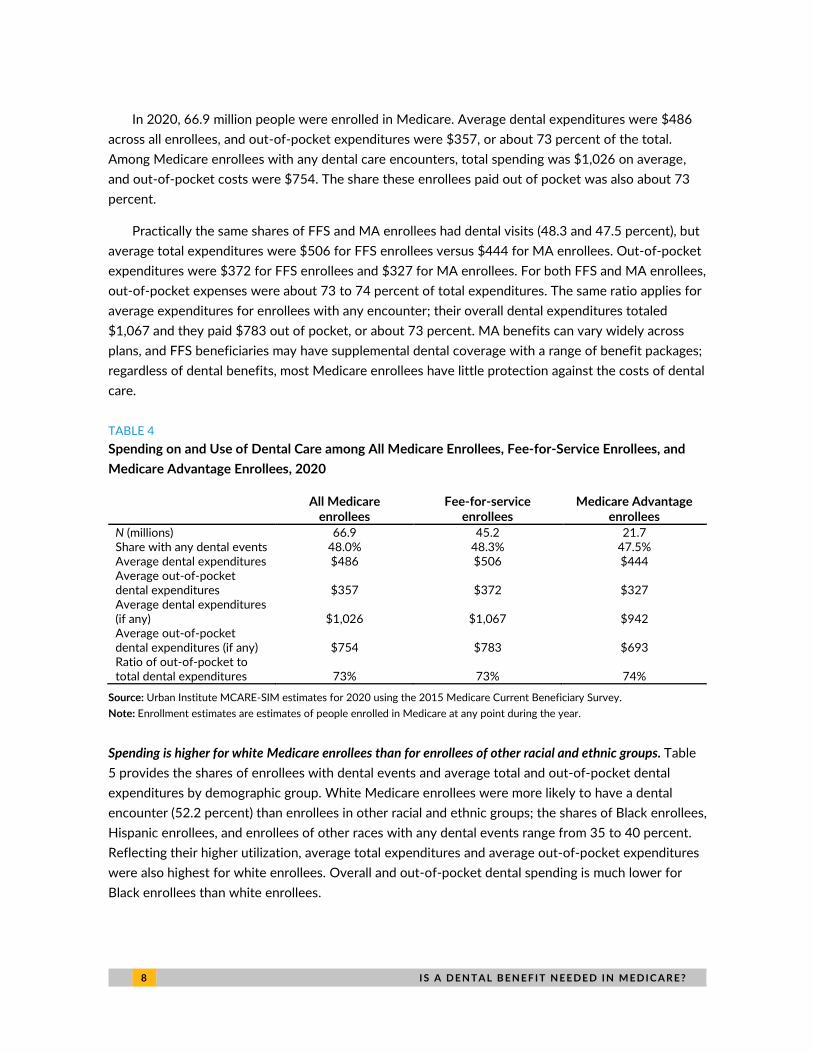
In 2020, 66.9 million people were enrolled in Medicare. Average dental expenditures were $486
across all enrollees, and out-of-pocket expenditures were $357, or about 73 percent of the total.
Among Medicare enrollees with any dental care encounters, total spending was $1,026 on average,
and out-of-pocket costs were $754. The share these enrollees paid out of pocket was also about 73
percent.
Practically the same shares of FFS and MA enrollees had dental visits (48.3 and 47.5 percent), but
average total expenditures were $506 for FFS enrollees versus $444 for MA enrollees. Out-of-pocket
expenditures were $372 for FFS enrollees and $327 for MA enrollees. For both FFS and MA enrollees,
out-of-pocket expenses were about 73 to 74 percent of total expenditures. The same ratio applies for
average expenditures for enrollees with any encounter; their overall dental expenditures totaled
$1,067 and they paid $783 out of pocket, or about 73 percent. MA benefits can vary widely across
plans, and FFS beneficiaries may have supplemental dental coverage with a range of benefit packages;
regardless of dental benefits, most Medicare enrollees have little protection against the costs of dental
care.
TABLE 4
Spending on and Use of Dental Care among All Medicare Enrollees, Fee-for-Service Enrollees, and
Medicare Advantage Enrollees, 2020
All Medicare
enrollees Fee-for-service
enrollees Medicare Advantage
enrollees
N (millions) 66.9 45.2 21.7 Share with any dental events 48.0% 48.3% 47.5% Average dental expenditures $486 $506 $444 Average out-of-pocket dental expenditures $357 $372 $327 Average dental expenditures (if any) $1,026 $1,067 $942 Average out-of-pocket dental expenditures (if any) $754 $783 $693 Ratio of out-of-pocket to total dental expenditures 73% 73% 74%
Source: Urban Institute MCARE-SIM estimates for 2020 using the 2015 Medicare Current Beneficiary Survey.
Note: Enrollment estimates are estimates of people enrolled in Medicare at any point during the year.
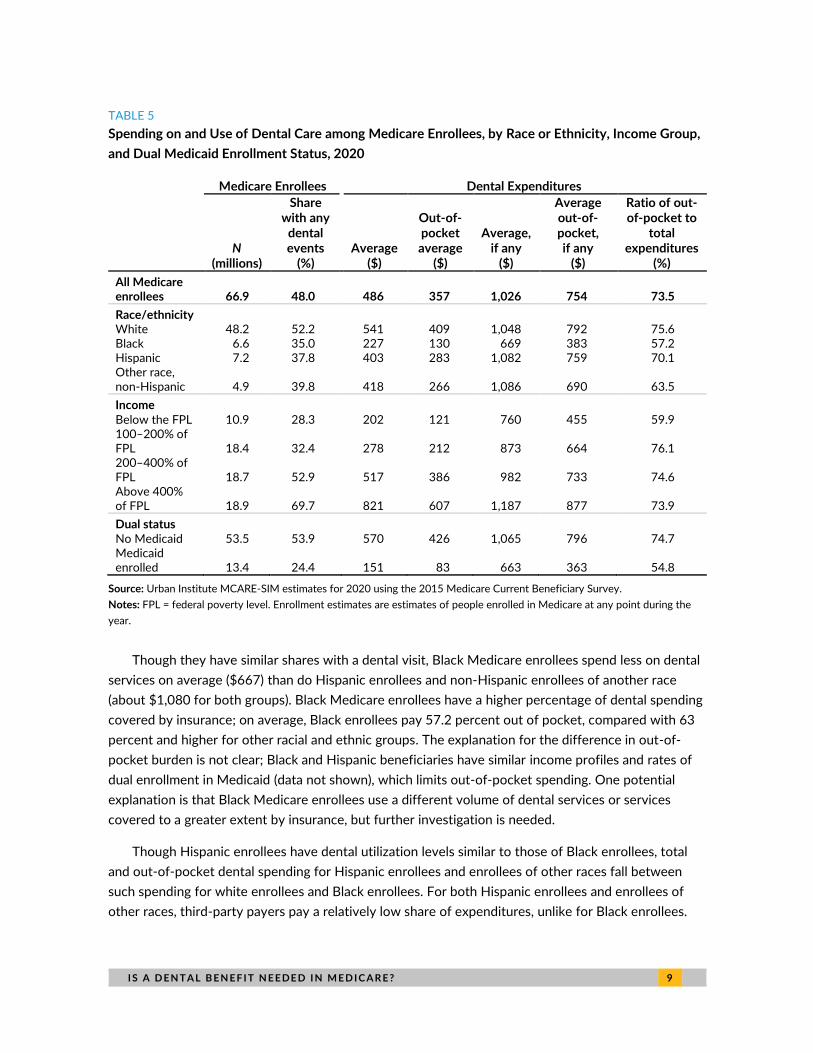
Spending is higher for white Medicare enrollees than for enrollees of other racial and ethnic groups. Table
5 provides the shares of enrollees with dental events and average total and out-of-pocket dental
expenditures by demographic group. White Medicare enrollees were more likely to have a dental
encounter (52.2 percent) than enrollees in other racial and ethnic groups; the shares of Black enrollees,
Hispanic enrollees, and enrollees of other races with any dental events range from 35 to 40 percent.
Reflecting their higher utilization, average total expenditures and average out-of-pocket expenditures
were also highest for white enrollees. Overall and out-of-pocket dental spending is much lower for
Black enrollees than white enrollees.
I S A D E N T A L B E N E F I T N E E DE D I N M E D I C A R E ? 9
TABLE 5
Spending on and Use of Dental Care among Medicare Enrollees, by Race or Ethnicity, Income Group,
and Dual Medicaid Enrollment Status, 2020
Medicare Enrollees Dental Expenditures
N
(millions)
Share with any
dental events
(%) Average
($)
Out-of-pocket average
($)
Average, if any
($)
Average out-of-pocket, if any
($)
Ratio of out-of-pocket to
total expenditures
(%)
All Medicare enrollees 66.9 48.0 486 357 1,026 754 73.5
Race/ethnicity White 48.2 52.2 541 409 1,048 792 75.6 Black 6.6 35.0 227 130 669 383 57.2 Hispanic 7.2 37.8 403 283 1,082 759 70.1 Other race, non-Hispanic 4.9 39.8 418 266 1,086 690 63.5
Income
Below the FPL 10.9 28.3 202 121 760 455 59.9 100–200% of FPL 18.4 32.4 278 212 873 664 76.1 200–400% of FPL 18.7 52.9 517 386 982 733 74.6 Above 400% of FPL 18.9 69.7 821 607 1,187 877 73.9
Dual status
No Medicaid 53.5 53.9 570 426 1,065 796 74.7 Medicaid enrolled 13.4 24.4 151 83 663 363 54.8
Source: Urban Institute MCARE-SIM estimates for 2020 using the 2015 Medicare Current Beneficiary Survey.
Notes: FPL = federal poverty level. Enrollment estimates are estimates of people enrolled in Medicare at any point during the
year.
Though they have similar shares with a dental visit, Black Medicare enrollees spend less on dental
services on average ($667) than do Hispanic enrollees and non-Hispanic enrollees of another race
(about $1,080 for both groups). Black Medicare enrollees have a higher percentage of dental spending
covered by insurance; on average, Black enrollees pay 57.2 percent out of pocket, compared with 63
percent and higher for other racial and ethnic groups. The explanation for the difference in out-of-
pocket burden is not clear; Black and Hispanic beneficiaries have similar income profiles and rates of
dual enrollment in Medicaid (data not shown), which limits out-of-pocket spending. One potential
explanation is that Black Medicare enrollees use a different volume of dental services or services
covered to a greater extent by insurance, but further investigation is needed.
Though Hispanic enrollees have dental utilization levels similar to those of Black enrollees, total
and out-of-pocket dental spending for Hispanic enrollees and enrollees of other races fall between
such spending for white enrollees and Black enrollees. For both Hispanic enrollees and enrollees of
other races, third-party payers pay a relatively low share of expenditures, unlike for Black enrollees.

1 0 I S A D E N T A L B E N E F I T N E E DE D I N M E D I C A R E ?
Medicare enrollees with high incomes have much higher dental care spending than those with low incomes.
Dental care utilization varies considerably by income. In 2020, only 28.3 percent of Medicare enrollees
with incomes below the FPL had a dental encounter in the past year. Conversely, 69.7 percent of
enrollees with incomes above 400 percent of FPL had a dental encounter. Overall expenditures for
those with incomes below the FPL were $202 and out-of-pocket expenditures were $121. For
enrollees with incomes below the FPL who had had a dental care encounter, spending was $760; of
this, $455 was spent out of pocket. The ratio of out-of-pocket to total spending for this income group
was relatively low, 59.9 percent, possibly because Medicare enrollees in this income group are more
likely to be dually enrolled in Medicaid.
Dental utilization and spending were higher among those with incomes above the FPL; the shares
of enrollees with dental visits were 32.4 percent for those with incomes between 100 and 200
percent of FPL, 52.9 percent for those with incomes between 200 and 400 percent of FPL, and 69.7
percent for those with incomes above 400 percent of FPL. These rates are reflected in dental
expenditures, which range from $202 for those with incomes below the FPL to $821 for those with
incomes above 400 percent of FPL. Average spending for people with any dental encounter ranged
from $760 for those with incomes below the FPL to $1,187 for those with incomes above 400 percent
of FPL. The amount of dental care paid out of pocket by those with incomes above the FPL was also
higher; enrollees with incomes between 100 to 200 percent of FPL paid the most out of pocket (76.1
percent of dental spending), and higher-income groups paid slightly lower shares out of pocket.
Spending is relatively low for Medicare enrollees dually enrolled in Medicaid, but Medicaid pays a higher
share of their spending. The bottom rows of table 5 stratify results by whether a Medicare enrollee is
dually enrolled in Medicaid. Of the 66.9 million Medicare enrollees in 2020, 13.4 million were also
enrolled in Medicaid. The shares of Medicare beneficiaries with dental visits varied considerably by
dual Medicaid enrollment status. Of those without Medicaid, 53.9 percent had a dental visit, whereas
only 24.4 percent enrolled in Medicaid had a dental visit. This is reflected in spending that varies from
$151 for enrollees with Medicaid to $570 for enrollees without Medicaid. For those dually enrolled in
Medicare and Medicaid, however, both their out-of-pocket spending and ratio of out-of-pocket
spending to total spending were relatively low; these beneficiaries paid for 54.8 percent of their
expenditures, compared with 74.7 percent among Medicare enrollees who did not have Medicaid.
Dual enrollees had somewhat better protection against out-of-pocket costs but had much lower
spending. This could reflect a dental benefit that provided relatively little access to care but paid a high
share of the cost of care received.
Medicare beneficiaries most commonly used preventive dental services such as exams, cleanings, and x-
rays. In table 6, we examine the types of procedures used by Medicare beneficiaries who had any
dental events in 2020. The second column shows that 73 percent of Medicare beneficiaries who used
dental services had a cleaning, 62 percent had an exam, and 34 percent had x-rays. Considering the
more extensive procedures, 16 percent of enrollees had fillings and 10 percent had extractions.
Medicare enrollees with high dental spending are more likely to have had procedures such as
bridges, crowns, extractions, fillings, and root canals. The third column of table 6 shows use of

I S A D E N T A L B E N E F I T N E E DE D I N M E D I C A R E ? 1 1
procedures by high spenders, or those with dental expenditures greater than the 90th percentile of
expenditures. This group also had high utilization levels for preventive services; 59 percent of high
dental spenders had cleanings and 65 percent had an exam. However, this group stands out for its
greater use of extensive procedures: 43 percent had a crown, 18 percent had a root canal, and 8
percent had a bridge, compared with 9 percent, 4 percent, and 2 percent of the overall Medicare
population using dental services. Moreover, 22 percent of high-expenditure enrollees had extractions,
20 percent had fillings, 18 percent had a root canal, and another 18 percent had other procedures.
Thus, the typical services used by most Medicare beneficiaries are preventive, but enrollees with high
expenditures have greater use of more extensive procedures in addition to preventive services.
TABLE 6
Share of Beneficiaries with a Dental Procedure, by Procedure Type, 2020
Percent
Procedure type All beneficiaries with any
dental events
All beneficiaries with dental expenditures greater than the
90th percentile
Preventive Cleaning 73 59 Exam 62 65 X-ray 34 40
Extensive Bridge 2 8 Crown 9 43 Extraction 10 22 Filling 16 20 Orthodontist 0 1 Other procedure 7 18 Root canal 4 18 Periodontal 2 3 Bonding 1 1 Surgery 1 4
Source: Urban Institute MCARE-SIM estimates for 2020 using the 2015 Medicare Current Beneficiary Survey.
Note: Sample restricted to respondents who reported dental events and had nonmissing information on dental procedures.
Discussion
The results presented above show why Congress is considering adding a dental benefit to Medicare.
Dental spending is higher among Medicare enrollees than among younger adults, and Medicare
enrollees pay a larger share of these expenditures out of pocket than do younger adults. The share of
dental costs paid out of pocket increases as spending increases, suggesting insurance is less valuable
at higher spending levels. The distribution of dental spending is skewed, as is other health care
spending; more than 50 percent of Medicare beneficiaries have no dental use or spending, despite
recommendations for regular cleanings and checkups to prevent oral disease. However, some
Medicare beneficiaries incur high dental expenditures with more extensive procedures, such as
1 2 I S A D E N T A L B E N E F I T N E E DE D I N M E D I C A R E ?
bridges and crowns, and nearly 10 percent of beneficiaries paid more than $1,000 out of pocket for
dental care.
Spending levels are somewhat higher for FFS enrollees than MA enrollees, perhaps reflecting the
differences in the age, income, health, and geographic compositions of the two populations.
Regardless, most dental spending is not covered by insurance; about 73 percent of expenditures are
paid out of pocket by both enrollee groups.
Dental spending differences vary considerably by race. Consistent with other research (Zhang,
Wu, and Wu 2019), we find that white enrollees are far more likely to have dental encounters and
have higher expenditures than all other enrollee groups. Spending for Black enrollees is low not just
compared with white enrollees but also compared with other racial and ethnic groups. This could
reflect the greater likelihood of Black enrollees having Medicaid coverage, which covers more of the
cost of dental services. However, this does not seem to result in greater access to or use of dental
services. In addition, Hispanic enrollees are just as likely to be covered by Medicaid, so this cannot be
the full explanation.7
Spending differences by income are also large. Those with incomes above 400 percent of FPL are
far more likely to have a dental encounter and have much greater expenditures than those with lower
incomes. Nearly 70 percent of Medicare enrollees with incomes above 400 percent of FPL had a
dental visit in 2020, but only about 30 percent of the 29.3 million beneficiaries with income below 200
percent of FPL had a dental visit. If utilization and spending by the highest-income group reflect the
group’s actual needed utilization and spending, then populations with lower incomes may have
significant unmet needs for dental care. In reality, lower-income groups may have a greater need for
dental care because of their higher rates of untreated tooth decay and missing teeth (CDC 2019).
The most commonly used dental services are preventive services, such as exams, cleanings, and x-
rays. However, those with higher dental expenditures have high use of procedures such as fillings,
extractions, bridges, crowns, and root canals. This suggests that use of these services can drive high
expenditures. Dental benefits that provide basic coverage for preventive services can benefit many
Medicare beneficiaries who do not currently use dental care, but basic benefits will not provide relief
for these high-cost dental procedures. If Medicare dental services are to be targeted to those with the
greatest need, protection against the high cost of these extensive procedures seems essential.
I S A D E N T A L B E N E F I T N E E DE D I N M E D I C A R E ? 1 3
Notes 1 Emily Cochrane, “Senate Passes $3.5 Trillion Budget Plan, Advancing Safety Net Expansion,” New York Times,
August 20, 2021, https://www.nytimes.com/2021/08/11/us/politics/senate-budget-plan.html.
2 Elijah E. Cummings Lower Drug Costs Now Act, H. R. 3, 116th Cong. (2019–20).
3 Medicare Dental, Vision, and Hearing Benefit Act of 2021, H. R. 4311, 117th Cong. (2021–22).
4 We use the IPUMS version of the MEPS in our analysis; see Blewett and colleagues (2019).
5 The racial and ethnic groups in this analysis are based on the terms used in our data sources, the Medicare Expenditure Panel Survey and Medicare Current Beneficiary Survey. For simplicity, we refer to non-Hispanic Black and non-Hispanic white populations as simply “Black” and “white.” We recognize that not all people in these groups identify with the terms we use, however, and remain committed to using respectful and inclusive language.
6 In our current analysis that uses the 2015 MCBS projected to 2020, we do not assess supplemental dental coverage. The Centers for Medicare & Medicaid Services reported a data issue that underreports rates of private dental coverage in and before 2016.
7 We estimate that about 35 percent of Black Medicare enrollees have dual Medicaid coverage, compared with 36 percent of Hispanic Medicare enrollees.
References Akar, Harun, Gulcan Coskun Akar, Juan Jesús Carrero, Peter Stenvinkel, and Bengt Lindholm. 2011. “Systemic
Consequences of Poor Oral Health in Chronic Kidney Disease Patients.” Clinical Journal of the American Society of Nephrology 6 (1): 218–26. https://doi.org/10.2215/CJN.05470610.
Armour, Brian S., Mark Swanson, H. Barry Waldman, and Steven P. Perlman. 2008. “A Profile of State-Level Differences in the Oral Health of People with and without Disabilities, in the U.S., in 2004.” Public Health Reports 123 (1): 67–75. https://doi.org/10.1177/003335490812300110.
Blewett, Lynn A., Julia A. Rivera Drew, Risa Griffin, and Kari C. W. Williams. 2019. “IPUMS Health Surveys: Medical Expenditure Panel Survey, Version 1.1” [dataset]. Minneapolis: Integrated Public Use Microdata Series. https://doi.org/10.18128/D071.V1.1.
Blumberg, Linda J., John Holahan, Matthew Buettgens, Anuj Gangopadhyaya, Bowen Garrett, Adele Shartzer, Michael Simpson, Robin Wang, Melissa Favreault, and Diane Arnos. 2019. From Incremental to Comprehensive Health Reform: How Various Reform Options Compare on Coverage and Costs. Washington, DC: Urban Institute.
Brown, Erwin. 2006. “Children's Dental Visits and Expenses, United States, 2003.” Rockville, MD: Agency for Healthcare Research and Quality.
CDC (Centers for Disease Control and Prevention). 2019. Oral Health Surveillance Report: Trends in Dental Caries and Sealants, Tooth Retention, and Edentulism, United States, 1999–2004 to 2011–2016. Atlanta: Centers for Disease Control and Prevention.
CHCS (Center for Health Care Strategies). 2019. “Medicaid Adult Benefits: An Overview.” Hamilton, NJ: Center for Health Care Strategies.
DeStefano, F., R. F. Anda, H. S. Kahn, D. F. Williamson, and C. M. Russell. 1993. “Dental Disease and Risk of Coronary Heart Disease and Mortality.” British Medical Journal 306:688. https://doi.org/10.1136/bmj.306.6879.688.
Dietrich, Thomas, Praveen Sharma, Clemens Walter, Paul Weston, and James Beck. 2013. “The Epidemiological Evidence behind the Association between Periodontitis and Incident Atherosclerotic Cardiovascular Disease.” Journal of Clinical Periodontology 40 (suppl. 14): S70–S84. https://doi.org/10.1111/jcpe.12062.
1 4 I S A D E N T A L B E N E F I T N E E DE D I N M E D I C A R E ?
Dietrich, T., I. Webb, L. Stenhouse, A. Pattni, D. Ready, K. L. Wanyonyi, S. White, and J. E. Gallagher. 2017. “Evidence Summary: The Relationship between Oral and Cardiovascular Disease.” British Dental Journal 222:381–85. https://doi.org/10.1038/sj.bdj.2017.224.
Freed, Meredith, Nancy Ochieng, Nolan Sroczynski, Anthony Damico, and Krutika Amin. 2021. “Medicare and Dental Coverage: A Closer Look.” San Francisco: Kaiser Family Foundation.
Garrett, Bowen, Anuj Gangopadhyaya, Adele Shartzer, and Diane Arnos. 2019. A Unified Cost-Sharing Design for Medicare: Effects on Beneficiary and Program Spending. Washington, DC: Urban Institute.
Gaskin, D. J., H. Zare, R. McCleary, O. Kanwar, and A. L. Davis. 2021. “Predictors of Unmet Dental Health Needs in US Adults in 2018: A Cross-Sectional Analysis.” JDR Clinical & Translational Research. https://doi.org/10.1177%2F23800844211035669.
Giannobile, W. V., T. M. Braun, A. K. Caplis, L. Doucette-Stamm, G. W. Duff, and K. S. Kornman. 2013. “Patient Stratification for Preventive Care in Dentistry.” Journal of Dental Research 92 (8): 694–701. https://dx.doi.org/10.1177%2F0022034513492336.
Kisely, Steve. 2016. “No Mental Health without Oral Health.” Canadian Journal of Psychiatry 61, no. 5. https://doi.org/10.1177%2F0706743716632523.
Kisely, Steve, Hooman Baghaei, Ratilal Lalloo, Dan Siskind, and Newell W. Johnson. 2015. “A Systematic Review and Meta-analysis of the Association between Poor Oral Health and Severe Mental Illness.” Psychosomatic Medicine 77 (1): 83–92. https://doi.org/10.1097/psy.0000000000000135.
Medicare Trustees (Boards of Trustees of the Federal Hospital Insurance and Federal Supplementary Medical Insurance Trust Funds). 2019. 2019 Annual Report of the Boards of Trustees of the Federal Hospital Insurance and Federal Supplementary Medical Insurance Trust Funds. Washington, DC: Medicare Trustees.
Owens, Pamela L., Bonnie D. Kerker, Edward Zigler, and Sarah M. Horowitz. 2006. “Vision and Oral Health Needs of Individuals with Intellectual Disability.” Mental Retardation and Developmental Disabilities Research Reviews 12:28–40. https://doi.org/10.1002/mrdd.20096.
Ruokonen, Hellevi, Karita Nylund, Jussi Furuholm, Jukka H. Meurman, Timo Sorsa, Karoliina Kotaniemi, Fernanda Ortiz, and Ana Maria Heikkinen. 2017. “Oral Health and Mortality in Patients with Chronic Kidney Disease.” Journal of Periodontology 88 (1): 26–33. https://doi.org/10.1902/jop.2016.160215.
Schenkein, Harvey A., and Bruno G. Loos. 2013. “Inflammatory Mechanisms Linking Periodontal Diseases to Cardiovascular Diseases.” Journal of Clinical Periodontology 40 (suppl. 14): S51–S69. https://doi.org/10.1111/jcpe.12060.
Tonetti, Maurizio S., and Thomas E. Van Dyke. 2013. “Periodontitis and Atherosclerotic Cardiovascular Disease: Consensus Report of the Joint EFP/AAP Workshop on Periodontitis and Systemic Diseases.” Journal of Clinical Periodontology 40 (suppl. 14): S24–S29. https://doi.org/10.1111/jcpe.12089.
Willink, Amber, Nicholas S. Reed, Bonnielin Swenor, Leah Leinbach, Eva H. DuGoff, and Karen Davis. 2020. “Dental, Vision, And Hearing Services: Access, Spending, And Coverage For Medicare Beneficiaries.” Health Affairs 39, no. 2. https://doi.org/10.1377/hlthaff.2019.00451.
Wilson, Nathan J., Zhen Lin, Amy Villarosa, and Ajesh George. 2018. “Oral Health Status and Reported Oral Health Problems in People with Intellectual Disability: A Literature Review.” Journal of Intellectual & Developmental Disability 44 (3): 292–304. https://doi.org/10.3109/13668250.2017.1409596.
Zhang, Wei, Yan Yan Wu, and Bei Wu. 2019. “Racial/Ethnic Disparities in Dental Service Utilization for Foreign-Born and U.S.-Born Middle-Aged and Older Adults.” Research on Aging 41 (9): 845–67. https://dx.doi.org/10.1177%2F0164027519860268.
I S A D E N T A L B E N E F I T N E E DE D I N M E D I C A R E ? 1 5
About the Authors
Adele Shartzer is a senior research associate in the Health Policy Center at the Urban Institute, where
her work focuses on health coverage, access to care, and the health care delivery system; her research
has been published in notable health policy journals. Before joining Urban, she worked as a program
analyst in the Office of Health Policy in the Office of the Assistant Secretary of Planning and
Evaluation at the US Department of Health and Human Services. She has also worked in health policy
at several nonprofits in the Washington, DC, area. Shartzer holds a bachelor’s degree in bioethics from
the University of Virginia and an MPH in health policy from George Washington University. She
received her PhD in health services research from the Johns Hopkins Bloomberg School of Public
Health.
Anuj Gangopadhyaya is a senior research associate in the Health Policy Center. His research focuses
on the impact of safety net programs on health and well-being, family income, and education
achievement outcomes for children in low-income families. He has focused on the impact of Medicaid
eligibility expansion on children’s education achievement, maternal and child health effects of the
earned income tax credit program, and the impact of the Affordable Care Act Medicaid expansion on
adult labor supply and fertility rates of women of reproductive age. He also helps lead Urban’s
Medicare simulation model (MCARE-SIM), estimating potential impacts of proposed policy changes on
program spending, beneficiary spending, and use of services. Gangopadhyaya received his PhD in
economics from the University of Illinois at Chicago.
John Holahan is an Institute fellow in the Health Policy Center, where he previously served as center
director for over 30 years. His recent work focuses on health reform, the uninsured, and health
expenditure growth, developing proposals for health system reform most recently in Massachusetts.
He examines the coverage, costs, and economic impact of the Affordable Care Act (ACA), including
the costs of Medicaid expansion as well as the macroeconomic effects of the law. He has also
analyzed the health status of Medicaid and exchange enrollees, and the implications for costs and
exchange premiums. Holahan has written on competition in insurer and provider markets and
implications for premiums and government subsidy costs as well as on the cost-containment
provisions of the ACA. Holahan has conducted significant work on Medicaid and Medicare reform,
including analyses on the recent growth in Medicaid expenditures, implications of block grants and
swap proposals on states and the federal government, and the effect of state decisions to expand
Medicaid in the ACA on federal and state spending. Recent work on Medicare includes a paper on
reforms that could both reduce budgetary impacts and improve the structure of the program. His work
on the uninsured explores reasons for the growth in the uninsured over time and the effects of
proposals to expand health insurance coverage on the number of uninsured and the cost to federal
and state governments.
Bowen Garrett is an economist and senior fellow in the Health Policy Center. His research focuses on
health reform and health policy topics, including health insurance and labor markets, Medicare’s
prospective payment systems, and evaluation of the Strong Start for Mothers and Newborns program.

1 6 I S A D E N T A L B E N E F I T N E E DE D I N M E D I C A R E ?
He leads the development of the Urban Institute’s Medicare policy simulation model (MCARE-SIM).
Previously, Garrett was chief economist of the Center for US Health System Reform and McKinsey
Advanced Health Analytics at McKinsey and Company. Garrett received his PhD in economics from
Columbia University in 1996 and was a postdoctoral research fellow in the Robert Wood Johnson
Foundation's Scholars in Health Policy Research Program at the University of California, Berkeley,
from 1996 to 1998.
Nikhil Rao is a research assistant in the Health Policy Center. His current research spans a variety of
topics, including Medicare policy, COVID-19, and health care quality. Rao graduated Phi Beta Kappa
from the University of North Carolina at Chapel Hill with a BSPH in health policy and management and
second major in psychology. He earned highest honors for his senior thesis in health policy and
management, which investigated the availability of medication for opioid use disorder in Black and
Hispanic communities in North Carolina.

I S A D E N T A L B E N E F I T N E E DE D I N M E D I C A R E ? 1 7
Acknowledgments
This brief was funded by the Robert Wood Johnson Foundation. The views expressed do not
necessarily reflect the views of the Foundation.
The views expressed are those of the authors and should not be attributed to the Urban Institute,
its trustees, or its funders. Funders do not determine research findings or the insights and
recommendations of Urban experts. Further information on the Urban Institute’s funding principles is
available at urban.org/fundingprinciples.
The authors thank Stephen Zuckerman for reviewing and providing feedback on the brief.
ABOUT THE URBAN INSTITUTE The nonprofit Urban Institute is a leading research organization dedicated to developing evidence-based insights that improve people’s lives and strengthen communities. For 50 years, Urban has been the trusted source for rigorous analysis of complex social and economic issues; strategic advice to policymakers, philanthropists, and practitioners; and new, promising ideas that expand opportunities for all. Our work inspires effective decisions that advance fairness and enhance the well-being of people and places.
Copyright © September 2021. Urban Institute. Permission is granted for reproduction of this file, with attribution to the Urban Institute.
500 L’Enfant Plaza SW Washington, DC 20024
www.urban.org


![Dental Foundation Training Portfolio User Guide[1]](https://static.fdocuments.in/doc/165x107/55cf9ab4550346d033a2fcee/dental-foundation-training-portfolio-user-guide1.jpg)
