SUPPORT FOR LIVABLE CITIES CASE STUDY COLOMBO, SRI LANKA LITERATURE REVIEW: TRANSPORT ... · ·...
19
SUPPORT FOR LIVABLE CITIES CASE STUDY COLOMBO, SRI LANKA LITERATURE REVIEW: TRANSPORT SITUATION Amal S. Kumarage November 2011
Transcript of SUPPORT FOR LIVABLE CITIES CASE STUDY COLOMBO, SRI LANKA LITERATURE REVIEW: TRANSPORT ... · ·...

SUPPORT FOR LIVABLE CITIES
CASE STUDY COLOMBO, SRI LANKA
LITERATURE REVIEW: TRANSPORT SITUATION
Amal S. Kumarage
November 2011
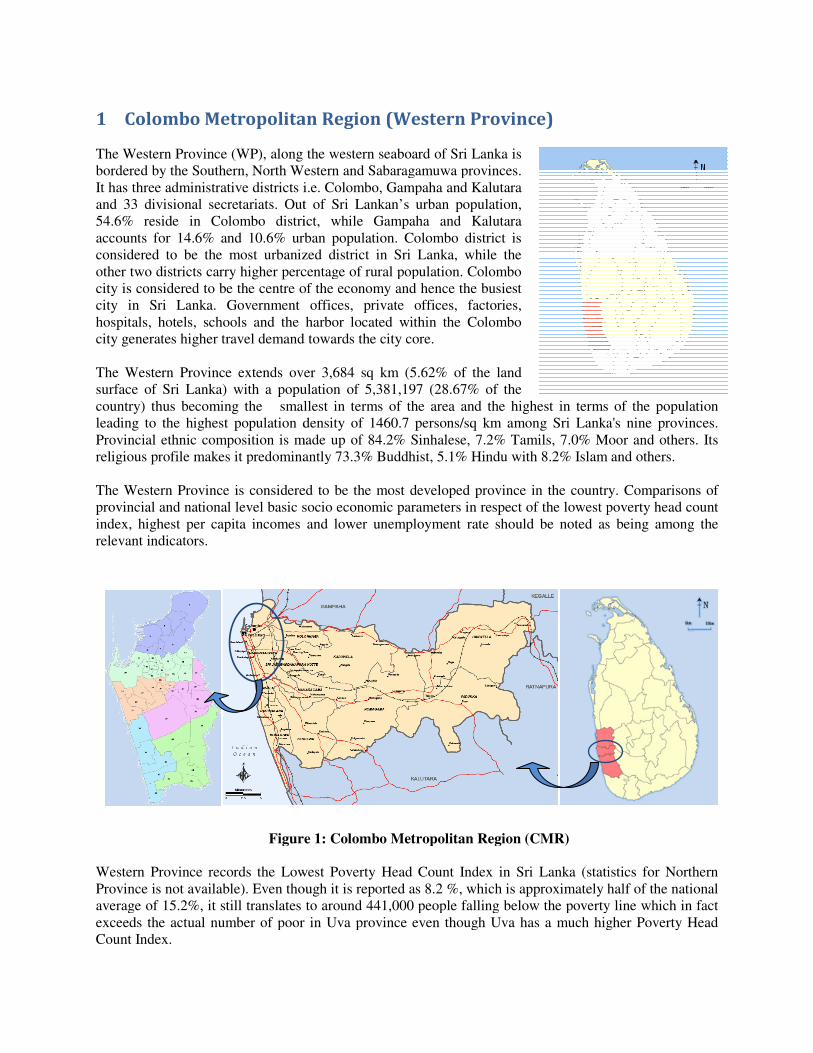
1 Colombo Metropolitan Region (Western Province)
The Western Province (WP), along the western seaboard of Sri Lanka is
bordered by the Southern, North Western and Sabaragamuwa provinces.
It has three administrative districts i.e. Colombo, Gampaha and Kalutara
and 33 divisional secretariats. Out of Sri La
54.6% reside in Colombo district, while Gampaha and Kalutara
accounts for 14.6% and 10.6% urban population. Colombo district is
considered to be the most urbanized district in Sri Lanka, while the
other two districts carry higher percentage of rural population. Colombo
city is considered to be the centre of the economy and hence the busiest
city in Sri Lanka. Government offices, private offices, factories,
hospitals, hotels, schools and the harbor located within the Colombo
city generates higher travel demand towards the city core.
The Western Province extends over 3,684 sq km (5.62% of the land
surface of Sri Lanka) with a population of 5,381,197 (28.67% of the
country) thus becoming the smallest in terms of the area and the hig
leading to the highest population density of 1460.7 persons/sq km among Sri Lanka's nine provinces.
Provincial ethnic composition is made up of 84.2% Sinhalese, 7.2% Tamils, 7.0% Moor and others. Its
religious profile makes it predominantly 73.3% Buddhist, 5.1% Hindu with 8.2% Islam and others.
The Western Province is considered to be the most developed province in the country. Comparisons of
provincial and national level basic socio economic parameters in respect of the lo
index, highest per capita incomes and lower unemployment rate should be noted as being among the
relevant indicators.
Figure 1: Colombo Metropolitan Region (CMR)
Western Province records the Lowest Poverty Head Count Inde
Province is not available). Even though it is reported as 8.2 %, which is approximately half of the national
average of 15.2%, it still translates to around 441,000 people falling below the poverty line which in fact
exceeds the actual number of poor in Uva province even though Uva has a much higher Poverty Head
Count Index.
Colombo Metropolitan Region (Western Province)
The Western Province (WP), along the western seaboard of Sri Lanka is
bordered by the Southern, North Western and Sabaragamuwa provinces.
It has three administrative districts i.e. Colombo, Gampaha and Kalutara
and 33 divisional secretariats. Out of Sri Lankan’s urban population,
54.6% reside in Colombo district, while Gampaha and Kalutara
accounts for 14.6% and 10.6% urban population. Colombo district is
considered to be the most urbanized district in Sri Lanka, while the
ercentage of rural population. Colombo
city is considered to be the centre of the economy and hence the busiest
city in Sri Lanka. Government offices, private offices, factories,
hospitals, hotels, schools and the harbor located within the Colombo
erates higher travel demand towards the city core.
The Western Province extends over 3,684 sq km (5.62% of the land
surface of Sri Lanka) with a population of 5,381,197 (28.67% of the
country) thus becoming the smallest in terms of the area and the highest in terms of the population
leading to the highest population density of 1460.7 persons/sq km among Sri Lanka's nine provinces.
Provincial ethnic composition is made up of 84.2% Sinhalese, 7.2% Tamils, 7.0% Moor and others. Its
it predominantly 73.3% Buddhist, 5.1% Hindu with 8.2% Islam and others.
The Western Province is considered to be the most developed province in the country. Comparisons of
provincial and national level basic socio economic parameters in respect of the lowest poverty head count
index, highest per capita incomes and lower unemployment rate should be noted as being among the
Figure 1: Colombo Metropolitan Region (CMR)
Western Province records the Lowest Poverty Head Count Index in Sri Lanka (statistics for Northern
Province is not available). Even though it is reported as 8.2 %, which is approximately half of the national
average of 15.2%, it still translates to around 441,000 people falling below the poverty line which in fact
exceeds the actual number of poor in Uva province even though Uva has a much higher Poverty Head
hest in terms of the population
leading to the highest population density of 1460.7 persons/sq km among Sri Lanka's nine provinces.
Provincial ethnic composition is made up of 84.2% Sinhalese, 7.2% Tamils, 7.0% Moor and others. Its
it predominantly 73.3% Buddhist, 5.1% Hindu with 8.2% Islam and others.
The Western Province is considered to be the most developed province in the country. Comparisons of
west poverty head count
index, highest per capita incomes and lower unemployment rate should be noted as being among the
x in Sri Lanka (statistics for Northern
Province is not available). Even though it is reported as 8.2 %, which is approximately half of the national
average of 15.2%, it still translates to around 441,000 people falling below the poverty line which in fact
exceeds the actual number of poor in Uva province even though Uva has a much higher Poverty Head
Western provincial share of the national GDP is around 48.4% and has recorded the highest per capita
income of Rs 303,536 (approx USD 2,500) in 2007. But the rate of unemployment and hence the
unemployed population is still higher when compared to other provinces. This indicates that though
Western province has reached a certain level of economic development, it is still to be developed in social
aspects. (Kumarage, 2010),
2 Historical Perspective of Transport in CMR
It was after the arrival of the Dutch in the 18th century that the first network of inland waterways (IWT)
were constructed in the Western Province (WP) connecting the port in Colombo for the export of coconut
and spices. It was these waterways that provided the catalyst for the growth of Colombo as a transport
hub and led to the Western Province becoming the most economically dominant province.
The opening of the Suez Canal and the simultaneous introduction of rail transport in the 1860s led to the
formation of a multi modal transport hub in Colombo. Rubber and teas as export crops were added with
the connection of the hill country to Colombo by railway and later by road transport. Colombo became
the administrative and commercial capital with the road network and the subsequent long distance bus
and trucking routes also being centred on Colombo Fort. Thus the Colombo became a uni-polar transport
hub for the country and had as its central node, the Central Business District in Colombo where the Port
of Colombo, IWT network, road and rail networks as well as truck and bus route networks were located.
The international airport was located south of the city in Ratmalana and later in 1964 moved to
Katunayake a distance of 32 kms to the north of the city
3 Significance of Colombo City
Colombo is the largest city with an area of 37 km2 and commercial capital of Sri Lanka with a city
population of 647,100. Although the city limits are defined by the Colombo Municipal Council (CMC)
boundary, its economic activities spread over Greater Colombo area which extends Kadawatha in the
north, Kaduwela in the west and Moratuwa in the south.
It also becomes the centre of the economy in Sri Lanka as the major government and private offices,
factories, hospitals, hotels, schools and harbour are located within the city inducing a large daily regular
travel demand towards the city. It also attracts a large number of irregular travellers since it links all parts
of the country by keeping country’s major road and rail passenger transport node within the centre of the
city. Therefore, most of the passengers travelling between the western part and the rest of the country
have to at least touch the Colombo city in their journeys.
4 Transport Supply and Regulation
Colombo has an extensive public transport system based on buses. The bus service is operated by both
private and government-owned Sri Lanka Transport Board (SLTB). Train transport within the city is
limited, carrying mere 10% of trips, since most trains are meant for transport to and from the city rather
than within the city and are often over crowded. The central bus stand and Fort railway station function
as the island’s primary hub for bus and rail transport respectively. Other means of transport includes

three wheelers and taxi cabs. Three wheelers are entirely operated by individuals while cab services are
run by private companies and are metered. Table 1 indicates that even though Sri Lanka has a
comparatively high road density the road penetration in urban areas is poor.
Table1: Transport Network Density
Feature CMC Colombo District Western Province Island-wide
Area (sq km)(% island wide) 37.3 (0.1%) 699.0 (1%) 3,684.0 (6%) 65,610.0
Road Length (km) 129.8 3774.6 15,409.0 113,219.0
Railway(km) 27.5 109.5 194.4 1571.7
Road and Rail Density (km/sqkm) 4.2 5.6 4.2 1.7
4.1 Bus Transport
The RPTA of the Western Province is authorized to issue route permits for intra-provincial buses and for
regularizing bus transport within the province. Currently there are around 6,540 private omnibuses
operating with permits issued by the RPTA of the WP. In addition there are around 1,413 state owned
buses belonging to the Sri Lanka Transport Board, which comes under the Ministry of Transport of the
Central Government which are not issued route permits but are also operating within the province.
Besides this there are another 865 buses issued with permits by National Transport Commission for inter-
provincial (long-distance) services starting from within the province.
The National Transport Commission provides financial reimbursements to 213 dedicated school bus trips
within the WP under the ‘Sisu Saeriya’ program. There are also a further 109 dedicated rural bus services
under the ‘Gami Saeriya’ program. Both programs are delivered through certification of delivery and
attainment of standards monitored by a local user committee. These provide important connections
between rural and town centres within a province. These services are expected to be significantly
increased this year.
Other vehicles operating within the province for fee or reward such as school vans, office vans, and three
wheelers or taxis are regulated in the WP, by Act No 3 of 2006 and by Gazette No 1518 of 2007. Three
Wheelers of which there are nearly 141,559 vehicles registered within the province, provides passenger
services within town areas and in rural areas, especially where regular public transport does not operate or
after such services cease to operate in the evenings. These are mostly unregulated except for insurance
and annual licensing as motor vehicles.
4.2 Railways
The railway network also covers much of the WP. Along the four corridors namely Mainline, Coastal
line, Kelani Valley line and Puttalam line, railway provide an important service during the peak period as
it acts as a commuter service from the outer suburbs to central Colombo. Similar to the road network
which has nodal centre in Colombo, all railway lines radiate from Colombo, this covering over 200 km
within the province. The railway carries around 210,000 passengers across the city boundary every day
which translates to around 13% of all passenger movements. Its contribution to freight transport is much
less at around 3%. (Kumarage, 2010)
4.3 Roads
The total road network in WP is comparatively larger when compared to other provinces. The length of
National Roads maintained by the RDA in the Western Province is estimated as 1,510.8 km of which
254.59 km are A Class roads and 1256.2 km of B Class Roads.
4.3.1 National Roads
Of the National Roads, around 73% of the length of roads in the province is less than standard 2 lanes,
while 6% is 4-lane width or wider. The balance 21% of the road length falls within 2 to 4 lanes. The
condition of these roads as measured by the International Road Roughness Index (IRI) shows that less
than 2% of the length of the network is in very good condition with an IRI of 2 or less and 92% of the
length is in poor condition with an IRI of 4 or more.1 (Kumarage, 2010)
The trunk roads of the national network such as A1, A2, A3, A4 close to the boundary of the Colombo
city carries traffic volumes of between 60,000 to 80,000 vehicles per day2. But the volumes of traffic on
these same roads are in the range of 15,000 to 20, 000 at the provincial boundary. On provincial roads the
traffic volumes are generally in the range 3,000 to 10,000 vpd and for local authority roads it was found
to be in most instances between 100 to 1,000 vpd. The typical vehicle composition on national roads
within the province is that around 65-70 % of vehicles are four wheeled or larger. The typical average
speeds on the national roads are between 15 km/hr within the city, to 40 km/hr away from the city while
that of the provincial network are in the range of 15 to 40 km/hr depending on the terrain and condition of
road.
4.3.2 Provincial Roads
Length of the provincial road network in Western Province is 1,975 km, of which 849 km classified under
C class and 1,126 km under D class. There are 227.8 km of recently surfaced Double Bitumen Surface
Treated DBST roads. At present around 30% of the provincial road network is termed to be in poor
condition. Only 15% of the network is in very good condition. However in general the network is
considered to be comparatively in satisfactory motorable condition.
4.3.3 Local Authority Roads
It is estimated that there are 11,923 km administered by the different local governments (MC, UCs and
PS) in Western Province3. But the local authorities especially the Pradeshiya Sabhas, do not maintain
records of the condition of their road network. Hence an assessment of the condition of the roads is not
possible. Visual observation indicates that other than the larger municipal councils such as Colombo all
other municipal councils as well as urban councils are not maintaining their roads on a regular basis. It is
most likely that over 50% of the road length may be considered to be in poor condition. In the case of
Pradeshiya Sabhas this may be even more with between 2/3rd
and 3/4th of the road lengths being
considered to be in poor condition.
1 Source: TransPlan Database, University of Moratuwa
2 TransPlan Traffic Estimation Model, University of Moratuwa, 2008
3 Commissioner of Local Government, Western Province
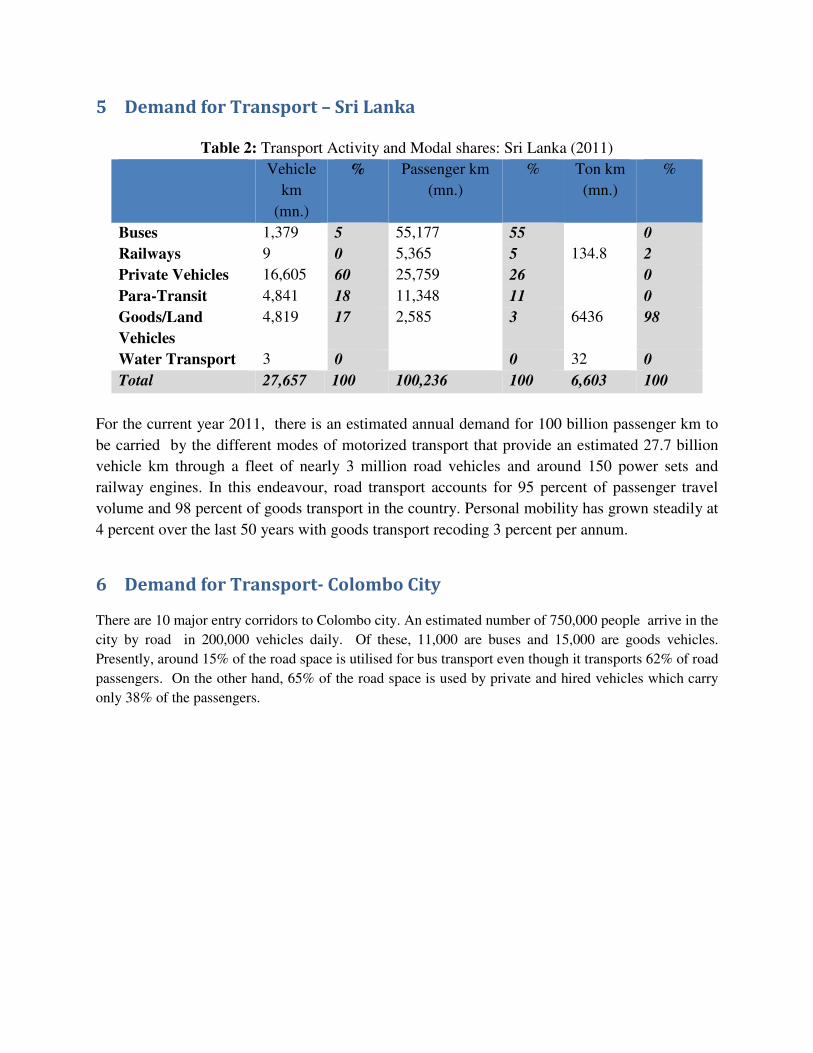
5 Demand for Transport – Sri Lanka
Table 2: Transport Activity and Modal shares: Sri Lanka (2011)
Vehicle
km
(mn.)
% Passenger km
(mn.)
% Ton km
(mn.)
%
Buses 1,379 5 55,177 55 0
Railways 9 0 5,365 5 134.8 2
Private Vehicles 16,605 60 25,759 26 0
Para-Transit 4,841 18 11,348 11 0
Goods/Land
Vehicles
4,819 17 2,585 3 6436 98
Water Transport 3 0 0 32 0
Total 27,657 100 100,236 100 6,603 100
For the current year 2011, there is an estimated annual demand for 100 billion passenger km to
be carried by the different modes of motorized transport that provide an estimated 27.7 billion
vehicle km through a fleet of nearly 3 million road vehicles and around 150 power sets and
railway engines. In this endeavour, road transport accounts for 95 percent of passenger travel
volume and 98 percent of goods transport in the country. Personal mobility has grown steadily at
4 percent over the last 50 years with goods transport recoding 3 percent per annum.
6 Demand for Transport- Colombo City
There are 10 major entry corridors to Colombo city. An estimated number of 750,000 people arrive in the
city by road in 200,000 vehicles daily. Of these, 11,000 are buses and 15,000 are goods vehicles.
Presently, around 15% of the road space is utilised for bus transport even though it transports 62% of road
passengers. On the other hand, 65% of the road space is used by private and hired vehicles which carry
only 38% of the passengers.

Figure 1: Road Passenger
6.1 Traffic Demand Within CMC
Following Table shows the zonal distribution of trips produced to CMC in 1996
process to update these and result swill be available in March 2012.
Table 6: Travel Pattern in CMC
Movement Type
Outside CMC to outside CMC (via CMC)
Outside CMC to inside CMC
Inside CMC to outside CMC
Inside CMC to inside CMC
Total Journeys
6.2 Traffic Flow Variation All city entry corridors experience two major traffic peaks in the morning and afternoon. Obviously,
school trips and work trips and jointly create the morning peak during 7.30 am to 8.30 am towards the
direction of the city while the return school trips a
direction during 1.30 pm to 2.30 pm and 4.30 pm to 5.30 pm respectively. Typical representation of
traffic flow on Colombo-Negombo is shown
Car/Saloon
29%
(12% of Pax)
Utility
28%
(15% of Pax)
Figure 1: Road Passenger- Vehicle& Passenger share at CMC boun
Traffic Demand Within CMC
shows the zonal distribution of trips produced to CMC in 1996. Surveys are currently in
process to update these and result swill be available in March 2012.
: Travel Pattern in CMC Area, 1996 (24-hours, weekday)
Person Journey
Private
Vehicle
Bus Rail
Outside CMC to outside CMC (via CMC) 25 200 4
190 315 81
190 315 81
680 200 3
1085 1030 169
All city entry corridors experience two major traffic peaks in the morning and afternoon. Obviously,
school trips and work trips and jointly create the morning peak during 7.30 am to 8.30 am towards the
direction of the city while the return school trips and work trips create congestion towards city outbound
direction during 1.30 pm to 2.30 pm and 4.30 pm to 5.30 pm respectively. Typical representation of
Negombo is shown in Figure 2.
Motor Cycle
18%
(6% of pax)
3wheeler
19%
(5% of Pax)
Car/Saloon
(12% of Pax)
Mini Bus
2%
Large Bus
4%
(62% Pax
incl.mini bus)
dary
. Surveys are currently in
hours, weekday)
(000s)
Goods
Vehicle
Journeys
2
12.5
12.5
36
63.5
All city entry corridors experience two major traffic peaks in the morning and afternoon. Obviously,
school trips and work trips and jointly create the morning peak during 7.30 am to 8.30 am towards the
nd work trips create congestion towards city outbound
direction during 1.30 pm to 2.30 pm and 4.30 pm to 5.30 pm respectively. Typical representation of

Figure 2: Traffic flow variation along parliam
Figure 2 clearly illustrates that the peak period congestion is purely created by private passenger vehicles
such as motor cycles, three wheelers, cars and vans as their flow is always close to the total vehicle flow
during the day. Therefore, congestion management should focus on reducing passenger vehicle entry to
the city or else providing an adequate road way capacity for them.
6.3 Trip Purpose
One end of the most of trips coming to the city is a home. 41% of home based trips at the CMC boundary
are coming to the city with the purpose of working. The majority of 17% home based other trips are
produced for schooling purposes. Non
equaling to the home based work trips.
: Traffic flow variation along parliament road
the peak period congestion is purely created by private passenger vehicles
such as motor cycles, three wheelers, cars and vans as their flow is always close to the total vehicle flow
ngestion management should focus on reducing passenger vehicle entry to
the city or else providing an adequate road way capacity for them.
One end of the most of trips coming to the city is a home. 41% of home based trips at the CMC boundary
are coming to the city with the purpose of working. The majority of 17% home based other trips are
produced for schooling purposes. Non-home based trips such as business and official trips are in 41%
equaling to the home based work trips.
the peak period congestion is purely created by private passenger vehicles
such as motor cycles, three wheelers, cars and vans as their flow is always close to the total vehicle flow
ngestion management should focus on reducing passenger vehicle entry to
One end of the most of trips coming to the city is a home. 41% of home based trips at the CMC boundary
are coming to the city with the purpose of working. The majority of 17% home based other trips are
home based trips such as business and official trips are in 41%

Figure 3: Travelling Purpose of trip makers at CMC boundary
According to the Figure 3, higher percentage of morning and evening peak period traffic is comprised
with home based work trips. Home based other trips such as school trips are raised in the morning and the
afternoon creating several local peaks. Non-home based trips are gradually increased once the day
progress and start to diminish at about afternoon after reaching its maximum.
Figure 4: Variation of Trip Purpose by Time of Day for Persons entering CMC
Bus/Rail passenger interviews conducted by University of Moratuwa in 2007 reveal following issues
which reflect the behavior of passengers coming to CMC.
• 53% of bus passengers and 37% of rail passengers come to Fort/Pettah to transfer to another bus
going out of CMR. Greater portion of these travelers come to city during the day time.
• Majority of trips between CMC and outside CMC can be considered as HBW & Schooling trips
and 43.2% of bus and 46.9% of rail passengers make transfers at Pettah/ Fort to local services
from intra & inter provincial services.
0
10
20
30
40
50
60
70
80
90
100
7.0
0-7
.30
7.3
0-8
.00
8.0
0-8
.30
8.3
0-9
.00
9.0
0-9
.30
9.3
0-1
0.0
0
10
.00
-10
.30
10
.30
-11
.00
11
.00
-11
.30
11
.30
-12
.00
12
.00
-12
.30
12
.30
-13
.00
13
.00
-13
.30
13
.30
-14
.00
14
.00
-14
.30
14
.30
-15
.00
15
.00
-15
.30
15
.30
-16
.00
16
.00
-16
.30
16
.30
-17
.00
17
.00
-17
.30
17
.30
-18
.00
18
.00
-18
.30
% o
f T
rip
Cat
ego
ry
Time
HBW Trips
HBO Trips
NHB Trips

6.4 Growth of Demand
Kumarage and Weerawardena (2009) have estimated growth of passenger demand in Colombo City as
follows:
Since country’s major administrative, business, commercial and educational activities were centralized to
the Colombo city centre, it has experienced a steady traffic growth for several decades. But in last few
years it is observed that the outskirt areas of Colombo city such as Nugegoda, Maharagama, Panadura and
Kiribathgoda were also rapidly developed and used for administrative and economic functions by
reducing certain amount of passenger trips driven towards the centre of city. This scenario is affirmed by
that though CMC is experienced an annual increase of 5% in the number of persons arriving to the city on
a daily basis from 1965 to 1995, it is started decrease since 1995 due to the development of afore-
mentioned city suburbs.
Interestingly however, during the last decade, even though the number of people coming has reduced, the
number of vehicles coming to the city has continued to increase. This means that more and more people
have shifted from public transport to private vehicles which take more space on the road per person, thus
allowing fewer people to enter the city especially during peak periods.
Figure 5: Comparison of Passenger Modal Share Since 1975 to 20034
Over the last 30 year period the share of trips made by cars and motor cycles have increased from just 5%
to 20% leading to an explosion in the demand for road space from around 25,000 vehicles per day to
175,000 a seven fold increase. This phenomenon is not particular to Colombo as most cities experience
4 Source: Transportation Engineering Division, University of Moratuwa, 2004

similar problems when public transport fails to match the improved quality of transport and complexity of
mobility needs that arise with increasing incomes of the population. This can be observed when one
compares the relative deterioration in the comfort of bus or rail transport when compared with the ever
increasing features in private vehicles. Even though buses have increased in number, the quality of
service, reliability, conditions of bus stops and terminals have continued to deteriorate. The railway
service is also plagued by loss in quality and also struggles to meet its timetable requirement due to lack
of rolling stock.
Table 4: Growth of Traffic Entering to Colombo City5
Year Private Vehicles Buses Goods Vehicles Total
ADT 1985 130,000 31,950 16,850 178,800
AAGR(1985-95) 4.6 -1.7 3.7 3.6
ADT 1995 203,215 27,084 24,158 254,457
AAGR(1995-05) 5.3% -1.3% 2.6% 3.9%
ADT 2005 341,893 23,893 31,311 374,381
6.5 Transport Capacity Projections
The passenger transport capacity within the CMC was calculated by WS Atkins and University of
Moratuwa in 1999 as given as below.
Table 5: Passenger Capacity by Corridor and Mode of Transport Corridor
(Bus/PV
Ratio)
Mode 2005 2010 2020 2030
Capacity Note Capacity Note Capacity Note Capacity Note
Galle Road
(60/40)
Bus 257 (1,2
3,4)
257 257 257
PV 170 170 170 170
Railway 96 (5) 96 - (7) -
LRT/MRT - 60 (6) 160 (8) 240 (9)
Negombo
(65/35)
Bus 251 (10,
11)
251 251 251
PV 205 205 205 205
5 Source: Transportation Engineering Division, University of Moratuwa, 2004

Railway 32 (12) 48 (13) 64 (14) 64 (16)
LRT/MRT - - 120 (15) 240 (17)
Kandy
(70/30)
Bus 180 (18) 327 (19) 327 327
PV 126 218 218 218
Railway 96 (20) 150 (21) 200 (22) 200
LRT/MRT - - - -
Ratnapura
(60/40)
Bus 226 (23) 226 226 226
PV 150 150 150 150
Railway 12 (24) 12 12 12
LRT/MRT - 60 (25) 120 (26) 240 (27)
Cotta Rd/SJP
(45/55)
Bus 154 (28) 154 154 154
PV 188 188 188 188
LRT/MRT - 60 (29) 120 (30) 240 (31)
Horana Rd
(50/50)
Bus 98 (32) 98 98 98
PV 98 98 98 98
Kolonnawa
(60/40)
Bus 45 (33) 45 45 45
PV 31 31 31 31
Narahenpita
(30/70)
Bus 16 (34) 16 16 16
PV 37 37 37 37
Low Level
(50/40)
Bus 46 (35) 46 46 46
PV 33 33 33 33
Total by
Mode Bus 1,273 1,420 1,420 1,420
PV 1,038 1,130 1,130 1,130
Railway 236 306 276 276
LRT/MRT - 180 520 960
TOTAL All 2,547 3,036 3,346 3,786
Source WS Atkins and University of Moratuwa, 1999
6.6 Origin Destinations of Demand
Based on 2004 surveys (Kumarage and Weerawardena, 2009), there are about 41% of home
based work trips in total private vehicle trips produced between CMC and CMR region. Of the
total motorized work trips made in the CMR, 23% are terminating in the CBD. A further 34%
have their trip ends in the non CBD part of CMC. Only 43% of motorized work trip rends are
outside the CMC. This indicates a strong attraction for motorized work trips in the CBD.

Figure
The Table 6 shows the private vehicle trips that are attracted and generated in each DSD, as per surveys
conducted in 1996. There are no surveys since this covering the entire CMR to update this data.
Table 6: Inter-Zonal Trips in Western Province by Private Vehicle,
DSD
Home Based Work
Gen
Total
% by
All Total
Colombo 8,021 14 40,937
Hanwella 572 30
Homagama 2,838 31
Kaduwela 4,135 38 2,689
Maharagama 3,445 30 1,357
Kesbawa 3,494 40
Nugegoda 8,639 22 4,888
Dehiwala 6,241 24 4,264
Moratuwa 3,285 23 1,054
Figure 6: Trip Attractions in Colombo
shows the private vehicle trips that are attracted and generated in each DSD, as per surveys
conducted in 1996. There are no surveys since this covering the entire CMR to update this data.
Zonal Trips in Western Province by Private Vehicle, 1995
Trip Purposes
Home Based Work Home Based Other Non Home Based
Att
Gen Att Gen Att
Total
% by
All
40,937 31 18,267 45,477 32,631 46,055
311 16 859 1,230 471 381
753 19 5,012 2,446 1,439 765
2,689 34 4,304 2,636 2,493 2,626
1,357 13 4,831 5,125 3,203 3,626
871 17 3,663 2,299 1,549 2,066
4,888 18 16,530 9,428 14,204 12,451
4,264 17 10,209 8,153 9,234 12,924
1,054 22 4,411 1,731 6,330 1,997
shows the private vehicle trips that are attracted and generated in each DSD, as per surveys
conducted in 1996. There are no surveys since this covering the entire CMR to update this data.
1995
All Trips
Gen Att
46,055 58,919 132,469
381 1,902 1,922
765 9,289 3,964
2,626 10,932 7,951
3,626 11,479 10,108
2,066 8,706 5,236
12,451 39,373 26,767
12,924 25,684 25,341
1,997 14,026 4,782
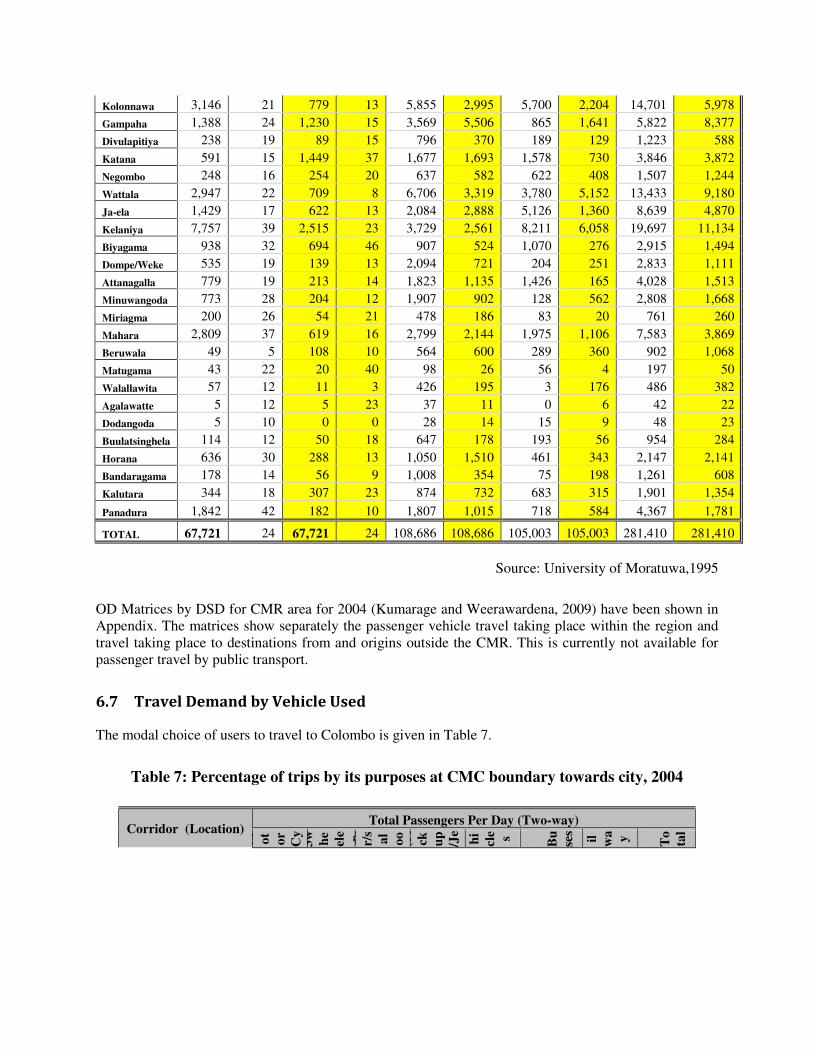
Kolonnawa 3,146 21 779 13 5,855 2,995 5,700 2,204 14,701 5,978
Gampaha 1,388 24 1,230 15 3,569 5,506 865 1,641 5,822 8,377
Divulapitiya 238 19 89 15 796 370 189 129 1,223 588
Katana 591 15 1,449 37 1,677 1,693 1,578 730 3,846 3,872
Negombo 248 16 254 20 637 582 622 408 1,507 1,244
Wattala 2,947 22 709 8 6,706 3,319 3,780 5,152 13,433 9,180
Ja-ela 1,429 17 622 13 2,084 2,888 5,126 1,360 8,639 4,870
Kelaniya 7,757 39 2,515 23 3,729 2,561 8,211 6,058 19,697 11,134
Biyagama 938 32 694 46 907 524 1,070 276 2,915 1,494
Dompe/Weke 535 19 139 13 2,094 721 204 251 2,833 1,111
Attanagalla 779 19 213 14 1,823 1,135 1,426 165 4,028 1,513
Minuwangoda 773 28 204 12 1,907 902 128 562 2,808 1,668
Miriagma 200 26 54 21 478 186 83 20 761 260
Mahara 2,809 37 619 16 2,799 2,144 1,975 1,106 7,583 3,869
Beruwala 49 5 108 10 564 600 289 360 902 1,068
Matugama 43 22 20 40 98 26 56 4 197 50
Walallawita 57 12 11 3 426 195 3 176 486 382
Agalawatte 5 12 5 23 37 11 0 6 42 22
Dodangoda 5 10 0 0 28 14 15 9 48 23
Buulatsinghela 114 12 50 18 647 178 193 56 954 284
Horana 636 30 288 13 1,050 1,510 461 343 2,147 2,141
Bandaragama 178 14 56 9 1,008 354 75 198 1,261 608
Kalutara 344 18 307 23 874 732 683 315 1,901 1,354
Panadura 1,842 42 182 10 1,807 1,015 718 584 4,367 1,781
TOTAL 67,721 24 67,721 24 108,686 108,686 105,003 105,003 281,410 281,410
Source: University of Moratuwa,1995
OD Matrices by DSD for CMR area for 2004 (Kumarage and Weerawardena, 2009) have been shown in
Appendix. The matrices show separately the passenger vehicle travel taking place within the region and
travel taking place to destinations from and origins outside the CMR. This is currently not available for
passenger travel by public transport.
6.7 Travel Demand by Vehicle Used
The modal choice of users to travel to Colombo is given in Table 7.
Table 7: Percentage of trips by its purposes at CMC boundary towards city, 2004
Corridor (Location) Total Passengers Per Day (Two-way)
M ot
or
Cy
cle
3w he
ele r Ca
r/s
al
oo n
(Pi
ck up
/Je
epVe
hi
cle s
Bu
ses
Ra il wa y
To
tal
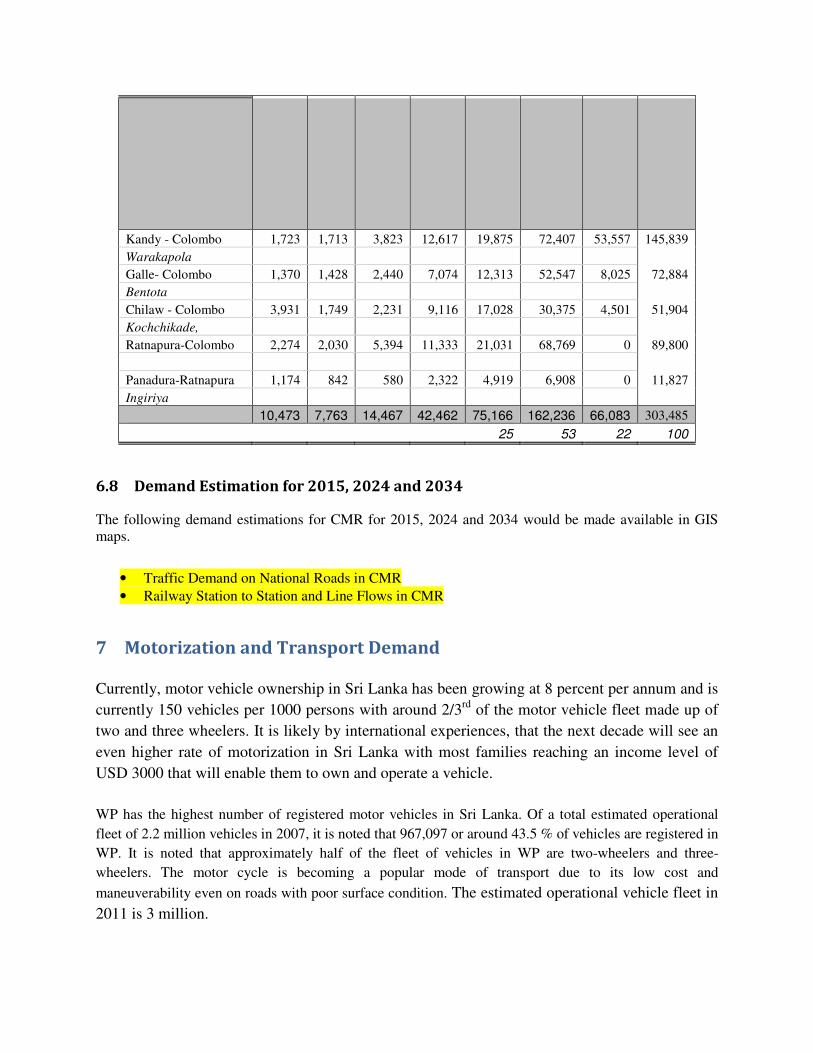
Kandy - Colombo 1,723 1,713 3,823 12,617 19,875 72,407 53,557 145,839
Warakapola
Galle- Colombo 1,370 1,428 2,440 7,074 12,313 52,547 8,025 72,884
Bentota
Chilaw - Colombo 3,931 1,749 2,231 9,116 17,028 30,375 4,501 51,904
Kochchikade,
Ratnapura-Colombo 2,274 2,030 5,394 11,333 21,031 68,769 0 89,800
Panadura-Ratnapura 1,174 842 580 2,322 4,919 6,908 0 11,827
Ingiriya
10,473 7,763 14,467 42,462 75,166 162,236 66,083 303,485
25 53 22 100
6.8 Demand Estimation for 2015, 2024 and 2034
The following demand estimations for CMR for 2015, 2024 and 2034 would be made available in GIS
maps.
• Traffic Demand on National Roads in CMR
• Railway Station to Station and Line Flows in CMR
7 Motorization and Transport Demand
Currently, motor vehicle ownership in Sri Lanka has been growing at 8 percent per annum and is
currently 150 vehicles per 1000 persons with around 2/3rd
of the motor vehicle fleet made up of
two and three wheelers. It is likely by international experiences, that the next decade will see an
even higher rate of motorization in Sri Lanka with most families reaching an income level of
USD 3000 that will enable them to own and operate a vehicle.
WP has the highest number of registered motor vehicles in Sri Lanka. Of a total estimated operational
fleet of 2.2 million vehicles in 2007, it is noted that 967,097 or around 43.5 % of vehicles are registered in
WP. It is noted that approximately half of the fleet of vehicles in WP are two-wheelers and three-
wheelers. The motor cycle is becoming a popular mode of transport due to its low cost and
maneuverability even on roads with poor surface condition. The estimated operational vehicle fleet in
2011 is 3 million.

Table 8: Vehicle Ownership, 2009
Vehicle Category Number of Vehicles
CMC WP All Island
Omnibuses 1,182 6,419 12,243
Private Coaches 3,419 10,925 23,500
Dual Purpose Veh. 29,416 100,840 175,384
Private Cars 69,522 182,078 250,943
Land Vehicles 5,837 14,396 65,974
Goods Vehicles 27,880 81,767 180,739
Motor Cycles 78,597 416,527 1,150,966
Three Wheelers 29,288 154,582 372,626
Others 1,346 1,803 12,733
Total 246,487 969,337 2,245,108
7.1 Trends in Vehicle Growth
Table 9: Trends in Vehicle Growth in Western Province and CMC
Vehicle Category
Number of Vehicles
2002 2004 2005 2006 2007 2008 2009
WP WP WP CMC WP CMC WP CMC WP CMC WP
Omnibuses 7,028 7,774 8,105 2,721 8,421 1,344 7,124 1,152 6,493 1,182 6,419
Private Coaches 9,296 9,229 11,360 2,988 11,678 3,676 12,096 3,393 11,290 3,419 10,925
Dual Purpose Veh. 81,720 91,835 99,469 30,259 102,821 32,010 106,571 29,705 102,613 29,416 100,840
Private Cars 110,799 131,128 146,909 69,287 166,223 74,124 182,421 73,225 183,687 69,522 182,078
Land Vehicles 11,827 12,575 14,700 6,309 15,455 6,582 16,793 5,999 14,969 5,837 14,396
Goods Transport Veh. 55,836 62,381 82,405 27,653 78,609 29,294 83,891 27,175 82,254 27,880 81,767
Motor Cycles 276,277 355,368 430,767
61,118 370,226 73,269 414,770 77,246 421,324 78,597 416,527
Three Wheelers 24,428 132,809 25,895 141,559 26,839 148,183 29,288 154,582
Others 11,714 12,650 1,117 392 1 460 1,872 498 1,974 1,346 1,803
Total 564,497 682,940 794,832 225,155 886,243 246,654 967,097 245,232 972,787 246,487 969,337
7.2 Distribution of Vehicle Ownership
The vehicle ownership by category for each DSD is given in Table 10.
Table 10; Under preparation.

The vehicle ownership summary in provided in Table 11.(To be updated)
Table 11: Vehicle Ownership per Capita (1998)
Area Estimated
Vehicle
Ownership (Per
1000 persons)
Ownership Level by Vehicle Type
(Percentage of Vehicle Fleet)
Motor
Cycles
Three
Wheelers
Cars, &
Vans
Freight Bus
CMC 262 66 (25%) 31 (12%) 113
(43%)
45 (17%) 8 (03%)
Colombo
District
141 45 (32%) 16 (11%) 56
(40%)
20 (14%) 4 (03%)
CMR 97 40 (41%) 9 (09%) 32
(33%)
13 (13%) 3 (03%)
Sri Lanka
(1996)
74 38 (51%) 2 (03%) 21
(29%)
12 (16%) 1 (02%)
8 Trip Rate
Further information on this is being processed currently
Trip rates per person per day for different trip purposes is given below (Liyanage, 2006).
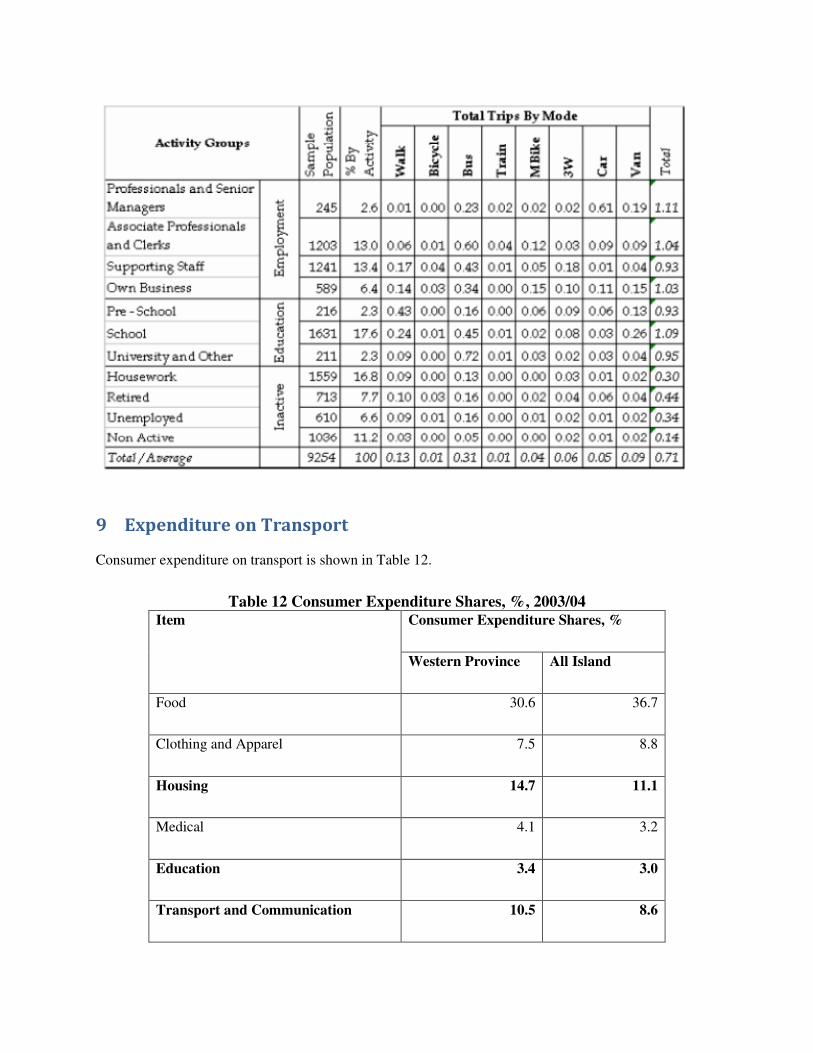
9 Expenditure on Transport
Consumer expenditure on transport is shown in Table 12.
Table 12 Consumer Expenditure Shares, %, 2003/04
Item Consumer Expenditure Shares, %
Western Province All Island
Food 30.6 36.7
Clothing and Apparel 7.5 8.8
Housing 14.7 11.1
Medical 4.1 3.2
Education 3.4 3.0
Transport and Communication 10.5 8.6

Fuel and Light 4.5 4.4
Consumer Durables 8.4 9.7
Interest on Debt 1.9 1.4
Other 14.4 13.0
In accordance to the above issues it is revealed that the people are presently spent higher proportion of
their earnings for the comfort of traveling by means of using their own vehicles or residing close to their
offices/schools. Therefore it is understandable that if comfortable passenger transport service can be
provided, some proportion of them can be attracted for such services even at a higher rate since they
already spent higher amount of their earning on this issue.
References
• Kumarage Amal. S., Review of Sri Lanka’s Transport Sector, World Bank, Colombo, 2010
• WS Atkins and University of Moratuwa, Colombo Urban Transport Study - Stage 2, Working
Paper 25: A Masterplan for the Development of Transport in the Colombo Metropolitan Region,
1999.
• Kumarage Amal S. and Janaka Weerawardena, Greater Colombo Traffic Management, Research
Report 0902, University of Moratuwa, 2009.
• Liyanage Tissa, Electricity Consumption and Trip Generation, PhD Thesis, University of
Moratuwa, 2006.