Supply survey on The Leather industry in Zambia - ITC
67
PROMOTING REGIONAL TRADE IN LEATHER AND LEATHER PRODUCTS “Programme for Building African Capacity for Trade (PACT II) LEATHER” Zambia, July 2010 Supply survey on The Leather industry in Zambia
Transcript of Supply survey on The Leather industry in Zambia - ITC

PROMOTING REGIONAL TRADE IN LEATHER AND LEATHER PRODUCTS
“Programme for Building African Capacity for Trade (PACT II) LEATHER”
Zambia, July 2010
Supply survey on The Leather industry in Zambia

Supply and Demand survey on the leather industry – Zambia
ii
While every effort has been made to verify the information contained in this document, ITC cannot
accept any responsibility for any errors that it may contain.
For more information on the initiative "Promoting Regional Trade In Leather and Leather Products",
please contact:
Beatriz Rodriguez
Trade Support Institutions Strengthening (TS)
Division of Business and Institutional Support (DBIS).
International Trade Center (ITC)
54.56 Rue de Montbrillant
1202-Geneva, Switzerland
Tel: +41-22-730-05-91, Fax: +41-730 02 49, Email: [email protected]

Supply and Demand survey on the leather industry – Zambia
iii
TABLE OF CONTENTS
I. SUPPLY SURVEY ......................................................................................................... 1
A. OVERVIEW OF THE LEATHER INDUSTRY IN ZAMBIA .................................................. 1
B. SUPPLY CAPACITY ............................................................................................. 14
C. COMMERCIAL PRACTICES ................................................................................... 27
II. DEMAND SURVEY ..................................................................................................... 28
A. OVERVIEW OF THE LEATHER MARKET .................................................................. 28
B. IMPORTS OF LEATHER PRODUCTS ....................................................................... 29
C. PREVAILING PRODUCT REQUIREMENTS AND COMMERCIAL PRACTICES .................... 36
D. MARKET ENTRY ................................................................................................ 37
E. GOVERNMENT POLICY ....................................................................................... 38
F. CONCLUSIONS AND RECOMMENDATIONS ............................................................. 39
ANNEXES
I References ................................................................................................................................... 41
II List of people contacted ............................................................................................................... 43
III International sanitary certificate .................................................................................................... 45
IV List of inputs for duty/tax exemption ............................................................................................. 49
V Leather industry association of Zambia leather sector value chain outputs, objectives and
activities ........................................................................................................................................ 51
VI Background information and objectives of supply/demand survey .............................................. 55
VII Methodology of the supply/demand survey .................................................................................. 57

Supply and Demand survey on the leather industry – Zambia
iv
TABLES
Table 1: Size of leather industry in Zambia ............................................................................................. 1
Table 2 : Grading system and technical specifications for raw hides (ZS 658 of 2006) ......................... 4
Table 3: Crocodiles farms/Ranches and number of crocodiles .............................................................. 5
Table 4: Main tanneries in Zambia .......................................................................................................... 8
Table 5: Types of finished leather produced by tanneries ...................................................................... 9
Table 6: Grading System and Technical Specifications for Bovine Wet blue Leather.......................... 10
Table 7: Grading of wet blue on the basis of size/mass ...................................................................... 10
Table 8: Footwear and leather goods manufacturing subsector........................................................... 11
Table 9: Leather contribution to NTEs .................................................................................................. 13
Table 10: Production levels of wet blue and finished leather: March 2010 .......................................... 14
Table 11: Current leather market proportions for leather ...................................................................... 14
Table 12: Zambia’s global and intra COMESA exports of wet blue, 2005-2009 .................................. 15
Table 13: Zambia’s export markets for wet blue, 2005-2009 ................................................................ 17
Table 14: Zambia’s global exports of finished leather, 2005-2009 ..................................................... 17
Table 15: Export prices of wet blue and types of finished leather (2010) ............................................. 19
Table 16: Number of crocodile skins exported and destinations, 2000-2003 ....................................... 20
Table 17: Zambia’s global exports of crocodile skins, 2005-2009 ........................................................ 21
Table 18: Zambia’s global exports of wildlife hides/trophies, 2005-2009 ............................................. 21
Table 19: Zambia’s global and intra COMESA footwear exports (2006-2009) ..................................... 22
Table 20: Export prices for selected leather footwear and leather goods ............................................ 25
Table 21: Share of export market by category of leather product, 2005-2009 ..................................... 26
Table 22: Zambia’s global and intra COMESA imports of hides/skins and finished leather ................. 29
Table 23: Global and intra COMESA footwear imports, 2006-2009 ..................................................... 32
Table 24: Suppliers of footwear and leather goods to the Zambian market ......................................... 33
Table 25: Global and intra COMESA leather goods imports (US$) ...................................................... 34

Supply and Demand survey on the leather industry – Zambia
v
FIGURES
1 Cattle distribution ............................................................................................................................ 2
2 Goats distribution............................................................................................................................ 3
3 Sheep distribution ........................................................................................................................... 3
4 Geographical location of crocodile farms in Zambia ...................................................................... 6
5 Geographical Location of Tanneries in Zambia. ............................................................................ 8
6 Geographical location of leather products manufacturers............................................................ 12
7 Zambia's Total global export of wet blue, 2005-2009 .................................................................. 15
8 Zambia's intra COMESA exports of wetblue, 2005-2009 ............................................................. 16
9 Zambia's global vs intra COMESA exports of wetblue ................................................................. 16
10 Zambia's global exports of finished leather, 2005-2009 ............................................................... 18
11 Disease Free Zone in Zambia ...................................................................................................... 20
12 Zambia's global crocodile skins exports, 2005-2009 ................................................................... 21
13 Zambia's exports of wildlife hides/trophies, 2005-2009 ............................................................... 22
14 Zambia's global Footwear exports, 2005-2009 ............................................................................ 23
15 Zambia's intra COMESA footwear exports, 2005-2009 ............................................................... 23
16 Zambia's global vs intra COMESA footwear exports (US$), 2005-2009 ..................................... 24
17 Global exports of leather goods/articles (Kg) ............................................................................... 24
18 Zambia’s global vs intra COMESA leather goods exports, 2005-2009 ........................................ 25
19 Share of export market by categories of leather products (US$), 2005-2009.............................. 26
20 Zambia's global imports of hides/skins and finished leather, 2006-2009 ..................................... 30
21 Zambia's intra COMESA imports of hides /skins and finished leather, 2006-2009 ...................... 30
22: Zambia's global vs intra COMESA imports of hides/skins and finished leather, 2006-2009 ...... 31
23 Zambia's global footwear imports, 2006-2009 ............................................................................. 32
24 Zambia's intra COMESA footwear imports, 2006-2009 ............................................................... 32
25 Zambia's global vs intra COMESA footwear imports, 2006-2009 ................................................ 33
26 Zambia's global and intra COMESA imports of leather goods, 2006-2008 ................................. 34
27 Zambia's global vs intra COMESA imports of leather goods, 2006-2008 .................................... 34
28 Market share of imported leather products (US$), 2006-2009 ..................................................... 40
29 Leather products imports vs exports (US$) .................................................................................. 40
30 Geographical location of crocodile farms ..................................................................................... 58
31 Geographical location of tanneries in Zambia .............................................................................. 58
32 Geographical location of leather products manufacturers............................................................ 59
33 Disease Free Zones in Zambia .................................................................................................... 60
34 Geographical location of multi facility economic zones in Zambia ............................................... 61

Supply and Demand survey on the leather industry – Zambia
vi
ABBREVIATIONS & ACRONYMES AFLAI African Federation of Leather And Allied Industries
CBPP Contagious Bovine Pleural Pneumonia
CIDA Canadian International Development Agency
CITES the Convention on International Trade in Endangered Species
COMESA Common Market for Southern and Eastern Africa
DFZ Disease Free Zone
DRC Democratic Republic of Congo
ECF East Coast Fever
ECZ Environmental Council of Zambia
ESALIA Eastern and Southern Leather Industries Association
FMD Foot and Mouth Disease
ITC International Trade Centre
LIAZ Leather Industry Association of Zambia
MFEZs Multi-Facility Economic Zones
NALEIC National Livestock and Epidemiology Information Centre
NTEs Non Traditional exports
RECs Regional Economic Communities
SMEs Small and Medium Enterprises
US$ United States Dollar
VAT Value Added Tax
ZAWA Zambia Wildlife Authority
ZBS Zambia Bureau of Standards
ZDA Zambia Development Agency
ZRA Zambia Revenue Authority

Supply and Demand survey on the leather industry – Zambia
Page 1 of 67
I. SUPPLY SURVEY
A. Overview of the leather industry in Zambia
The development of leather industry in Zambia is strongly based on availability of quality hides and skins, which are by-products of the meat industry. Hides and skins are found in all parts of the country and their availability depends on the efficiency of collection and access to markets by traders / farmers and abattoir operators. The Zambian Leather Industry is currently small compared to some of the selected African countries, Africa and the world at large (Table 1).
Table 1: Size of leather industry in Zambia
Regions Cattle Population (Million)
World 1498
Africa 163
Ethiopia 31.0
Sudan 30.0
Zimbabwe 5.2
Zambia 2.6
Source: Leather Sector study; Export Development Plan 1999
The Manufacturing Sector in the county is wide but the government has identified six (06) priority areas namely (a) Processed Foods (b) Textiles and Garments (c) Engineering Products (d) Gemstones (e) Wood and Wood Products and (f) Leather and Leather Products. The major products in the Leather and Leather Products Sector, includes hides from cattle, skins from sheep and goats, wet blue, crust leather, finished leather, leather footwear and leather goods. Other sources of hides and skins include wildlife, game ranching and crocodile farming. The Leather and leather Product Sector, also referred to as Leather industry, was chosen as a priority sector on the premise that it has abundant renewable resources (hides and skins) with great potential to grow and contribute to social-economic growth of the country through export earnings, creation of employment opportunities and poverty reduction. The Leather Industry objectives and strategies, as outlined in the Commercial, Trade and Industry Policy (2005), are as follows: Leather Industry Objectives:
To enhance the production and export of crust, finished leather and leather goods;
To improve the capacity of Small and Medium Enterprises (SMEs) to produce and process high quality leather and leather products.
Developmental Strategies:
The Government will provide appropriate incentives to support private sector investments in the leather industry, particularly by the establishment of tanneries utilizing modern technologies;
The Government will establish a hides pricing and grading system to support fair and efficient trading of domestic rawhides;
The Government will also utilize appropriate policy measures to discourage the export of raw hides and unprocessed skins, when necessary;

Supply and Demand survey on the leather industry – Zambia
Page 2 of 67
The Government will strengthen the organization of various stakeholder groups in leather sector (comprised of cattle herders, traders, and tannery operators); and provide technical support to these stakeholder groups when necessary.
1. Structure of the leather industry
The Zambian Leather Industry is relatively small but has along value chain comprising various subsectors and stakeholders, mainly tanneries subsector, footwear and leather goods manufacturing subsector, Livestock Production subsector, Slaughter Facilities subsector, Traders in hides and skins. The Leather Industry Association of Zambia (LIAZ) is an overall coordinating unity for the leather industry. The government is plays a critical role in the value chain mainly by providing policy and regulatory guidance to the industry. The features and characteristics of each subsector are described below. (a) Livestock production subsector
The major sources of raw materials for the production of wet blue, crust and finished leather are cattle, sheep and goats. According to Ministry of Livestock and Fisheries, Zambia has a livestock population of 2.6 million cattle, 970,000 sheep and 1 million goats and out of these, 83%, 64% and 97% respectively, are found in the smallholder farming system. Most cattle are found in the Western Province, followed by Southern, Central and Eastern Provinces (Figure 1). The highest goat population is in the Southern Province, followed by Central, Eastern and Luapula Provinces (Figure 2), while most sheep are found in Eastern and Southern Provinces (Figure 3).
Figure 1: Cattle distribution

Supply and Demand survey on the leather industry – Zambia
Page 3 of 67
Figure 2: Goats distribution
Figure 3: Sheep distribution
The off take in the traditional sector, especially for cattle, is estimated at 8%. The commercial sector owns a small proportion of livestock (17% cattle, 33% sheep and 3% goats) and is normally kept under intensive management (feedlots and ranches) and the off take in this sector is estimated at 20%. Based on these off takes, it means that 269,360 pieces of hides are produced annually from both the traditional and commercial sectors.

Supply and Demand survey on the leather industry – Zambia
Page 4 of 67
Most hides (69.5%) are from the traditional sector, but their quality is highly compromised by poor animal husbandry practices (inadequate tick control resulting tick bites, skin diseases, poor branding practices etc.). Almost 30% of the raw hides from the traditional sector are rejected due to poor quality. However, hides from the commercial sector are of good quality. The Leather Industry Association of Zambia (LIAZ) in collaboration with Zambia Bureau of Standards (ZABS) and facilitation from the Commercialization of Hides and Skins by Improving Quality and Collection in the Smallholder Farming System Project (2004 – 2006) developed a standard and grading system for raw hides and skins, ZS 658 of 2006 (Table 2) for use by abattoirs, traders and tanneries. The rationale for this standards and grading system was to facilitate the production of quality raw hides and skins in the value chain and to support fair and efficient trading of domestic raw hides, between abattoirs/traders and tanneries. The pricing mechanism is currently based on the grade and quality of raw hides and skins. However, this is distorted by traders who pay high prices regardless of quality.
Table 2 : Grading system and technical specifications for raw hides (ZS 658 of 2006)
GRADE LEVEL OF DEFECTIVENESS
TECHNICAL SPECIFICATIONS
1 0% Thoroughly cured, clean and free from taint, hair slip, pink colour, ammonia or other smell; good shape and well trimmed; no brand marks; un putrefied, un blemished by disease or old wounds or scratches or abrasions or scars; free from holes and gouge marks (other than small flay cuts or gouge marks on the shanks. wet salted (not sun dried); Butt area which is 100% non defective
2 10 When it suffers from one of the following defects only: having not more than two cuts each of 10cm or less; excessive gouge marks disfiguring due to disease outside the butt; brand marks, bruises, scars or scratches on one side only and not involving more than 1/10
th of the total area of the butt; having slight ammonia smell
and pink coloration; (not ground dried); Butt area which is 90% non defective
3 30 Hide is spread and not properly ripped; not properly trimmed; incorrectly flayed and fleshed (1 – 2 flay cuts on the Butt portion apart from flay cuts belly and shoulders); large brand marks on the belly; large number of pox marks/tick bites; 4 – 5 gouge and holes marks; not properly preserved/cured (some putrefaction or hair slip); Butt area which is 70% non defective
4 50 Hide is not spread but wrinkled; badly trimmed (badly shaped); badly flayed, fleshed and bled (with many flay cuts and blemishes up to 3-4 cuts, 6-7 gouges and 4-5 holes); many brand marks; many insect bites (ticks, skin disease marks); some putrefaction and hair slip; Butt area which is 50% non defective.
REJECT More than 50% is defective and putrefied
Badly damaged and blemishes, putrefaction with bad odour and hair slip, red heat and the Butt area which is more than 50% defective
Source: Zambia Bureau of Standards, ZS 658 of 2006
Poor animal husbandry practices have been a manifestation of inadequate livestock extension delivery system, in terms of staffing levels and resources allocation to Livestock Production and Veterinary Services. This was as a result of inappropriate institutional frame work from 1964 to 2008 whereby Livestock Production and Veterinary Services operated under Ministry of Agriculture with a strong bias to crop production related programmes. The government reversed this trend in 2009 by establishing a separate Ministry of Livestock and Fisheries Development, comprising three departments, namely Department of veterinary services, Department of Livestock Production and Department of Fisheries.

Supply and Demand survey on the leather industry – Zambia
Page 5 of 67
The elevated status, especially for Livestock Production from a section to directory or departmental level was meant to strengthen the livestock extension delivery system in the country by recruiting more field Livestock Assistants / professionals and improved budgetary allocation. The Department of Veterinary Services has intensified the immunization programmes against Ticks and Tick Borne Diseases by recruiting more Veterinary Assistants and Veterinary Doctors. The Leather Industry Association of Zambia is currently lobbying government to include in its programmes a campaign against “Poor Branding.” This campaign should include among other things, training of artisans to manufacture branding irons according to specifications, as stipulated in the Animal Identification and Brands Act. The campaign should also include training of extension staff and massive branding of weaners (6 – 8 months old weaners) every year in May – July. This campaign should go along side with deworming, dehorning and castration of undesirable bulls in order to control inbreeding. These animal husbandry practices will in the long run improve livestock productivity and production of quality livestock products and byproducts including raw hides and skins. The results from these interventions, especially branding, are slow to come by but their impact is massive and economically rewarding in the long run. (b) Wildlife estates subsector
The Zambian Leather Industry is further complemented by wildlife and these are mainly based on farming/ranching activities and occasionally licensed hunting activities regulated by the Zambia Wildlife Authority. There are fifteen (15) established crocodile farms /ranches with more than 238,666 Nile crocodile, Crocodylus niloticus and eight (8) male specimens of the African slender Snouted Crocodile (Table 3).
Table 3: Crocodiles farms/Ranches and number of crocodiles
Name of Ranch/ Farm Number of Crocodiles Species
Average Skin production/year 2000 – 2003
Location/ Province
Zongwe- Croc Farm 123,480 18,888 Southern
Lunchinze- Croc Farm 27,405 Southern
Yuka Crocodile Farm 2,500 Western
Gordana Croc- Farm 22,752 2,033 Southern
Crocodile hides- Croc Farm 21,457 2,000 Southern
Kailolio- Croc farm 15,373 1,868 Southern
J & I Brooks LTD 1,608
Luangwa- Croc Farm 9,716 Southern
Luangwa- Croc Farm 8 150 Lusaka
Kalimba- Croc Farm 9,207 612 Lusaka
Sumbu- Croc Farm 9,071 814 Southern
Gwembe- Croc Farm 123 Southern
Shiwangandu- Croc Farm 39 Northern
Gwembe- Croc Farm 25 Southern
Mbizi- Croc Farm 10 Eastern
Total 238,666
Source: Zambia Wildlife Authority Annual Report 2008

Supply and Demand survey on the leather industry – Zambia
Page 6 of 67
Most of the crocodile farms in Zambia are clustered along the banks of Lake Kariba in Siavonga, Sinazongwe and Gwembe Districts in Southern Province (Figure 4). Lake Kariba provides abundant supply of fish which is a major component of crocodile rations. Other crocodile farms are located as follows; one along the Zambezi river in Mongu District in Western Province, two along Luangwa and Ngwerere rivers in Lusaka District in Lusaka Province. There is potential to establish more crocodile farms especially along Luangwa and Zambezi rivers in Lusaka/Eastern and Western Provinces, respectively due to abundance source of fish in these rivers.
Figure 4: Geographical location of crocodile farms in Zambia
The major outputs from the crocodile farms are meat and skins. The annual production was reported to be 44 tonnes of meat and 26,000 skins (Siamudaala V.M, Kunda C and Nambota A.N, 2004) and this was projected to increase by 13.6% and 92%, respectively by 2004 (Kaswende, 2004). This projection has been constrained by several factors including inadequate support from the government and financial institutions resulting into high bank interest rates and weak local currency (Zambian Kwacka) which prohibits borrowing. This has caused the number of crocodile farms to reduce from 13 to 8 actives ones (Siamudaala et al, 2004). Crocodile farming is also high capital intensive and its feeding regimes are based on expensive high - protein feed stuffs such as formulated feeds, scrap meat comprising heads, intestines, lungs, and hooves. Besides cattle ranching, there are 119 game ranches in the country, covering 238,794 hectares land with an estimated 44,085 wild animals of different species. The game ranches are a source of hides and skins mainly for export purposes.

Supply and Demand survey on the leather industry – Zambia
Page 7 of 67
(c) Slaughter facilities subsector
Slaughter facilities subsector, comprising abattoirs, slaughter houses and slaughter slabs constitute one of the most important subsectors in the value chain and are the major producers of raw hides and skins. The slaughter facilities are located and concentrated in the smallholders farming system where most livestock are found. Currently, there is indiscriminate establishment of slaughter facilities (small and medium) in the rural areas where cattle are concentrated, especially in Eastern, Southern and Western Provinces. The quality of hides from these slaughter facilities, especially slaughter slabs and mushrooming slaughter houses is highly compromised by flaying defects due to unskilled flayers and improper flaying tools; and poor preservation methods due to inadequate curing /storage facilities. There is also poor collection of hides and skins from the smallholder farming system largely due to inadequate market infrastructure. Poor slaughter infrastructure can be attributed to inadequate regulatory framework, support and incentives to ensure that slaughter facilities are well equipped to produce quality raw hides and skins. Under the Small Investment Project (SIP, 2004 - 2005), a pilot project by the government and funds provided by the Belgium Government, three community slaughter houses were constructed and equipped with carcass hoisting facilities. Two community slaughter houses were also refurbished and equipped with carcass hoisting facilities. Under the Commercialization of Hides and Skins by Improving Quality and Collection in the Smallholder Farming System Project (2004 – 2006) about 144 flayers in the community slaughter houses, 90 extension staff and 133 Community Livestock Workers were trained in slaughter and flaying techniques; preservation and storage methods of raw hides and skins. Appropriate flaying knives were also procured and distributed to these slaughter houses. The results were positive especially in slaughter houses where flayers were trained and supplied with flaying knives. This initiative lacked sufficient funds to construct and refurbish slaughter houses and training of flayers on a wider scale. The impact of these interventions would be immediate and rewarding. (d) The tanning sub sector
The tanning subsector is a major component of the leather industry and has grown from one tannery in 1974 to five tanneries by 1996. Four tanneries are private owned while one is listed on the Lusaka Stock Exchange. The latter is Zamleather, a subsidiary of Zambeef. The private owned tanneries include Kembe Estates; Tata Tannery, which is a subsidiary of Tata Zambia in Lusaka; King Quality Tannery, formerly Bata Tannery and a subsidiary of Dar Farms Ltd based in Lusaka, and; Malar Tannery, a subsidiary of Malar Industries in Ndola. The geographical locations of these tanneries are indicated in Figure 5.

Supply and Demand survey on the leather industry – Zambia
Page 8 of 67
Figure 5: Geographical Location of Tanneries in Zambia.
Note: Three tanneries are located in Lusaka Province; Kembe and Zamleather Tanneries in Lusaka District and King Quality Tannery in Kafue District. Tata and Malar Tanneries are located in Kabwe District in Central Province (see Table 2 below).
The tanneries produce mainly wet blue, crust and finished leather, as major products (Table 4). Table 5 below, shows types of finished leather which are processed according to customer requirements and specifications. These are widely used in automotive industry, footwear and leather goods manufacturing subsectors.
Table 4: Main tanneries in Zambia
NAME OF TANNERY PRODUCT PRODUCED GEOGRAPHICAL LOCATION Town, Province
Zamleather Wet blue, finished leather, Lusaka, Lusaka Province
Kembe Tannery Wet blue, finished leather, Lusaka, Lusaka province
King Quality Tannery Wet blue, finished leather Kafue, Lusaka Province
Malar Tannery Wet blue, finished leather Kabwe, Central Province
Tata Tannery Wet blue Kabwe, Central Province

Supply and Demand survey on the leather industry – Zambia
Page 9 of 67
Table 5: Types of finished leather produced by tanneries
TYPES OF FINISHED LEATHER
Printed (military)
Corrected grain (Plain)
Corrected grain crust
Crust lining
Hunting calf
Black splits
Upholstery
Vegetable Kips
Vegetable Sole Leather
Mocassin
Suede
Laminated Foot ball leather
Industrial gloves/splits
Insoles
According to the Commercialization of Hides and Skins by Improving Collection and Quality in the Smallholder Farming System Report (2005), the installed tannery capacity utilization of the five tanneries in the country improved from 26–30% in 2000-2002 to 50–60% in 2003–2005. In 2007-2008 the capacity utilization was over 65% while the current utilization stands at 63%. This is still a reflection of inadequate supply of raw hides from the smallholder farming system and slaughter facilities. The improvement in the tanning capacity was partly attributable to the Commercialization of Hides and Skins by Improving Quality and Collection in the Smallholder Farming Systems Project (2004 – 2006) and this was complimented by a Statutory Instrument of 2006 which prohibits the export of raw hides and skins. This allows for more value addition from raw hides and skins to wet blue and beyond before export. This has also allowed for improvement in the installed tannery capacity utilization. The Leather Industry Association of Zambia and in collaboration with Zambia Bureau of Standards (ZABS) developed standards and grading system (ZS 659 of 2006) for wet blue (Tables 6 and 7), with facilitation from the Commercialization of Hides and Skins by Improving Quality and Collection in the Smallholder Farming Systems Project (2004 – 2006). The formulation of this Standard and Grading System was necessitated by the need to assist the Leather Industry to produce good quality wet blue for both domestic and export markets. This was also aimed at minimizing variations between tanneries in terms of quality of wet blue for export and as a tool for pricing purposes.

Supply and Demand survey on the leather industry – Zambia
Page 10 of 67
Table 6: Grading System and Technical Specifications for Bovine Wet blue Leather (ZS 569, 2006) GRADE TECHNICAL CHARACTERISTICS CUTTING VALUE
(%)
1 Absence of branding marks on the Butt, light brand marks on the edges, completely no open defects ie holes and scratches, no flay cuts ie deep ones
90 - 100
2 One or two brand marks on the Butt, no open scratches or holes, slightly few closed scratches on the belly
80 - 90
3 Two brand marks on the Butt, slightly few shallow scratches on the belly, no open scratches, no flay cuts and holes
70 - 80
4 Two or three brand marks on the Butt (deep or shallow), slightly few shallow scratches open scratches, mild flay cuts one or two holes in the middle
65 - 70
5 Three or four brand marks on the Butt and edges (deep or shallow), open scratches and tick wounds on the belly, few flay cuts and grain damage due to improper curing
60 - 65
6 Three or more brand marks (deep or shallow) on the Butt, open scratches and defects, deep flay cuts and three or more holes. Sometimes discoloration due to hair pigmentation and chrome patches, healed wounds
Below 60
Source: Zambia Bureau of Standards, ZS 659 2006
Table 7: Grading of wet blue on the basis of size/mass
SIZE RANGE SQFT AVERAGE SQFT GRADE
Heavy Above 43.0 45.0 – 47.0 1,2 & 3
Medium 38.0 – 43.0 40.0 – 42.0 1, 2 & 3
Light 30.0 – 37.0 34.0 – 36.0 1, 2 & 3
Extra light Less
20.0 – 29.0 Above 25.0 Above 20.0 Above 18.0 Below 18.0
24.0 – 26.0 30.0 – 32.0 30.0 - 32.0 28.0 - 30.0
-
1, 2 & 3 4 5 6
4, 5 & 6
Source: Zambia Bureau of Standards, ZS 659 2006
The tanneries have exhibited potential to produce quality fashion leather for the manufacture of fashion footwear and leather goods but this is constrained by inadequate technology and skills. Therefore, recapitalization of the tanneries with modern tanning and finishing machines is required. About 98% of the total costs are attributed to financing imported chemicals and procurement of raw hides from traders and abattoirs. Attempts were made to establish a credit facility under the Export Development Programme (EDP, 1999) but only one tannery benefited from this fund for the purchase of tannery inputs. Further financial assistance to the tanneries would improve chemical supplies and raw hides and skins. (e) Footwear and leather goods manufacturing subsector
The footwear and leather goods manufacturing subsector utilizes mainly local finished leather, imported components and is specialized in manufacturing footwear, particularly industrial safety boots, military boots, fashion boots, school shoes and sandals (Table 8). The leather goods which are manufactured include hand bags, table mats, wine holders, conference folders, purses, belts, footballs etc.

Supply and Demand survey on the leather industry – Zambia
Page 11 of 67
Table 8: Footwear and leather goods manufacturing subsector
FOOT WEAR MANUFACTURER
MAIN PRODUCTS PRODUCED GEOGRAPHICAL LOCATION Town, Province
Bata Shoe Company Ltd PVC sandals and gumboots Lusaka, Lusaka Province
Zamshoe/Zamleather Safety boots, Safety shoes, Security shoes, security boots, security comat boots, Military boots, Fashion boots, School shoes, Fashion men’s and ladie’s shoes, Leather aprons, Smelter leather suits, Gloves, Spat leggings, wine holders
Lusaka, Lusaka Province
Malar Industries Limited Industrial safety boots, Military Boots, Fashion boots, Fashion shoes, School shoes, Gumboots and sandals, leather products
Ndola, Copper belt Province
Copper belt Shoes Industrial leather footwear, leather school shoes, PVC shoes and sandals
Ndola, Copper belt Province
S.D.Investment Limited Military boots, Industrial safety boots, Safety shoes, Men’s Office footwear, Ladies fashion shoes, Ladies sandals, Men’s fashion shoes, Leather gloves, School shoes
Lusaka, Lusaka Province
Most of the footwear and leather goods manufacturers are located in Lusaka District in Lusaka Province followed by Ndola District in Copper belt Province (Figure 6). There is also a number Micro, Small and Medium Enterprises whose profiles are not documented due to the informal nature of their operations. The SMEs are in clusters and are spread throughout the country. The biggest cluster is found in the capital city of Lusaka. Due to limited technology, equipment and skills, the SMEs are currently concentrating in the manufacturing of leather sandals and school shoes of varying quality for the local market.

Supply and Demand survey on the leather industry – Zambia
Page 12 of 67
Figure 6: Geographical location of leather products manufacturers
Bata Shoe Company was the largest footwear manufacturer in the country, but with effect from April, 2010 the company decided to restructure its business focus from leather shoe production to gumboot production and would instead continue supplying the Zambian market with assorted imported leather footwear from sister Bata companies in the region and abroad. Therefore, the leather footwear factory has been closed and put on sale for any interested investors. The Footwear and leather Goods Subsector is currently facing many challenges, including the following and in order of their importance (a) old and obsolete machines (b) lack of creativity and technology in the production of fashion shoes and (c) inadequate skilled manpower. The subsector will require massive recapitalization in order to remain competitive at both regional and international markets. Attempts were made to improve the quality of footwear and leather goods through UNIDO Projects, in 1990 – 1994 Phase 1, 1995 – 1998 Phase 2 and were extended into a National African Leather and Footwear Scheme. These projects involved capacity building of small and medium entrepreneurs in quality control, production skills and distribution of small to medium footwear machines to SMEs on loan basis. This improved the situation but the machines which were distributed are now old and require replacement. This might require financial and technical assistance to inject new technologies in the footwear and leather goods subsector. Currently, Zambia Development Agency (ZDA) signed a Memorandum of Understanding ( MoU) with the COMESA Leather and Leather Products Institute in 2009, in order to address key constrains, namely financing, production inputs, human resource development, product development, market intelligence, marketing, and quality control and assurance. This MoU is yet to be implemented and once this is done it will add value to the subsector in terms production of quality leather products.

Supply and Demand survey on the leather industry – Zambia
Page 13 of 67
2. Recent and current trends
According to Zambia Development Agency, the exports from the leather sector increased to US$10, 143 193.29 in 2008 from over US$5, 828,890 in 2007, representing an increase of 42.5%. The contribution to total Non Traditional Exports (NTEs) from the Leather Sector in 2008 was 0.84% (Table 9) through exports of Game Trophies which include wild animal hides and skins; Crocodile Skins; Leather Products, which includes wet blue, and finished leather; footwear which comprised mainly safety/protective boots and school shoes; Leather Goods which includes wallets, belts, hand bags, gloves etc; Leather Garments which includes protective aprons, Smelter Suits. Among the Leather Products, Upholstery leather exported to the republic of South Africa for motor vehicles and furniture under the Daimler Chrysler Leather Sourcing Project launched in 2005 added great value to the Leather Industry in the country, between 2006 and 2008. However, in 2009 the Leather Industry faced challenges as a result of the world economic recession and devaluation of the local currency (Zambian Kwacha) to major foreign currencies, the United States Dollar and the British Pound. During the economic recession market access by exporters of wetblue and finished leather reduced significantly due to low demand for these products on the international market. In March, 2010 tanneries resumed normal exports as a sign of recovery from the economic recession
Table 9: Leather contribution to NTEs
Year Leather & leather Products (value US$’000)
Total value of NTEs (US$’000)
Leather & leather products contribution to NTEs %
Leather & leather products export growth %
2003 3,354.17 432,229.23 0.78 -19.01
2004 3,532.54 484,917.62 0.73 5.32
2005 3,959.59 565,687.72 0.69 12.1
2006 4,854.11 757,196.15 0.64 22.59
2007 5,828.89 826,586.79 0.71 20.08
2008 10,143 .19 1 208 814.29 0.83 74.02
(Source: Zambian Leather Industry Profile, Zambia Development Agency, 2009)
3. Prospects for growth in exports/plans for expansion
According to Zambia development agency and Bank of Zambia, the Leather Sector has shown signs of growth from -19.01% in 2003 to 74.02% in 2008 (see Table 9) despite low installed capacity utilization of tanneries , largely due to inadequate supply of raw hides and skins. The manufacturing of footwear and leather goods subsectors are also performing below the installed capacities. This is an indication for existing potential to increase outputs and quality of exports by 50 – 100% and this could be achieved through recapitalization and modernization of the leather sector with new technology, machinery and skills. The low collection levels and quality of raw hides and skins require attention at all levels in the value chain in order to improve the capacity utilization and productivity of the sector. Improved domestic prices of raw hides and skins would improve supply of raw material to the tanneries. The government has put in place a Commercial, Trade and Industry Policy of 2005 and is currently developing an Action Plan for the leather sector. Once completed and implemented, the Action Plan will result into increased exports of quality leather products.

Supply and Demand survey on the leather industry – Zambia
Page 14 of 67
B. Supply capacity
1. Present production capacity
The installed capacity utilization of tanneries and footwear/leather goods manufacturing subsectors largely depend on many factors, including and not limited to the following (a) collection levels and supply of quality raw hides and skins (b) price of hides and skins (c) demand of leather products by both domestic and export markets and (d) current state of technology, machinery and skills. The overall installed utilisation capacity for the five tanneries is approximately 1,700 pieces of hides /wet blue per day against the actual production of 1,080 hides/wet blue per day (Table 7), representing an average of 63.5% of installed tannery capacity utilisation. This translates approximately into 345,600 raw hides which were available per year to the tanneries for processing into wet blue, crust and finished leather, between 2009 and March 2010, representing a 13.3% off take rate against the estimated 8% and 20% in the traditional and commercial sectors, respectively. Approximately a total of 10, 368,000 Square feet of raw hides were processed into wet blue, crust and finished leather, out of which 8,561,200 Square Feet were exported, giving an equivalent of US$ 8,933,995.00 in revenue (Table 10). About 13% to 20% of the total wet blue is reserved for processing further into finished leather.
Currently, Zambia is specialised in the production of large quantities (80%) of wet blue for export and a small proportion of wet blue is retained for further processing into various types of finished leather for domestic market for the manufacture of footwear and leather goods (Table 11). However, these market proportions may change any time depending on the price and demand for a particular leather product.
Table 10: Production levels of wet blue and finished leather: March 2010
RAW HIDES INPUT
(Pieces per day)
PRODUCTION OF WET BLUE/YEAR (PIECES)
PRODUCTION OF WET
BLUE/YEAR (SQFT)
EXPORT/YEAR SQUARE
FEET
EXPORT VALUE US$
WETBLUE FINISHED LEATHER LEATHER
1,080
345,600
10,368,000
8,561,200
7,828,719
1,105,276
Export prices: Wet blue = US$ 0.57 - 1.05/Sqft according to grade; Printed Finished leather = US$ 1.00/Sqft
Table 11: Current leather market proportions for leather
TYPE OF LEATHER MARKET PROPORTION
Finished leather 80% Domestic/Local Market 20% Regional Market 0% International Market
Crust * 5% Domestic/Local Market 0% Regional Market 0% international Market
Wet blue 20% Regional Market 80% International Market

Supply and Demand survey on the leather industry – Zambia
Page 15 of 67
These market proportions strongly suggest that the leather industry in Zambia is based on wet blue exports and finished leather for footwear manufacture, mainly safety boots/shoes and school shoes.
2. Export of wet blue Leather
Zambia’s Global exports of wet blue from 2005 to 2009 are presented in Table 12 below. The wet blue exports exhibited a slight progress from 2005 to 2007 and increased by 22% and 29.5% in terms of quantity and value, respectively. However, there was a sharp decline in exports in terms of both quantity and value by 57.6% and 60% respectively from 2008 to 2009 (Figure 7).
Table 12: Zambia’s global and intra COMESA exports of wet blue, 2005-2009
2005 2006 2007 2008 2009
Zambia’s Total Global Exports Quantity (Kg) Value (US$)
803,919.5 1,763,282.7
1,867,846.0 2,132,829.9
1,459,904.0 2,243,043.5
1,781,055.0 2,905,395.1
1,403,769 1,156,360
Intra COMESA Exports Quantity (Kg) Value (US$)
23,021 11,590
41,058 35,321
30,000 13,037
500 3,664
440 2,499
Source: COMESA/ZRA, 2010
Figure 7 : Zambia's Total global export of wet blue, 2005-2009
0
500000
1000000
1500000
2000000
2500000
3000000
3500000
2005 2006 2007 2008 2009
Quantity (Kg) Value (USD)

Supply and Demand survey on the leather industry – Zambia
Page 16 of 67
Zambia’s Intra COMESA exports of wet blue were not encouraging and showed downward trend. Intra COMESA exports dropped by 26.9% and 63 % in quantities and their corresponding values, respectively in 2006 – 2007, followed by a sharp decline in exports by 98.3% and 71.8% in quantity and value terms , respectively in 2008 – 2009, as demonstrated Figure 8 below. Intra COMESA trade was insignificant compared to global trade (Figure 9).
Figure 8: Zambia's intra COMESA exports of wetblue, 2005-2009
Figure 9 : Zambia's global vs intra COMESA exports of wetblue
The main export markets for wet blue are shown in Table 13 below.
0
5000
10000
15000
20000
25000
30000
35000
40000
45000
2005 2006 2007 2008 2009
Quantity (Kg) Value (USD)
Global Exports of Wetblue
99%
Intra COMESA Exports of Wetblue
1%

Supply and Demand survey on the leather industry – Zambia
Page 17 of 67
Table 13: Zambia’s export markets for wet blue, 2005-2009
EUROPE AND ASIA/FAR EAST REGIONAL MARKETS COMESA AND SADC
China South Africa
Netherlands Kenya
Great Britain Tanzania
India Zimbabwe
Hong Kong
Italy
Switzerland
Poland
Turkey
Pakistan
Greece
Republic of Thailand
United Arab Emirates
France
3. Export of finished leather
Table 14 below, shows global and Intra COMESA exports of finished leather in both quantities and values. Figure 10, shows that there was a significant increase in exports of finished leather by 145.6% in quantities and a corresponding dramatic increase in value (US$) by 143.6% between 2007 and 2008. The increase in exports of finished leather could be attributed to an increase in upholstery leather exported to the republic of South Africa for motor vehicles and furniture. Leather Upholstery exports to South Africa were boosted by the Daimler Chrysler Leather Sourcing Project launched in 2005.
Table 14: Zambia’s global exports of finished leather, 2005-2009
2005 2006 2007 2008 2009
Global Exports Quantity (Kg) Value (US$)
1,602 2,337
14,786 46,316.9
19,869..3
9,592
48,399
283,460.7
18,360
104,283.4
IntraCOMESA Exports Quantity (Kg) Value (US$)
- -
- -
- -
250 1,874
960.0 5,370.2
Source: ZRA/COMESA, 2010

Supply and Demand survey on the leather industry – Zambia
Page 18 of 67
Figure 10: Zambia's global exports of finished leather, 2005-2009
However, between 2008 and 2009 exports of finished leather fell dramatically by 62% in quantities and 63.2% in value terms. The major export markets for finished leather in 2005 – 2009 included, South Africa, Tanzania, Malawi and Zimbabwe.
The potential to increase exports of wet blue and finished was undermined by many factors, between 2008 and 2009 and these included both external and domestic factors. As the global economy slowed down towards the close of 2008, the Leather Industry was one of the first to be affected and this was manifested by reduced exports, especially in 2009.
During this period of economic recession all tanneries in the country were stuck with thousands of wet blue in the warehouses due to reduced demand at international market in Europe and Asia. Export prices at international market, especially for wet blue, dropped to unsustainable levels by 57.1% from US$1.05 to US$0.45 for grades 1, 2 and 3. The price for grade 4 fell by 45.2% from US$0.65 to US$0.30 (Tables 6 and 7).
This had a trickledown effect on the price of raw hides at domestic markets in Africa and Zambia in particular. Zambia recorded a sharp drop of 62.1% in the price of raw hides, from US$14.50 to US$ 5.50 between 2008 – September, 2009 and this dropped even further to US$ 2.0 by the end of 2009. This affected the normal supply of raw hides from traders, farmers and abattoirs to the tanneries. Most traders and abattoirs withheld their raw hides in anticipation for better prices in the near future. However, the prices for raw hides started to rise in February, 2010 from US$2.00 to US$3.30 – 4.00 and this trend is expected to continue in 2010 and for the next five years. The traders and Abattoirs Association are anticipating domestic prices of raw hides to rise between US$10.00 and US$14 per piece. Most tanneries are have now started experiencing normal supplies of raw hides from traders and abattoir operators as a result of improved domestic prices. Consequently, most tanneries have also resumed normal exports as a sign of recovery from economic recession and improved export prices (Table 15).
0
50,000
100,000
150,000
200,000
250,000
300,000
2005 2006 2007 2008 2009
Quantity (Kg) Value (USD)

Supply and Demand survey on the leather industry – Zambia
Page 19 of 67
Table 15: Export prices of wet blue and types of finished leather (2010)
TYPES OF FINISHED LEATHER
EXPORT PRICE (US$/SQFT)
Wet blue Grade A,B & C Grade D
1.05 0.65
Crust leather
Finished leather:
Printed (military) Grade A, B & C 1.10 – 1.25; 1.00 & 0.80 – 0.90
Corrected grain (Plain) Grade A,B & C 1.30 – 1.35; 1.20 & 1.00
Corrected grain crust 0.90
Crust lining 0.60 – 0.70
Black splits 0.80
Upholstery 2.00
Vegetable Kips
Mocassin 1.35- 1.45
Suede 1.00
Industrial gloves 0.50
Insoles 0.35
The major drivers of exports are sustainable and improved domestic prices for raw hides/skins, assured export market for wet blue, crust and finished leather and competitive export prices. Improved infrastructure for collection and preservation of raw hides/ skins, modernization of tanning machines/technology and upgrading manpower skills would dramatically stimulate exports due to improved quality. These are inadequate at the moment. As a short and midterm strategy, Zambia should consider importing wet blue (hides and skins) from COMESA region to meet its processing requirements in order to meet the projected exports. As a long term strategy, the government is currently (a) establishing Disease Free Zone (DFZ, Figure 11) and breeding centres in the country; (b) implementing Restocking in deficit areas and Disease Control Programme by immunizing cattle against Contagious Bovine Pleural pneumonia (CBPP) and Ticks and Tick borne Diseases through the Smallholder Livestock Investment Project (SLIP, 2007 – 2014) with financial support from the International Fund for Development (IFAD).
The designated DFZ area is approximately 105,000 Square Kilometers encompassing ten districts in Central, Copper belt and Lusaka Provinces, as indicated in Figure 11(Establishment of Disease Free Zone in Zambia Report, 2009). The aim of DFZ is to open opportunities for improved local trade and export of quality livestock and livestock products through increased productivity and control of major livestock diseases.

Supply and Demand survey on the leather industry – Zambia
Page 20 of 67
Figure 11: Disease Free Zone in Zambia
Consequently, these strategies will result into increased livestock production and byproducts, including raw hides /skins through increased livestock numbers, from the current 2.6 million cattle, 970,000 sheep and 1 million goats by five folds to match the available natural and feed resources. The rationale for increased livestock numbers is to expand the leather industry and ensure the availability of raw hides and skins for processing into wet blue and beyond.
4. Export of wildlife hides and skins
Previous studies (Siamudaala V.M, Kunda C and Nambota A.N (2004) indicated an average of 26,138 crocodile skins were exported between 2000 and 2004 (Table 16). Singapore, Japan and South Africa were the major export markets for crocodile skins and this trend remains the same to date.
Table 16: Number of crocodile skins exported and destinations, 2000-2003
COUNTRY 2000 2001 2002 2003 YEARLY MEAN
% SHARE
RANKING
Singapore Japan South Africa Mexico USA Spain Italy
15,896 700 3,676 3,902 2 - -
22,582 4,497 2,153 - 2 - 410
10,711 7,966 567 - 3,370 - -
13,530 12,936 250 - - 1,403 -
15,680 6,525 1,615 976 94 351 103
60 25 6.4 3.7 3.2 1.3 0.4
1 2 3 4 5 6 7
Total 24,176 29,644 22,614 28,119 26,138
Source: Siamudaala et al., 2004

Supply and Demand survey on the leather industry – Zambia
Page 21 of 67
In this study, the crocodile skin exports showed a positive trend between 2005 and 2006 (Table 17 and Figure 12) but were hit hard with the recent global recession in 2009 with a huge decrease in the price of skins. This is demonstrated by gradual decline in exports from US$ 4,613,801.4 to US$2, 228,589, representing a reduction of 51.7%, between 2006 and 2009.
Table 17: Zambia’s global exports of crocodile skins, 2005-2009
2005 2006 2007 2008 2009
Quantity(Kg) Value (US$)
33,765.7 2,989,940.4
59,800.3 4,613,801.4
61,113 3,368,512.7
51,268 2,894,998.3
40,242 2,228,589
Figure 12: Zambia's global crocodile skins exports, 2005-2009
The crocodile farmers indicated that during the economic recession the demand for crocodile skins decreased with only very big skins being in demand. Due to this, most crocodile farmers were financially constrained to purchase high quality feeds resulting in poor growth of crocodiles and consequently yielding small skins. During the same period of the economic recession (2008/2009) the Zambian crocodile skins could not compete with the American alligator skins which took most of the market at a much competitive price. Farmers further claimed that high export fees charged by ZAWA and the high feed, medication and building costs simply added to their financial difficulties. This subsector is small but is of high value. All the crocodile skins are exported in raw form (wet salted) largely due to lack of value addition facilities and technology.
Exports of wildlife hides were minimal (Table 18) and exhibited slow progress from 2005 to 2008 before showing significant increase of 29 folds (Figure 13).
Table 18: Zambia’s global exports of wildlife hides/trophies, 2005-2009
2005 2006 2007 2008 2009
Quantity (Kg) 44 65.7 33 956 117.8
Value (US$) 200 288 1,810 7,445 228,240
Source: COMESA, 2010
0
500000
1000000
1500000
2000000
2500000
3000000
3500000
4000000
4500000
5000000
2005 2006 2007 2008 2009
Quantity (Kg) Value (USD)

Supply and Demand survey on the leather industry – Zambia
Page 22 of 67
Figure 13: Zambia's exports of wildlife hides/trophies, 2005-2009
5. Export of footwear
This subsector is relatively small and its products are targeted at domestic and regional markets. Domestic market comprises mainly schools, mining and construction sectors. The main footwear products which are produced include safety boots/shoes, schools shoes and gum boots. Fashion shoes are manufactured at low levels and on order. However, the Small and Medium Enterprises produce significant number of pairs of school shoes for domestic market and not for export due low/medium quality.
The Footwear Subsector is increasingly becoming competitive in the COMESA/SADC region, in both quality and price. Table 19 below, shows Global and Intra COMESA exports of footwear and Figures 14 and 15 are demonstrating the trends, respectively. In both cases, the quantities of footwear declined sharply from 2006 to 2009 while the corresponding values (US$) declined gradually. Most Footwear manufacturers recorded lowest exports in terms of quantities but their corresponding values were somehow better than anticipated. Reduced demand by export markets was said to be the main cause and it was attributed to the World economic Recession in 2008/2009.
Table 19: Zambia’s global and intra COMESA footwear exports (2006-2009)
2005 2006 2007 2008 2009
Zambia’s Global Footwear Exports Quantity (pairs) Value (US$)
10,990 99,823.07
1,396,605 2,141,216
340,715 1,842,274
130,678 2,350,198
81,717 1,139,603
Zambia’s Intra COMESA Footwear Exports Quantity (pairs) Value (US$)
10,728 96, 494.66
1,396,569 2,140, 464
361,356 932,923
83,903 1,219,374
43,421 629,350
Source : COMESA, 2010
0
50000
100000
150000
200000
250000
2005 2006 2007 2008 2009
Quantity (Kg) Value (USD)

Supply and Demand survey on the leather industry – Zambia
Page 23 of 67
Figure 14: Zambia's global Footwear exports, 2005-2009
Figure 15 : Zambia's intra COMESA footwear exports, 2005-2009
The Global Export Market for the footwear included Singapore, South Africa, Ukraine, Belgium, Canada, Ghana, and United Kingdom. Zambia exported footwear to COMESA member states, including Botswana, Democratic Republic of Congo (DRC), Egypt, Malawi, Mozambique and Zimbabwe. Surprisingly, global trade in footwear was more significant than Intra COMESA trade (Figure 16).
0
500,000
1,000,000
1,500,000
2,000,000
2,500,000
2005 2006 2007 2008 2009
Quantity (pairs) Value (USD)
0
500,000
1,000,000
1,500,000
2,000,000
2,500,000
2005 2006 2007 2008 2009
Quantity (pairs) Value (USD)

Supply and Demand survey on the leather industry – Zambia
Page 24 of 67
Figure 16 : Zambia's global vs intra COMESA footwear exports (US$), 2005-2009
6. Export of leather goods/articles
Zambia’s exports of leather goods/articles included items such as wallets, belts, gloves, hand bags, leather cushions covers, harness, belts, leather spats, pulses, etc. Exports of leather goods exhibited positive trend from 2005 to 2007 but drastically fell by 19,100 Kg representing a reduction of 96% from 2007 to 2008 (Figure 17). Exports picked up again by 8.8 folds or increased by 6,700.9 Kg from 755.5Kg to 7456.36 Kg between 2008 and 2009. This trend demonstrates clearly that Zambia could benefit more from exports of leather goods. Most exports in leather goods/articles were Intra COMESA especially to Democratic Republic of Congo (DRC), Kenya, Malawi, Mozambique and Namibia (Figure 18). International export markets included Great Britain and Canada.
Figure 17 : Global exports of leather goods/articles (Kg)
Zambia's Global
Footwear Exports
61%
Zambia's
Intra COMESA Footwear
exports 39%
0
5000
10000
15000
20000
25000
2005 2006 2007 2008 2009
Quantity (Kg)

Supply and Demand survey on the leather industry – Zambia
Page 25 of 67
Figure 18: Zambia’s global vs intra COMESA leather goods exports, 2005-2009
Export market prices of footwear and leather goods are shown in Table 20, below.
Table 20: Export prices for selected leather footwear and leather goods
7. Share of national production exported
Table 21 below, shows total value (US$) of leather products by category from 2005 to 2009 and Figure 19, indicates the share of export market by each of the leather products exported.
Zambia's Global
Exports of Leather
Goods/Articles
18%
Zambia's Intra
COMESA Exports of
Leather Goods/Article
s 82%
TYPE OF LEATHER/PRODUCT DESCRIPTION OF LEATHER PRODUCT
AVERAGE EXPORT PRICE (US$). FOB
Foot wear:
Security boots With steel toe cap and PU sole Without steel toe cap, with PU sole With PVC sole and steel toe cap With PVC sole, without steel cap
25.00 22.60 20.80 17.00
Safety shoes With steel toe cap and with PU sole With PVC sole and with steel toe cap
19.00 17.30
Fashion boots 25.00
School shoes 14.00
Leather goods:
Hand bags 80.00
Conference folders 20.00
Brief cases 50 - 70
Wine holders 20 - 30

Supply and Demand survey on the leather industry – Zambia
Page 26 of 67
Table 21: Share of export market by category of leather product, 2005-2009
TYPE OF LEATHER PRODUCT EXPORTED
VALUE (US$) (cumulative over five years 2005-2009)
AVERAGE US$/YEAR
RANKING
Crocodile Skins 15,138,390.10 3,027,678.0 1
Footwear 10,354,761.07 2,070,952.2 2
Wet blue 10,261,022.00 2,052,204.4 3
Fished Leather 445,990.00 891,198.0 4
Trophies 239,983.00 47,996.0 5
Total 36,440,146.17 8,090,028.6
Figure 19 : Share of export market by categories of leather products (US$), 2005-2009
Although small quantities of crocodile skins were exported their value (US$) was the largest by 37%, followed by footwear (26%), wet blue (25%), finished leather (11%) and the least being wildlife hides/skins or trophies (1%). This suggests that Zambia has potential to increase exports from crocodile skins, wet blue and footwear exports. Therefore, particular attention should be given to improving the policies; infrastructure and quality assured value chain, in terms of animal husbandry practices and collection of raw hides and skins; slaughter facilities; and improved technology and skills in tanning of wet blue and beyond. Further value addition by manufacturing footwear would the country substantial foreign exchange.
Crocodile Skins 37%
Footwear 26%
Wet blue 25%
Fished Leather
11% Trophies
1%

Supply and Demand survey on the leather industry – Zambia
Page 27 of 67
C. Commercial practices
1. Major transport routes utilized
Because of the bulkiness of wet blue, crust and finished leather, in terms of volume and weight most exporters prefer using road transport from Zambia to Durban and from Durban to Asia/Europe by sea. This route and transport mode has been perceived cost effective but does not meet the desired transit and delivery time. However, new developments are emerging where exporters are compelled to use road transport from Zambia to Johannesburg and by air freight from Johannesburg to Asia, particularly India. This is to achieve the desired transit and delivery time.
2. Forms of payment generally required
Zambian companies exporting wet blue, footwear and leather goods to Europe, Asia and COMESA/SADC normally receive payments through Telegraphic Transfer and this transaction occurs 4 to 8 weeks after good have shipped, where as tanneries and footwear/leather goods manufacturers more often make pre-payments through Telegraphic Transfer for all tanning chemicals, machinery, tools and accessories ordered. The commonly used banks include CITI Bank, Barclays Bank, Standard Chartered, Stanbik, and Indo Zambia Bank.
3. Packaging utilized
Wet blue leather is packaged using wooden pallets, plastic sheeting and plastic strapping. The packaging measures 1.8 x 1.0 x 1.1 meters and weighs approximately 2 tonnes gross weight per pallet. The finished leather is exported into bundles measuring 1.3 meters long and 0.2 meters in diameter/bundle and is rolled into plastic sheet and weighs almost 15Kg gross weight per bundle.

Supply and Demand survey on the leather industry – Zambia
Page 28 of 67
II. DEMAND SURVEY
A. Overview of the leather market
1. Structure of the leather market
Zambia has a relatively large domestic market consisting of a population of 12.2 million people and this is projected to 20 million people by 2025 (CSO, 2003). This consumer market for the leather products is facilitated by importers and traders who import various assorted leather products. The boutiques normally import high quality leather products for medium and high income bracket people while general dealer’s shops and including the Chinese shops target poor people in the society and their leather products have a wide variation in quality. The leather market in the country is also based on the emerging mines and construction industries which depend more on protective leather footwear. The primary, secondary, colleges and universities provide an active market for the leather products, especially footwear.
The Zambian footwear and leather goods manufacturing subsector is by far small and inadequate to meet the demands by people for different products. Importation of leather products is necessary to meet people’s demands.
2. Recent and current import trends
There are currently huge informal cross border imports of leather goods and an influx of second hand leather products in the country. There is also a shift from low to high quality leather products with rising household incomes and this has facilitated high imports of leather products in the country. Zambia’s imports of leather products has more than tripled from US$3.5 million in 2003 to US$10 million in 2008. The majority of imports were footwear and leather goods.
3. Prospects for growth in imports
The Zambian Leather Industry, as indicated earlier, is small and unable to satisfy the domestic market. With the current low technology and inadequate skills, it is difficult to produce quality leather products to satisfy the market but will depend on imports for a long time.

Supply and Demand survey on the leather industry – Zambia
Page 29 of 67
B. Imports of leather products
1. Import of hides and Sskins
Tanneries imported hides, skins and finished leather, between 2005 - 2009 (Table 22) in order to meet the impending deficit in raw material supply from the traders and abattoirs. There was critical short supply of hides from 2004 – 2005/6 and this was attributed high level of smuggling outside the country by traders in fetch of better prices. This compelled tanneries and manufacturers to import hides, wet blue and finished leather.
Table 22: Zambia’s global and intra COMESA imports of hides/skins and finished leather
2006 2007 2008 2009
Zambia’s Global Imports Value (US$) Quantity (Kg)
101,856 33,851
171,970 17,584
210,219 96,138
15,444 1,785
Intra COMESA Imports Value (US$) Quantity (Kg)
28,278 1,586
156,842 13,837
23,863 2004
1,307 125
Source: COMESA, 2010
The global imports were gradual but showed a decline between 2006 and 2007and picked up between 2007 and 2008 before falling drastically by 98% and 92.7% in terms of quantity and value, respectively (Figure 20). Imports from COMESA member states exhibited a sharper increase (Figure 21) by four folds (4.5) and 7.7 folds in value and quantity terms, respectively, before declining sharply in 2009. However, Intra COMESA imports were much lower than global imports (Figure 22).
It is important to note that the country produces sufficient raw hides and skins to satisfy the tanneries and manufacturing sector. However, low collection levels and poor quality of most raw materials are the major factors contributing to low installed capacity utilization of tanneries and footwear/leather goods subsectors.

Supply and Demand survey on the leather industry – Zambia
Page 30 of 67
Figure 20 : Zambia's global imports of hides/skins and finished leather, 2006-2009
Figure 21 : Zambia's intra COMESA imports of hides /skins and finished leather, 2006-2009
0
50000
100000
150000
200000
250000
2006 2007 2008 2009
Value (USD) Quantity (Kg)
0
20000
40000
60000
80000
100000
120000
140000
160000
180000
2006 2007 2008 2009
Value (USD) Quantity (Kg)

Supply and Demand survey on the leather industry – Zambia
Page 31 of 67
Figure 22: Zambia's global vs intra COMESA imports of hides/skins and finished leather, 2006-2009
Despite good import incentives, the country imported less from COMESA member countries and the issue of quality emerged prominently.
2. Import of footwear
The Zambian Footwear Manufacturing Subsector is small and falls short in the capacity to produce fashion shoes for the domestic market. The gap is filled by imported leather footwear. Zambia can be described as a net importer of footwear. There is also a gap in meeting protective boots and shoes and these are also imported in large quantities.
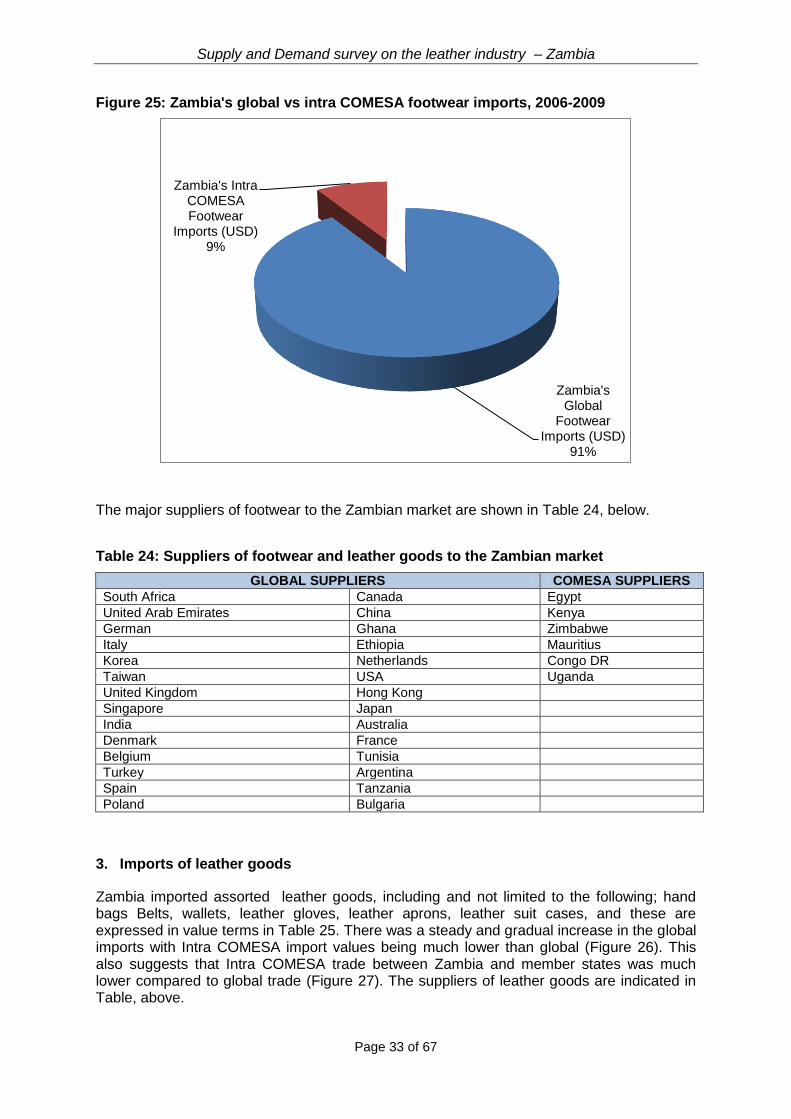
Table 23 below, shows Global and Intra COMESA imports of footwear and this demonstrates the potential to import even more as the economy picks up and people’s incomes improve. Figure 23 shows the trend of global footwear imports and it appears that the value of such imports were much higher and increasing with time before declining slightly in 2009, while Figure 24 indicates that the value (US$) of Intra COMESA imports of footwear which kept on declining from US$2, 100,789 in 2006 to US$ 222,275 in 2009, representing a decline of 89% (Table 23)
Intra COMESA imports of footwear were much lower than Global imports of the same (Figure 25). This trend is bound to continue if quality issues are not addressed by COMESA manufacturers and imports from Europe will continue to dominate due to their competitiveness in terms of quality.
Zambia's Global
Imports of hides and
Skins Leather (USD) 70%
Zambia's Intra COMESA Imports of Hides and
Skins Leather (USD) 30%

Supply and Demand survey on the leather industry – Zambia
Page 32 of 67
Table 23: Global and intra COMESA footwear imports, 2006-2009
2006 2007 2008 2009
Zambia’s Global Footwear Imports Quantity (pairs) Value (US$)
1,260,851 11,135,396
1,057,205 13,879,953
1,220,538 15,347,606
841,841 13,608,178
Zambia’s COMESA Footwear Imports Quantity (pairs) Value (US$)
95,448 2,100,789
50,950 1,822,154
83,903 1,219,374
11,070 222,275
Source: COMESA, 2010
Figure 23: Zambia's global footwear imports, 2006-2009
Figure 24 : Zambia's intra COMESA footwear imports, 2006-2009
0
2,000,000
4,000,000
6,000,000
8,000,000
10,000,000
12,000,000
14,000,000
16,000,000
2006 2007 2008 2009
Quantity (pairs) Value (USD)
0
500,000
1,000,000
1,500,000
2,000,000
2,500,000
2006 2007 2008 2009
Quantity (pairs) Value (USD)
Supply and Demand survey on the leather industry – Zambia
Page 33 of 67
Figure 25: Zambia's global vs intra COMESA footwear imports, 2006-2009
The major suppliers of footwear to the Zambian market are shown in Table 24, below.
Table 24: Suppliers of footwear and leather goods to the Zambian market
GLOBAL SUPPLIERS COMESA SUPPLIERS
South Africa Canada Egypt
United Arab Emirates China Kenya
German Ghana Zimbabwe
Italy Ethiopia Mauritius
Korea Netherlands Congo DR
Taiwan USA Uganda
United Kingdom Hong Kong
Singapore Japan
India Australia
Denmark France
Belgium Tunisia
Turkey Argentina
Spain Tanzania
Poland Bulgaria
3. Imports of leather goods
Zambia imported assorted leather goods, including and not limited to the following; hand bags Belts, wallets, leather gloves, leather aprons, leather suit cases, and these are expressed in value terms in Table 25. There was a steady and gradual increase in the global imports with Intra COMESA import values being much lower than global (Figure 26). This also suggests that Intra COMESA trade between Zambia and member states was much lower compared to global trade (Figure 27). The suppliers of leather goods are indicated in Table, above.
Zambia's Global
Footwear Imports (USD)
91%
Zambia's Intra COMESA Footwear
Imports (USD) 9%

Supply and Demand survey on the leather industry – Zambia
Page 34 of 67
Table 25: Global and intra COMESA leather goods imports (US$)
2006 2007 2008
Global Leather Goods Imports 3,023,758 3,399,180 3,540,767
Intra COMESA :Leather Goods Imports
52,496 92,414 174,121
Figure 26 : Zambia's global and intra COMESA imports of leather goods, 2006-2008
Figure 27 : Zambia's global vs intra COMESA imports of leather goods, 2006-2008
0
500,000
1,000,000
1,500,000
2,000,000
2,500,000
3,000,000
3,500,000
4,000,000
2006 2007 2008
Zambia's Global Imports of Leather Goods (USD)
Zambia's Intra COMESA Imports of Leather Goods (USD)
Zambia's Global
Imports of Leather Goods 97%
Zambia's Intra COMESA Imports of Leather Goods
3%

Supply and Demand survey on the leather industry – Zambia
Page 35 of 67
4. Import distribution channels
Zambian tanners, footwear and leather goods manufacturers apply a combination of the following options when importing inputs and leather products; (a) direct imports from suppliers and (b) imports through agents, both domestic and foreign. Direct imports from suppliers are cheaper but have a cumbersome process. Imports through agents attract a commission fee which is user friendly. The third option is where by traders import and supply retail shops/boutiques. Wholesale footwear shops are now mash rooming in towns where vendors and small shops can Access footwear for retail.
5. Competitive factors of imported products
The demand for quality leather products is increasing and this is reflected on the rising supply levels in Table 22 and 23; Figures 20 and 21. This can be attributed to improved household incomes especially in the urban areas. The imported leather products from Europe and America are considered to be of high quality and are preferred to local leather products. However, the prices of most imported leather products are normally high and out of reach of most poor people who are the majority. This has created an opportunity for influx of imported cheap and second hand leather products, especially footwear and garments which are a threat to both locally manufactured and imported quality leather goods. Besides the second hand products, the country has also been flooded with cheap leather products from China, in terms of both quality and price. The leather products from America and Europe are also facing competition from imitations which are normally disposed off at cheap prices. However, the government issued a Statutory Instrument in 2003 which imposed an import levy on all imported second hand leather products, especially shoes. This levy allows the locally produced leather products to be more competitive to cheap and subsidized imported leather goods However, the market share for imported quality leather products is not under extreme threat but is expected to increase as the economy shows signs of recovery. 6. Experiences in importing from or partnering with other COMESA countries, Italy
and India
The Italian footwear/leather goods is a household name in Zambia and has gained high reputation due to high quality leather products. Italian fashion shoes, leather jackets, belts and wallets are on high demand on the market. India provides competitive and genuine leather products but these have not penetrated the domestic market to a large extent. However, Zambia imports from India tanning chemicals, footwear accessories and textile garments at competitive market price.

Supply and Demand survey on the leather industry – Zambia
Page 36 of 67
C. Prevailing product requirements and commercial practices
1. Product specifications
The Zambia Bureau of standards is responsible for setting standards for goods and machinery in the country. Currently, there are no standards set for fashion shoes and leather. However, standards for protective and safety leather footwear are available. The standard ZS 073 Part 1 of 1987, referred to as the Industrial Safety Footwear provides specifications for leather protective and safety footwear for normal and heavy duty use. The standard for canvas shoes (ZS072 of 1985) also provides specifications for canvas shoes. The standard for protective and safety footwear (ZS073) was put in place due to the importance attached to safety, especially in the mines and construction industries and the standard for canvas shoes was simply established because of their common use by then. The standards for protective and canvas footwear specifies that these should have minimum labeling requirements and should be marked in terms of (a) size in either British, continental or American and (b) name, trade mark or any means of identification of the manufacturer. The leather product should be of good quality in terms colour, texture, finishing and lack of visible defects.
2. Certification and inspection requirements
The certificate of inspection is an essential component in the transaction and delivery of imported goods. This ensures that the buyer receives what is paid for in terms of quality, quantity and other specifications demanded by the buyer. In Zambia, this is normally applied to machinery, agricultural grains/produce and not on footwear and leather goods. The SGS and Socotech are responsible for such inspections before delivery. The Zambia Bureau of Standards (ZBS) is in the process of establishing a Pre-Export Verification Conformity to Standards for all goods and services. This means that goods will be tested in the country of origin, against the specifications demanded by an importer in Zambia. 3. Packaging requirements
Packaging for imports such as tanning chemicals should be environmentally friendly ie should be water proof or water tight. This is a requirement by Environmental Council of Zambia. Machinery, equipment and tools should be secured in appropriate wooden boxes. Footwear imports are packaged in paper boxes and appropriately labeled.
4. Contractual standards
The International Contract No. 6 is a requirement for every consignment which is exported. The contract specifies the following; quantity, description of leather products, price, mode of payment, insurance cover, and packaging.
5. Customary methods of payment and conditions
Zambian tanners, footwear/leather goods manufacturers normally prepay for goods ordered from Europe, Asia, COMESA/SADC and this done through telegraphic transfer. However, credit facilities are available in cases where client-customer relationship has been long enough and trustworthy.

Supply and Demand survey on the leather industry – Zambia
Page 37 of 67
6. Delivery timeline
Zambia is a land locked country and pursues a policy of regional cooperation with COMESA and SADC member states in order to maximize access to the regions transport infrastructure and achieve timeliness in service/goods delivery. This ensures that goods and services reach the destinations on time with minimum delays if possible. The most frequently used ports include Durban in South Africa, Dar-es- Salaam in Tanzania and Walvis bay in Namibia (shortest route), with the route to the port of Beira in Mozambique being another route. Goods may be transported by road or road to and from the ports. The most acceptable delivery timeframe for imported goods from COMESA/SADC member states or from any other African state is 4 – 6 weeks and from Europe 10 weeks.
D. Market entry
1. National import policy
Zambia became free market economy in 1991 and the Commercial, Trade and Industrial Policy was established in 2005. These provide a policy framework for importation of leather products and inputs without major hindrances. Currently, duty on importation of tanning chemicals, machinery, tools and equipment was removed in order to facilitate growth, development and competitiveness of the Leather Industry, both at regional and internal level.
2. Customs rules and regulations
The COMESA Free Trade Area and Customs Union the Common External Tariff (CET) were established and are applicable to COMESA member states and are applied as follows; 0% for imported capital goods, 0% for imported raw materials, 10% for imported intermediate or semi processed goods and 25% for finished goods or processed goods. In this case, wet blue leather, being semi processed, would attract a 10% import duty and finished leather and leather products would attract 25% import duty. The Ministry of Livestock and Fisheries ensures that all livestock related imports have valid Veterinary and Phytosanitary certification from the country of origin. This is to ensure that such imports are not contaminated or diseased. Every consignment should be accompanied by the following documents; (a) International Sanitary Certificate (b) Export Permit (c) International Contract (d) invoice and (e) Certificate of compliance/Fumigation.
3. Preferential import schemes
Currently the FTA and Custom Union were established for countries in COMESA and members of Custom Union and these enjoy certain privileges as outlined in paragraph 6.2 above.

Supply and Demand survey on the leather industry – Zambia
Page 38 of 67
4. Certificate of origin requirements
Companies in COMESA who wish to export to other member states and wish their goods to receive preferential treatment in terms of import duty rates are required to obtain a certificate of origin for their goods and services. In Zambia, the Zambia Revenue Authority (ZRA) was accredited to issue the Certificate of origin and perform all statutory functions concerning imports and export duty rates. The adherence to the rules of origin for the goods and services to be exported is critical before the certificate of origin is issued. Goods and services being imported into Zambia from COMESA states should have this certificate, failure to which they would attract a higher import duty.
5. Free Trade Zones
The Common Market for Eastern and Southern Africa (COMESA) nineteen (19) member states, including Zambia, agreed to establish a Free Trade Area (FTA) on 31st October 2000 for the purpose of facilitating intra COMESA trade by removing tariffs and Non Tariff Barriers (NTBs). This means that goods and services that are produced within COMESA are able to move freely between COMESA countries and receive preferential treatment so long they meet the rules of origin.
The impact of FTA has been exhibited by the growth in intra regional trade from US$ 3billion to US$ 8.6 billion by 2007 and to US$ 15billion by 2008 through increased cross border trade for goods and services. Other benefits of FTA include and not limited to the following; (a) increased competitiveness among companies in COMESA resulting into increased efficiency and quality of goods and services (b) harmonized implementation of projects/programmes and trade facilitation (c) increased foreign investment and efficient allocation of resources (d) strengthened institutional capacity and enhanced value chain.
COMESA decided to deepen its integration from FTA to Customs Union and the later was established in December, 2008. The Customs Union is perceived more superior to FTA since it is a larger market and removes most policy distortions which exist between member states. The members of the Customs Union, therefore, have a common set of import duty rates from countries that are not members. These duty rates are outline in paragraph 6.2 above.
E. Government policy
1. Foreign investment conditions
The country has for a long time depended on minerals such copper and cobalt for its economy. This has proved unsustainable for the country and hence a policy decision to shift from a mineral based economy to one that is based on agriculture, manufacturing and services through the active encouragement of Foreign Direct Investment (FDI) through privatization and Public-Private Partnership (PPP) arrangement. While there are no requirements for local content, equity, financing, employment or technology transfers, companies seeking licenses or concessions, or investors bidding for privatized companies are encouraged to commit to local participation.

Supply and Demand survey on the leather industry – Zambia
Page 39 of 67
Zambia in its current form has low labour costs, with an abundance of unskilled labour and adequate semi-skilled and skilled manpower. Investors are free to repatriate capital investment as well as dividends, management fees, interest, profit, technical fees and royalties. There are no exchange controls in the country and foreign nationals are may transfer/remit wages earned in Zambia with ease.
The Government of Zambia has put in place certain incentives which are aimed at establishing a climate for increased domestic industrial growth, attracting foreign direct investment, promoting exports and developing the private sector. Among the Non Traditional Exports (NTE), leather and leather products have received profound attention as means of increasing economic diversification and growth. Investors venturing in NTEs are given special incentives, such as reduced corporate tax of 15% instead of the standard 35%, exemption from duty and sales tax on imports and machinery is offered to exporters of non- traditional products with net foreign exchange earnings.
The establishment of the Multi-Facility Economic Zones (MFEZs) in country, one in the Copper belt Province and two in Lusaka Province, will increase FDI and companies involved into non- traditional products will further enjoy other incentives such as
2. Environmental legislation
The Environmental Council of Zambia (ECZ) is charged with the responsibility of regulating environmental issues in the country. Under the Environment Act of 1990, CAP 204 of the Laws of Zambia, ECZ is responsible for regulating and controlling the importation/ export, manufacture, storage, distribution, sale use, packing, transport and disposal of chemicals which include chemicals used in the leather sector. The Pesticide and Toxic Substances Regulation demands that ECZ registers and licenses all companies involved in the importation and export chemicals. The Zambia Revenue Authority (ZRA) will not clear any imported chemicals, if for instance the company importing is not registered with ECZ. The Environmental Impact Assessment is always conducted by ECZ before a company is established and a licence. Under this regulation all tanneries are inspected annually to ensure that effluent disposal system is in accordance with the regulation (www.necz.org.zm).
F. Conclusions and recommendations
Zambia imported footwear and hides/skins worthy US$ 59,335,725.00 and US$ 709,779 respectively, from 2006 to 2009. About 99% of the total imports were attributed to footwear (Fig. 28). Most of the imported footwear were mainly fashion shoes and this is likely to increase as the economy and household incomes improve. About US$ 10,282,736.00 worthy of leather goods, mainly belts, wallets, key holders and leather jackets were imported, from 2006 to 2008. This gives a total of US$ 70, 328,240.00 worthy of imported leather products in four (4) years (2006 – 2009) against US$ 36,440,146.17.00 worthy of exported wet blue, crocodile skins, finished leather, footwear, and leather goods in five (5) years (2005 – 2009, Fig. 29). This suggests that Zambia is a net importer of leather and leather products.

Supply and Demand survey on the leather industry – Zambia
Page 40 of 67
Figure 28 : Market share of imported leather products (US$), 2006-2009
Figure 29 : Leather products imports vs exports (US$)
1. Recommendations
The importation of tanning chemicals, footwear components and accessories constitute the largest cost in the Leather Industry. Under the current conditions, Zambian importers pre pay for all imports and these take 4 – 6 weeks before they are delivered at the destination in the country, while it also takes the same period for Zambian exporters to receive payments from their clients in Europe. This has negative impact on the cash flow. Trade financing especially for chemicals/technology and footwear components imports is necessary. This would sustain the leather sector.
Leather Goods 1%
Footwear 99%
Leather Products Imports(USD), 2006 - 2009
Leather Products Exports(USD), 2005 - 2009
70,328,240
36,440,146.17

Supply and Demand survey on the leather industry – Zambia
Page 41 of 67
Annex I: References
1. Commercial, Trade and Industry Policy (2005): Ministry of Commerce, Trade and Industry; Government of Republic of Zambia.
2. Commercialization of Hides and skins by Improving Quality and Collection in the Smallholder Farming System (2004 – 2006): Progress Report for Zambia Submitted at a Regional Meeting Held in Nairobi, Kenya: 29th November, 2005.
3. Establishment of Disease Free Zone in Zambia (2009): Ministry of Livestock and fisheries Development; Government of the Republic of Zambia.
4. Leather Sector Study /Development Plan (1999): Leather Industry association of Zambia (LIAZ) and Export Development Programme, Zambia.
5. Siamudaala V.M, Kunda C and Nambota A.N (2004): The Nile crocodile (Crocodylus Niloticus) Farming in Zambia. Game and Wildlife Science, Vol. 21 (4), 2004, p. 853 – 863.
6. Zambia leather Industry Profile (2009): Zambia Development agency; Ministry of commerce, Trade and Industry. Government of the Republic of Zambia.
7. Zambia Development Agency measures for the Implementation of the COMESA – Leather and Leather Products Institute Memorandum of Understanding for the Development of the Leather Industry in Zambia (2009): Zambia Development Agency, Ministry of Commerce, Trade and Industry; Government of the Republic of Zambia.

Supply and Demand survey on the leather industry – Zambia
Page 42 of 67

Supply and Demand survey on the leather industry – Zambia
Page 43 of 67
Annex II: List of people contacted
Mr. Chris Spyron Mr. Kambani Managing Director Operations Manager Kembe Estates Kembe Estates P.O. Box 32922 P.O. Box 32922 Lusaka, Zambia Lusaka, Zambia [email protected] Mr. G. Devarajan Dr. Paul Fandamu Tannery Manager Principal Epidemo-Survellance Kembe Tannery Ministry of Livestock and Fisheries P.O. Box 32922 P.O. Box 30041 Lusaka, Zambia Lusaka, Zambia [email protected] [email protected] [email protected] Martinez Songuile Malyo Grace T. Jonker Economist ZEDEF Project Coordinator Zambia Development Agency Zambia Development agency P.O. Box 30819 P.O. Box. 30819 Lusaka, Zambia Lusaka, Zambia [email protected] [email protected] Jonathan Simwawa Mr. Anbil Mohamed Manager Export Promotions Manager – Leather Division Zambia Development Agency King Quality Meat Products P.O. Box 30819 P.O. Box 360399 Lusaka, Zambia Lusaka, Zambia [email protected] [email protected] [email protected] Mr. Rechard Franklin Mr. R. Kulkarni General Manager Tannery Production Manager Zamleather/Zamshu Zamleather P.O. Box 36050 P.O. Box 36050 Lusaka, Zambia Lusaka, Zambia [email protected] [email protected] Mr. S.M. Arora Mr. R. Raman Executive Director Commercial Manager TATA Zambia LTD TATA Zambia LTD P.O. Box 30074 P.O.Box 30074 Lusaka, Zambia Lusaka, Zambia [email protected] Dr. Victor M. Siamundala Mr. C.R. Maurya Director Works Manager Zambia Wildlife Authority TATA Tannery Private Bag 1 P.O.Box 80930 Chilanga, Zambia Kabwe, Zambia [email protected] [email protected]

Supply and Demand survey on the leather industry – Zambia
Page 44 of 67
Mr. Antony J. Walakira Mr. Wilson Chizebuka Automated Data Processing Expert Data Programmer-Trade Division COMESA COMESA P.O. Box 30051 P.O. Box 30051 Lusaka, Zambia Lusaka, Zambia [email protected] Mr. Suresh M. Desai Mr. M. Haafwuma Crocodile Farmers Association Zambia Revenue Authority P.O. Box 34837 P.O. Box 35710 Lusaka, Zambia Lusaka, Zambia [email protected] Mr. Geoffrey W.O. Osoro Ms Peggy Kaunda Chituta Senior Trade Policy Expert Inspections Manager COMESA Zambia Bureau of standards P.O. Box 30051 P.O. Box 5025 Lusaka, Zambia Lusaka, Zambia [email protected] Ms Viola Chipere Mr. Maybin Nsupila A/Chief Economist – Industry National Trade expert Ministry of Commerce, Trade and Industry Ministry of Commerce, Trade and Indus P.O Box 31968 P.O Box 31968 Lusaka, Zambia Lusaka, Zambia [email protected] [email protected] Mr. Kambili Chilufwa Mr. Mwiinga Inspectorate Designer Environmental Council of Zambia S.D Investment Limited P.O Box 35135 P.O. Box 30473 Lusaka, Zambia Lusaka, Zambia [email protected] Mr. Darren Walker Mr. P.G.D Hill Croc Hide Yuka Crocodile Farm P.O Box 630214 P.O Box CA 7 Choma, Zambia Lusaka, Zambia [email protected] [email protected] Mrs C. Malijani Mr. Peter Mwanza Quality Control Manager Purchasing Manager Zambeef BATA Shoe Company P.O. Box 36050 P.O Box 30479 Chisamba, Lusaka, Zambia Lusaka, Zambia [email protected]

Supply and Demand survey on the leather industry – Zambia
Page 45 of 67
Annex III: International sanitary certificate
Date:_________________ Republic of Zambia ISC Number:_____________
DEPARTMENT OF VETERINARY AND LIVESTOCK DEVELOPMENT
(a) International sanitary certificate
(For animal, animal products and non-animal products linked to animal health)
This is to certify that the items(s) hereunder listed being consigned by:
__________________________________________________________________________________________________________________
Of_________________________________________________________________________________________________________________
To__________________________________________________________________________________________________________________
Of__________________________________________________________________________________________________________________
____________________________________________________________________________________________________________
Has/have been inspected and found to comply with the sanitary requirement(s) for export of the same to (name of Country):…………………………………………………………………………………………………………….
Name and address of Abattoir: …………………………………………………………………………………………..
………………………………………………………………………………………………………………………………
………………………………………………………………………………………………………………………………

Supply and Demand survey on the leather industry – Zambia
Page 46 of 67
SR. NO ITEM DESCRIPTION QUANTITY SEAL MARK
The packaging and sealing of the above named items has been supervised by the undersigned and the seal mark on the package(s)/container(s) is listed.
Government Veterinary Officer ONLY:
Signature:_____________________________________
Full Name:____________________________________
Rank:________________________________________
G.R. No.:__________________________________________
Distribution of copies:
Original to accompany consignment
Duplicate to Consignee
Triplicate to DVS
Quadruplicate to be returned.
FOR USE BY THE VETERINARY EXPORT CERTIFICATION OFFICE ONLY
Sub-Number:_____________________________ Veterinary Export Certificate Number:_____________________________
Date Issued:______________________________ Signature:_____________________________________
NOT VALID WITHOUT AN OFFICIAL DATE STAMP And valid for 1 month only from date of issue.
OFFICIAL DATE STAMP

Supply and Demand survey on the leather industry – Zambia
Page 47 of 67
Health Certificate for Export of Frozen Crocodile Meat from The Republic of Zambia
to Hong Kong Special Administrative Region (HKSAR)
(a) HEALTH ATTESTATION
I, Dr ………………………………, a Veterinarian authorised by the Veterinary Administration of The Republic of Zambia, hereby certify that the slaughter of the crocodiles and the processing of meat were carried out in a plant under official veterinary inspections and officially approved and registered by The Zambia Government, for export to Hong Kong Special Administrative Region (HKSAR).
Abattoir Number: ZM – NIL / LUN001
a) The meat was derived from crocodiles originated from an area, which was free from notifiable, contagious, infectious and parasitic disease and not under any restrictive measures.
b) The meat was derived from crocodiles which had received ante-mortem and post-mortem inspection and were found free from contagious, infectious and parasitic diseases. The meat was found wholesome and fit for human consumption.
c) The animal / meat has been slaughtered, processed and prepared and dressed hygienically under conditions and control laid down in the Zambian legislation in force.
d) The meat has been frozen to a core temperature of minus 25 degrees Celsius for a period of not less than 10 days.
e) The meat has been subject to testing programmes for harmful organisms, veterinary drug residues and other toxic substances administered by Zambian Health Authority. The results of the tests have not provided any evidence as to the presence of chemical / drug residue or toxic substances, or harmful organisms which could be harmful to the human health.
f) The meat was derived from animals, which did not come from species where trade is prohibited under the Convention on International Trade in Endangered Species of Wild Fauna and Flora.
Consignor…………………………………………………………………………………………………………………………
…………………………………………………………………………………………………………………………………………
Consignee…………………………………………………………………………………………………………………………
…………………………………………………………………………………………………………………………………………
Description of cuts…………………………………………………………………………………………..……………………

Supply and Demand survey on the leather industry – Zambia
Page 48 of 67
………………………………………………………………………………………………………………………………………..
Production dates…………………………………………………………………………………………………………………..
Wrapping / packaging…………………………………………………………………………………………………………..
Number of cartons……………………..Mass: Nett weight………………kgs / Gross weight……………….kgs
Vehicle / Truck number / AWB / BL #…………………………………………………………………………………….
Seal numbers………………………………………………………………………………………………………………………
___________________________ _________________________
OFFICIAL VETERINARIAN Date and official stamp
Exporting Country
Name in print:…………………………………………………………………..

Supply and Demand survey on the leather industry – Zambia
Page 49 of 67
Annex IV: List of inputs for duty/tax exemption
LEATHER PRODUCTION CHEMICALS
Chromosol B Lepton Black
Melio Filler D SAPCO 1525
SAPCO 1860 SAPCOTAN R
Dermafil RE Sodium Bicarbonate
Sodium Formate Black Dye
D Brown Dye Light Brown
Dermasoft Basozym S20
Lipderm Liq SU PU sole attaching glue
Lasting Neoprene glue Unires-RU 3908
RA-10 Aqueous Acrylic Resin Resin RI 6582-Titekote
RC-22-095 Aqueous Compact Resin LD 5915
Leather Dye Red GNB Leather Dye Violet AF
Leather Dye Brilliant Blue AF Sodium Sulphide
Mollescal MF Luganil Brown
Latex clue F1 Filler
F1-1261 Filler PP 14115 Camotex- Black Pigment
PT 6507 Penetrator WT-13-097 Water Top Coat
BM-953 Aqueous Compact Resin Renektan ZYN
Renektan ZYN T-B Lipoderm Liq SU
Densodrin EN Lepton White N
Basozym 1000 Basoym S20
Busan 1346 Latex Glue
Red Brown Dye
SHOE MANUFACTURING COMPONENTS
Rampant Soles Rubber Formular I soles
Captains PVC Soles Aggro PVC Soles
Foot Beds Mukwa Tags
Kwena Cloth Tags PU Soles
Steel Toe Caps Shoe Lasts
M36 Cotton –Brown R12 Punch
R8 Punch R6 Punch

Supply and Demand survey on the leather industry – Zambia
Page 50 of 67
Abrasive Bands Knife Steel Double Edged
18mm Buckles Silver Black Elastic
10mm Ring Eyelet Brass Natural texon
Cutting Boards Counter Boards 1.5*1M
Velcro Hook & Loop Blub
Bufloc Rampant Shoe Lasts
PVC Soles Small sizes Stainless Nuts & Bolts
V Belts Steel Toe Cap Size 7
Steel Toe Cap Size 9 PU Foil
PU Soles Stamping
Eyelets Lace Loops
Needles Rivets & Caps
Steel Insoles Insole Attaching Staples
PVC Compound PVC Master Batch
Toepuff Material Primer
Eva Colours PVC Binding
Foam Lining PVC Lining
PU Upper material/Lining/Foil Unlaminated Fabric
TANNING, LEATHER AND SHOE MACHINERY
Shoe Machinery Shoe Machinery Spares
Sewing Machines Sewing Machines Spares
Tanning machinery and equipment Leather machinery & equipment
Tanning machinery spare parts Leather machinery spare parts

Supply and Demand survey on the leather industry – Zambia
Page 51 of 67
Annex V: Leather industry association of Zambia leather sector value chain outputs, objectives and activities
OUTPUT 1: Quality of Raw Hides and Skins Improved in the Smallholder Farming
System/at Household Level
Objective 1: To Improve the Livestock Extension Delivery System for Hides and Skins
Improvement
Activity 1.1 Production of extension materials on hides and skins improvement (brochures, posters, manuals)
1.2 Training of extension agents (public and private) in the Assured Value Chain (branding techniques; Ticks and Tick Borne/Skin Diseases control; slaughter , flaying and preservation techniques)
1.3 Training of Community Livestock Extension Auxiliaries in Assured Value Chain (Hides and skins improvement through best animal husbandry practices)
1.4 Exhibition and demonstration of best practices in hides and skins improvements ( Local Agricultural Shows)
Objective 2: To sensitize stakeholders on the value and importance of hides and skins
in the Economic Development and Poverty Reduction
Activity 2.1 Sensitize farmers on the value and importance of hides and skins for income generation through community radio stations/ media
2.2 Sensitize stakeholders (traders, abattoir associations, farmers associations) on the value addition and importance of hides and skins through workshops
2.3 Stakeholders annual forum
Objective 3 To enhance the production of quality raw hides and skins through best
practices in the abattoirs
Activity 3.1 Procurement of flaying tools (Knives) , Lifting devices and preservative (salt)
3.2 Training of flayers in abattoirs and slaughter slabs on slaughter, flaying and preservation techniques of hides and skins
3.3 Training of Livestock cooperatives/farmers’ Groups in hides and skins improvement in the value chain

Supply and Demand survey on the leather industry – Zambia
Page 52 of 67
3.4 Encourage and facilitate the establishment of medium/small abattoirs in the smallholder farming system (a shift from slaughter slabs)
3.5 Inventory and registration of slaughter facilities in the country
3.4 Provide incentives for production of quality raw hides and skins
OUTPUT 2: Collection levels of raw hides and skins improved and enhanced installed
tannery and manufacturing capacity Utilization
Objective 1: To Improve the Collection Levels of Hides and Skins in the Supply Chain
Activity 1.1 To facility market linkages between abattoir Association/Slaughter slabs/traders and tanneries through meetings/workshops/exhibitions
1.2 To improve collection and preservation facilities in the supply chain
1.3 To monitor export restriction of raw hides and skins at border posts in the country in conjunction with Zambia Revenue Authority
OUTPUT 3: Value addition , quality leather and leather products production promoted
and enhanced for export
Objective 1: To promote further value addition from wet blue to crust and beyond through
improved technology and skills
Activity 1.1 Recapitalization of tanneries and manufacturing with modern technologies and equipment through joint venture and financing
1.2 Training of supervisors/managers in tanning, manufacturing and quality control at regional level
1.3 Formation of Small and Medium Enterprises Clusters in the country
1.4 Skills training of SMEs in quality production of leather products including quality control
OUTPUT 4: Market access by abattoirs, slaughter slabs and traders enhanced and sustained in the supply chain Market access, competitiveness and visibility of Zambian leather and leather products at Regional and International markets Improved.
Objective 1 : To facilitate and improve domestic market access through sustainable market
practices

Supply and Demand survey on the leather industry – Zambia
Page 53 of 67
Activity 1.1 To facilitate market linkages between abattoir Association, Slaughter slabs, traders and tanneries through meetings, workshops, business forum and exhibitions
1.2 To facilitate improvement /rehabilitation of collection and preservation facilities in the supply chain
1.3 To facilitate the development of grading guide lines and standards for raw hides / skins and pricing for farmers, traders and abattoirs
1.4 Dissemination of market information to stakeholders through media , meetings workshops etc.
Objective 2: To improve the perception and market access of Zambian Leather and Leather
Products at regional and international Markets
2.1 To increase market linkages /awareness of finished leather and leather products to regional/international markets through Trade Fairs and exhibitions
2.2 To monitor domestic, regional and international market trends and disseminate market information to stakeholders
2.3 Encourage and facilitate the implementation of quality control in tanneries and manufacturing of leather products
OUTPUT 5: Sustainable Leather Sector Policy Developed and Harmonized with
Regional/International
Objective 1: To enhance the competitiveness of the leather sector at Regional and International
Markets
Activity 1.1 Develop a sustainable Leather Sector Policy and Action Plan
1.2 Review the HS Codes and reclassification for leather and leather products for export
1.3 Review certification of exports of leather and leather products
1.4 Provide/lobby for tax incentives on imported tanning and manufacturing inputs
OUTPUT 6: Institutional and Regulatory Framework for the Leather Sector strengthened and
operational in the Value Chain

Supply and Demand survey on the leather industry – Zambia
Page 54 of 67
Objective 1: To Strengthen the Institutional Capacity of the Leather sector
Activity 1.1 Institutionalize the Leather Industry Association of Zambia (LIAZ)
1.2 Technical and financial support to the Leather Sector
1.3 Monitoring and supervision of the Leather Sector/Auditing
1.4 Facilitate trade promotions for the Leather Sector

Supply and Demand survey on the leather industry – Zambia
Page 55 of 67
Annex VI: Background information and objectives of supply/demand survey
The Programme for Building African Capacity for Trade (PACT II) is a Canadian International Development Agency (CIDA) funded Pan–African programme encompassing three Regional Economic Communities (RECs) namely COMESA, ECCAS and ECOWAS, implemented by the International Trade Centre (ITC) in partnership with the respective RECs as well as other stakeholders at the regional, sub-regional and national levels. The programme focuses on five key outcomes, namely: • Policy dialogue among the RECs • Regional trade development • Trade support networks and business institutions • Sector specific business skills and market linkages • Women entrepreneurships The Eastern and Southern Africa Leather Industries Association (ESALIA) Secretariat is one of the partners and beneficiary Trade Support Institutions in the PACT II programme. The PACT II Programme is being implemented in three components namely: Intra-regional Trade Component, International Trade Component and Ethical Fashion Component. One of the activities to be under taken under the Intra – regional Trade Component is to conduct Supply / Demand Surveys. ESALIA has the overall coordinating responsibility for the Supply / Demand Surveys and will be collaborating with COMESA/LLPI. Zambia is among the five countries which were selected to participate in the Supply/Demand Surveys.
1 Objectives of the Demand/Supply Survey
Among other things, the Supply/Demand survey covered many aspects including (a) Hides and Skins (from raw to semifinished, eg. dried, salted, frozen hides and skins, or processed as Wetblue, pickled or crust) (b) Finished leather (according to its final use: eg: footwear, garments, leather goods, automotive, upholstery) (c) Finished Leather Products (footwear, garments/gloves, leather goods) (d) chemicals (e) machinery (f) machinery and (g) services. The objectives of the Supply/Demand Survey are as follows;
To describe the characteristics of the sector in Zambia
To identify the key enterprises producing, exporting and importing the products under consideration.
To assess the potential for increasing the demand (dynamic demand) and to changing for new sources of supply
To assess barriers affecting imports
To determine in which areas assistance to importers may be requested: import licensing, custom duties such as import tariffs, quality control, sanitary and phytosanitary requirements
To identify the key importing companies
Supply and Demand survey on the leather industry – Zambia
Page 56 of 67

Supply and Demand survey on the leather industry – Zambia
Page 57 of 67
Annex VII: Methodology of the supply/demand survey
1 Primary data/information
The primary information in the Demand/supply Surveys was obtained through visits to the tanneries, crocodile farms and manufacturers of footwear and leather goods. Discussions were held with tanners and footwear/leather goods manufacturers on the production economics and trade of leather, footwear and leather products. Policy issues and challenges were also discussed. Policy makers in the Ministry of Commerce and Trade and Ministry of Livestock and Fisheries were interviewed on the export/import policies. Where respondents could not be reached in person, cell phone/telephones and emails were used to obtain information and data. Visits to the tanneries and footwear and leather goods factories were conducted in order to appreciate and ascertain the installed capacity utilization of these factories. The Company Profile Forms and Demand/Supply Forms (questionnaires) were distributed to tanners, crocodile farmers, and footwear and leather goods manufacturers during the visits in order to collect information on their production levels; export potential; and production inputs requirements. Follow-up visits were made to seek clarification and collection of questionnaires. Visits were also made to slaughter facilities, particularly abattoirs, in order to access their capacities to produce raw hides and skins in terms of quantity and quality. Discussions were held with abattoir operators/managers/supervisors either in person or by telephone. Factors affecting the smooth supply of raw hides and skins to the tanneries were discussed. Policy makers and livestock extension agents in the Ministry of Livestock and Fisheries were also interviewed with regards to effective livestock extension delivery system with a bias to the production of quality hides and skins, marketing and trade.
2 Secondary data/information
Visits were made to the Environmental Council of Zambia (ECZ) and Zambia Bureau of Standards (ZBS) and much of the discussions were centred on environmental requirements and standards for the leather industry, paying particular attention to leather/footwear/leather goods standards, waste management/effluent disposal and investment. Visits were made to the National Information Livestock and Epidemiology Centre (NAILEC) in the Ministry of Livestock and Fisheries and Zambia Wildlife Authority (ZAWA) for the purpose of obtaining Phyto-sanitary and certification requirements of imports and exports of hides, skins, finished leather and other leather products. The Common Market for Eastern and Southern Africa (COMESA) and Zambia Revenue Authority (ZRA) provided raw data on imports and exports, in terms of both quantities and values for the period of five years, from 2005 to 2009. This period was considered in order to provide sufficient data and trends of imports and exports. HS Codes were used to segregate leather products as follows: Annual reports, previous study reports on the leather industry, policy and regulatory documents were reviewed.

Supply and Demand survey on the leather industry – Zambia
Page 58 of 67
Figure 30: Geographical location of crocodile farms
Figure 31: Geographical location of tanneries in Zambia

Supply and Demand survey on the leather industry – Zambia
Page 59 of 67
Figure 32: Geographical location of leather products manufacturers

Supply and Demand survey on the leather industry – Zambia
Page 60 of 67
Figure 33: Disease Free Zones in Zambia

Supply and Demand survey on the leather industry – Zambia
Page 61 of 67
Figure 34: Geographical location of multi facility economic zones in Zambia
Multi - Fa ci l it y E con om ic Zo ne
Other Are as
Legend
N
REPUBLIC OF ZAMBIA
Kal ul us hi
Lusa ka