Supply Chain Strategy Assessment
40
1 Jay Martin May 2012 Supply Chain Assessment.ppt Global Consumer Products and Health & Beauty Company Supply Chain Assessment & Strategy Consumer Products Company
-
Upload
chief-innovation -
Category
Business
-
view
303 -
download
0
Transcript of Supply Chain Strategy Assessment
1Jay Martin May 2012 Supply Chain Assessment.ppt
Global Consumer Products and Health & Beauty Company
Supply Chain Assessment & Strategy Consumer Products Company

2Jay Martin May 2012 Supply Chain Assessment.ppt
The client’s new COO was faced with understanding their business and where and how their Supply Chain could improve profitability.
• Client had a new senior executive over Supply Chain with a more diverse operational background outside of the function.
• The company had outsourced almost all of their Supply Chain functions, and had very recently spun out its warehousing operations in its largest market to a 3PL.
• Recent issues regarding legacy sourcing decisions made close to a decade ago clouded an understanding of real operational performance.
• Operations metrics were provided and monitored by the Finance organization, whose accounting methods focused more on risk rather than actual losses.
• A Board Member, with many years at a competitor, was pushing for a performance improvement / metric focus that was of questionable relevance to this client’s business given almost the entire Supply Chain had been outsourced.
• Staffing had been greatly reduced throughout the organization given a recent economic downturn in Europe and the United States a few years earlier.
Supply Chain Assessment & Strategy Situation

3Jay Martin May 2012 Supply Chain Assessment.ppt
The client asked Chief Innovation to complete a Supply Chain Assessment that would answer a variety of questions.
Supply Chain Assessment & Strategy Assignment
• How is our Supply Chain performing? How is it impacting profitability?
• With so much of the operations outsourced, what can and should we be doing to optimize our contractual relationships and manage our partners?
• Are we over-staffed or under-staffed? Evaluate the different functional teams.
• What areas could additional staff investment be justified against profitability?
• What metrics should we continue to use and what new ones might we consider?
• How can we better sunset low volume/profit impacting SKUs?
• What areas should we make changes in and what should we be doing differently?
The following document is a mix of what are the options for a project like this, how to do one and the structure we completed for this client.

4Jay Martin May 2012 Supply Chain Assessment.ppt
What ‘is our Supply Chain Strategy’ is two different things, though semantics and mixed usage creates obvious confusion.
• 1) The Strategy for our Supply Chain –The overall guiding principles for the company with respect to its operations and their support of the business.
• 2) Supply Chain’s Strategy –The ‘Plan’ to execute the above, with specific goals and objectives and those actions required to make them a reality.
The first is more of a ‘vision’ or a choice made by the company with respect to how they will view the execution of their operational areas, and where and how they will make the trade-offs. The second is a detailed planning document, by sub-functional area, showing metrics, targets, actions, accountability and anticipated results.
The key word is ‘trade-offs’. Given our existing and future business, what priorities do we have for the different performance attributes.
Supply Chain Assessment & Strategy Definition

5Jay Martin May 2012 Supply Chain Assessment.ppt
One way to think of this is using the balance of Operational Effectiveness and Responsiveness, and below are six examples.
Source: Supply Chain Quarterly, though believe original concept was from A.T. Kearney
Operational Effectiveness
Continuous Flow Efficient Fast
• Primary focus is for low working capital
delivered to customers.
• Primarily ‘make-to-stock’
• Market demand drives production to
replenish to predefined inventory levels
• Lowest cost mode
• Able to support multiple strategies
• For commoditized products
• Make to forecast
• Continuous production or ordering
• Competitive cost and continuous
portfolio renewal
• Short time-to-market and low costs are
two primary deliverables
• Demand is a ‘push’ by forecast
• Primary strategy for fashion and
beauty products
Responsiveness
Custom Configured Agile Flexible
• Focus is on the end-user
• Products designed to have common
components and customized later
• Smooth forecasting at front end
• Fulfillment/meeting customer needs is
critical
• Respond to unpredictable demand
• Exclusive, short-lifecycle products
• Asset utilization not highly relevant
towards total costs
• Common components/materials
• This strategy used to support
companies with Industrial customers
• Solving customer problems is major
thrust of this strategy
• Usually used for products which have
a high level of service involved
• Flexible processes
• Price insensitive customers
The examples fit the needs of many companies, but not everyone.
Supply Chain Assessment & Strategy Examples

6Jay Martin May 2012 Supply Chain Assessment.ppt
For many companies, these strategies do not fit ‘off-the-shelf’. Their real best choice comes in prioritizing and asking tough questions.
Sub-Function Question
R&D Do I need to do real research or focus on incremental product changes?
Product Development How broad a product range do I need? How often do I need new products?
Product Development Do I need to have unique products? Can I/should I ‘copy-cat’?
Inbound Can I use full truck load ground to get my orders or expedite shipments?
Warehousing /
InventoryShould I have dedicated warehouses or let a 3PL handle it?
Warehousing /
InventoryAt what cost is perfect fulfillment worth it to me? What is acceptable?
Warehousing /
InventoryWhat ‘tail’ products will we keep, for how long, and at for what order levels?
Outbound/Delivery What minimums order quantities will I allow? How do I do bracket pricing?
These are just example questions showing the balance in priorities.
Supply Chain Assessment & Strategy Difficult Questions

7Jay Martin May 2012 Supply Chain Assessment.ppt
This was a quick assignment, and these types of projects are all different, but the overall work flowed similar to the four steps below.
Gather Data AnalysisInterview
ProgramFinal Report
1 2 3 4
• Confirm objectives
• Provide request for information needed
• Review past projects
• Create and agree on detailed work plan
• Start building cost model from 10-K (income)
• Identify competitors
• Select key suppliers
• Review documents supplied by client
• Review metrics and past performance, confirm
• Research competitors
• Identify interview targets
• Map/analyze processes
• Build interview guide
• Continue on cost model
• Analyze inventory
• Analyze product losses
• Analyze transportation and 3PL contract/results
• Conduct interview program
• Structure analysis
• Confirm feedback
• Compare to data and documents provided
• Develop issues lists
• Follow-up To Do lists
• Create new process strawmen
• Finish competitor profiles
• Discuss metrics and dashboard drafts
• Develop Final Report Structure
• Review with client
• Populate analysis section
• Review master list of issues to build recommendations
• Consolidate and match recommendations into implementation plan
• Review with COO
• Present / deliver to Senior Executive Team
Deliverables
• Supply Chain Assessment Report
• Supply Chain Strategy & Recommendations
• Metrics / Dashboard Structure
Supply Chain Assessment & Strategy Approach

8Jay Martin May 2012 Supply Chain Assessment.ppt
At the start of assignments like these, it advantageous to create a Master file to compile and track key project/client information.
Excel Master FileSection / Worksheet Contents / Purpose
RolodexMaintain and takes notes on who you meet or
the key people inside the client, as well as
people you’d like to meet / interview.
Issues / Notes
This is the heart of the project. Keep a giant
long running list with everything you learn from
meetings, interviews, the annual report, old
projects and documents. We use 5 columns:
Source (document/venue), Person (if
applicable), Top Level Subject, Type (issue, to
do item, fact) and Content (what is issue, fact)
Files Received / StatusRunning list of all documents received, file
names, format (xls, doc, ppt, pdf), dates (if
they have them) and who provided them
Cost Model / Income
Statement
Build a cost model for Supply Chain using
either recent year end Income Statement or
recent quarter. Ask client for preference.
Products and DivisionsCompile a list of each division and respective
products (with brands and names) to fully
understand the scope of their operations.
Sites & Countries List of all countries and facilities for client.
Supply Chain Assessment & Strategy Master File for Project

9Jay Martin May 2012 Supply Chain Assessment.ppt
After more than 20 interviews and review of dozens of files, we had almost 500 lines of issues and observations to make conclusions.
• Staff including the CEO, Marketing, R&D, Finance, Accounting, IT, the 3PL and all of the Supply Chain function were interviewed.
• Close to 100 documents were received and reviewed.
• The Forecasting and Inventory sections contained implementation details that the client asked for given she was knew.
• The recommendations build on the existing strategy, while emphasizing the need to perfect the Demand Planning/Forecasting expertise.
• A total of 59 recommendations across all areas were detailed on the following pages. Further explanations were shown in more detail.
• The project was quick, and only lasted about 5 weeks. The final report was around 110 pages, of which the structure of some is shown here.
This document contains structural ideas to help others complete projects similar to this. All client data has been removed/substituted.
Supply Chain Assessment & Strategy Project Scope

10Jay Martin May 2012 Supply Chain Assessment.ppt
The Supply Chain Assessment & Strategy document was broken out into the 5 sections below, and this document combines 1 into 5.
1 Summary & Recommendations
2 Sourcing & Demand Planning
3 Transportation & Inventory
4 Metrics & Competitive Assessment
5 Next Steps / Implementation
Supply Chain Assessment & Strategy Document Structure
11Jay Martin May 2012 Supply Chain Assessment.ppt
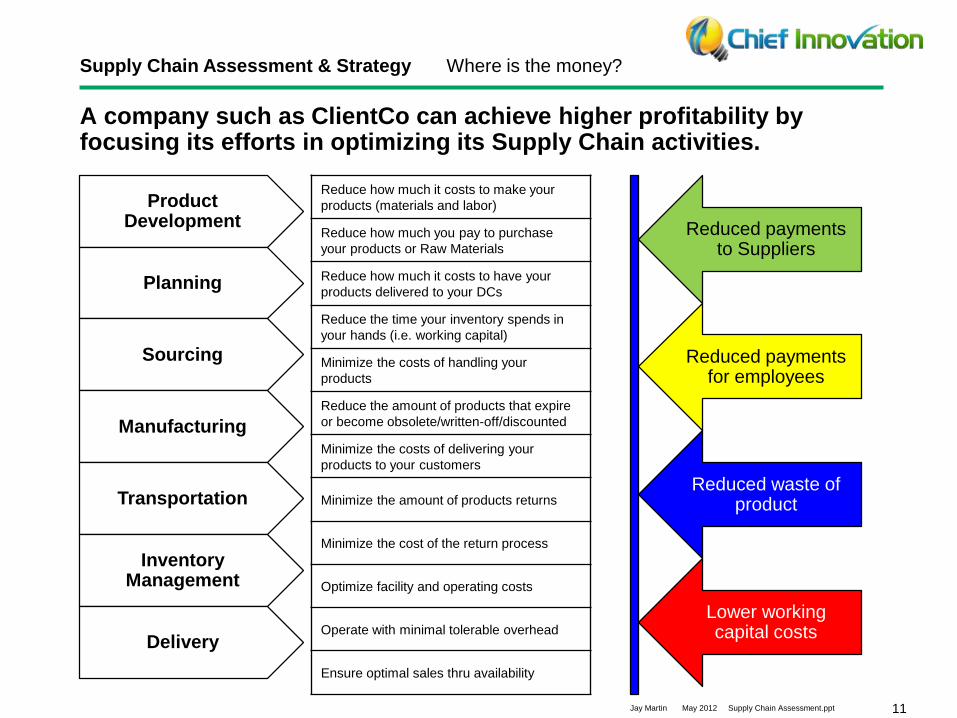
A company such as ClientCo can achieve higher profitability by focusing its efforts in optimizing its Supply Chain activities.
Reduce how much it costs to make your
products (materials and labor)
Reduce how much you pay to purchase
your products or Raw Materials
Reduce how much it costs to have your
products delivered to your DCs
Reduce the time your inventory spends in
your hands (i.e. working capital)
Minimize the costs of handling your
products
Reduce the amount of products that expire
or become obsolete/written-off/discounted
Minimize the costs of delivering your
products to your customers
Minimize the amount of products returns
Minimize the cost of the return process
Optimize facility and operating costs
Operate with minimal tolerable overhead
Ensure optimal sales thru availability
Product Development
Planning
Sourcing
Manufacturing
Transportation
Inventory Management
Delivery
Reduced payments to Suppliers
Reduced waste of product
Reduced payments for employees
Lower working capital costs
Supply Chain Assessment & Strategy Where is the money?
12Jay Martin May 2012 Supply Chain Assessment.ppt
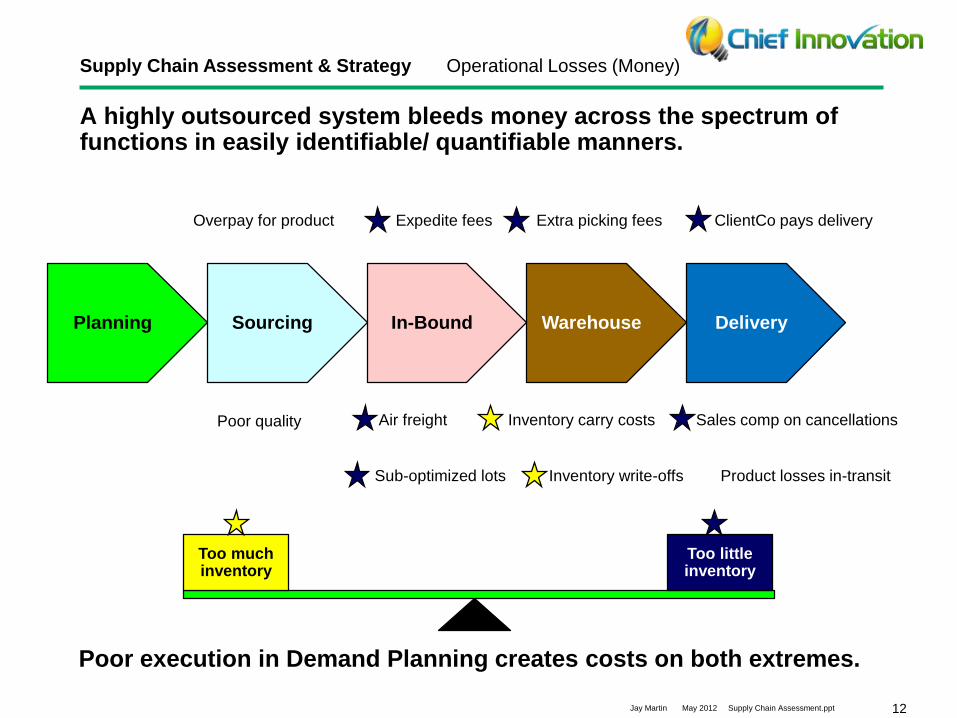
A highly outsourced system bleeds money across the spectrum of functions in easily identifiable/ quantifiable manners.
Planning Sourcing In-Bound Warehouse Delivery
Overpay for product ClientCo pays delivery
Sales comp on cancellations
Product losses in-transit
Extra picking fees
Inventory carry costs
Inventory write-offs
Air freight
Expedite fees
Poor quality
Sub-optimized lots
Too much inventory
Too little inventory
Poor execution in Demand Planning creates costs on both extremes.
Supply Chain Assessment & Strategy Operational Losses (Money)

13Jay Martin May 2012 Supply Chain Assessment.ppt
Using publicly available sources, the client can be compared to its major competitors using annual reports and 10-Ks.
The data above (and some row names) are all illustrative, and though each competitor has a unique business model, it can be very valuable.
Supply Chain Assessment & Strategy Competitors – Top Level
ClientCo

14Jay Martin May 2012 Supply Chain Assessment.ppt
As part of the project, CI completed Supply Chain focused profiles of the client’s top competitors in the United States.
Headquarters
London, UK
Founded
1960
Revenue / Income
14,875 MM USD
2,528 MM
Employees
23,400
Ownership / Leadership
• Public: NYSE: ZXY
• CEO – Michael Freedman
• President – Diana Jax
• COO – Richard Guha
• CFO – John Simpson
• July 2014 – The EU begins looking at trade issues
• Hedge funds are shorting the stock in the U.S. and Europe
• Continued accusations relating to rashes caused by diapers in Hungary
• Warren Buffet reduced his position by over $300 million
Marketing (Customers/Products)
• Sold in 12,300 retail stores
• Partnered with other British companies and key charities
• Heavy into sports partnerships
• Juice and Soda (43.6%),
• Sanitary (36.1 %)
• Haircare (5.3%)
• Skincare (6.8%)
• Products sold and distributed in 65 countries. Revenue breakdown:
• Europe 35%
• N.A. & Mexico 25%
• Latam 20%
• APAC & China 15%
• Africa 5%
• Largest plants in Paris, France, Elgin, IL and Shanghai, China
• New plant recently opened in Argentina (500k sqf)
• 760 Distribution ‘points’
• Most French sold products are contract manufactured
• 40% of products purchased from the largest 5 manufacturers
• Heavily expanding self-manufacturing
• 60-65% of products will be self-produced once AL plant ramps up
• Bought DebCo (Chula Vista, CA) in 2006
Supply Chain Information
Additional Information
International
Product Segments
Note: Used most recent and best sources from the internet. Timing may vary.
Supply Chain Assessment & Strategy Competitor Profile
15Jay Martin May 2012 Supply Chain Assessment.ppt
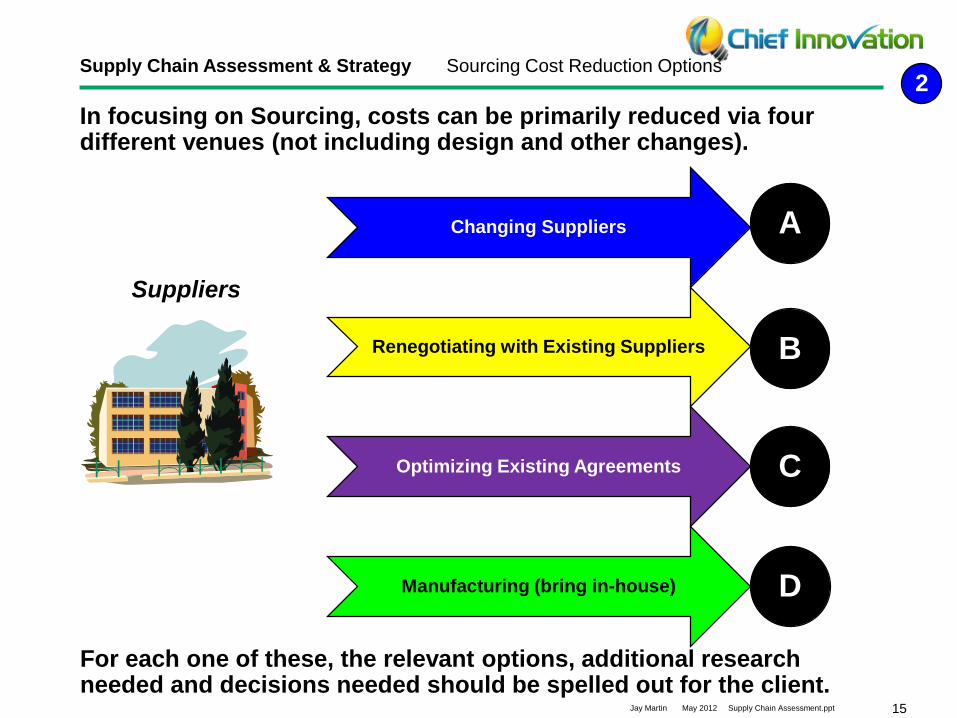
In focusing on Sourcing, costs can be primarily reduced via four different venues (not including design and other changes).
Changing Suppliers
Renegotiating with Existing Suppliers
Optimizing Existing Agreements
Manufacturing (bring in-house)
Suppliers
A
B
C
D
For each one of these, the relevant options, additional research needed and decisions needed should be spelled out for the client.
2Supply Chain Assessment & Strategy Sourcing Cost Reduction Options

16Jay Martin May 2012 Supply Chain Assessment.ppt
A top level analysis of their suppliers and the spend helps understand the focus and needs to consolidate or which ones to focus on.
# Supplier HQ / Plants Key Products 2013 ($000) % Prod Spend
1 Supplier A Paris, France
• TastyTreats
• Chewy Packs for Kids
• Chewy Bars
58.027 29.0
2 Supplier B Leven, Belgium • ClientCo Cola 42,673 21.8
3 Supplier C Essex, UK
• PrettySkin
• YouAintaHag
• Skin Droppers
40,592 20.2
4 Supplier D Atlanta, Georgia• Yumsters
• Besties Candies28,919 14.9
5 Supplier E Shenzhen, China• Headachers
• MightzFines25,430 12.8
6 Supplier F Toronto, Canada • New Hair Wigs 17,632 8.4
The analysis at this client showed a great deal of concentration with a few key suppliers across all their divisions. (all data is illustrative)
2Supply Chain Assessment & Strategy Top Suppliers

17Jay Martin May 2012 Supply Chain Assessment.ppt
The client was reviewing whether to begin manufacturing in some of their divisions where all was currently contracted out to others.
Manufacturing D
Should we manufacture for
ourselves?
Do we have the skills or can they be
easily acquired?
What would our raw material costs be?
What are our risks in the event of a
downward demand spike?
How easily could our IT and Financial
systems support it?
What equipment / facilities would be
required?
Do we have any risks that our
Suppliers would not?
Could we manufacture for
others?
Regardless of a decision to do so, much of the analytical work and research could be used to become a ‘smarter’ purchaser.
• Factory space
• RM/WIP/FG holding
• Climate control, etc.
• Processing equipment
• Packaging (if internal)
Is there market demand for these
services?
Would the market (e.g. competitors) source from us?
2Supply Chain Assessment & Strategy Sourcing – Manufacturing Logic

18Jay Martin May 2012 Supply Chain Assessment.ppt
Demand Planning – or Forecasting – is an area that is very critical for any Consumer Products company, especially those who outsource.
• Past customer demand
• Price
• Promotions
• Events
• Inclusion in multi-packs
• Related product impact
• Competitive products
• Retailer count/growth
• New product introductions
• Seasonality (minimal)
• Recent press
• Public perception
• Regulation changes
• Prior unmet demand
• Product sunset plans
• Other factors….
• Sales
• Profit
• Customer satisfaction
• Financial forecasting
• Shipping costs
• Inventory levels
• Optimal working capital
• Expiration risks
• Optimal purchasing
• Lot size benefits
• Transportation planning
• Back-order coordination
• Internal coordination
• Effective planning
Examples of Considerations Why it is important? (Impacts)
The financial impacts of doing this ‘right’ (or not) can be enormous.
2Supply Chain Assessment & Strategy Forecasting

19Jay Martin May 2012 Supply Chain Assessment.ppt
Our project showed the need to rebuild the area and laid out some of the things that needed to be addressed with the team assigned to it.
Item # Item Assignment, Work or Decision Needed
1 Owner & RolesOwner of Forecasting is Dre Bruni. Team and J-C need to clarify
overall roles of Marketing, Supply Chain and others (e.g. International)
2 ProcessFrancois will develop a new process with Jay’s help. Process will not
change as much as the activities inside of existing steps/meetings
3 MetricsMAPE will be a key metric for overall forecasting performance, though
other supporting ones may be used to assess forecasting’s impacts
4 TargetsCalculations on available data showed real forecast error was 9%, but
that was end of 2012. Will need to assess current actuals first.
5 Dashboard / ReportingAn overall Supply Chain Dashboard is being developed, and will
incorporate metrics from this process. Jean-Claude will decide.
6 MeetingsA bi-weekly (or possibly) weekly meeting with Marketing and Supply
Chain will be the core of the interaction. Moscow input is critical.
7 DecisionsOwnership of ‘orders’ and ‘inventory’ needs to be established. We
propose putting all responsibility and performance with one function.
8 Documentation/FormsA variety of input and output forms need to be developed to facilitate
input, provide a paper trail and help understand when we are ‘off’
9International
Coordination
Input from other markets is key and critical, and expectation is that
Marketing or International will play this role and obtain input/feedback.
10 TrainingProcess documentation should be easy to understand and not require
‘manuals’, but on-boarding/confirmation of understanding is key.
2Supply Chain Assessment & Strategy Forecasting Components

20Jay Martin May 2012 Supply Chain Assessment.ppt
For ClientCo, Forecasting will have positive impacts on performance across the company, and will improve profitability.
Fewer missed orders
Increased Product Sales
Increased
Profitability
More reorders (due to confidence in
delivery)
Higher sales rep satisfaction (e.g. higher
attrition and engagement)
Reduced expedited and air freight costs:
Supplier to DC
Reduced Transportation ExpensesReduced expedited delivery costs: DC to
Customer
Reduced shipping charges to customers
paid for by ClientCo due to missed
shipment or partial shipments
Reduced product loss from lower
obsolete product lotsReduction of product waste
Reduce product costs from optimal lot
sizes and orderingReduced spend on product
Reduced office labor for back order
processing and coordinationReduction in non-value added labor
Optimal inventory balance (to sales)* Reduced working capital costs
* Overall inventory level could rise to support higher fulfillment rate, but premise is that unneeded inventory in those SKUs that had it will be reduced/minimized.
2Supply Chain Assessment & Strategy Demand Planning & Profitability
21Jay Martin May 2012 Supply Chain Assessment.ppt
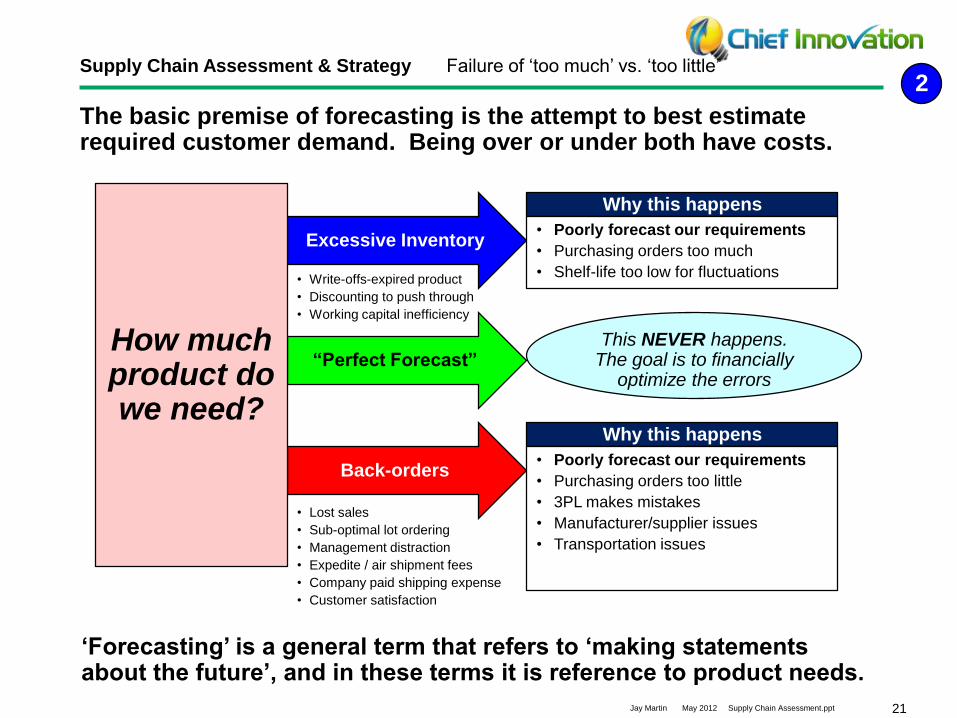
Excessive Inventory
Back-orders
Why this happens
• Poorly forecast our requirements
• Purchasing orders too little
• 3PL makes mistakes
• Manufacturer/supplier issues
• Transportation issues
Why this happens
• Poorly forecast our requirements
• Purchasing orders too much
• Shelf-life too low for fluctuations
“Perfect Forecast”How much product do we need?
This NEVER happens. The goal is to financially
optimize the errors
• Lost sales
• Sub-optimal lot ordering
• Management distraction
• Expedite / air shipment fees
• Company paid shipping expense
• Customer satisfaction
• Write-offs-expired product
• Discounting to push through
• Working capital inefficiency
The basic premise of forecasting is the attempt to best estimate required customer demand. Being over or under both have costs.
‘Forecasting’ is a general term that refers to ‘making statements about the future’, and in these terms it is reference to product needs.
2Supply Chain Assessment & Strategy Failure of ‘too much’ vs. ‘too little’

22Jay Martin May 2012 Supply Chain Assessment.ppt
Excessive Inventory Back-orders
For a successful Supply Chain, the balance on both sides of the inventory equation are needed to be understood.
Cost of Excess Inventory Estimate
Risk of product being written-off 1% per year
Working capital cost of inventory 8% per year
Increased chance of discounting n/a
Total Cost of Excess Inventory 1% per month
Cost of Insufficient Inventory Estimate
Lost profit from missed sale +70%
Wholesaler fine for late delivery $12 per case
Air shipping & expedite fees n/a
Sub-optimal lot ordering n/a
Staff labor to process back-order n/a
Customer dissatisfaction n/a
3PL additional pick/packing fees n/a
Total Cost of Back-order TBD
These percentages show back-orders are a far greater cost than excess inventory. This is ‘until’ inventory levels are so great that obsoletes become inevitable, then 1% a month becomes ‘100%’, direct to the dumpster. Note: All % are in terms of COGS of the item.
2Supply Chain Assessment & Strategy Cost Balancing

23Jay Martin May 2012 Supply Chain Assessment.ppt
For an outsourced manufacturing operation, the planning and reorder points are critical and must be monitored and lead-times understood.
Re-order
Point
Order
Quantity
Order Lead-time
Safety stock
Analyzed demand
Time
Re-order
Point
Order
Quantity
Safety stock
Promotion Planned
Time
Red in the first chart shows analysis of the demand stronger than anticipated. A review of the expected re-order point
is made (moved up) and vigilant monitoring would be prudent. Impact to safety stock requirements may be justified.
Green shows demand to have been lower than the original forecast. This would result in a delay of the re-order date.
In all cases of demand changes, coordination and warning needs to provided to the Supplier for their preparation.
The Blue shows that demand followed the original forecast (unlikely by the way), but that an impact (e.g. promotion) is
planned by marketing or the field, and the demand slope is expected to change drastically.
2Supply Chain Assessment & Strategy Demand Variability

24Jay Martin May 2012 Supply Chain Assessment.ppt
Our assessment addressed all three areas of inventory needing to be managed, and below is a top level view with the recommendations.
Raw Materials (RM)
Promotional & Marketing Materials
Finished Goods (FG)
Write-offs
Write-offs
Transportation Costs
Write-offs
Carry Cost Excess
SKU proliferation
Continue current inventorylevel reduction process
launched in Belgium in 2009 already in progress
Marketing team ownership
Local foreign sourcing
Forecasting resources
New demand planning tools
Write-off investigations
New Sunset process
New cost metric/dashboard
Stock-out investigations
Issues Proposed Action AreasTypes of Inventory
3Supply Chain Assessment & Strategy Inventory Summary

25Jay Martin May 2012 Supply Chain Assessment.ppt
For this client, a detailed analysis of inventory and losses was critical to better understand its significant impact on recent profitability.
• FG Inventory write-offs for 2013 were $ 2.1 MM versus 6.8 MM in 2012.
• The pain of past years raw material sourcing is still being both cleaned up and felt, with over $ 7.3 million still on the books at year-end 2013.
• Materials and promotional product obsolescence accounted for $1.6 MM, but this is not a Supply Chain issue.
• Some major events and anomalies resulting in inventory losses include:
– Container ship hijacked off Indonesian coast
– Russian inventory write-offs due to political difficulty
– Cannibalization between Jay Cola and NewCola
• The ‘Inventory Reserve’ is not a focus at this time, because though it is an important measure in performance, it is not the ‘real money’ we are looking to capture with respect to benefit realization of improvements.
3Supply Chain Assessment & Strategy Inventory – Write-offs

26Jay Martin May 2012 Supply Chain Assessment.ppt
Detailed analysis on causes, products and locations should be completed, with corrective action plans developed for future mitigation.
$2,138 K
$1,577 k
$196 k
$371 k
Damages
TBD
Expired FG
Top W/O ($000) % of total
5 645.5 29.5%
10 957.7 43.6%
20 1,218.8 60.5%
A few percent of this client’s SKUs represented over 60% of their losses, with most concentrated in a few product lines and markets.
3Supply Chain Assessment & Strategy Inventory – Write-off Causation
Top 5 etc. SKUs in terms of losses

27Jay Martin May 2012 Supply Chain Assessment.ppt
Our team analyzed the top SKUs (losses) to better understand what events, accidents or poor forecasting resulted in their write-offs.
The client COO launched an initiative across the world to investigate this and take action to mitigate these issues in the future.
3Supply Chain Assessment & Strategy Inventory – Investigate Highest Losses

28Jay Martin May 2012 Supply Chain Assessment.ppt
A historic oversupply of certain raw materials was being corrected, and much of these legacy issues were drawing to a close.
Raw MaterialUsed In
(Products)
Balance
($ thousands)Notes
1 Food Base - GumGumsters
Chewy Bots 3,840
Products being phased out, doing a
promotional to move the rest in Eastern
Europe
2 Soda Syrup - GrapeNo longer used
(was Grape Soda) 2,194
Replacing grape flavor with a new
supplier, working to repurpose stock.
3 Skin Base Jay Skin 2,322
Currently at risk on expiry date for the
Italian stored items. Looking to move
back into France
4 Raw HairExtensions
Wigs 1,114
Prior hair quality issues from India,
looking to sell wholesale into a market
where our products are not present.
Brokers are being evaluated.
5 Hair Base Hair Jay 1,065
Moving up end product production given
expiration date of raw materials is
approaching soon. Minimal impact.
Total 10,631
3Supply Chain Assessment & Strategy Inventory – Raw Materials
29Jay Martin May 2012 Supply Chain Assessment.ppt
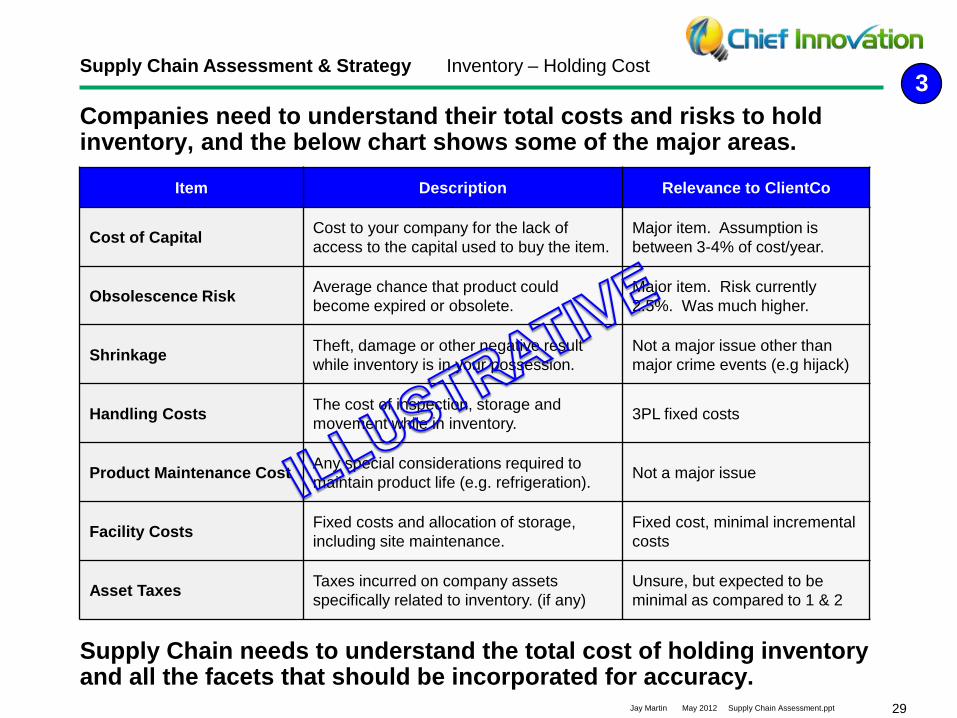
Companies need to understand their total costs and risks to hold inventory, and the below chart shows some of the major areas.
Item Description Relevance to ClientCo
Cost of CapitalCost to your company for the lack of
access to the capital used to buy the item.
Major item. Assumption is
between 3-4% of cost/year.
Obsolescence RiskAverage chance that product could
become expired or obsolete.
Major item. Risk currently
2.5%. Was much higher.
ShrinkageTheft, damage or other negative result
while inventory is in your possession.
Not a major issue other than
major crime events (e.g hijack)
Handling CostsThe cost of inspection, storage and
movement while in inventory.3PL fixed costs
Product Maintenance CostAny special considerations required to
maintain product life (e.g. refrigeration).Not a major issue
Facility CostsFixed costs and allocation of storage,
including site maintenance.
Fixed cost, minimal incremental
costs
Asset TaxesTaxes incurred on company assets
specifically related to inventory. (if any)
Unsure, but expected to be
minimal as compared to 1 & 2
Supply Chain needs to understand the total cost of holding inventory and all the facets that should be incorporated for accuracy.
3Supply Chain Assessment & Strategy Inventory – Holding Cost

30Jay Martin May 2012 Supply Chain Assessment.ppt
For these types of projects, Chief Innovation likes to create a graphic picture of the long-tail by revenue and by units (below).
2
5.3%
94.7%
47.9%
52.1%
0.6%
99.4% 74.2%
25.8%
% of Revenue % of Products % of Revenue % of Products
These types of charts help emphasize to resistant executives the enormity of SKU proliferation compared to lack of contribution.
Sales Volume
2013
Bottom 40 Products Bottom 20 Products
3Supply Chain Assessment & Strategy Inventory – Long Tail ($s)
31Jay Martin May 2012 Supply Chain Assessment.ppt
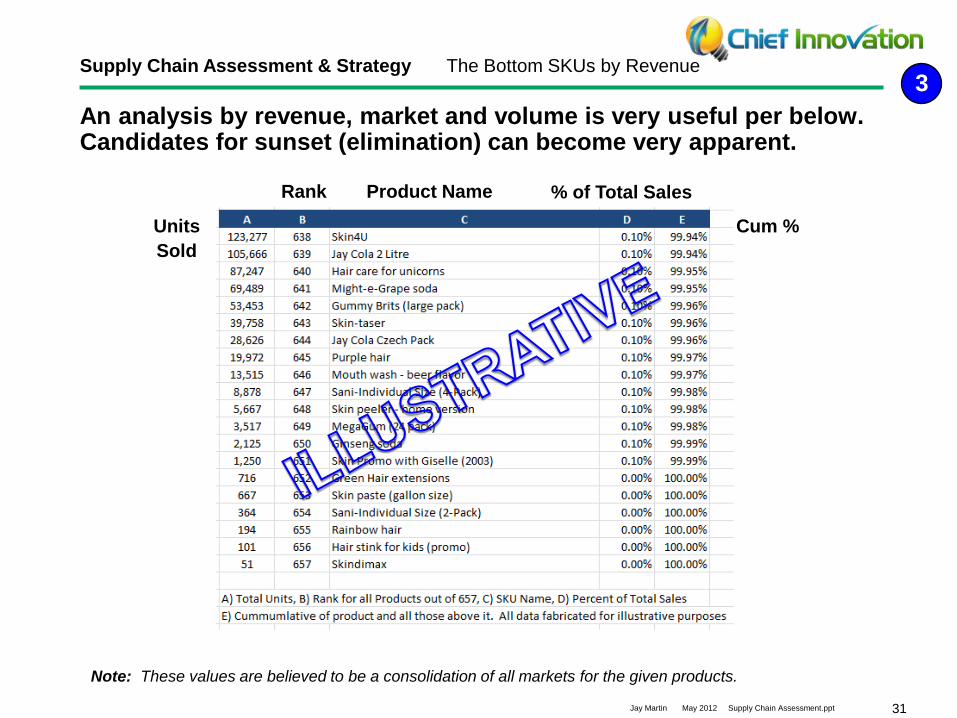
An analysis by revenue, market and volume is very useful per below. Candidates for sunset (elimination) can become very apparent.
Units
Sold
Cum %
% of Total SalesProduct NameRank
Note: These values are believed to be a consolidation of all markets for the given products.
3Supply Chain Assessment & Strategy The Bottom SKUs by Revenue

32Jay Martin May 2012 Supply Chain Assessment.ppt
The cost of SKU proliferation manifests itself at both the time of addition of a new product, as well as throughout its life.
SKU Creation Over the Lifetime
• Evaluation by Marketing
• Item Master creation
• Product introduction resources
• Product introduction alerting
• Creation of warehouse location
• Setting up vendor (if new)
• Obsolete inventory risks
• Occupies warehouse space
• Distraction of Marketing
• Risk for returns or recalls
• Increased out-of-stock risk
• Product costs for low volumes
• Ordering costs
• Cost of keeping product in stock (for longer time periods)
• Product elimination costs
• Price discounts for low sales
• Distraction for Wholesalers
Profits are in proportion to revenue, costs are in proportion to transactions. If costs were completely allocated, these would be losers.
3Supply Chain Assessment & Strategy Inventory - Sunset Process

33Jay Martin May 2012 Supply Chain Assessment.ppt
The decision to Sunset a product or SKU should follow a logic tree.
Should we retire this
SKU/product?
Are the overall sales
low?
Are there good reasons
to keep it?
Have the sales been
declining?
Can we retire all the SKUs of the product?
Does MOQ create an
expiration risk?
Will it eliminate a Supplier?
Are there new products that
replace it?
Is there potential for it to rebound?
The questions above should drive the answer and are mostly factual (i.e. not opinions). Completing this analysis of the entire long-tail should highlight those obvious ones no one wants to ‘rescue’.
It is a complimentary
product?
Note: There may be more questions here, and Marketing should complete the analysis and prep Executives.
Does it use any of our raw
materials?
Will key Retailers get
upset?
Is it a key heritage product?
Does it fail to support our positioning?
Is the profit impact from it very small?
3Supply Chain Assessment & Strategy Inventory - Sunset Logic

34Jay Martin May 2012 Supply Chain Assessment.ppt
CI provided the client with a top-level process on how to develop metrics and a dashboard, and then built the framework for a stop-gap.
Establish Strategic
Goals
Link to Supply Chain
Metrics
Base Metrics onReal Data
Provide Access / Create
Dashboard
Drive Supporting
Actions
• Revenue
• Growth
• New markets
• Overhead costs
• Working capital
• Equity value / stock
• New products
• Wholesalers
• Retention
• Dollars / order
• Revenue mix (new products or customers vs. old)
• Fulfillment
• COGS
• Sourcing costs
• Logistics costs
• Expedite levels
• Inventory/sales
• Inventory aging
• Out-of-stocks
• Returns / costs
• SCM staffing
• SAP or JDE / Oracle
• Financial reporting
• Physical inventory
• 3PL reporting
• Marketing data
• Develop a dashboard format
• Assign an owner
• Assign each metric and owner
• Assign new staff to issues
• Alter safety stocks
• More carefully manage Air freight
• ……….
We identified all of the options, and then jointly with the Supply Chain Team, and then created a new comprehensive metric as the focus.
4Supply Chain Assessment & Strategy Dashboard & Metrics

35Jay Martin May 2012 Supply Chain Assessment.ppt
A top level metric showing excess costs created by Supply Chain was developed with an interim dashboard structure for ease of focus.
The premise of this metric is that “a perfect Supply Chain would cost ‘X’ dollars to operate, and this number is everything above that.”
4Supply Chain Assessment & Strategy SCM Dashboard
Client Co

36Jay Martin May 2012 Supply Chain Assessment.ppt
One of the first things CI did was validate and dispel some of the general beliefs of the executive team and the Board of Directors.
What we thought Reality Reasons / Implications
Supply Chain is hurting our
profitability, but we are not sure
just by how much.
Possibly over $37 million for
2013.
Lost profit from missed orders,
along with obvious excess costs
in shipping and inventory.
2% was our forecast error for the
last quarter of 2012 when we did
an analysis. We are doing okay.
Over 13% was the reality.
Prior calculation was made
without including key data that
impacts accuracy.
Four turns is our goal.
A balance between inventory
control and fulfillment is required,
with fulfillment being the priority.
The cost of a back-order dwarfs
the savings from managing
inventory, though both are critical.
Inventory losses are in the
“tens of millions”.
Finished Goods write-offs were
under a million in 2013, down
from a little more in 2012.
The one bit of good news.
Losses in Raw Materials and
Promos were not included here.
Our Forecasting should be ‘easy’
given how the wholesalers.
Actual demand outside the U.S.
shows enormous fluctuation
period to period.
‘Smooth’ or predictable demand
is not the norm, especially in 28
of 43 markets outside France
Supply Chain needs to worry
about many things.
P.O. order date optimization fixes
the bulk of expensive problems.
With an outsourced Supply
Chain, kicking off the start is the
key to supporting profitability.
5Supply Chain Assessment & Strategy Results – Original beliefs

37Jay Martin May 2012 Supply Chain Assessment.ppt
Where were over 50 recommendations from this effort, with four major areas encompassing the majority of recommendations.
Demand Planning
Metrics & Dashboard
InventoryManagement
Sourcing & Supplier Mgt
• New Forecasting staff
• New Demand Planning tool
• Evaluation of SAP usage
• New forecast measures
• Review Demand variability
• New Sunset selection parameters
• Inventory holding changes
• Write-off investigation
• Stock-out flagging evaluation
• Reinvestigate manufacturing
• Collaboration & communication
• Supply base research
• Comprehensive SCM Metric
• Top-level new dashboard
• Country-level metrics
• Balancing of B/O & FGI
• Standard back-order cost
15Supply Chain Assessment & Strategy Results

38Jay Martin May 2012 Supply Chain Assessment.ppt
For each of the more than 50 recommendations, we provided some details and then a brief explanation. For some, we had more details.
# Area Recommendation Rationale
11 InventoryImplement and build out a new item
Sunset process.
This report has details of how to execute the front part of
the process, which is where you currently are stopping.
One method is to set a bar to ‘keep’ a SKU/item, and then
force any failures to be defended against deletion.
12 InventoryComplete a further Deep Dive analysis
on FGI write-offs
A quick analysis was already performed, but a thorough
investigation with ‘how to avoid’ each type of occurrence
should be completed. Ask the each Country Manager
‘what happened’ and figure out how to avoid repeating.
13 InventoryAdd LIFO checking to Cycle Count
process each month
Objective is to ensure that FIFO is being used in the
Warehouse by the 3PLs and that the correct lots are
being pulled from so as to avoid pre-mature expiration.
51 TransportationInquire to 3PLs and Wholesalers on
In-Bound Transport visibility tools or
reports, particularly for Europe land.
Many 3PLs have online systems that provide client facing
transportation information. This could help with
understanding arrivals better given your broad reach
across the world and manufacturing complexities.
52 Warehouse ‘One Day Hold’ for flagged stock-outs
A concern is that stock-outs are not being properly
addressed given the new warehouse system and that
other warehouses are not fulfilling them when they could
be so as to improve order fulfillment to wholesalers.
15Supply Chain Assessment & Strategy Results - Recommendations

39Jay Martin May 2012 Supply Chain Assessment.ppt
A top level implementation guide was prepared to include each item. Definitive tasks for each were spelled out with some rough timing ideas.
Item # Task(s) Q3 2014 Q4 2014 Q1 2015 Q2 2015 Q3 2015 Q4 2015 Q1 2016 Q2 2016
1Decide what level the person who will
lead this will be, who they will report
to and then hire them
StartLatest to
complete
16Assign someone to build and utilize
this. Design the functionality. Build
in Excel. Utilize for Date estimating.
Complete
and rolled
out
17SAP evaluation, decision on
functionality, understanding of cost
and then inclusion into SAP upgrade
Start SAP upgrade?
18
Decide on Forecasting evaluation
timeframes, trial analysis using
MAPE, review, assess errors, take
corrective action
Start
Create
yearly
schedule
19
Complete Post-mortem on the failure
in Demand Planning of issues during
2013 to better understand issues and
avoid them in the future
Create
form,
assign to
team
Analysis
completed,
Reviewed
by Execs
20
Institute a form to be completed
whenever a product goes on Back-
order requiring an explanation and
corrective action to avoid recurrence
Create
form, trialRoll-out
23
Analyze Auto-Orders and Demand
Variability, identify policies that may
drive Wholesaler order variability,
decide to keep/change
Analyze, discuss and
propose changes to Sales
Operations
24
Identify all market impacting activities,
evaluate past impacts on actual
demand, create a form and system to
obtain from country MDs
Workshop
to create
list of all
Consolidate list, assess past impacts and
then roll-out a system to the countries
where they provide the information back
to Paris for forecasting implications
Item # - this is a reference number per the recommendations at the front of this deck
Supply Chain Assessment & Strategy Results – Implementation Plan5

40Jay Martin May 2012 Supply Chain Assessment.ppt
For any questions or clarifications, please feel to contact us.
Contact Details
Any questions, please contact:
Jay Martin
Chief Innovation, Inc.
Please contact me via the website or LinkedIn
(email usually provided here to clients)
Supply Chain Assessment & Strategy Contact Information