Supply chain strategies and green logistics performance at ...
52
SUPPLY CHAIN STRATEGIES AND GREEN LOGISTICS PERFORMANCE AT UNILEVER IN KENYA By Masinde Walter Wanyonyi Research Project Submitted in Partial Fulfillment of the Requirement for the Award of Master of Business Administration, School of Business University of Nairobi November, 2013
Transcript of Supply chain strategies and green logistics performance at ...

SUPPLY CHAIN STRATEGIES AND GREEN LOGISTICS PERFORM ANCE AT
UNILEVER IN KENYA
By
Masinde Walter Wanyonyi
Research Project Submitted in Partial Fulfillment of the Requirement for the Award of Master of Business Administration,
School of Business University of Nairobi
November, 2013

ii
DECLARATION
STUDENT’S DECLARATION
I declare that this project is my original work and has never been submitted for a degree
in any other university or college for examination/academic purposes.
Signature: ______________________ Date:_________________________
MASINDE WALTER WANYONYI
D61/67995/2011
SUPERVISOR’S DECLARATION
This research project has been submitted for examination with my approval as the
university supervisor.
Signature: ______________________ Date:_________________________
Prof Gituro Wainaina
Department of Management Science
University of Nairobi

iii
DEDICATION
This research will be dedicated to my Son Alvan Tony Walukaya and my dear wife
Maureen Mahero Chiteri. I would also like to dedicate it to my parents for their prayers
and moral support. Last and least to my supervisor Prof. Gituro Wainaina.

iv
TABLE OF CONTENTS
DECLARATION............................................................................................................... ii
DEDICATION.................................................................................................................. iii
LIST OF TABLES........................................................................................................... vi
ABSTRACT..................................................................................................................... vii
CHAPTER ONE: INTRODUCTION..............................................................................1
1.1 Background of the Study............................................................................................1
1.1.1 Supply Chain Strategies...................................................................................... 1
1.1.2 Green Logistics Performance ............................................................................. 3
1.1.3 An Overview of Unilever ................................................................................... 5
1.2 Statement of the Problem...........................................................................................6
1.3 Objective of the Study................................................................................................9
1.4 Value of the Study....................................................................................................10
CHAPTER TWO: LITERATURE REVIEW..................... ..........................................11
2.1 Introduction ..............................................................................................................11
2.2 Supply Chain Strategies ...........................................................................................11
2.3 Green Logistics Performance...................................................................................13
2.4 Review of Relevant Studies .....................................................................................13
2.5 Summary of Research Gaps .....................................................................................16
CHAPTER THREE: RESEARCH METHODOLOGY ................ ..............................20
3.1 Introduction ..............................................................................................................20
v
3.2 Research Design.......................................................................................................20
3.3 Data Collection.........................................................................................................20
3.4 Data Analysis ...........................................................................................................21
CHAPTER FOUR: DATA ANALYSIS AND DISCUSSION......................................23
4.1 Introduction ..............................................................................................................23
4.2 Response Rate, Background Information and Educational Level............................23
4.3 Factors Influencing the Adoption of Supply Chain Strategies.................................25
4.4 Relationship Between Hypothesized Factors and Green Logistics Performance ....31
4.5 Discussion of Findings .............................................................................................33
CHAPTER FIVE: SUMMARY, CONCLUSION AND RECOMMENDATI ONS..35
5.1 Introduction ..............................................................................................................35
5.2 Summary ..................................................................................................................35
5.3 Conclusion................................................................................................................36
5.4 Recommendations ....................................................................................................36
5.5 Limitations of the Study ..........................................................................................37
5.6 Suggestions for further study ..................................................................................37
REFERENCES.................................................................................................................38
APPENDICES..................................................................................................................41
Appendix 1 Questionnaire
vi
LIST OF TABLES
Table 1: Summary of Literature Review .......................................................................... 18
Table 2: Summary of Methodology.................................................................................. 21
Table 3: Response Rate..................................................................................................... 23
Table 4: Distribution of Respondents by Gender ............................................................. 23
Table 5: Distribution of Respondents by Education Level...............................................24
Table 6: Distribution of Respondents by Length of Service.............................................24
Table 7: Descriptive Statistics of Top Management Support ........................................... 25
Table 8: Pearson’s Correlation Coefficient Matrix........................................................... 26
Table 9: Descriptive Statistics of Information, Communication and Technology ........... 27
Table 10: Pearson’s Correlation Coefficient Matrix......................................................... 28
Table 11: Descriptive Statistics of Communication ......................................................... 28
Table 12: Pearson’s Correlation Coefficient Matrix......................................................... 29
Table 13: Descriptive Statistics of Organizational Culture .............................................. 30
Table 14: Pearson’s Correlation Coefficient Matrix......................................................... 31
Table 15: Model Summary for Regression Analysis ....................................................... 31
Table 16: Coefficient Estimates for Regression Analysis ............................................... 32
Table 17: Challenges Facing Implementation of Green Logistics Strategies................... 33
vii
ABSTRACT
The climate change is being recognized as one of the greatest challenges of this century,
carbon emissions, the main contributor to climate change, are increasingly becoming the
centre of attention and also in supply chains. Due to growing public awareness,
consumers are increasingly including environmental criteria in their purchasing trends.
The purpose of the study was to analyze the effects of supply chain strategies and green
logistics performance at Unilever in Kenya. For this study, the target population was
employees of Unilever Kenya, which is a global organization, with branches worldwide
with one of the branches in Kenya along Commercial Street in industrial area. The study
used 62 employees as a sample case that consisted of personnel who were logistics
managers, transportation managers, and procurement officers or their equivalents at
Unilever in Kenya.
To achieve the research objectives, both primary and secondary data was used. Primary
data was collected through a questionnaire and interviews. Secondary data was obtained
through documents review that is procurement manuals, newsletters and magazines.
Qualitative data was analyzed through regression analysis, mean and standard deviation.
Quantitative data was analyzed using descriptive statistics. Data collected was analyzed
by use of correlation and regression analyses.Further, it was established that Unilever has
a good Information, Communication and Technology (ICT) framework though it needs to
improve on some aspects including coordination of technology with customers and
efficiency in information quality. Communication was rated average, with timeliness of
communication on change and development of integrated communications plan being
specific areas that need immediate attention. Further, it was found that the organizational
culture at Unilever was supportive only to a moderate extent towards the adoption of
green supply chain strategies. The study recommended that Unilever should improve its
communications by strengthening timeliness of communications on change and building
an integrated communications plan. The company should re-engineer its corporate
culture.
1
CHAPTER ONE
INTRODUCTION
1.1 Background of the Study
Green logistics describes all attempts to measure and minimize the ecological impact of
logistics activities. This includes all activities of the forward and reverse flows of
products, information and services between the point of origin and the point of
consumption. It is the aim to create a sustainable company value using a balance of
economic and environmental efficiency .Green logistics have its origin in the mid 1980s
and was a concept to characterize logistics systems and approaches that use advanced
technology and equipment to minimize environmental damage during operations (Zhu &
Sarkis 2004).
Green logistics has emerged as one of the areas of enhancing efficiency in an
organization, meeting higher customer expectation, environmental changes, globalization
and rapid technological changes, companies have to re-engineer their ways of doing
business in order to remain competitive. This calls for development of best practices in
all organizational functions in order to ensure that organizations are in line with current
business trends. Green logistics in supply chain management is not an exception
(Christopher & Lee, 2004).
Green logistics has recently received a worldwide recognition as a key business process
through which suppliers are able to provide products, services and information that add
value to customers and other shareholders (Chan & Qi, 2003). It should be a proactive
approach through which the buyers decide to relate and collaborate with sellers willingly
or unwillingly for mutual benefit because each party needs the other for survival.
1.1.1 Supply Chain Strategies
Unilever has adopted various strategies to achieve its objectives; hence supply chain
strategies like those that lean management has been put in place. The theory of lean
thinking has evolved with time. The term lean production was first used to describe the
2
process of minimization of waste in automotive industry (Womack et al., 1990). Jones et
al (1997) say lean thinking has a natural starting point with value for the customer
looking at the whole rather than the individual processes. However, leanness means
developing a value stream to eliminate all waste, including time and to ensure a level
schedule (Naylor et al, 1999). More recently, Hines et al (2004) stated that lean exists at
two levels strategic and operational. The customer value creation strategic applies
everywhere, the shop floor techniques do not, but value creation is only equal to quality,
cost and delivery. However, lean thinking is not a supply chain strategy that can be
adapted to all sorts of products. Developing a supply chain strategy consists of matching
market characteristics with supply.
Unilever operates in a market that is volatile due to many emerging factors, it has
implemented agile strategy. Agility has come a new paradigm under the current market
conditions in several sectors. Naylor et al (1999) defined agility as using market
knowledge and a virtual corporation to exploit profitable opportunities in a volatile place.
Christopher and Towil (2000) stated that agility is a business wide capability that
embraces organizational structures, information systems, logistics process and in
particular markets.
According to Ansoff (1987) supply chain strategy is an interactive process that evaluates
the cost benefit trade-offs of operational components. Business strategy involves
leveraging the core competencies of the organization to achieve a defined high-level goal
or objective. It also includes the analytic and decision making process surrounding what
to offer, when to offer and where to offer as a competitive plan.
While the business strategy constitutes the direction that an organization wishes to go, the
supply chain strategy constitutes the actual operation of the organization and the extended
supply chain to meet a specific supply chain objective (Naylor 1999). The supply chain
strategy is important in that it focuses on driving down operational costs and maximizing
efficiency, for example an organization can choose a strategy directed at supplier
management as a way to remain competitive. Supply chain strategies define how the
supply chain should operate in order to compete.
3
A supply chain strategy provides a clear purpose because the organization keeps sight of
the strategy and is able to devise tactical steps to achieve its goals (Johnson, Coles and
Whittinston (2009). Another reason for having a supply chain strategy is to establish how
to work with supply chain partners including the external and internal partners in relation
to the organization. Stanford Graduate School of Business states that companies can
make money while operating in socially responsible and environmentally friendly ways.
It just takes what supply chain expert Hau Lee calls the triple A approach-having agility,
adaptability and alignment According to Hines et al (2004),in developing a supply chain
strategy, the first step is for supply chain executives to clearly understand how the
enterprise chooses to compete, for example if the business strategy is to be low cost
provider, the supply chain strategy should support this. Assessing the extended supply
chain, conducting a detailed, realistic assessment of the capabilities that exist within the
organization and even the extended supply chain, closely scrutinizing organization’s
assets and evaluate how well they support the overall strategy of the organization.
Developing an implementation plan is critical, for the success of the supply chain
strategies to achieve the business strategy (Naylor, 1999), as it lays a road map on how to
realize the stated objectives. Executing supply chain strategies, involves closely
following the implementation plan and applying good project governance. Tracking
performance allows organization to measure how successful it is in realizing the goals of
the strategy. Executing a supply chain strategy means dealing with many different
entities, both internally and externally and different stakeholders need to be informed.
1.1.2 Green Logistics Performance
Green logistics performance is a form of logistics, which is calculated to be
environmentally and often socially friendly in addition to economically functional
(Ganesha R., Harrison T., 1995). As early as the 1980s, several companies were
concerned with developing green logistics and interest in the concept soared with
increased consumer concerns about how products were manufactured and delivered in the
21st century. Many modern companies pride themselves on their environmentally friendly
policies and practices, and companies, which are interested in adopting green logistics.

4
The term green businesses is defined by Smith (2003) and Friend (2009) as businesses
and practices that are viewed as environmentally sound, including the use of organic and
natural products to build factories, tighter protection against emissions and
environmentally friendly sourcing of materials. Zsonai (2001) defines a green business as
a business that has adopted the concept of environmentalism across the various functions
of the business.
The main objective of logistics is to co-ordinate the movement of products through the
supply chain in a way that meets customer requirements at minimum cost. In the past,
this cost has been defined purely on monetary terms Zsonai (2001). As concern for the
environment rises, companies must take more account of the external costs of logistics
associated mainly with climate change, air pollution, noise, vibration and accident. Green
logistics analyses the environmental consequences of logistics and how to deal with
them.
Logistics involves the movement of products from every step between raw materials and
end consumer of a finished product. One of the key focuses of logistics is delivering a
product, which will satisfy consumers at the lowest possible cost, and a variety of
creative measures can be used to cut costs and reduce overall costs. Supply chain
management, warehousing, retailing, manufacturing and safety inspections are all part of
logistics.
In green logistics, all issues, which pertain to regular logistics, still apply, with the added
factor of environmental friendliness. Sometimes making products environmentally
friendly also happens to play into economic concerns. For example, a beverage
manufacturer could reduce the use of plastics by making thinner bottles, thereby cutting
down on shipping costs. In other instances, making a product environmentally friendly
may cost more causing it to come to conflict with traditional logistics.
Social issues may also be considered because consumers are sometimes concerned about
the social impact of a product. For example, if a cut flower company grows flowers
organically but underpays its workers and refuses to allow them to unionize, consumers
might boycott the company even though the manufacturing process is green. Companies

5
may actively promote worker and community welfare to emphasize that they believe in
community responsibility as well as environmental responsibility, so that their products
are more appealing to consumers.
Consumers are sometimes willing to pay more for products bearing labeling which
indicates that the parent company practiced environmental and social responsibility when
making the product, which makes green logistics appealing from a business standpoint as
well as an ethical one.
1.1.3 An Overview of Unilever
Unilever is a manufacturing firm, founded in 1930 out of a merger between Lever
Brothers (UK) and Uni-margarine (Netherlands). It existed in the 19th century, Unilever
(Uni+Lever) is today one of the world’s leading Fast Moving Consumer Goods (FMCG)
company with a turnover of more than 4.3 billion Euros, With corporate offices in
London and Rotterdam, it operates in 100 countries and employs 250,000 people
globally. The company spends 2.5 percent of its turnover on research and development
and 1.5 percent on Corporate Social Responsibility (CSR). Everyday 150 million people
choose Unilever brands to feed their families and clean themselves and their homes. It
manufacturers some of the world’s leading foods, home and personal care products such
as Blue band and Flora margarines, knorr and royco, ice cream, lipton tea; and omo; lux,
dove, lifebuoy, geisha, sunlight ; vaseline, lady gay and close up tooth paste.
In addition, Unilever is involved in the growing, buying, manufacturing and marketing of
tea. This is done alongside, fuel wood production, sustainable agriculture, research and
development. Unilever East and Southern Africa (ESA) is a Unilever subsidiary
operating in Kenya, Uganda, Tanzania, Zimbabwe, Zambia, Mozambique and Malawi.
Unilever cover a market of 19 countries with a population of 150 million people and
operates two businesses, the consumer business dealing with FMCG and the tea
plantations business in Kenya and Tanzania. The plantations business is the biggest
employer in Unilever with a workforce of 25,000 (10 percent of Unilever workforce)
with a staff of 625 at the Unilever-Nairobi. The consumer business employs over 1,500

6
people directly. In addition, there are 120 distributors spread across the seven countries
reaching more than 100,000 retail outlets each week.
Unilever mission is to add vitality to life and to meet everyday needs for nutrition,
hygiene and personal care with brands that help people feel good, look good and get more
out of life. Because Unilever vitality mission is rooted in the intimate understanding of
people’s needs and aspirations, it inspires new ways at Unilever ESA to reach consumers
with quality products that care for their families and help them get more out of life. To
achieve this aim, it maintains the highest standards of corporate behavior towards its
employees, consumers, customers and indeed its operating environment.
Unilever subscribes to the highest standard of corporate behavior by being transparent in
its dealings, fair in competition and law abiding. The company is a socially responsible
and responsive organization that takes strategic actions for the improvement of the
communities within which it operates. Through the Unilever CSR programme, the
company is involved in the provision of support to the region’s communities in the fields
of health, education, water, hygiene, nutrition and environment.
Unilever plantations worldwide are leading centers of agricultural research, innovation
and sustainable agronomic practices. Its quest for excellence is explained by the fact that
it spends more then one billion Euros a year, 2.5 percent of turnover on research and
development. The 114 of global manufacturing sites are certified by the International
Management Standards, International Organization for Standardization (ISO 14001). In
addition, it spends over 66 million Euros (15 percent of turnover) on a range of
community projects.
1.2 Statement of the Problem The successful implementation of a supply chain strategy is the most pressing issues
facing many organizations in the world today. Noble, (1999) states that well formulated
strategies only produce superior performance for the firm when they are successfully
implemented. Mintzberg and Quinn, (1991) state that 90 percent of well-formulated
strategies fail at implementation stage, while David (1991) claims that only 10 percent of

7
formulated strategies are successfully implemented. The reasons that have been advanced
for success or failure of the strategies revolve around the fit between the structure and
strategy, the allocation of resources, the organizational culture, leadership, rewards as
well as nature of the strategy.
Business environment has become very competitive due to pressures originating from
different areas for example regulatory and community pressures. Furthermore, there is
pressure for environmental sustainability, which requires strategies to be put in place to
reduce the environmental impacts caused by the products and services offered. Clem
(2008) adds that going green reflects a social consciousness around saving and advancing
the Earth’s natural resources, preserving and protecting them for the sake of civilization.
When customers become more aware of environmental issues, there is an increase in the
demand for ecological products. This increased awareness of and sensitive towards
environmental issues places certain demands on business functions to become greener.
Organizations have made significant progress with environmental management in the last
decade by implementing laws and strategies that focus on sustainable development and
green issues (Engel, 2009). In spite of this notion, most businesses still do not recognize
the need to become green. Previously, businesses assumed that incorporating green into
their business would cost money, but they now realize that ignoring negative impacts on
the environment will be costly in the future (Van der Zee 2008). The purpose of going
green is to use products and methods that would not negatively affect the environment
through pollution or depleting natural resources (Robinson 2008).
The importance of supplier relationship management of procurement performance
(Ratemo, 2012) states that Nakumatt Supermarkets during the year 2007 had
implemented the use of green bags to replace the use of plastic paper bags but the concept
died along the way. This raises research questions, is it that many organizations are using
green logistics concept for public relations or as a CSR to achieve its goals.
It has become a challenge for Unilever to use eco-friendly materials, procedures and
processes to ensure optimal raw material usage, recycle waste products, for example,

8
plastic paper and glass hence increasing operating income resulting to rising dumpsites
like Dandora that poses a health hazard. Carbon emissions linked to the movement of
goods, transit packaging used for distribution, the operation of distribution facilities and
damage or wastage has been on the increase, yet Unilever has adopted a strategy to seek
suppliers with green production processes to offset financial and environmental risk and
use of e-procurement to offer green products at cheaper prices yet the prices have been on
a steady increase.
There is growing evidence that green logistics results in increased supply chain
performance, particularly since greenness, particularly because it favors an integrated
perspective about supply chains (Rodriguez, 2001). The actors involved in logistical
operations have a strong bias to perceive green logistics as a mean to internalize cost
savings, while avoiding the issue of external costs. The top environmental priority is
commonly reducing packaging and waste. The rise in energy prices is conferring
additional incentives for supply chain managers to improve upon logistics and will
correspondingly push energy and emissions at the forefront. These observations support
the paradoxical relationship between logistics and the environment that reducing costs
does not necessarily reduce environmental impacts. By overlooking significant
environmental issues, such as pollution, congestion, resource depletion, means that the
logistics industry is still not very green. Green logistics remains an indirect outcome of
policies and strategies aimed at improving the cost, efficiency and reliability of supply
chains. A key aspect of more environmentally friendly freight distribution systems
concerns city logistics where the “last mile” in freight distribution takes place as well as a
large share of reverse logistics activities. Still, even in this context the driving force is not
directly environmental issues, but factors linked with costs, time, reliability, warehousing
and information technologies.
There is no study on supply chain strategies and green logistics performance done at
Unilever. Similar studies on strategy implementation on performance done in Kenya by:
(Kimeli, 2008; Aosa 1992; Kiprotich 2008) Gakenia, 2008; Mobisa , 2007; Ngumo,
2006). The researcher concluded that they are challenges in implementing strategies in

9
firms, but none of these studies addressed the issue of the Supply chain strategies and
green logistics performance at Unilever-Kenya.
According to Green et al. (1997), in the context of the deteriorating environment, supply
chain strategies on green logistics stands for innovations in supply chain management and
industrial purchasing. Zhu and Sarkis (2004) suggest that these supply chain practices
consist of four major dimensions: internal environmental management, external
environmental management, investment recovery and eco design. Local studies on green
logistics as well as supply chain strategies are very few. Mugambi (2010) studied an
exploration of challenges faced in strategic implementation of green procurement in the
hotel industry. Wasike (2010) studied the effects of Integrated Supply Chain (ISC) on the
performance of Nairobi bottlers, providing evidence of a positive relationship between
ISC and performance with a recommendation for similar study in other manufacturing
firms. Awino (2011) did a study of supply chain management in large private
manufacturing firms in Kenya, which showed some empirical evidence of competencies,
strategy and capabilities on performance especially when conjoined. Based on this
review, no study has been done to analyze supply chain strategies on green logistics
performance and thus a research gap.
Further, conclusion from the studies carried out in other areas, it has came out clearly
that, although organizations consider environmental management their own strategies,
measuring supply chain strategies on green logistics performance based on practices
implemented has attracted little attention. The existing measurement methods are
insufficient to reflect critical characteristics such as the organization’s strategic goals and
interactions with partners (Beamon, 1999). The preceding discussion leads to research
question to be addressed in this research project on how supply chain strategies affect
green logistics performance at Unilever.
1.3 Objective of the Study
The general objective of the study was to analyze the effects of supply chain strategies on
green logistics performance at Unilever in Kenya.

10
The specific objectives were to:
1. Determine the motivating factors influencing the adoption of supply chain
strategies on green logistics at Unilever
2. Evaluate the relationship between the motivating factors and green logistics at
Unilever.
3. Establish the challenges facing the implementation of supply chain strategies on
green logistics at Unilever
1.4 Value of the Study
The study will be important to the policy makers as they would be able to know for
certain what environmental factors play a bigger role in shaping their operations and how
they affect performance and what supply chain strategies to use in order to increase green
logistics performance. The results will contribute to a better understanding on how
effective supply chain strategies employed by Unilever are responding to green logistics
performance.
The study is also important to Unilever-Kenya management because they will be able to
know the analysis of supply chain strategies on the green logistics performance, and how
they can be environmental friendly in their operations. The study will be of great interest
to the researcher and the supply chain management department. It will improve
administration of various supply chain strategies to achieve the business strategy while
putting into consideration the green issues. The study will enable the organization to be
seen as the customer’s choice, when it is able to put into place supply chain strategies to
achieve green logistics performance, hence increment in revenue to increase customer’s
base.
The results of this study will also be invaluable to researchers and scholars, as it will
form a basis for further research. The scholars will use this study as a basis of discussion
on supply chain strategies adopted by Unilever towards green logistics performance. The
study would be a source of reference material for future researchers on other related
topics, and help other academicians who undertake the same topic in their studies.
11
CHAPTER TWO
LITERATURE REVIEW
2.1 Introduction The effect of green business practices requires an in depth knowledge of client
requirements together with the ability to satisfy these requirements while contributing to
environmental sustainability. Managers need to develop systems and structures within
their business that satisfy the requirements of green business practices while achieving
strategic business goals. Various authors (Bized 2010; Bosch, Tait &Venter 2006,
Weinhardt & Schlottmann 2008) use different classifications for the business functions.
These classifications assisted the researchers in grouping the functions into six logical
groups to eliminate duplication of activities, as well as to simplify the analysis of the
empirical results. The functions were grouped as follows manufacturing, information
technology, operations, marketing; sales, purchasing and supply chain management,
distribution/logistics, and finance.
2.2 Supply Chain Strategies Lean supply chain based strategy is a pull system that aims to minimize inventory within
the Supply chain management. It enables Goods to be ordered as and when needed, in
order to satisfy a particular need. To achieve waste minimization, the pull system
emphasizes the use of JIT delivery. McKinnon (1996) has suggested that JIT delivery
cannot be a green solution; despite that, it has not greatly increased road volume. Zhua &
Sarkis (2004) have stated that company-to-company relationships aspects of JIT and its
focus on movement of materials may cause more detriment in terms of a moderating
affect on the relationships between practices where existence of such programmes may
supersede finding environmental efficiencies for the sake of improved operational
performance.
An agile strategy enables a manufacture to be able to withstand variations and
disturbances and indeed to be in a position to take advantage of these fluctuations to
maximize profits. According to Christopher and Towill (2002), agile supply means
reserving capacity to cope with volatile demand. Whereas information transparency is
12
desirable in lean regime, it is obligatory for agility. This means that the agile supply chain
needs spare capacity to respond to rapid changes in the market demand, where these
changes are usually unpredictable. However, there are alternative ways to mitigate this
negative effect of having spare capacity, freight consolidation improves vehicle
efficiency and allow logistics providers to achieve robustness without having a negative
impact on transport costs and the environment (Wu & Dunn 1995). Therefore, the impact
of robustness on green logistics performance under agility should holistically be assessed.
A good supplier management strategy not only includes working with suppliers to
improve their performance, but also integrating with sourcing processes and
communicating the strategy's value to the organization. Sherry Gordon, the president of
the Value Chain Group, a consulting firm that specializes in supplier management
process design and development. A firm should make sure that people doing the sourcing
have access to performance information about current suppliers. Successful supplier
relationships require two-way information, recommendations, metrics and incentives,
says Pat Leemputte, director of consulting firm Bridge Strategy Group. He suggests
manufacturers adopt different strategies to manage suppliers throughout a contract's life,
(Jeremy F. Shapiro ,2001).
Emphasize the need to understand the cost and value of the entire supply chain. Sunil
Chopra and Peter Meindel (2002) without a thorough understanding of all costs, from raw
materials through the product or service, and the value provided by each supplier in the
process, a supplier could not be evaluated. Realize that supplier strategies go two ways.
Most companies focus on what suppliers can do for them rather than on what they can do
with the supplier to lower costs. A true partnership leverages the total production cost to
both parties' advantage.
Information is the grease that makes an integrated supply chain work. According to ,Sunil
Chopra and Peter Meindel (2002) waiting to share critical volume and timing information
with suppliers can create lost business for the company or excess inventory and added
costs for suppliers. Sharing information constantly, with appropriate security and
confidentiality, is critical for successfully managing a supplier relationship.

13
Unavoidable events that stress the supply chain should be planned and practiced. Some
industries, such as utilities implement plans for natural disasters. Every supply chain
strategy requires similar foresight and joint planning so that disruptive events can be
managed smoothly.
2.3 Green Logistics Performance According to Tanguchi et al (1999) provide a useful presentation of the objectives of
green logistics performance. According to their paper, three guiding pillars for the future
development of a green city logistics are sustainability, mobility and accessibility.
Although government and the general public influence corporate policy, logistics
companies make final decision which directly affect pollutant releases with their market
contact. According to them developing green logistics strategies and environmental
externalities, the industry must be considered. Fortunately, the goal of logistics providers
often conflict with the aims of green logistics Rodrigue et al (2000) discuss these
conflicts labeling them as the paradoxes of green logistics.
Planning and research related to green logistics has primarily been focused towards the
objectives of increasing the efficiency of industry activities with respect to timing and
profits. However, with the last 15 years growing concern over environmental impacts has
spawned the concept of green logistics as a stimulus for developing supply chain
strategies, which can reduce environmental impacts on firms. Multiple papers on the state
corporate environmental management and green logistics, do not provide a particular
comprehensive summary of potential green logistics schemes, but does give insight into
industry perspective regarding attitudes and current accepted options (Murphy and Poist,
2007). Pressure might be brought about in the form of government policies, litigation
threats or public perception.
2.4 Review of Relevant Studies Leanness characteristics as use of market knowledge, value stream and integrated supply
chain, lead time compression, eliminate of waste and level schedule, said that if market
knowledge is not exploited, a mismatch can be produced where demand is not
synchronized with supply (Naylor et al., 1999). Lean thinking is value creation for
14
customers (Jones et al 1997), Hines et al 2004). However, what is actually value creation
is effective market research and development (R&D) that is essential to determine the
impact of effective use of market knowledge on green logistics performance.
In value, chain with the integrated supply chains both information and material flows will
be simplified, streamlined and optimized, reducing waste and lead times’ (Naylor et al
1999). Likewise, several authors have included integrated supply chain as one of the
strategic requirements of lean thinking (Ohno 1988, Jones et al 1997, Mason-Jones et al
2000, Abernathy 2000, Bruce et al 2004). However, the impact of vertical integrations on
green logistics performance should be determined. In addition, it is essential to establish
whether vertical integration is enough to achieve economic supply chain effectiveness,
and the negative impact of transport on the environment.
Lean is elimination of all types of wastes including waste time, so time compression is
essential for lean manufacturing (Naylor et al 1999). Other authors emphasize this
position (Aitken et al 2003, Hines et al 2004). However, looking at the waste
minimization thinking only in terms of lead-time can have secondary effects on supply
chain performance. Moreover, lead-time can be compressed by increasing the speed of
delivery, but this could have a negative effect on green logistics performance. More
importantly, in a very stable market where most of products are commodities, time
compression could be balanced with accurate forecast.
Boeing pursued a lean manufacturing strategy without taking into account the variability
of demand in the aerospace industry and level scheduling the market demand (Naylor et
al 1999). Many authors also emphasize that level schedule is one of the key of a lean
thinking initiative (Jones et al 1997, Mason-Jones et al 2000, Aitken et al 2003, Bruce et
al 2004, Hines et al 2004). This could represent a weakness if a company applies this
without being flexible to change in market demand, so under transition periods level,
schedule could lead to obsoletes or redundant stocks, and in consequences, to
unnecessary transport movements (forward and reverse). However, it is important to

15
determine under which situations level schedule works and add value to green logistics
performance.
The more Just in Time (JIT) strategies are applied, the further the negative environmental
consequences of the traffic it creates (Rodriguez et al 2001). Moreover, the least polluting
modes are generally regarded as being the least reliable in terms of on-time delivery and
lack of breakage and safety. Ships and railways have inherited a reputation for poor
customer satisfaction. Stank and Crum (1997) concluded that firms that have successfully
implemented a JIT system have high level of performance in inbound replenishment and
customer order cycle time reductions, and on the green logistics side, are in better
position to achieve routing and scheduling consolidation for both inbound and outbound
shipments. However, that depends on how integrated they are with their suppliers and
how well they integrate with their key party logistics providers, in the JIT process.
Waters fuller (1995) emphasized that lack of support of suppliers and carriers are two
major causes of failure of a JIT implementation.
There are alternative ways to achieve high level of green logistics performance under JIT
delivery system. Information sharing within supply chain including transport providers is
essential to achieve JIT delivery and keep high level of delivery performance. As
manufacturers improve their forecasting accuracy, water modes become more feasible
under a JIT system (Helms and Dileepan, 2005). Dalsey, Hillblom and Lynn (DHL) has
endeavored to reduce the number of vehicles they use and shorten the distance they travel
by optimizing transport routes based on forecasts of cargo volume and transport time to
improve collection/delivery efficiency (DHL Report 2005). However, it is necessary to
test this hypothesis in a more robust manner to determine the feasibility of using
alternative transport modes to road under JIT system and determine how that can improve
green logistics performance.
According to Childerhouse et al (2002), focus is required to ensure demand chains are
engineered to match customer requirements. Such focus is enabled via segmentation
based on each product characteristics. According to Christopher and Towill (2000), a
customer can order on line 24 hours a day or by phone from early morning until late in
16
the evening from Dell. A Dell representative is available to make suggestions and help
customers determine what systems will best meet their needs. From a green logistics
perspective, it is necessary to undertake a holistic analysis of the effects of such a system.
One of the potential effects of this strategy is that the manufacturer needs to postpone
activities and have excess capacity to respond to change in demand, so that they can
potentially decrease the total transportation costs. However, if the supply network is re-
engineered, inventory and transport consolidation can mitigate this effect.
Dell broke into big time developing a business strategy and supply chain strategy that
worked together. In the late 1980s and 1990s, Dell’s business strategy was differentiation
through cost and speed of delivery and customer’s service. The major channel for sales
was from customers to call centres as the issue of environment and public awareness had
risen steadily. However, the emergence of the internet called for more differentiation and
fundamental change, with a well-understood business strategy. Dell began to formally
integrate operational components, for example logistics, manufacturing, distribution and
inventory management.
According to Chief executive officer, Dell “manages the value chain better than anyone
else on the planet and who might come close to us might be Wal-Mart .To meet these
goals and changing business environment, green issues are a major concern to Dell. As
supply chains moved from a cost focus and now currently to a strategic focus, the need to
think strategically about the supply chain has never been more important. The success of
a strategy is only good as the company’s ability to fully and properly execute it a great
supply chain strategy, linked with operational excellence, can provide success for not
only the company in question but also its partners and customers.
2.5 Summary of Research Gaps
Although various authors (for example, Chan 2000); Frooman 2005 and Peattie 2001)
have attempted to investigate green business performance implementation and the role
played by business strategies, contradictory results have been reported. Ferraro (2009) is
of the opinion that being green concerns extremely diverse that not all environmentally
responsible businesses are the same. This often makes it difficult to define green
17
businesses and consumers. However, certain variables could assist in explaining what
constitute a green business or consumer. Gilg, Barr and Ford (2005) concur that putting
aside the arguments relating to the definition of green limited research has been done to
assess the influence of business strategies on green practice implementation. D’Souza,
Taghian and Khosla (2007) investigated consumer’s intention to purchase green products
and business purchasing systems and found that business strategies could play an
important role. Chitra (2007) states that due to increased awareness of green business
practices, there is a need to implement green elements in their product profile and
recommend that the influence of business strategies should be investigated. Williams
(2005) argues that there is little evidence that business strategies influence green
business.
The World Commission on Environment and Development Report (1987), with its
establishment of environmental sustainability as a goal for international action, gave
green issues a significant boost in political and economic arenas. The transportation
industry was recognized as a major contributor to environmental issues through its
modes, infrastructures and flows. Yet, environmental perspectives and transportation
sustainability issues remain predominantly focused on passenger transportation Studies
have been done in relation to green logistics with the goal of a conceptual designing of
green logistics in the field of transport. These case studies allow a wide coverage of all
relevant logistics systems in the transport area. The studies are carried out, parallel to the
other work, both under temporal as well as functional aspects and for buildings, intra-
logistics and processes closely coordinated for a holistic consideration. In the course of
the seven case studies, optimization approaches for green transports are developed and
alternative strategies assessed both economically and ecologically. The review illustrates
the importance of road movements in goods distribution in urban areas. It highlights the
major economic, environmental and social impacts associated with this freight activity
and reviews policy options available to those responsible for regulation. A wide range of
possible solutions to problems posed by urban freight operations are also covered
including approaches related to consolidation, facilities, vehicle design, information
capture and utilization as well as non-road modes (Michael et al 2007).

18
Table 1: Summary of Literature Review
Study Objectives Methodology Findings Recommendation
Strategic
environmental
management in
organizations
Engel (2008)
The extent to
which
organizations
are
implementing
strategic
environmental
management
Survey Organizations
have made
significant
progress with
environmental
management
in the last
decade by
implementing
laws and
strategies that
focus on
sustainable
development
and green
issues.
Most businesses still
do not recognize the
need to become green.
Organizations’
environmental
management
Beamon, 1999.
Determine
whether
strategic
environmental
management
has influence
on
organizations
Survey The existing
measurement
methods are
insufficient to
reflect critical
characteristics
such as the
organization’s
Recommended further
studies on measuring
supply chain strategies
on green logistics
performance
19
Source: Author, 2013
operations strategic goals
and
interactions
with partners
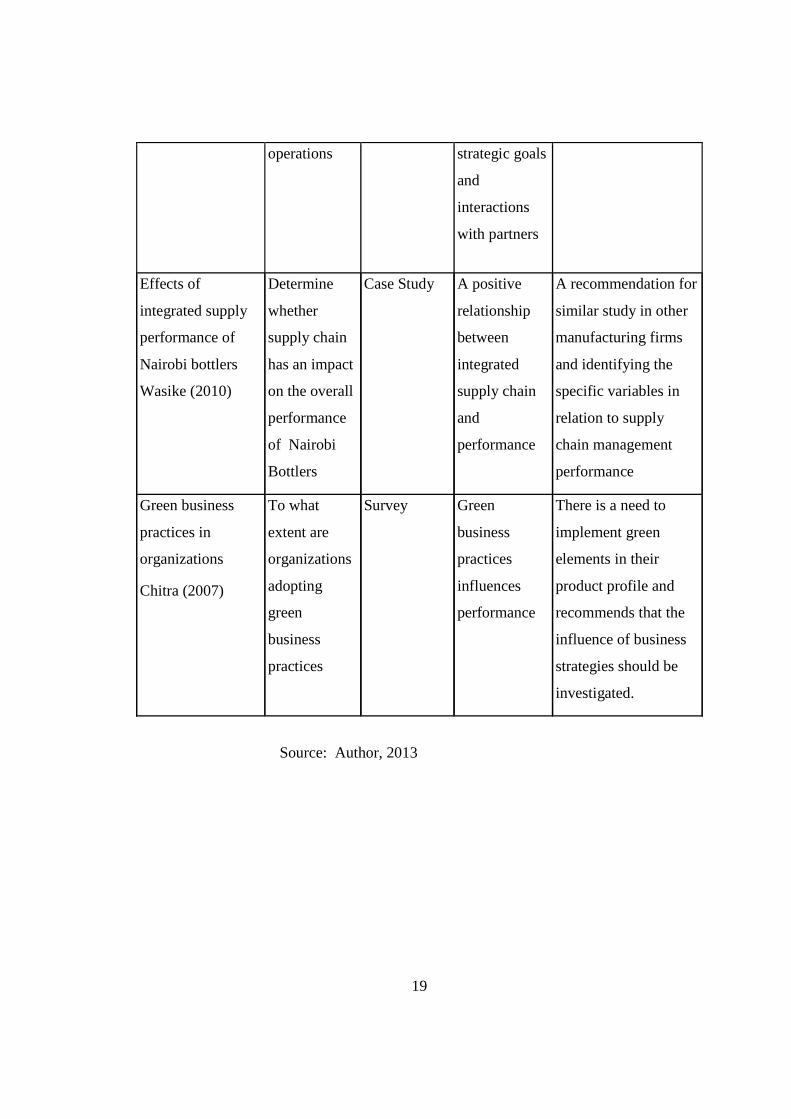
Effects of
integrated supply
performance of
Nairobi bottlers
Wasike (2010)
Determine
whether
supply chain
has an impact
on the overall
performance
of Nairobi
Bottlers
Case Study A positive
relationship
between
integrated
supply chain
and
performance
A recommendation for
similar study in other
manufacturing firms
and identifying the
specific variables in
relation to supply
chain management
performance
Green business
practices in
organizations
Chitra (2007)
To what
extent are
organizations
adopting
green
business
practices
Survey Green
business
practices
influences
performance
There is a need to
implement green
elements in their
product profile and
recommends that the
influence of business
strategies should be
investigated.
20
CHAPTER THREE
RESEARCH METHODOLOGY
3.1 Introduction This chapter outlines the approaches that were used, to gather the data that was used to
achieve the solutions to the objectives of the study. It outlines how the research was
designed, how data was collected and analyzed.
3.2 Research Design The research was conducted via a case study; a case study allows the researcher to reveal
the multiplicity factors, which have interacted to produce the unique character of the
entity subject of the study (Yin, 2009). This means that the case study placed more
emphasis on a full contextual analysis of fewer event or conditions. The case study
provided the benefit to observe and record non-verbal as well as verbal behavior (Cooper
and Schindler, 2003). The role of strategy implementation and evaluation is vested in the
heads of various departments/divisions of Unilever. Twelve heads of departments and
staff from operation areas from various divisions were interviewed using the
questionnaire and interview guide.
3.3 Data Collection The researcher bracketed his thoughts, perceptions about the research topic (Polit et al,
2001) describe bracketing in phenomenological research as the process of identifying,
and holding in abeyance any preconceived beliefs and opinions about the phenomenon
under study. It was essential to allow the participants to describe their experience openly
and freely. The researcher remained interested, attentive and non-judgmental and did not
lead the participants on responding to the questionnaire and interview. The participants
honoured the appointment. The researcher explained the purpose of the study and the
participants’ rights including confidentiality, anonymity and to withdraw from the study
at any time they so wish, Informed consent was obtained from each participant.
Both primary and secondary data were collected; primary data was collected through
personal interviews. An interview guide was used to guide the interviewer in collecting
the data from the respondents, which was closed and open-end questions .Structural

21
interviews are best suited in engaging in respondent or focus group studied which was
beneficial to compare/contrast participant response in order to answer a research question
(Lindlof & Taylor, 2002).
Although Unilever has its products throughout the country, all the logistics are linked to
divisions/departments at the headquarters and it is in the headquarters where strategies
are managed, resources allocated and general management. The target group was
divisional heads, managers bringing the total number of potential interviewees to twelve.
These were officers responsible for seeing the strategic plan implemented in their own
dimensions and they were capable of providing the information necessary of this study.
Secondary data was also collected from the supply chain management manuals, policies,
records and performance contract reports.
The interview guide was pre-tested before administering it to the respondents. The
interview guide was divided into three parts. Part A covered the respondent’s profile, Part
B sought to establish factors motivating the adoption of supply chain strategies on green
logistics performance and Part C covered the challenges faced during the implementation
of supply chain strategies.
3.4 Data Analysis Data collected from the respondents was compared and contrasted to get a deeper insight
what motivates a supply chain strategy and the associated challenges in association of
green logistics performance at Unilever.
Regression analysis was consisting of measurement of the values of the two variables X
and Y to develop a model that was useful for predicting the value of the dependent
variable Y for given values of X. Data obtained from the study was in quantitative form
and qualitative analyses based on the experience of individual participants. In numerical
form, descriptive statistics to summarize the pattern of findings was used.Descrptive
statitistics included measure of central tendency that is the mean.
22
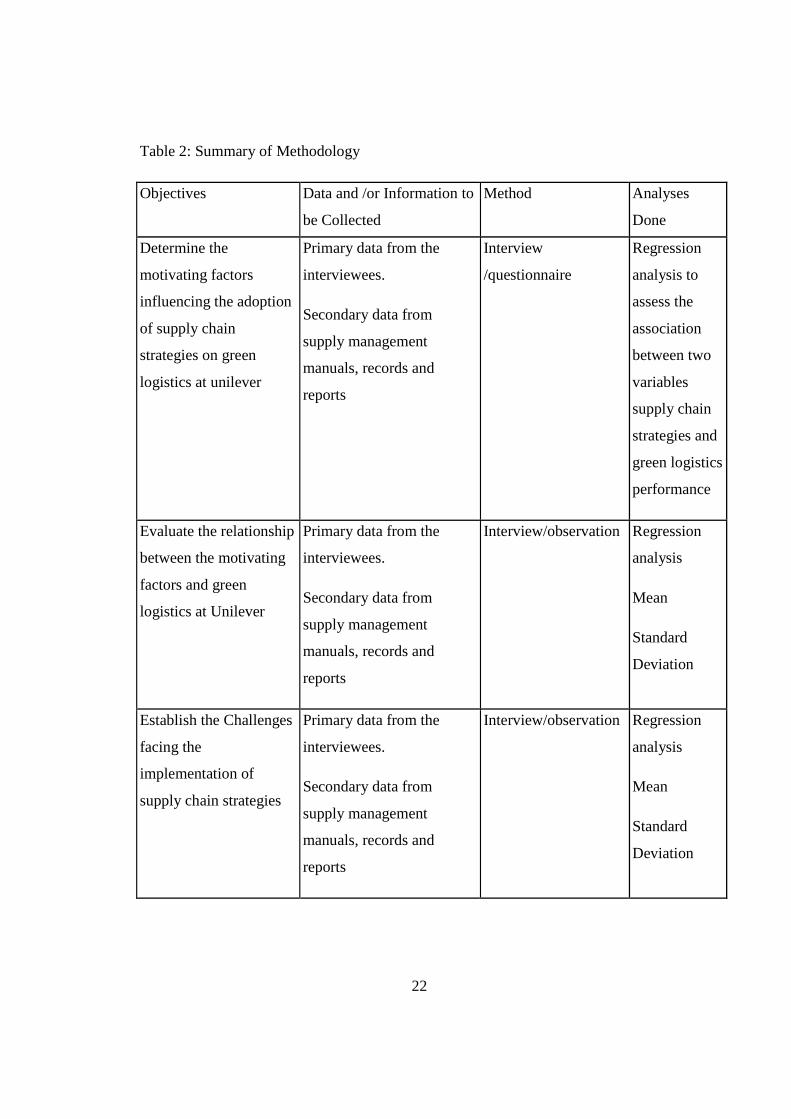
Table 2: Summary of Methodology
Objectives Data and /or Information to
be Collected
Method Analyses
Done
Determine the
motivating factors
influencing the adoption
of supply chain
strategies on green
logistics at unilever
Primary data from the
interviewees.
Secondary data from
supply management
manuals, records and
reports
Interview
/questionnaire
Regression
analysis to
assess the
association
between two
variables
supply chain
strategies and
green logistics
performance
Evaluate the relationship
between the motivating
factors and green
logistics at Unilever
Primary data from the
interviewees.
Secondary data from
supply management
manuals, records and
reports
Interview/observation Regression
analysis
Mean
Standard
Deviation
Establish the Challenges
facing the
implementation of
supply chain strategies
Primary data from the
interviewees.
Secondary data from
supply management
manuals, records and
reports
Interview/observation Regression
analysis
Mean
Standard
Deviation

23
CHAPTER FOUR
DATA ANALYSIS AND DISCUSSION
4.1 Introduction This chapter presents the data analysis results, interpretation and discussions. Data
analysis was done using Statistical Package for Social Science (SPSS) with the main
analysis tools being descriptive statistics (mean and standard deviation) as well as
regression analysis.
4.2 Response Rate, Background Information and Educational Level
The study targeted 12 management and operational staff at Unilever. The response rate
was as shown in Table 3 below.
Table 3: Response Rate
Target Achieved Percent
Management level 9 9 100
Operational level 3 3 100
Total 12 12 100
From the Table 3 above, there was a hundred percent response rate with the majority 75
percent being managerial level staff and 25 percent being operational level staff.
The respondents were asked to indicate their gender and Table 4 below shows the
distribution of respondents by gender.
Table 4: Distribution of Respondents by Gender
Frequency Percent
Male 7 58.3
Female 5 41.7
Total 12 100
From Table 4 above, majority (58.3 percent) of the respondents were males while only
41.7 percent were females. This indicates an even distribution of respondents by gender.
24
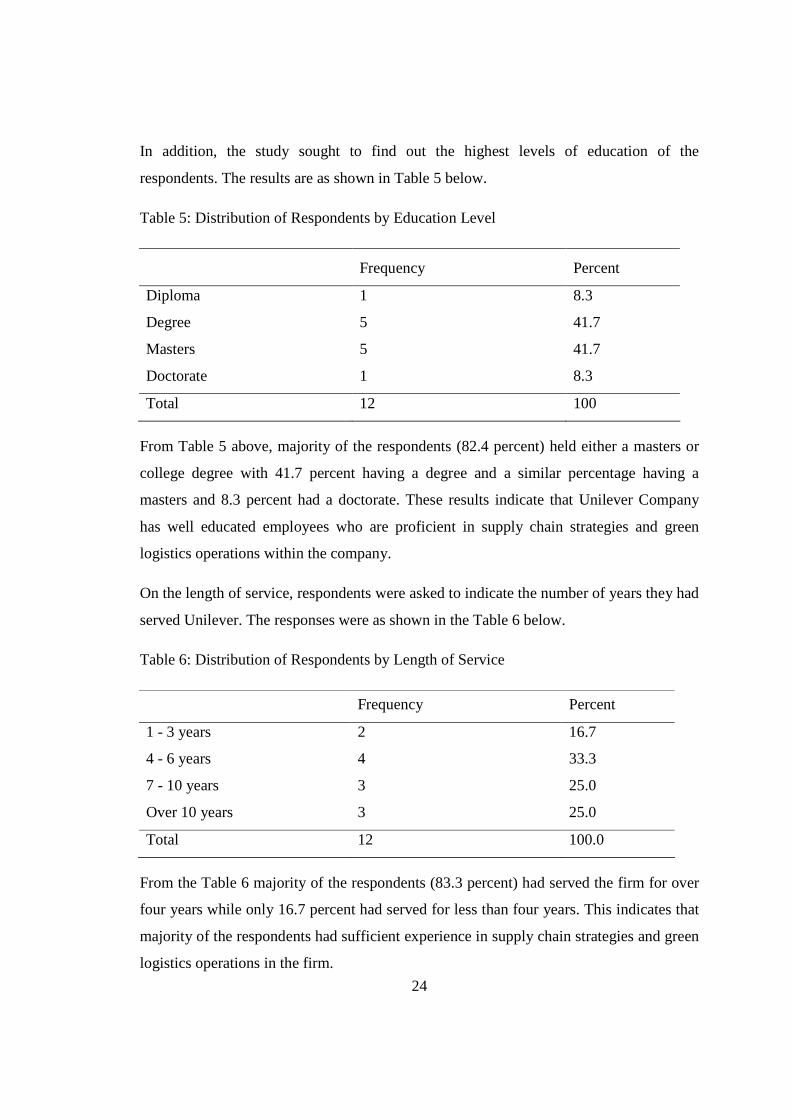
In addition, the study sought to find out the highest levels of education of the
respondents. The results are as shown in Table 5 below.
Table 5: Distribution of Respondents by Education Level
Frequency Percent
Diploma 1 8.3
Degree 5 41.7
Masters 5 41.7
Doctorate 1 8.3
Total 12 100
From Table 5 above, majority of the respondents (82.4 percent) held either a masters or
college degree with 41.7 percent having a degree and a similar percentage having a
masters and 8.3 percent had a doctorate. These results indicate that Unilever Company
has well educated employees who are proficient in supply chain strategies and green
logistics operations within the company.
On the length of service, respondents were asked to indicate the number of years they had
served Unilever. The responses were as shown in the Table 6 below.
Table 6: Distribution of Respondents by Length of Service
Frequency Percent
1 - 3 years 2 16.7
4 - 6 years 4 33.3
7 - 10 years 3 25.0
Over 10 years 3 25.0
Total 12 100.0
From the Table 6 majority of the respondents (83.3 percent) had served the firm for over
four years while only 16.7 percent had served for less than four years. This indicates that
majority of the respondents had sufficient experience in supply chain strategies and green
logistics operations in the firm.

25
4.3 Factors Influencing the Adoption of Supply Chain Strategies
The study sought to examine the factors that influence adoption of supply chain strategies
at Unilever. The respondents were asked to indicate their levels of agreement on a scale
of 1 to 5 with various statements relating to top management support, Information
Communication and Technology, communication and organizational culture. The means
and standard deviations of these ratings were then computed and the results were as
presented below. For purposes of interpretation, a mean rating between 1 and 2.5
represents disagree; between 2.51 and 3.5 represents, neither agree nor disagree; and
rating between 3.51 and 5.0 represents agree. The respondents were asked to rate their
levels of agreement with various questions regarding top management support. The mean
ratings were computed and are as shown in Table 7 below.
Table 7: Descriptive Statistics of Top Management Support
N Min Max Mean
Top management is committed to the strategic
direction
12 2.00 5.00 3.8333
Top managers demonstrate their willingness to give
energy and loyalty to the adoption of supply chain
strategies.
12 3.00 5.00 3.9167
Managers do not spare any effort to persuade the
employees of their ideas during adoption of supply
chain strategies.
12 2.00 5.00 4.1667
Top managers are committed to performing their roles
which leads to the lower ranks of employees getting
proper support and guidance
12 3.00 5.00 4.0833
From Table 7 above, all aspects of top management support were rated highly with
persuasiveness of top managers being rated highest (mean, 4.17) and commitment to
strategic direction being rated lowest (mean 3.83). This indicates that there is a high level
of top management involvement and support towards the adoption of green logistics
supply chain strategies. These findings support those of (Naylor, 1999) who found that
26
top management supports the overall strategy of the organization. However, it contradicts
a purpose of a strategy, enables the organization to keep sight of the strategy and able to
devise tactical steps to achieve these goals (Johnson, Coles and Whittinson, 2009).
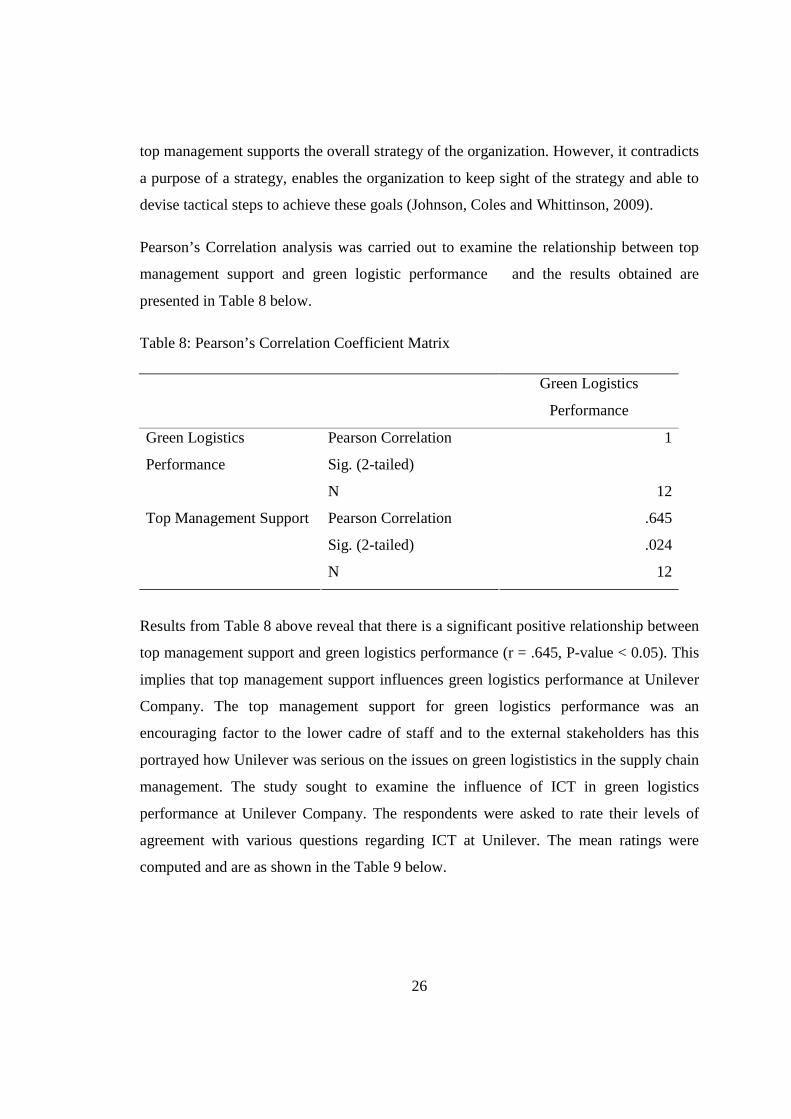
Pearson’s Correlation analysis was carried out to examine the relationship between top
management support and green logistic performance and the results obtained are
presented in Table 8 below.
Table 8: Pearson’s Correlation Coefficient Matrix
Green Logistics
Performance
Pearson Correlation 1
Sig. (2-tailed)
Green Logistics
Performance
N 12
Pearson Correlation .645
Sig. (2-tailed) .024
Top Management Support
N 12
Results from Table 8 above reveal that there is a significant positive relationship between
top management support and green logistics performance (r = .645, P-value < 0.05). This
implies that top management support influences green logistics performance at Unilever
Company. The top management support for green logistics performance was an
encouraging factor to the lower cadre of staff and to the external stakeholders has this
portrayed how Unilever was serious on the issues on green logististics in the supply chain
management. The study sought to examine the influence of ICT in green logistics
performance at Unilever Company. The respondents were asked to rate their levels of
agreement with various questions regarding ICT at Unilever. The mean ratings were
computed and are as shown in the Table 9 below.

27
Table 9: Descriptive Statistics of Information, Communication and Technology
N Min Max Mean
There is proper updating of organization's
information
12 2.00 5.00 3.4167
Organization ensures proper reachable technology
during adoption of supply chain strategies.
12 2.00 5.00 3.5833
There is efficient measuring and controlling of
quantity and quality of information
12 2.00 5.00 3.5000
Organization enhances technology of direct
relationship with customer
12 2.00 4.00 3.0000
ICT enables development of strategies 12 3.00 5.00 3.5913
From Table 9 above, all items were rated above average with the highest rated being ICT
enables development of strategies (mean 3.59) and the lowest rated being coordination of
technologies with customers (mean 3.0). This implies that while Unilever is doing well in
some respects of ICT, it needs to improve on other aspects including coordination of
technology with customers and efficiency controlling information quality. The ICT was
highest rated because of the staff being well equipped with skills and knowledge in the
application of the various systems. Regular training and refresher courses to equip the
staff with relevant skills was carried out periodically. The involvement of all staff in
participating in developing ICT application played a big role in making ICT being the
highest rated.
Pearson’s Correlation analysis was carried out to examine the relationship between
Information, Communication and Technology and green logistic performance and the
results obtained are presented in table 10 below. Results from Table 10 below reveal that
there is a significant positive relationship between ICT and green logistics performance (r
= .636, P-value < 0.05). This implies that Information, Communication and Technology
influences green logistics performance at Unilever Company.
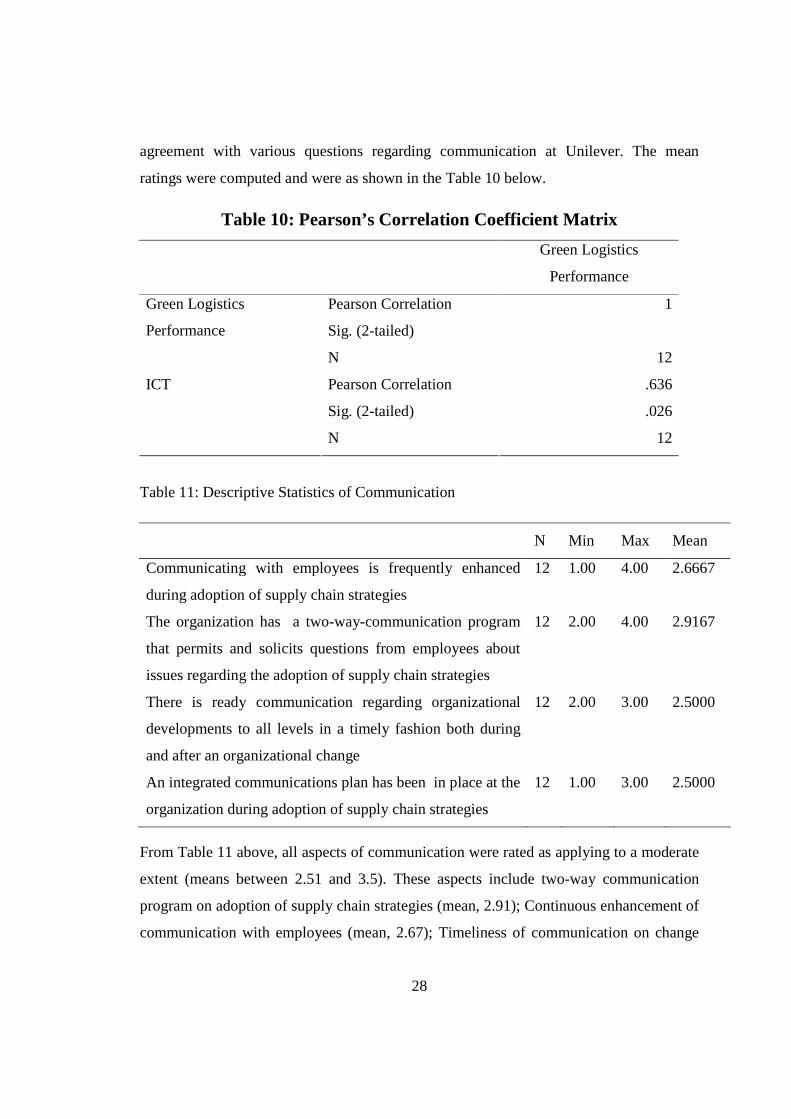
The study further examined the influence of communication on green logistics
performance at Unilever Company. The respondents were asked to rate their levels of
28
agreement with various questions regarding communication at Unilever. The mean
ratings were computed and were as shown in the Table 10 below.
Table 10: Pearson’s Correlation Coefficient Matrix
Green Logistics
Performance
Pearson Correlation 1
Sig. (2-tailed)
Green Logistics
Performance
N 12
Pearson Correlation .636
Sig. (2-tailed) .026
ICT
N 12
Table 11: Descriptive Statistics of Communication
N Min Max Mean
Communicating with employees is frequently enhanced
during adoption of supply chain strategies
12 1.00 4.00 2.6667
The organization has a two-way-communication program
that permits and solicits questions from employees about
issues regarding the adoption of supply chain strategies
12 2.00 4.00 2.9167
There is ready communication regarding organizational
developments to all levels in a timely fashion both during
and after an organizational change
12 2.00 3.00 2.5000
An integrated communications plan has been in place at the
organization during adoption of supply chain strategies
12 1.00 3.00 2.5000
From Table 11 above, all aspects of communication were rated as applying to a moderate
extent (means between 2.51 and 3.5). These aspects include two-way communication
program on adoption of supply chain strategies (mean, 2.91); Continuous enhancement of
communication with employees (mean, 2.67); Timeliness of communication on change

29
(mean, 2.50) and development of integrated communications plan (mean 2.50). This
indicates that a lot still need to be done regarding communication at Unilever.
Pearson’s Correlation analysis was carried out to examine the relationship between
communication and green logistic performance and the results obtained are presented in
Table 12 below.
Table 12: Pearson’s Correlation Coefficient Matrix
Green Logistics
Performance
Pearson Correlation 1
Sig. (2-tailed)
Green Logistics
Performance
N 12
Pearson Correlation -.476
Sig. (2-tailed) .118
Communication
N 12
Results from Table 12 above reveal that there is a negative relationship between
communication and green logistics performance (r = -.476, P-value > 0.05). This implies
that communication negatively influences green logistics performance at Unilever
Company. The green logistics issues were not well cascaded from the top to the bottom,
due to lack of well defined communication channels were not into place, leading to a
negative impact on communication to green logistics performance. The need to
implement the green logistics performance was there, but how the communication was to
be made effective had not been properly put in place.
The study sought to examine the influence of organizational culture on green logistics
performance at Unilever Company. The respondents were asked to rate their levels of
agreement with various questions regarding organizational culture. The mean ratings
were computed and are as shown in the Table 13 below.

30
Table 13: Descriptive statistics of Organizational Culture
N Min Max Mean
Customers and staff fully appreciate adoption of
supply chain strategies
12 2.00 4.00 3.0000
Leadership style of managers enhance adoption
of supply chain strategies
12 3.00 4.00 3.4167
Managers make clear decisions on adoption of
supply chain strategies
12 2.00 4.00 3.2500
There exist dominant values and beliefs, the
norms
12 2.00 4.00 3.3333
From Table 13 the various indicators of organizational culture were said to apply to a
moderate extent (mean between 2.51 and 3.50). The highest rated item was leadership of
managers enhances adoption of supply chain strategies (mean, 3.41); followed by
existence of dominant values, beliefs and norms (mean, 3.33) with the least rated being
appreciation by customers and staff on the adoption of supply chain strategies (mean,
3.0). These findings imply that the organizational culture at Unilever is supportive only to
a moderate extent towards the adoption of green supply chain strategies, thus the need for
improved aspects of organizational culture within the company. Organizational culture
were the values and behaviors that contributed to the unique social and psychological
environment of Unilever. Organizational culture included Unilever’s expectations,
experiences, philosophy, and values that hold it together, and expressed in its self-image,
inner workings, interactions with the outside world, and future expectations. It was based
on shared attitudes, beliefs, customs, and written and unwritten rules that had been
developed over time and are considered valid.
Pearson’s Correlation analysis was carried out to examine the relationship between
organizational culture and green logistic performance and the results obtained are
presented in Table 14 below.

31
Table 14: Pearson’s Correlation Coefficient Matrix
Green Logistics
Performance
Pearson Correlation 1
Sig. (2-tailed)
Green Logistics
Performance
N 12
Pearson Correlation -.155
Sig. (2-tailed) .631
Organizational Culture
N 12
Results from Table 14 above reveal that there is a negative relationship between
organizational culture and green logistics performance (r = -.155, P-value > 0.05). This
implies that organizational culture negatively influences green logistics performance at
Unilever Company.
4.4 Relationship Between Hypothesized Factors and Green Logistics Performance
The study further sought to assess the joint relationship between the hypothesized factors
and green logistics performance. The results are as displayed in the tables 15 and16
below.
Table 15: Model Summary for Regression Analysis Between the Four Hypothesized
Factors and Green Logistics Performance
Model R R Square
Adjusted
R Square
Std. Error of the
Estimate
1 .863 .745 .599 .36030
From the table above, the R-square .745 indicating that the four explanatory variables
account for 74.5 per cent of the variability in green logistics performance. This represents
a good fit, which depict a high significant influence of top management support, ICT,
communication and organizational culture on green logistics performance.

32
Table 16: Coefficient Estimates for Regression Analysis Between the Four Hypothesized
Factors and Green Logistics Performance
Unstandardized
Coefficients
Standardized
Coefficients
Model B
Std.
Error Beta t Sig.
(Constant) -2.597 2.122 -1.224 .261
Top Management Support .583 .235 .524 2.478 .042
ICT .816 .325 .540 2.511 .040
Communication -.315 .281 -.239 -1.119 .300
1
Organizational Culture .409 .277 .325 1.477 .183
Based on regression coefficients results the regression equation can be written as follows;
Y = -2.597+ .583 X1 + .816 X2 -.315X3 +.409 X4e
Regression analysis reveals the extent to which top management support, ICT,
communication and organizational culture predict green logistics performance. In
addition, ICT is a better predictor of green logistics performance (beta = 0.816) followed
by top management support (beta = 0.583) and organizational culture (beta = .409).
However, communication negatively influence green logistics performance (beta = -
.315). The above results suggest that if Unilever Company is to achieve desired green
logistics performance, it need to put more emphasis on ICT, management support and
organizational culture. The findings also shows that, only top management support ICT
were found to be statistically significant (p<.05). Communication and Organizational
Culture did not have a statistically significant relationship with Green Logistics
Performance.

33
The study also sought to establish the challenges that hindered implementation of green
supply chain strategies. The respondents were asked to rate on a scale of 1 – 5 the level to
which various challenges applied. The responses were as shown in the Table 17 below.
Table 17: Challenges Facing Implementation of Green Logistics Strategies
N Min Max Mean
Lack of Participation 12 1 3 1.83
Problems in educating stakeholders on
the importance of green logistics
12 1 4 2.58
Estimating hidden costs 12 1 5 3.08
Changing the first cost mindset. 12 3 4 3.33
Cost for green products 12 3 5 3.92
Misinformed advocacy groups 12 1 3 2.00
Lack of clear definitions 12 1 4 2.17
Insufficient and incomparable
environmental information.
12 3 4 3.33
Educating marketing and sales
professionals.
12 1 3 2.50
From Table 17 above, the highest rated challenges were cost of green products (mean
3.92); changing first cost mindset and insufficient environmental information (mean,
3.33); and challenges in estimating hidden costs (mean 3.08). On the other hand, lack of
participation, problems in educating stakeholders on the importance of green logistic,
misinformed advocacy groups, lack of clear definitions, educating marketing and sales
professionals rarely affects implementation of green logistics strategies at Unilever
Company.
4.5 Discussion of Findings
The study found that Unilever has a high level of top management involvement and
support towards the adoption of green logistics supply chain strategies. Further, it was
established that Unilever has a good ICT framework though it needs to improve on some
34
aspects including coordination of technology with customers and efficiency in
information quality. This is in agreement with Cognizant (2008) who states that
information technology can make the supply chain greener by optimizing the resources
required to support the business and enable more effective supply chain planning,
execution and collaboration, thereby reducing resource requirements. Communication
was rated average with timeliness of communication on change and development of
integrated communications plan being specific areas that need immediate attention. This
contrasts the findings by Charles, (2009) that communication is increasingly considered
an integral part of business knowhow and an essential business tool, as well as a strategic
tool of senior management of global companies (Hämäläinen & Maula, 2004). Further, it
was found that the organizational culture at Unilever is supportive only to a moderate
extent towards the adoption of green supply chain strategies. This coincides with studies
by Clemons & Hann, (1999) who found that successful organizations might have
established a corporate culture or a set of beliefs and behaviors that they use to explain a
firm’s success.
Top management support, ICT was found to have a statistically significant relationship
with green logistics performance. On the other hand, communication and organizational
culture did not significantly influence green logistics performance. The main challenges
facing the implementation of green logistics strategies included cost of green products;
changing first cost mindset and insufficient environmental information, estimating hidden
costs and problems in educating stakeholders on the importance of green logistics. This
corresponds with Angel del Brio and Junquera (2003) who summarized the factors
influencing adoption of environmental innovation such as, lack of small and medium
sized enterprises innovation with respect to environmental strategy ,limited financial
resources, the type of organizational structure, little influence of the strategic adaptation
competence against changes in the enterprises, managers’ lack of environmental training
and short-term orientation, staffs’ lack of environmental awareness and training, the
status of the environmental issues in the company, these enterprises’ lower abilities to
obtain innovations, and their lack of relationships with external stakeholders
35
CHAPTER FIVE
SUMMARY, CONCLUSION AND RECOMMENDATIONS
5.1 Introduction
This chapter presents summary of findings, conclusions and recommendations. It is
organized as follows: first summary of findings is presented as per research objectives,
then the conclusions drawn from those findings and finally both policy recommendations
and suggestions for further study.
5.2 Summary
The study sought to evaluate the relationship between supply chain strategies and green
logistics performance. It was guided by three specific objectives, namely: to determine
the motivating factors influencing the adoption of supply chain strategies on green
logistics at Unilever; to evaluate the relationship between the motivating factors and
green logistics performance at Unilever and to establish the challenges facing the
implementation of supply chain strategies on green logistics at Unilever.
The study found that Unilever has a high level of top management involvement and
support towards the adoption of green logistics supply chain strategies. Further, it was
established that Unilever has a good ICT framework though it needs to improve on some
aspects including coordination of technology with customers and efficiency in
information quality. Communication was rated average with timeliness of communication
on change and development of integrated communications plan being specific areas that
need immediate attention. Further, it was found that the organizational culture at Unilever
is supportive only to a moderate extent towards the adoption of green supply chain
strategies.
Top management support and ICT were found to have a statistically significant
relationship with green logistics performance. On the other hand, communication and
organizational culture did not significantly influence green logistics performance. The
main challenges facing the implementation of green logistics strategies included cost of
green products; changing first cost mindset and insufficient environmental information,

36
estimating hidden costs and problems in educating stakeholders on the importance of
green logistics.
5.3 Conclusion
From the above findings, the several conclusions were arrived at .The greatest enablers of
supply chain strategies related to green logistics at Unilever are top management support
and its ICT framework. Communication and organizational culture are also supportive to
a moderate extent. Unilever is faced with a number of challenges in its quest to
implement green logistics supply chain practices. These include changing first cost
mindset and insufficient environmental information, challenges in estimating hidden
costs and problems in educating stakeholders on the importance of green logistics.
5.4 Recommendations
For green supply chain implementation to be successful and sustainable; transparency
collaboration and integration of systems between trading partners in the supply chain is
required, senior management support is a must because not only will the senior
management play an important function in influencing the business’s attitude towards
green initiative, they can also dedicate resources in terms of time, personnel and finances
towards such initiatives, Green supply chain should closely align to customer needs
which will give the supply chain on the green product design that is required of them by
the customer.
Unilever should improve its communications by strengthening timeliness of
communications on change and building an integrated communications plan. The
company should re-engineer its corporate culture to be supportive of change.
Specifically, broaden its norms to include embracing change, greater sharing of
information and appreciation of innovations. The study focused only on Unilever, future
studies should expand the scope by looking at more companies. Additionally, future
studies should attempt to include quantitative measures of green logistics performance.
5.5 Limitation of the Study
The Study was limited in several aspects among them being the scope. The study was a
case of supply chain strategies and green logistics performance at Unilever. The type of
37
research problem investigated dictated the sample size and the number of the units to be
analyzed in the study, sample size was small, it was difficult to find significant
relationships from the data, as statistical tests normally require a larger sample size to
ensure a representative distribution of the population and to be considered representative
of groups of people to whom results were generalized or transferred. The research
focused only on Unilver-Kenya a manufacturing firm, could be more interesting to have a
view on what happens in the other manufacturing firms dealing with different products.
This could enable the researcher have a clear understanding on the effects of supply chain
strategies and green logistics performance on the various sectors in the manufacturing.
Though confidentiality was assured to all and that the study was purely for academic
purpose, some respondents did not feel free to give accurate information and non-
availability of data from key stakeholders, the organizations’ suppliers and customers to
have an end-to-end perspective on the supply chain strategies and green logistics
performance. Lastly, the questionnaire return rate was not 100 percent; higher return rate
could have better informed the study.
5.6 Suggestions for Further Study
From the Study, further research is necessary to accurately determine the extent to which
the supply chain strategies and green logistics performance affects the profitability of an
organization. The areas of potential research include the influence the consumer plays in
the adoption of supply chain strategies and green logistics performance in the different
sectors of organizations in an economy. There is need for further research to determine
whether organizations are adopting green logistics in their operations as a public relation
tool or a way of realizing the importance of the effects on its environment.

38
REFERENCES
Abernathy, F. H. (2000). Retailing and Supply Chains in the Information Age,
Technology in Society, Vol.22, pp.5-31. Awino, Z.B. (2011). "Strategic Management: An Empirical Investigation of Selected
Strategy Variables on Firms Performance: A Study of Supply Chain Management in Large Private Manufacturing Firms in Kenya. A publication of Prime Journal, BAM, Vol. 1 (1) 9-18.
Beamon, B.M. (1999). Designing the Green Supply Chain. Logistics Information
Management 12 (4), 332–342. Bized, F. (2010).Functional Areas of a Business [Online] Available at:
http//wwwbized.co.uk/educators/level2/:/lessons/functionall.htm. Accessed: 8 May 2013.
Bosch, T. & V. (2006). It is Not Easy Being Green. Harvard Business Review, 72(3), 46-
51. Bruce, T. (2004). Environmental Purchasing and Firm Performance: An Empirical
Investigation. Transportation Research Part E: Logistics and Transportation Review, 3(36), 219 - 228.
Chan, R. & Qi, I. (2003). Experiences with Integrated Chain Management in Dutch
Industry. Business Strategy and the Environment, 5(2), 38–47. Chan, K. (2000). Market Segmentation of Green Consumers in Hong Kong’, Journal of
International Consumer Marketing, 12(2): 7-24. Childerhouse, K. (2002). Essentials of Supply Chain Management. John Wiley & Sons,
Inc. Childerhouse, P. Aitken J. & Towil D.R (2002). Analysis and Design of Focused
Demand Chains, Journal of Operations Management 7(3), 21-34. Christopher, G. & Lee, J. (2004) .Supply Chain Management: More than New Name for
Logistics. International Journal of Logistics Management, 8(1), 1-14. Christopher, H. & Towil, K. (2000). Reuse and Recycling: Reverse Logistics
Opportunities. Council of Logistics Management, Oak Brook, IL. Clem, K. (2008). Management Accounting and Strategic Control, Implications for
Management Accounting Research. Bedrijfskunde, 70(1), 11-17.

39
Cognizant, P. (2008). Creating a Green Supply Chain Information Technology as an Enabler for a Green Supply Chain.
Engel, T. (2008). New Strategic Tools for Supply Chain Management. International
Journal of Physical Distribution & Logistics, 21(1), 23-33. Friend, G. (2009). Does the Competitive Environment Influence the Efficacy of
Investment in Environmental Management. Journal of Supply Chain Management 40(3), 30–39.
Ganesha, R. & Harrison, T. (1995). Environmental Supply Chain Management. Center
for Advanced Purchasing Studies, Tempe, AZ. Green, K. & Miles, I. (1997). A Clean Break From Corporate to Sustainable
Technological Regimes in Business and the Environment. Jeremy, F. & Shapiro, G. (2001). Modeling the Supply Chain. Duxbury Thomson
Learning. Jones, H. (1997). Material Management in Decentralized Supply Chains. Operations
Research, 41(5), 835-847. Klassen, R. & Johnson, P. F. (2005). The Green Supply Chain in Understanding Supply
Chains. Mason, J. (2000). Lean and Green: Industrial Engineering Methods are Natural
Stepping-Stones to Green Engineering. Journal of Industrial Engineer: IE, 9(41), 24-29.
Michael, B. Julian, A. Allan, W & Marzena, P. (2007). Progress in Industrial Ecology:
An International Journal, 1(4), 397 - 410. Minanham, J. (1997). Toyota Continues Quest for True JIT Excellence in Purchasing. Mugambi, R. K. (2010). An Exploration of Challenges Faced in Strategic Implementation
of Green Procurement in the Hotel Industry. A Case Study of Selected 5- Star Hotels in Nairobi Unpublished Thesis MBA, University of Nairobi.
Naylor, L. (1999). Managing Supply Chain Inventory: Pitfalls and Opportunities. Sloan
Management Review, 33(3), 65-73. Ohno, F. (1988). Green as the New Lean: How to Use Lean Practices as a Catalyst to
Greening. Journal of Cleaner Production, 1 - 8. Polit, P. (2001). Perception, Beliefs and Opinions on Green Logistics.

40
Rodriguez, I. (2001). The Regional Urban Solid Waste Management System: A Modeling Approach. European Journal of Operational Research, 1(70), 16-30.
Saghir, M. (2002). Packaging Logistics Evaluation in the Swedish Retail Supply Chain
Management. Smith, H. (2003). Research Frameworks in Logistics: Three Models, Seven Dinners and a
Survey. International Journal of Physical Distribution and Logistics Management, 25(10), 60-77.
Sunil, C. & Peter, M. (2002). Supply Chain Management: Strategy, Planning, and
Operation, Prentice Hall of India. Stank, T. & Crum, M. (1997). Trust and Knowledge Sharing in Green Supply Chains.
International Journal of Supply Chain Management, 4(13), 283 - 295. Tanguchi, R. & Johnson P. F. (1999). Objectives of Green Logistics Performance. Van der Zee, L. (2008). Supply Chain Flexibility: An Empirical Study. The Journal of
Supply Chain Management 35(3), 16–24. Wasike, I. B. (2010). The Effects of Integrated Supply Chain on the Performance of
Nairobi Bottlers. Unpublished MBA Project, University of Nairobi. Womack, R. Legg, L. & Novak, K. (1990). Reuse and Recycling: Reverse Logistics
Opportunities. Council of Logistics Management, Oak Brook, IL. Wu, H. & Dunn, K. (1995). Beyond Greening: Strategies for a Sustainable World.
Harvard Business Review 66 – 77. Zhu, Q. & Sarkis, J. (2004). Relationships Between Operational Practices and
Performance Among Early Adopters of Green Supply Chain Management Practices in Chinese Manufacturing Enterprises. Journal of Operations Management 22(3), 265-289.
Zsonai, K. (2001). Green Perspectives and Practices: "A Comparative Logistics" Study.
Supply Chain Management: An International Journal 8(2), 122-131.

41
APPENDICES
Appendix 1: Research Questionnaire
Section A: Bio Data Name of the Organization/Division/Department
………………………………………………………………………………………..
1. Name of respondent (Optional) ……………………………………………
2. Gender, male { } Female { }
3. Position held in the organization ……………………………………………..
4. How long have you worked with Unilever?
a) 1-2 years { }
b) 2-4 years { }
c) 5 – 10 years { }
d) Over 10 years { }
5. What is your academic level?
a) College { }
b) Degree { }
c) Masters { }
d) PhD { }
Section B: Factors Influencing the Adoption of Supply Chain Strategies on Green
Logistics Performance.
6. To what extent do you agree with the following statements on a scale of 1 to
5? (5 being strongly agree) Kindly tick as appropriate.

42
Top management 1 2 3 4 5
The top management’s commitment to the strategic direction itself is the most important factor.
The top managers must demonstrate their willingness to give energy and loyalty to the adoption of supply chain strategies.
The managers must not spare any effort to persuade the employees of their ideas during adoption of supply chain strategies.
Lack of manager’s commitment to performing their roles leads to the lower ranks of employees missing support and guidance
ICT There is proper updating of organization's
Information
The organization ensures proper reachable technology
during adoption of supply chain strategies.
There is efficient measuring & controlling of quantity
& quality of information
The organization enhances technology of direct
relationship with customer
ICT enables development of strategies
Communication
Communicating with employees is frequently enhanced
during adoption of supply chain strategies
The organization has a two-way-communication
program that permits and solicits questions from
employees about issues regarding the adoption of
supply chain strategies
It is essential both during and after an organizational
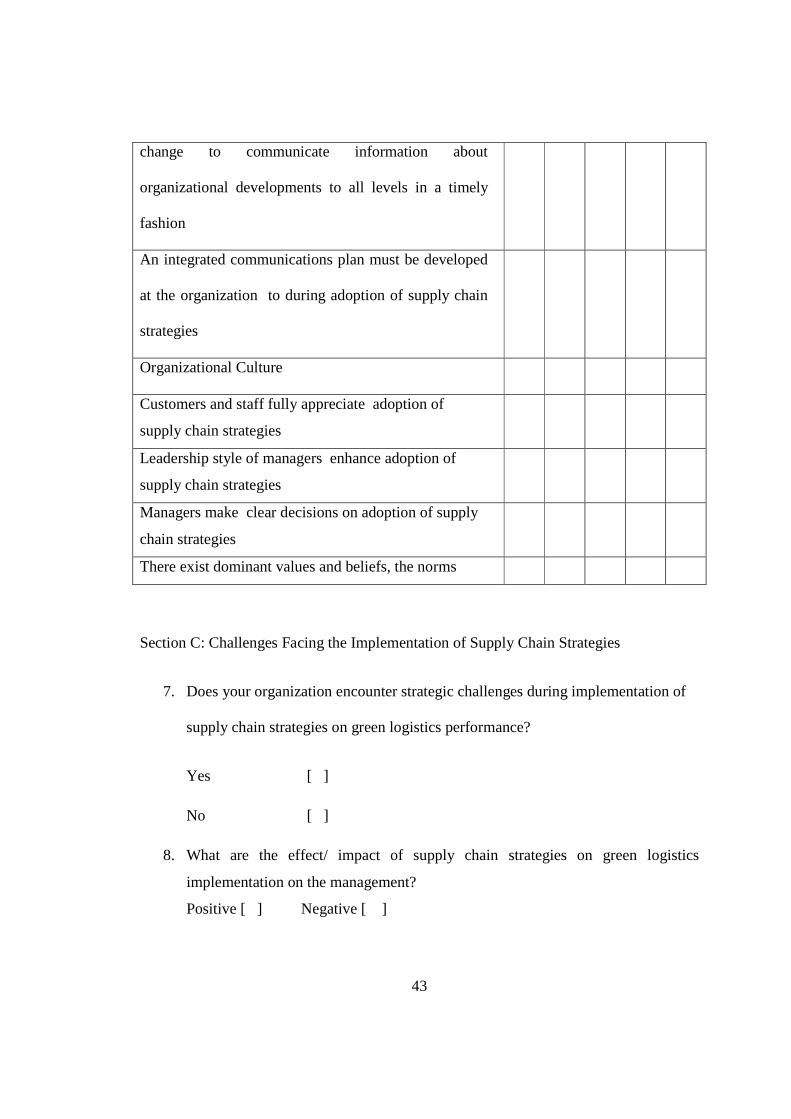
43
change to communicate information about
organizational developments to all levels in a timely
fashion
An integrated communications plan must be developed
at the organization to during adoption of supply chain
strategies
Organizational Culture
Customers and staff fully appreciate adoption of
supply chain strategies
Leadership style of managers enhance adoption of
supply chain strategies
Managers make clear decisions on adoption of supply
chain strategies
There exist dominant values and beliefs, the norms
Section C: Challenges Facing the Implementation of Supply Chain Strategies
7. Does your organization encounter strategic challenges during implementation of
supply chain strategies on green logistics performance?
Yes [ ]
No [ ]
8. What are the effect/ impact of supply chain strategies on green logistics
implementation on the management?
Positive [ ] Negative [ ]

44
a) To what extent has the potential to trade been caused by the following
challenges? Rate them using the likert scale of 1-5 with Very low =1, Low =2,
Moderate =3, High= 4, Very high =5.
Challenges 1 2 3 4 5
The challenge of availability
The challenge of substitute product
b) Cost management challenges has been influences by the following; rate them
using the scale of 1-5 with Very low =1, Low =2, Moderate =3, High =4, Very
high =5.
Challenges 1 2 3 4 5
Estimating hidden costs
Changing the first cost mindset.
Cost for green products
c) The challenge of green logistics integration into management systems has
been influences by the following. Rate them using the scale of 1-5 with Very
low =1, Low =2, Moderate =3, High =4, Very high =5.
Challenges 1 2 3 4 5
The challenge of lack of
Participation

45
The challenge in educating the
importance of green logistics
d) The challenge of lack of information has been influences by the following
Rate them using the scale of 1-5 with Very low =1, Low =2, Moderate =3,
High =4, Very high =5.
Challenges 1 2 3 4 5
Misinformed advocacy groups
Lack of clear definitions
Insufficient and incomparable environmental information.
Educating marketing and sales
professionals.