The causes and repercussions The Causes and Repercussions 11/22/11.

Supply Chain Services SectorOverview, Analysis, and Trends in the Supply Chain Services Industry
-Logistics Overview-Specialty Distribution Overview-Selected William Blair Supply Chain Transactions-M&A Activity and Notable Industry Transactions-Public Comparable Companies
Jeff Burtelow+1 312 364 [email protected]
Jason Sunderson+1 312 364 [email protected]
May 2015Industry Update

William Blair & Company
Supply Chain Services Investment Banking Supply Chain Services Update
Table of Contents
Supply Chain Services Update .................................................................................................................................................................................................................. 1 William Blair Spotlight – Recent Logistics & Specialty Distribution Transactions ......................................................................................................... 6 Selected Supply Chain Transaction Execution .................................................................................................................................................................................. 7 Supply Chain Services Equity Research Coverage .......................................................................................................................................................................... 8 Supply Chain Services Contacts ............................................................................................................................................................................................................... 9 Logistics Sector Overview ....................................................................................................................................................................................................................... 10 Selected M&A Activity – Logistics ........................................................................................................................................................................................... 13 Recent Notable Logistics Transactions ................................................................................................................................................................................. 14 Public Comparables – Annual EBITDA Multiples ............................................................................................................................................................ 17 Public Comparables by Sector .................................................................................................................................................................................................. 19 Logistics Industry Insights ......................................................................................................................................................................................................... 25 Specialty Distribution Sector Overview ............................................................................................................................................................................................ 28 Selected M&A Activity – Specialty Distribution ............................................................................................................................................................... 31 Recent Notable Specialty Distribution Transactions ..................................................................................................................................................... 32 Public Comparables – Annual EBITDA Multiples ............................................................................................................................................................ 34 Public Comparables by Sector .................................................................................................................................................................................................. 36 Specialty Distribution Industry Insights .............................................................................................................................................................................. 43 Key Economic Data ..................................................................................................................................................................................................................................... 45 Notes .................................................................................................................................................................................................................................................................. 51 Disclosures ...................................................................................................................................................................................................................................................... 52

William Blair & Company
Supply Chain Services Investment Banking Supply Chain Services Update 1
Supply Chain Services Update
Macro Tailwinds and Compelling Dynamics Drive Strong Supply Chain Valuations As customers increasingly demand next-day delivery, one-stop-shopping, and omnichannel experiences, acquirers are aggressively pursuing logistics and specialty distribution providers that can address the needs of the new supply chain landscape. Driven by strong growth dynamics and macroeconomic tailwinds, 2014 saw strong M&A and capital-raising activity across supply chain services. In addition to solid economic expansion in the United States, increasing onshore manufacturing momentum, and growing customer demand for rapid fulfillment and delivery, the growth outlook for specialty distribution and logistics providers is further bolstered by increased outsourcing, heightened demand for greater supply chain visibility, and the on-going globalization of supply chains.
While specialty distribution and logistics are typically thought of as two distinct industry segments, in an era of increasing supply chain integration and globalization, traditional lines have been blurred and a number of companies are providing more integrated service offerings spanning both segments to their customers. In addition, similar macroeconomic and industry-specific dynamics impact both specialty distribution and logistics, and so, as a result, are relevant to highlight in a combined report.
These forces led to robust M&A activity and strong valuations in 2014 and YTD 2015 as strategic acquirers and financial sponsors aggressively sought exposure to higher-growth business models, attractive end markets and broader value-added services across the supply chain ecosystem. In both segments, recurring themes of diversification and integrated service offerings are driving acquisition activity, whether across end markets, geographies, or distinct components of the supply chain.
In 2014, approximately 550 supply chain service M&A transactions were completed, representing more than $125 billion in aggregate value. Transaction volume increased by 6.8%, as the logistics sector exceeded its long-term average M&A activity level for the first time since 2011. Beyond the macroeconomic tailwinds and higher-level trends that are fueling growth in supply chain services as a whole, there are several more-nuanced, end-market-specific dynamics that are driving M&A activity in specialty distribution and logistics. In this report, we examine the themes that are shaping the deal-making landscape in these sectors.
Logistics Third-party logistics providers (3PLs) play a critical and growing role in the global supply chain. Although less than 10% of logistics services are outsourced today, the 3PL market already exceeds $500 billion globally. Given the compelling value proposition of outsourcing relative to maintaining an in-house logistics function, and the increasing pace at which technology advances are transforming the supply chain, we expect the U.S. 3PL industry to expand two to three times faster than global GDP growth over the next 10 years.
Global 3PL Market Growth U.S. 3PL 1996-2014
($ in billions) ($ in billions)
Source: Armstrong & Associates, Inc. Source: Armstrong & Associates, Inc.
$191
$134
$160
$40
$236
$142
$156
$44
$256
$146
$158
$45
Asia Pacific North America& U.S.
Europe South America
2011 2012 2013
16% 5% (1%) 7%
U.S.
$160 $171 $176
$30.
8
$34.
2
$39.
6
$45.
3
$56.
6
$65.
3
$71.
1
$76.
9
$89.
4
$103
.7
$113
.6
$119
.0
$127
.0
$107
.1
$127
.3
$133
.8
$141
.8
$146
.4
$154
.0
2-3x GDP Growth
96'-14' CAGR: 9.4%11’-13’ CAGR:

William Blair & Company
Supply Chain Services Investment Banking 2 Supply Chain Services Update
In this broader growth story, there are several distinct industry trends that are driving business performance and M&A activity in the logistics market:
• Adding multi-modal solutions, end markets, and geographies: A primary driver of strategic acquisitions in logistics over the past year has been the desire for companies to generate growth by expanding their multi-modal solutions offering or increasing exposure to attractive end markets and geographies. Logistics providers are looking to win a larger share of their customers’ wallets by positioning themselves as one-stop-shops, offering logistics capabilities across the spectrum of transportation modes (e.g., over the road freight brokerage, intermodal, freight forwarding, value-added warehousing and distribution, reverse logistics, etc.) and serving customers in multiple geographies and end markets. The need to expand its intermodal capabilities was the driving force behind XPO’s $335 million acquisition of Pacer in early 2014. The benefits of offering a broader portfolio of logistics services apply not only to the form of transportation but also to the direction of product movement. As e-commerce continues to reshape the retail experience (more on this later), reverse logistics is becoming an increasingly important factor in the logistics equation. FedEx’s December 2014 acquisition of Genco, which specializes in handling product returns, was designed to help FedEx better serve the needs of e-commerce players that experience high return rates. Strategic acquirers have also been very aggressive in obtaining growth in attractive end markets and regions. France-based Norbert Dentressangle acquired Des Moines, Iowa-based Jacobson Companies in July 2014. The $750 million transaction gave Norbert a strong foothold in a U.S. market, which has more attractive growth prospects than Europe. C.H. Robinson’s acquisition of Freightquote.com in December 2014 for $365 million greatly enhanced C.H. Robinson’s ability to serve small and midsize businesses, as well as providing a more robust online platform and improving service delivery.
• Same-day delivery, omnichannel experience, and other e-commerce repercussions: Not to put too fine a point on it, but any aspect of the supply chain that touches e-commerce is likely to have a compelling growth dynamic. As e-commerce continues to create new opportunities and challenges in supply chain, strategic acquirers are pursuing companies that can facilitate the shift toward localized fulfillment, enhanced online consumer experiences, and same-day delivery facilitated by multi-modal logistics coordination. Amazon’s aggressive push toward same-day delivery and regional fulfillment is forcing eBay, other online retailers, and smaller, traditional retailers to keep up. This push, in turn, has created more demand for outsourced logistics providers that can help retailers meet consumers’ new expectations for faster delivery and make the product-return experience painless. To compete more effectively with online competitors, many traditional retailers have begun embracing omnichannel strategies, where physical stores serve as hyper-local warehouses that can stock product and deliver directly to consumers. This omnichannel trend places increased importance on technology which allows for heightened visibility, integration, and better inventory management across the supply chain.
M&A SPOTLIGHT: SATELLITE LOGISTICS
Reverse-logistics capabilities and access to North American beer market drive outstanding outcome Several of the primary forces that are shaping the logistics deal-making environment contributed to the premium outcome William Blair & Company helped Satellite Logistics Group achieve in its sale to JF Hillebrand.
• Reverse logistics: Aggregating demand across more than 140 beer brands, Satellite increased the speed and efficiency of delivering empty kegs to its brewer customers.
• Attractive end market: Satellite’s broad client base of beer brands served as the perfect complement to Hillebrand’s strength in wine and spirits.
• Access to North America: Satellite’s strong U.S. presence gave Germany-based Hillebrand enhanced scale and penetration in North America.
SUPPLY CHAIN VALUATION DRIVERS What buyers look for when deciding what a logistics or specialty distribution company is worth With supply chain transactions, there is no single factor that consistently emerges as the primary driver of the target company’s valuation. Instead, bidders’ decisions are based on a confluence of the following factors:
• Size and growth dynamics of addressable end markets
• Role in the supply chain • Value proposition for customers and suppliers • Strength, consistency, and diversity of customer and
supplier bases • Breadth of value-added services • Strength and depth of management team • Organic and acquisition growth opportunities

William Blair & Company
Supply Chain Services Investment Banking Supply Chain Services Update 3
• Addressing the talent gap: The decentralization of distribution networks and increased “on-shoring” of U.S. manufacturing have created a shortage of skilled and semi-skilled workers in supply chain services. Manufacturers and distributors can no longer rely on a single central U.S. location to service the entire country, which results in three and sometimes four day deliveries, resulting in new facilities and new jobs. This shortage of truck drivers, forklift operators, warehouse employees, and other skilled and semi-skilled transportation and logistics workers has been particularly acute in the South and other regions where companies are rapidly adding new manufacturing and distribution facilities. EmployBridge’s ability to help transportation and logistics companies address this talent gap is what made it such an attractive acquisition target for Select Staffing. William Blair advised EmployBridge on the $410 million transaction, which closed in February 2015. Human capital in the white collar ranks has been an important driver of logistics M&A as well. Given the relationship-based nature of sales and the complex coordination required to manage a diversified supply chain, logistics companies have traditionally found it difficult to expand their sales forces and talent pool organically to new regions. As a result, 3PL providers such as Echo Global Logistics often use acquisitions as a tool for expanding the breadth and depth of their sales force and services and client bases.
• Impact of Lower Oil Prices: Another trend we are watching closely is the impact of lower oil prices on the logistics industry. As the U.S. energy industry rapidly expanded over the past decade, an entire specialized ecosystem and infrastructure had to develop alongside North America’s shale basins. Whether trucking in heavy equipment for drilling or investing in rail access for movement of finished products, energy companies’ demand for outsourced transportation and logistics services has skyrocketed.
We have seen the industry’s ability to rapidly respond to the growing demands of the U.S. energy boom. Now it will be interesting to see how quickly these specialized providers adapt to lower oil prices and potentially depressed energy related logistics activity. Whether we see widespread consolidation and contraction in the space depends largely on whether today’s oil prices represent a temporary dip or a new long-term reality. Regardless, given current production levels and pent up demand for infrastructure resulting from years of investment in wells which outpaced the development of adequate oil and natural gas transport and pipeline services, the energy industry will continue to be an important driver of logistics activity.
M&A SPOTLIGHT: EMPLOYBRIDGE
Differentiated and unique value-added flexible workforce services merger delivers favorable outcome for supply chain end markets. William Blair’s advised on EmployBridge’s merger with Select Staffing, which brought together the two largest U.S. human capital management companies that provide skilled light industrial personnel to specialized supply chain, logistics and transportation verticals:.
• Specialized services and branding: unique brands tailored to each of the vertical specialties to address industry-specific skill sets, ensuring delivery of the highest-qualified candidates for specific positions
• Favorable sector tailwinds: resurgence of U.S. manufacturing, regionalized fulfillment, and truck driver scarcity contributes significant momentum to the company’s core supply chain brands
• Efficient delivery model: ability to utilize state-of-the-art IT/CRM tools and centralization of non-value add functions to drive operating leverage and margin expansion

William Blair & Company
Supply Chain Services Investment Banking 4 Supply Chain Services Update
Specialty Distribution
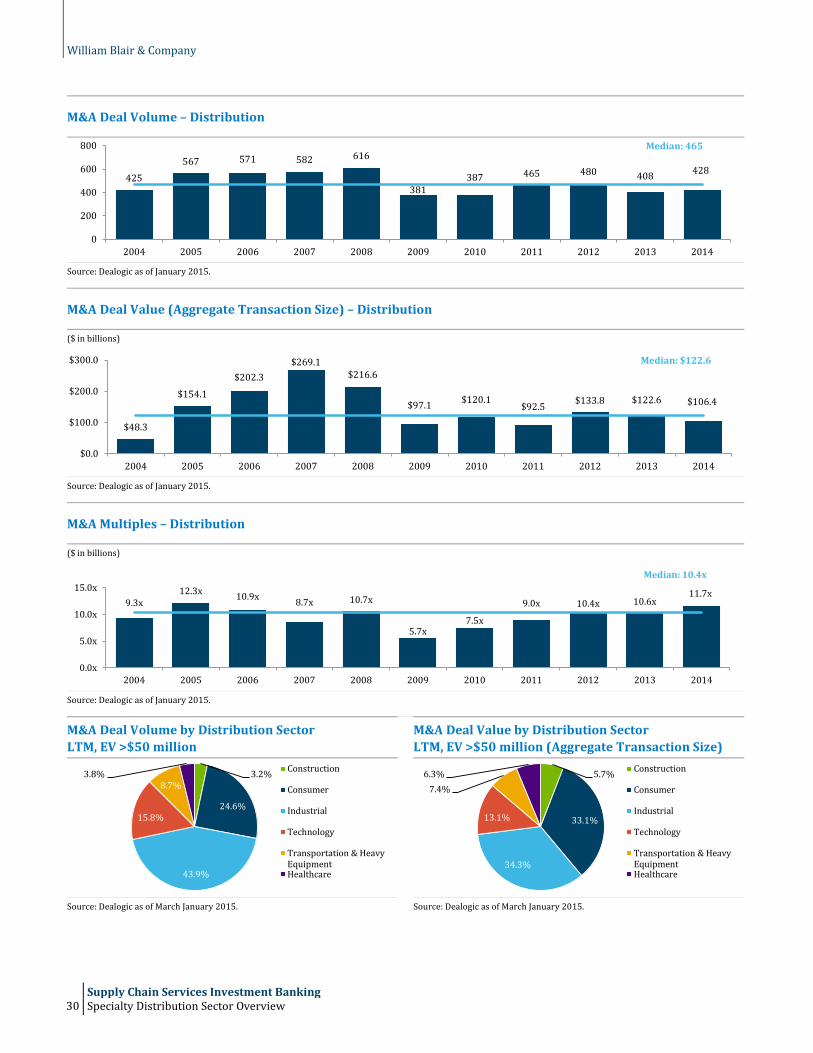
Many of the economic trends that are fueling growth and M&A activity in the logistics industry are playing out on the distribution side of the supply chain as well. This growth dynamic and the attractive financial attributes of distribution businesses (e.g., asset-light, high free cash flow, and high return on invested capital) are being reflected in the valuations these companies receive through competitive sales processes. Three or four years ago, high-quality distribution companies would typically achieve multiples of 8x to 9x EBITDA. Today, these companies are regularly receiving valuations of 10x or more as evidenced by the following table.
M&A Multiples – Specialty Distribution
($ in billions)
Source: Dealogic.
Within this attractive environment for specialty distribution companies, business performance and acquisition strategies are often driven by several trends:
• Expansion of product portfolios and geographic reach: As a whole, the specialty distribution industry enters 2015 with strong momentum and macroeconomic tailwinds. Many specific end markets, however, are seeing only modest secular growth, which is causing players in these sectors to seek to acquire growth by expanding their product portfolios and geographic reach. This dynamic was certainly at work in one of our distribution transactions that we completed in 2013 – KODA Distribution Group’s (KDG) acquisition of herbicide and insecticide distributor Specialty Professional Products (SPP). SPP provided KDG with a leading platform in new end markets, including mosquito control, forestry, range and pasture, and specialty agriculture, and helped to diversify KDG’s overall end-market mix.
• Mitigating the “Amazon threat” through multichannel sales and service: The need to develop broader digital strategies represents both a threat and an opportunity for specialty distributors. Although AmazonSupply.com’s encroachment of the traditional MRO market has not progressed as rapidly as many initially predicted, customers are demanding enhanced multi-channel sales and service, including online functionality, rapid fulfillment capabilities, and 24/7 customer service. The new multichannel environment has helped to expand customers’ perception of value beyond just price. Technical support, value-added services, dedicated sales efforts, and IT security are more important than ever to customers. In the Excelligence and Flinn sale processes, bidders closely evaluated Excelligence’s and Flinn’s ability to combat the e-commerce threat by maintaining direct customer relationships and providing a compelling suite of value-added services such as technical support, kitting, multimedia reference materials, as well as maintaining proprietary products and brands not available through other channels.
• Strengthening customer retention through deeper and broader product categories: As customers look to streamline their operations and coordinate with fewer vendors, the ability to be a “one-stop-shop” is an increasingly important element of customer retention for specialty distributors. As a result, acquirers are seeking “best-of-breed” companies that can dominate specific niche markets through brand awareness and reputation, expansive product portfolios, and deep selection. In our recent completed specialty distribution transactions, buyers have valued consistent product level performance over time and have paid close attention to the depth and sustainability of the target’s SKUs. Excelligence’s and Flinn’s ability to position themselves as the go-to, one-stop distributor in their respective education end markets with strong awareness and brand recognition built over decades, and to demonstrate the power of their proprietary products and categories, were critical factors in the premium valuations that these companies received.
9.3x12.3x 10.9x 8.7x 10.7x
5.7x7.5x
9.0x 10.4x 10.6x 11.7x
0.0x
5.0x
10.0x
15.0x
2004 2005 2006 2007 2008 2009 2010 2011 2012 2013 2014
Median: 10.4x
William Blair & Company
Supply Chain Services Investment Banking Supply Chain Services Update 5
Outlook for 2015: Strong Tailwinds and Continued Blurring of Lines
We expect the robust M&A and capital-raising activity in supply chain services to continue in 2015. Strategic acquirers, financial sponsors, and investors will continue to aggressively pursue high-quality companies that are well positioned relative to the strong macroeconomic tailwinds and industry-specific dynamics previously described.
We also expect to see a continued blurring of the lines that have traditionally defined supply chain services. Whether this takes the form of Amazon playing the role of both retailer and logistics provider, traditional forward logistics companies expanding their reverse logistics capabilities, or retail storefronts acting more and more like regionalized distribution centers, the traditional lines of demarcation and separation in the space are becoming less relevant every day.
In this dynamic environment, we are committed to helping companies evaluate their strategic opportunities for growth and liquidity. If you have any questions about what these trends mean for your company, please do not hesitate to contact us.
Jeff Burtelow Jason Sunderson
Managing Director Director Head of Supply Chain Services Supply Chain Services [email protected] [email protected] +1 312 364 8651 +1 312 364 8752

William Blair & Company
Supply Chain Services Investment Banking 6 William Blair Spotlight – Recent Logistics & Specialty Distribution Transactions
William Blair Spotlight – Recent Logistics & Specialty Distribution Transactions
2015
• William Blair represented Employbridge, a portfolio company of Morgan Stanley Private Equity and Constitution Capital Partners, in connection with its sale to Select Staffing, Inc.
• Employbridge provides specific staffing solutions, human resource services, and workforce management strategies to warehousing/logistics, transportation, and manufacturing markets
• Select Staffing, formally known as Eastern Staffing, offers workforce management services, including recruiting, screening, payroll and time attendance management, on-site supervision, and specialty staffing solutions
• William Blair represented Excelligence Learning Corporation, a portfolio company of Sterling Investment Partners, in connection with its sale to Brentwood Associates
• Excelligence is a leading value-added, multi-channel distributor of educational products to the large and growing early childhood and elementary markets
• Brentwood Associates is a private equity investment firm with over $1.2 billion assets under management who invests in leading middle-market, growth-oriented consumer businesses
• William Blair represented Encore Repair Services in connection with its senior secured notes debt investment by Falcon Investment Advisors
• Encore Repair Services is a leading provider of global reverse logistics and aftermarket supply chain solutions for handheld electronic devices such as smartphones, tablets and MP3 players. Encore has operations across the globe including in the U.S., Vietnam, China, Hong Kong and the Middle East
• Falcon Investment Advisors is a private equity firm that invests subordinated debt and equity capital in leading middle market companies
• William Blair represented Flinn Scientific in connection with its sale to Windjammer Capital Investors • Flinn Scientific is the industry-leading specialty distributor and provider of unique value-added products,
services, and resources to the K-12 and post-secondary educational science supplies market • Windjammer Capital Investors invests in leading middle-market companies and supports management in
their initiatives to grow earnings and build shareholder value. The firm currently has approximately $2 billion assets under management
• William Blair represented Satellite Logistics Group, a portfolio company of Morgenthaler Private Equity, in connection with its sale to JF Hillebrand
• Satellite Logistics Group is a category-creating provider of non-asset-based logistics and supply chain management services to the North American beer and beverage market
• JH Hillebrand is a leading global provider of logistics management solutions to the beer and beverage industry
• William Blair represented Specialty Professional Products, a portfolio company of Calvert Street Capital Partners, in connection with its sale to KODA Distribution Group, a portfolio company of Audax Group
• Specialty Professional Products is a value-added distributor of highly specialized herbicide and insecticide products used in the forestry, industrial vegetation management, range and pasture, aquatics, and mosquito control markets
• KODA Distribution Group is a leader in specialty chemicals distribution, serving customers in the coatings, adhesives, and sealants industries, as well as construction, home care, and industrial markets
• William Blair represented EFC International in connection with its sale to Quad-C Management • EFC is an industry-leading, value-added specialty distributor providing specialty fastening, clamping and
electrical components primarily to the industrial OEM marketplace • Quad-C Management is a private investment firm who partners with owners and entrepreneurs of well-
established, middle-market businesses for growth and equity opportunities for management teams
has been acquired by
Feb 2015
has been acquired by
2014
BREN T WOOD ASSOCI ATESP R I V A T E E Q U I T Y I N V E S T M E N T S
Senior Secured Notes
2014
has been acquired by
2014
has been acquired by
2013
has been acquired by
2013
has been acquired by
2013

William Blair & Company
Supply Chain Services Investment Banking Selected Supply Chain Transaction Execution 7
Selected Supply Chain Transaction Execution
3PL Provider HR Services to Supply Chain Industry
Medical Products Distributor
Educational Products Distributor
Reverse Logistics and After Market Services
Environmental Services and Logistics
IT Supply Chain Services
Science Educational Supplies Distributor
Wheel & Tire Distributor
Optical Products Distributor
Industrial Distributor
Beer / Beverage Logistics Services
Pharma / Med Device Logistics
Mobile Refueling Services
Specialty Chemicals Distributor
Container / Cargo Terminal Services
Aerospace Parts Distributor
Specialty Fastener Distributor
PVF Distributor
Specialty Roofing Distributor
Retail Logistics Management
T&L Industry Enterprise Software
Optical Products Distributor
Marine Vessel Operator
Cold Chain Logistics
Specialty Surgical Products Distributor
IT Services / Products Distributor
Industrial Distributor
Landscape Equipment Distributor
Wire & Cable Distributor
Follow-on Offering &Initial Public Offering
Apr 2015 Oct 2009
has been acquired by
Feb 2015
has been acquired by
Jan 2015STIRLING SQUARE
CAPITAL PARTNERS
has been acquired by
Dec 2014BREN T WOOD ASSOCI ATES
P R I V A T E E Q U I T Y I N V E S T M E N T S
Senior Secured Notes
Dec 2014
Follow-on Offerings &Initial Public Offering
December 2014
Sale of minority equity stake & debt recapitalization
Nov 2014
has been acquired by
October 2014
has been acquired by
Jun 2014
has been acquired by
May 2014
Follow-on Offering &Initial Public Offering
May 2014 & June 2013
has been acquired by
November 2013
Recapitalization
November 2013
has been acquired by
September 2013
has been acquired by
September 2013
has been acquired by
June 2013
Follow-on Offering &Initial Public Offering
May 2013
has been acquired by
April 2013
Follow-on Offerings &Initial Public Offering
March 2013
has been acquired by
February 2013
has been acquired by
December 2012
has been acquired by
October 2012
has been acquired by
October 2012
has been acquired by
May 2011
a subsidiary of
has been acquired by
August 2010
has been acquired by
January 2010
has been acquired by
October 2007
has acquired
May 2005
has been acquired by
MAY 2007
Follow-on Offering &Initial Public Offering
Mar 2007 & Jun 2006

William Blair & Company
Supply Chain Services Investment Banking 8 Supply Chain Services Equity Research Coverage
Supply Chain Services Equity Research Coverage
Transportation and Logistics
Nate Brochmann, CFA +1 312 364 5385 [email protected]
Specialty Distribution
Ryan Merkel, CFA +1 312 364 8603 [email protected]
To receive research materials on any of the companies or sectors above please contact Lenora Harris ([email protected]).
SM
William Blair & Company
Supply Chain Services Investment Banking Supply Chain Services Contacts 9
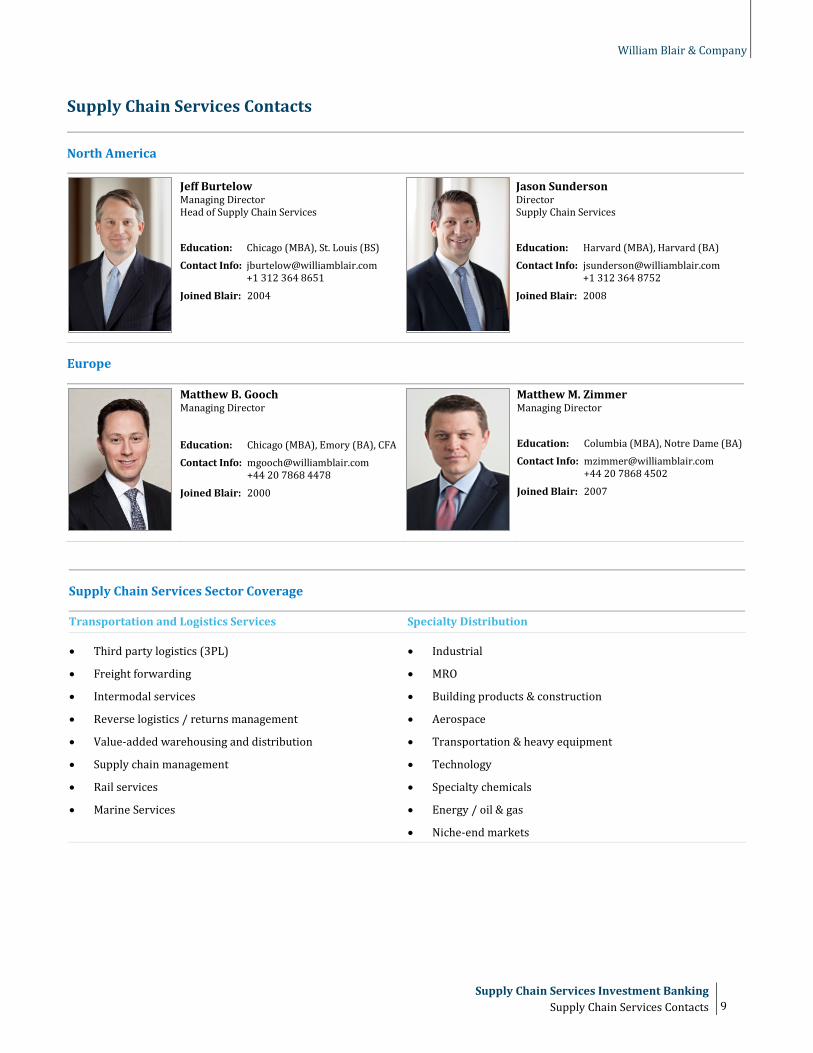
Supply Chain Services Contacts
North America
Jeff Burtelow Managing Director Head of Supply Chain Services
Education: Chicago (MBA), St. Louis (BS) Contact Info: [email protected]
+1 312 364 8651
Joined Blair: 2004
Jason Sunderson Director Supply Chain Services
Education: Harvard (MBA), Harvard (BA) Contact Info: [email protected] +1 312 364 8752
Joined Blair: 2008
Europe
Matthew B. Gooch Managing Director
Education: Chicago (MBA), Emory (BA), CFA Contact Info: [email protected] +44 20 7868 4478
Joined Blair: 2000
Matthew M. Zimmer Managing Director
Education: Columbia (MBA), Notre Dame (BA) Contact Info: [email protected] +44 20 7868 4502
Joined Blair: 2007
Supply Chain Services Sector Coverage
Transportation and Logistics Services Specialty Distribution
• Third party logistics (3PL)
• Freight forwarding
• Intermodal services
• Reverse logistics / returns management
• Value-added warehousing and distribution
• Supply chain management
• Rail services
• Marine Services
• Industrial
• MRO
• Building products & construction
• Aerospace
• Transportation & heavy equipment
• Technology
• Specialty chemicals
• Energy / oil & gas
• Niche-end markets

Logistics Sector Overview

William Blair & Company
Supply Chain Services Investment Banking 10 Logistics Sector Overview
Logistics Sector Overview
The logistics sector has experienced strong historical growth over the past 5 years, particularly in asset-light segments such as third-party logistics (3PL), reflecting a continued outsourcing trend toward increased use of third-parties to manage transportation and logistics needs. With technological advances driving interconnectivity of the supply chain, it is more important now than ever before for companies to maintain competitiveness by efficiently managing their cost structure and optimizing transportation and freight expenses.
3PL firms provide a compelling alternative to maintaining individual relationships with carriers and service providers, leveraging scale and direct access to a vast network of transportation providers across a variety of modes to provide significant savings and benefits to customers. In contrast to traditional carriers, 3PLs are non-asset or asset-light business models, contracting the actual movement of goods to third parties while minimizing the need for significant investment and capital expenditures. This segment has been one of the fastest growing logistics segments, with a 9.4% CAGR since 1996, and is now sized at $146.4 billion in revenue in the U.S. alone.
Underpinning the success of these 3PLs is a network of U.S. transportation and freight carriers that has grown to a market size of $653 billion. Trucking remains the largest transportation services segment and most commonly used mode of freight movement. However intermodal service providers, which can utilize Truck Load (TL) / Less than Truck Load (LTL) as well as rail, air and shipping carriers, can offer more efficient and cost-effective solutions for the movement of goods both in the U.S. and internationally. We have seen a strong trend in recent M&A activity toward acquiring additional diversified capabilities to create integrated, multi-modal solutions, such as XPO acquiring 3PD for last mile logistics, Pacer International for intermodal, New Breed for value-added warehousing / distribution and reverse logistics, and Norbert Dentressangle for significant international scale and reach.
While historically most transportation management and logistics services were focused on the forward movement of goods, from manufacturer to retailer to customer, reverse logistics management is becoming an increasingly important component of supply chain optimization. Trends such as the rise of e-commerce and online purchasing and more rapid obsolescence of electronic devices has driven sharp growth in the volume of aftermarket returned, recycled and retired goods. For example, the ease of purchases and returns at online apparel retailers facilitates consumers’ buying multiple sizes, colors, and styles of products simultaneously, knowing that all but one will be immediately returned. In the electronics segment, reverse logistics has evolved from the recycling and refilling of spent printer cartridges to the repair, rebuilding and reselling of smartphones and tablets, spawning a growing international aftermarket for the sale of refurbished devices. FedEx’s recent acquisition of GENCO demonstrates the strong interest with which larger, more traditional forward carriers are adding reverse logistics services to expand their breadth of coverage of the supply chain. In addition, Encore Repair Services debt financing from Falcon Investment Advisors to support the Company’s growth initiatives represents recent activity in the reverse logistics and aftermarket services industry.
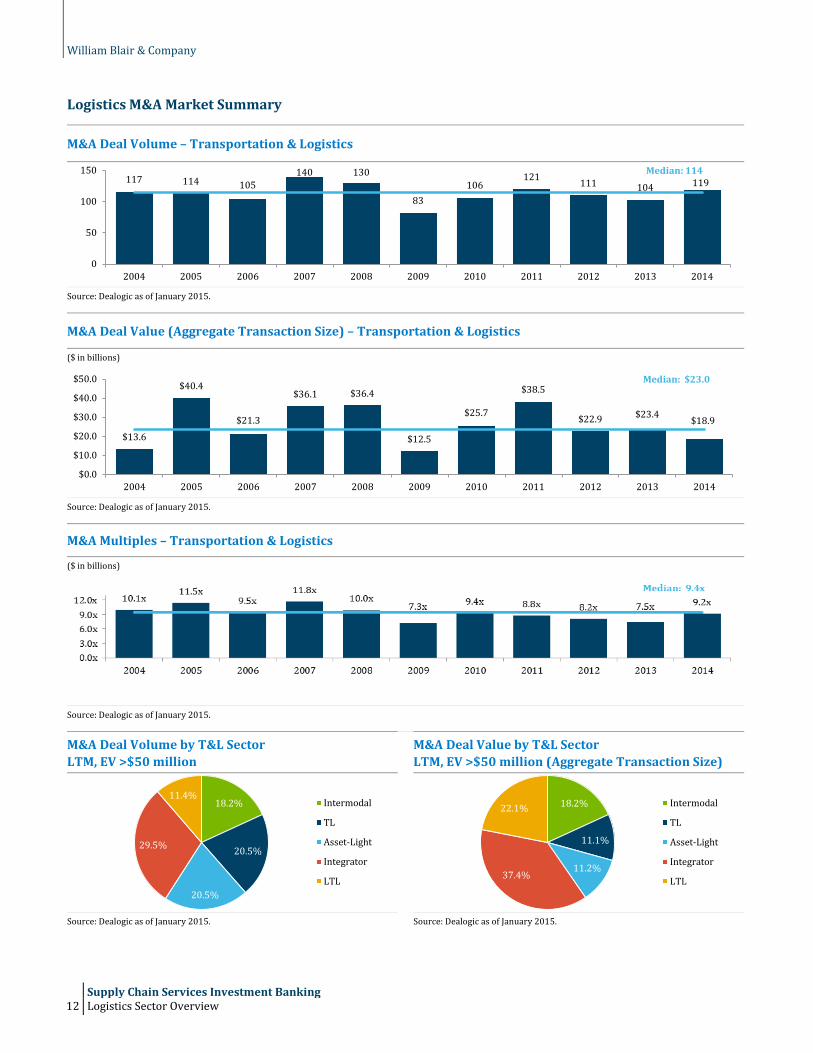
M&A activity in logistics remained strong in 2014, generating 119 closed transactions, representing $18.9 billion in aggregate transaction value. This represented a 14.4% increase in transaction volume over 2013 metrics and exceeds the median of the past 10 years. Asset-light and intermodal were the two largest segments by both volume and value, highlighting both financial sponsor interest in higher ROIC, less-capital-intensive business models, as well as strategic interest in expanding breadth of services and geographic coverage in the interest of developing more compelling multi-modal solutions. The outlook for 2015 remains strong within logistics and transportation management, and we expect many of the themes and trends highlighted above to continue.

William Blair & Company
Supply Chain Services Investment Banking Logistics Sector Overview 11
Transportation & Logistics Market Sizing
Source: Armstrong & Associates, Freedonia. Note: 3PL market size based on 2013 Gross Revenue; U.S. freight transportation market size based on 2012 data.
US 3PL Market 1996-2014E
($ in billions)
Source: Armstrong & Associates.
U.S. Freight Transportation Market$653 Billion
Truckload$127.0 Billion
Less-than-Truckload$55.0 Billion
Rail Intermodal$70.9 Billion
Outsourced 3PL Market$146.4 Billion
Dedicated Contract Carriage
$12.0 Billion
Domestic Transportation
Management $49.2 Billion
International Transportation
Management$46.2 Billion
Warehouse / Distribution
$35.9 Billion
Software
$3.1 Billion
$30.8 $34.2 $39.6 $45.3 $56.6
$65.3 $71.1 $76.9 $89.4
$103.7 $113.6 $119.0
$127.0
$107.1
$127.3 $133.8
$141.8 $146.4 $154.0
$0
$20
$40
$60
$80
$100
$120
$140
$160
$180 2 – 3x GDP Growth
William Blair & Company
Supply Chain Services Investment Banking 12 Logistics Sector Overview
Logistics M&A Market Summary
M&A Deal Volume – Transportation & Logistics
Source: Dealogic as of January 2015.
M&A Deal Value (Aggregate Transaction Size) – Transportation & Logistics
($ in billions)
Source: Dealogic as of January 2015.
M&A Multiples – Transportation & Logistics
($ in billions)
Source: Dealogic as of January 2015.
M&A Deal Volume by T&L Sector LTM, EV >$50 million
M&A Deal Value by T&L Sector LTM, EV >$50 million (Aggregate Transaction Size)
Source: Dealogic as of January 2015. Source: Dealogic as of January 2015.
117 114 105140 130
83106
121 111 104 119
0
50
100
150
2004 2005 2006 2007 2008 2009 2010 2011 2012 2013 2014
Median: 114
$13.6
$40.4
$21.3
$36.1 $36.4
$12.5
$25.7
$38.5
$22.9 $23.4 $18.9
$0.0
$10.0
$20.0
$30.0
$40.0
$50.0
2004 2005 2006 2007 2008 2009 2010 2011 2012 2013 2014
Median: $23.0
18.2%
20.5%
20.5%
29.5%
11.4%Intermodal
TL
Asset-Light
Integrator
LTL
18.2%
11.1%
11.2%37.4%
22.1% Intermodal
TL
Asset-Light
Integrator
LTL

William Blair & Company
Supply Chain Services Investment Banking Selected M&A Activity – Logistics 13
Selected M&A Activity – Logistics
Selected Logistics Transactions
($ in millions)
Date Announced Target
Target (Unit Sold) / Business Description Buyer
Enterprise Value
Enterprise Value/LTM
Revenue EBITDA 04/28/15 Norbert Dentressangle SA Provider of contract logistics, freight
brokerage, and forwarding services XPO Logistics, Inc. (NYSE: XPO) $3,530.0 0.62x 10.5x
04/21/15 Command Transportation Largest privately held truckload brokers and non-asset based provider
Echo Global Logistics (NASDAQ: ECHO)
$420.0 0.75x 11.5x
04/07/15 TNT Express Provides express delivery services to businesses and consumers worldwide
FedEx Corp (NYSE: FDX) $4,800.0 0.60x 27.9x
02/24/15 Freightliner Group Ltd. Rail freight services for blue-chip organizations
Genesee & Wyoming $768.0 1.00x NA
02/18/15 Toll Holdings Limited (ASX:TOL)
Forwarding, express, and logistics services
Japan Post Holdings $6,485.6 0.9x 11.9x
02/17/15 APL Logistics Air and ocean freight forwarding Kintetsu World Express $1,200.0 0.75x 15.0x
02/09/15 UX Specialized Logistics Logistics services and single-item B2C delivery
XPO Logistics, Inc. (NYSE:XPO) $59.0 0.52x 7.2x
12/15/14 GENCO Third party logistics company FedEx Corp (NYSE: FDX) $2,000.0 1.25x 9.8x
12/01/14 Freightquote.com Operates as an online freight shipping brokerage
CH Robinson Worldwide Inc. (NASDAQ: CHRW)
$365.0 0.59x 10.7x
08/11/14 Active Aero Group Inc. Expedited transportation management services
Roadrunner Transportation Systems, Inc. (NYSE:RRTS)
$115.0 0.43x 8.0x
07/31/14 Jacobson Holding Company Warehousing and logistics services Norbert Dentressangle $750.0 0.90x 9.8x
07/29/14 New Breed Holding Company Contract supply chain management solutions
XPO Logistics, Inc. (NYSE: XPO) $615.0 1.00x 8.0x
07/24/14 Contrans Group Inc Freight transportation services TransForce Inc (Canada) $590.4 1.07x 13.0x
06/02/14 Transport Corp of America Inc Truckload carriage and logistics services TransForce Inc (Canada) $310.0 0.89x 6.3x
03/14/14 Unitrans International Corporation
Airfreight services, including express and door-to-door
Roadrunner Transportation Systems, Inc. (NYSE:RRTS)
$55.5 0.66x NA
02/28/14 Haas Group International Inc. Chemical management and product distribution
Wesco Aircraft Holdings, Inc. (NYSE: WAIR)
$706.7 NA NA
01/06/14 Pacer International, Inc. (NasdaqGS:PACR)
Asset-light transportation and logistics service
XPO Logistics, Inc. (NYSE:XPO) $336.5 0.30x 11.9x
12/10/13 Landstar SCS Integrated transportation management solutions
XPO Logistics, Inc. (NYSE: XPO) $87.0 NA 7.5x
11/11/13 Gordon Trucking, Inc. Truckload transportation and management services
Heartland Express, Inc. (NasdaqGS:HTLD)
$321.4 0.74x 5.0x
08/16/13 3PD, Inc. (XPO Last Mile) Last-mile logistics solutions XPO Logistics, Inc. (NYSE:XPO) $365.0 1.14x 10.1x
06/23/13 Clal Industries Ltd. (TASE:CII) Transportation, infrastructure, and logistics service
Access Industries, Inc. $2,285.9 1.31x 8.9x
05/28/13 Transplace Third party logistics and technology services
Greenbriar Equity Group $350.0 NA 11.7x
11/01/12 Phoenix International Marine services contractor and underwater operations
CH Robinson Worldwide $635.0 0.79x 12.5x
08/01/12 Caterpillar Logistics (Neovia) Logistics and distribution services of mining equipment
Platinum Equity $750.0 1.07x 6.0x
02/23/11 Dynamex Inc. Same-day logistics and outsourced transportation
TransForce $226.3 0.54x 10.8x
Mean 0.81x 10.6x
Median 0.75x 10.0x
Sources: Capital IQ, MergerMarket, and William Blair data.

William Blair & Company
Supply Chain Services Investment Banking 14 Recent Notable Logistics Transactions
Recent Notable Logistics Transactions
Date: 04/07/15 Observations/Rationale:
Target:
TNT Express provides courier global express distribution, logistics and international mail service of parcels and freight. The Company supports businesses and consumers across the globe by delivering nearly one million shipments per day. TNT picks up, transports, delivers documents, parcels, and palletized freight, and offers supply chain solutions. The company operates road and air transportation networks in Europe, the Middle East, Asia, Australia, and South America, with a fleet of 54 aircrafts.
• TNT’s small to medium-sized client base in the industrial, automotive, high-tech, and healthcare industries, gives FedEx a new channel for growth
• The transaction would extend FedEx’s presence in a fragmented and growing European marketplace, as well as small parcel delivery
• With TNT, FedEx will tie UPS for the No. 2 European position behind market leader DHL; the two networks should overlap well given TNT's strong ground presence with FedEx's better air express capabilities
• Synergies will likely come from efficiency and productivity improvements as well as scale and density benefits that would lower its overall cost per package, rather than significant headcount or facility reductions
Genco operates as a third party logistics company, providing transportation logistics, damage research, and sustainability services in North America and internationally. The Company offers product lifecycle services, which include inbound logistics, warehousing and distribution, contract packaging and managed transportation, fulfillment, returns processing and disposition, and systems integration. Genco also offers test, repair, and refurbishment services, product liquidation, and recycling management. End markets for Genco include consumer and industrial manufacturers, retailers, technology companies, healthcare services providers, and the U.S. government.
• Allows FedEx to further expand its e-commerce business and related reverse logistics processes
• Bolsters FedEx’s global service portfolio through the addition of new best in class supply chain management services
• The customers of both companies will benefit from the broadened capabilities and robust new combined services
• The asset-light acquisition expands FedEx’s service offerings without a significant infrastructure investment in transportation equipment
Hoofddorp, Netherlands
Key Metrics: Implied Enterprise Value ($M): EV/LTM Revenue: EV/LTM EBITDA:
$4,800
0.60x 27.9x
Date: 12/15/14
Target:
Pittsburg, PA
Key Metrics: Implied Enterprise Value ($M): EV/LTM Revenue: EV/LTM EBITDA:
$2,0000
1.25x 9.8x
Acquirer:
Memphis, TN
Sources: Capital IQ, MergerMarket, Press Releases, and Publicly Available Information.
William Blair & Company
Supply Chain Services Investment Banking Recent Notable Logistics Transactions 15
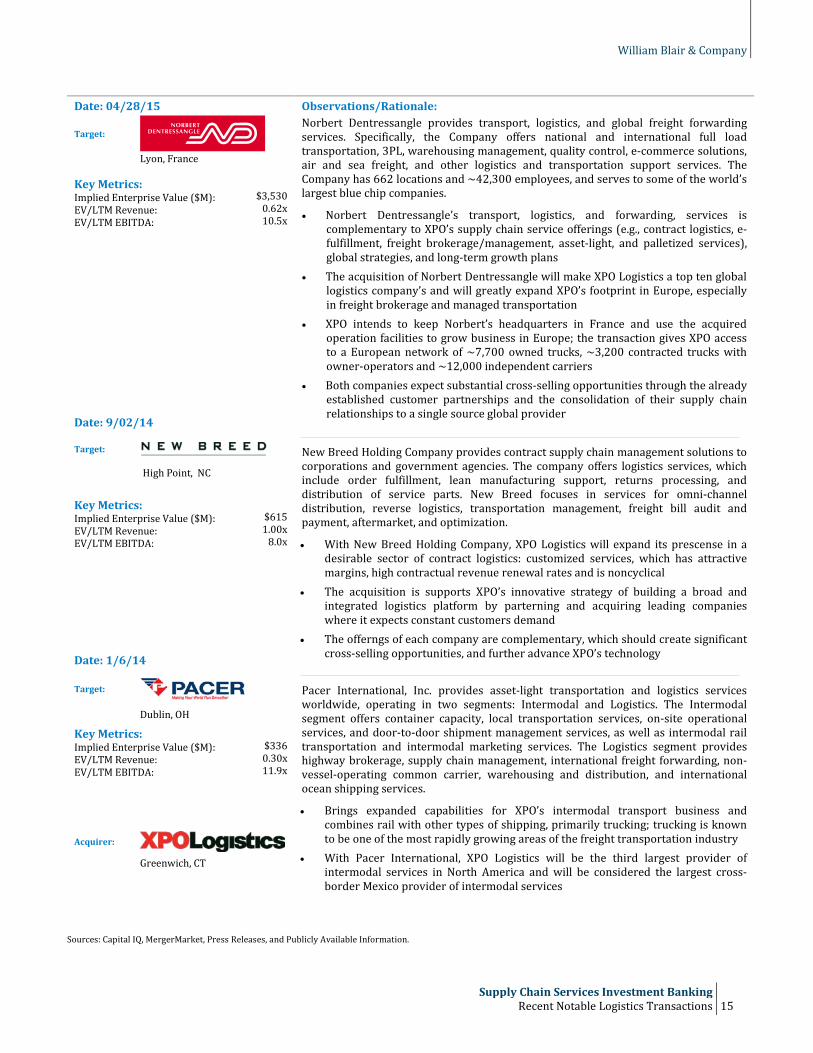
Date: 04/28/15 Observations/Rationale:
Target:
Norbert Dentressangle provides transport, logistics, and global freight forwarding services. Specifically, the Company offers national and international full load transportation, 3PL, warehousing management, quality control, e-commerce solutions, air and sea freight, and other logistics and transportation support services. The Company has 662 locations and ~42,300 employees, and serves to some of the world’s largest blue chip companies.
• Norbert Dentressangle’s transport, logistics, and forwarding, services is complementary to XPO’s supply chain service offerings (e.g., contract logistics, e-fulfillment, freight brokerage/management, asset-light, and palletized services), global strategies, and long-term growth plans
• The acquisition of Norbert Dentressangle will make XPO Logistics a top ten global logistics company’s and will greatly expand XPO’s footprint in Europe, especially in freight brokerage and managed transportation
• XPO intends to keep Norbert’s headquarters in France and use the acquired operation facilities to grow business in Europe; the transaction gives XPO access to a European network of ~7,700 owned trucks, ~3,200 contracted trucks with owner-operators and ~12,000 independent carriers
• Both companies expect substantial cross-selling opportunities through the already established customer partnerships and the consolidation of their supply chain relationships to a single source global provider
New Breed Holding Company provides contract supply chain management solutions to corporations and government agencies. The company offers logistics services, which include order fulfillment, lean manufacturing support, returns processing, and distribution of service parts. New Breed focuses in services for omni-channel distribution, reverse logistics, transportation management, freight bill audit and payment, aftermarket, and optimization.
• With New Breed Holding Company, XPO Logistics will expand its prescense in a desirable sector of contract logistics: customized services, which has attractive margins, high contractual revenue renewal rates and is noncyclical
• The acquisition is supports XPO’s innovative strategy of building a broad and integrated logistics platform by parterning and acquiring leading companies where it expects constant customers demand
• The offerngs of each company are complementary, which should create significant cross-selling opportunities, and further advance XPO’s technology
Pacer International, Inc. provides asset-light transportation and logistics services worldwide, operating in two segments: Intermodal and Logistics. The Intermodal segment offers container capacity, local transportation services, on-site operational services, and door-to-door shipment management services, as well as intermodal rail transportation and intermodal marketing services. The Logistics segment provides highway brokerage, supply chain management, international freight forwarding, non-vessel-operating common carrier, warehousing and distribution, and international ocean shipping services.
• Brings expanded capabilities for XPO’s intermodal transport business and combines rail with other types of shipping, primarily trucking; trucking is known to be one of the most rapidly growing areas of the freight transportation industry
• With Pacer International, XPO Logistics will be the third largest provider of intermodal services in North America and will be considered the largest cross-border Mexico provider of intermodal services
Lyon, France Key Metrics: Implied Enterprise Value ($M): EV/LTM Revenue: EV/LTM EBITDA:
$3,530
0.62x 10.5x
Date: 9/02/14
Target:
High Point, NC
Key Metrics: Implied Enterprise Value ($M): EV/LTM Revenue: EV/LTM EBITDA:
$615 1.00x
8.0x
Date: 1/6/14
Target:
Dublin, OH
Key Metrics: Implied Enterprise Value ($M): EV/LTM Revenue: EV/LTM EBITDA:
$336
0.30x 11.9x
Acquirer: Greenwich, CT
Sources: Capital IQ, MergerMarket, Press Releases, and Publicly Available Information.

William Blair & Company
Supply Chain Services Investment Banking 16 Recent Notable Logistics Transactions
Date: 7/31/14 Observations/Rationale:
Target:
Jacobson Companies provides warehousing and logistics services and offers distribution and packaging services. The Company also provides transportation services, including freight management, contract carriage, and road shipping. Additionally, Jacobson Companies manufactures liquid products, which includes filling liquid, paste, and gel in bottles, tubes, and jars. The Company caters to a variety of industries, including food and beverage, chemical, agri-science, energy, oil and gas, and retail/consumer.
• Strengthened Norbert Dentressangle’s solutions and presence in the U.S. market and provides additional exposure to the fast-growing U.S. logistics and transport market
• Created new cross-selling opportunities across the U.S. and internationally • Strengthened Norbert’s brand, presence and footprint in selected vertical markets,
such as engineering, IT, automation processes, and reverse logistics
Des Moines, IA
Acquirer:
Lyon, France Key Metrics: Implied Enterprise Value ($M): EV/LTM Revenue: EV/LTM EBITDA:
$750 0.90x
9.8x
Date: 12/1/2014 Observations/Rationale:
Target:
Freightquote.com, Inc. operates as an online freight shipping brokerage company, offering truckload quotes, LTL quotes, expedited quotes, intermodal quotes, and real time freight quotes in North America. The Company is one of the largest online freight brokers. Freightquote.com is considered to be an innovative player in the industry by offering a unique combination of dedicated service and U.S. Patented, solutions-driven technology.
• Freightquote.com brings synergies to C.H. Robinson’s LTL and TL businesses, as well as a talented technology team with expertise in developing a powerful and attractive e-commerce store front experience
• The acquisition increases C.H. Robinson’s market share with small businesses • Gives C.H. Robinson a compelling proprietary e-commerce technology platform,
which is largely TMS-driven (transportation management system) and includes online user-friendly tools, which tends to be more transactional, higher margin freight
Phoenix International Freight Services Ltd. provides international freight forwarding, air and ocean consolidation, customs house brokerage, and non-vessel operating common carrier services worldwide. The Company’s solutions include air freight and ocean freight forwarding, customs brokerage, cargo insurance, logistical prestige services, textile logistics, information systems, and vendor management.
• Similar to C.H. Robinson, Phoenix International has strong customer and carrier relationships, a talented management team and employees, and a performance-based culture which has proven to mix well as a combiend entity
• The acquisition strengthens C.H. Robinson’s international forwarding business and advances the Company’s robust technology infrastructure
Kansas City, MO
Key Metrics: Implied Enterprise Value ($M): EV/LTM Revenue: EV/LTM EBITDA:
$365 0.59x 10.7x
Date: 11/01/12
Target:
Wood Dale, IL
Key Metrics: Implied Enterprise Value ($M): EV/LTM Revenue: EV/LTM EBITDA:
$635 0.79x 12.5x
Acquirer:
Eden Prairie, MN Sources: Capital IQ, MergerMarket, Press Releases, and Publicly Available Information.

William Blair & Company
Supply Chain Services Investment Banking Public Comparables – Annual EBITDA Multiples 17
Public Comparables – Annual EBITDA Multiples
Asset-Light Logistics
EV/LTM EBITDA Key Statistics
Median: 13.3x
High: 15.0x
Low: 8.9x
Note: See page 19 for comparable group.
Integrators
EV/LTM EBITDA Key Statistics
Median: 7.6x
High: 11.3x
Low: 5.1x
Note: See page 20 for comparable group.
Less Than Truckload (LTL)
EV/LTM EBITDA Key Statistics
Median: 6.3x
High: 9.2x
Low: 5.3x
Note: See page 21 for comparable group.
13.8x15.0x 13.5x
9.9x 8.9x
14.6x 13.2x
11.1x12.2x
13.6x
2005 2006 2007 2008 2009 2010 2011 2012 2013 2014
Median: 13.3x
7.5x 7.7x9.0x
7.2x
5.1x
11.3x
6.2x 6.0x
8.8x9.8x
2005 2006 2007 2008 2009 2010 2011 2012 2013 2014
Median: 7.6x
6.2x 5.3x 5.3x 5.4x 5.8x
8.4x 8.0x6.7x 6.4x
9.2x
2005 2006 2007 2008 2009 2010 2011 2012 2013 2014
Median: 6.3x

William Blair & Company
Supply Chain Services Investment Banking 18 Public Comparables – Annual EBITDA Multiples
Truckload (TL)
EV/LTM EBITDA Key Statistics
Median: 6.6x
High: 8.5x
Low: 5.6x
Note: See page 22 for comparable group.
Rail Carriers
EV/LTM EBITDA Key Statistics
Median: 9.1x
High: 11.6x
Low: 7.4x
Note: See page 23 for comparable group.
Source: CapIQ.
5.6x 6.6x 6.9x5.8x 6.5x
8.5x
6.4x 6.0x7.0x
8.3x
2005 2006 2007 2008 2009 2010 2011 2012 2013 2014
Median: 6.6x
9.2x 9.2x 8.7x 8.5x7.4x
9.4x 9.1x 9.0x10.0x
11.6x
2005 2006 2007 2008 2009 2010 2011 2012 2013 2014
Median: 9.1x

William Blair & Company
Supply Chain Services Investment Banking Public Comparables by Sector 19
Public Comparables by Sector
Asset-Light Logistics
($ in millions, except share price data)
52-Week LTM
Company Exchange Ticker
Current Stock Price Low High
Equity Value
Enterprise Value (EV) Revenue EBITDA OCF
EBITDA Margin
OCF Margin
EV/ EBITDA
EV/ OCF
15F EV/ EBITDA
15F P/E ROIC
CH Robinson Worldwide
NasdaqGS:CHRW $73.45 $50.21 $77.49 $10,748 $11,724 $13,470 $797 $774.1 5.9% 5.7% 14.7x 15.1x 13.1x 21.6x 48.4%
Echo Global Logistics NasdaqGS:ECHO $28.45 $16.34 $30.18 $678 $645 $1,173 $36 $20.8 3.1% 1.8% 17.9x NMF 11.8x 29.1x 16.3%
Expeditors International of Washington
NasdaqGS:EXPD $48.04 $38.14 $49.02 $9,212 $8,248 $6,565 $644 $606.5 9.8% 9.2% 12.8x 13.6x 11.6x 22.5x 31.8%
Forward Air Corp. NasdaqGS:FWRD $53.77 $42.09 $54.63 $1,639 $1,599 $781 $127 $87.1 16.2% 11.2% 12.6x 18.4x 10.0x 22.3x 20.9%
Hub Group NasdaqGS:HUBG $39.97 $32.69 $51.47 $1,474 $1,474 $3,571 $135 $16.3 3.8% 0.5% 10.9x NMF 12.0x 21.1x 15.8%
Kuehne + Nagel International AG
SWX:KNIN $143.41 $112.66 $143.91 $17,203 $16,021 $17,618 $987 $799.3 5.6% 4.5% 16.2x 20.0x 15.6x 26.3x 32.4%
Landstar System NasdaqGS:LSTR $67.83 $57.39 $81.80 $3,038 $2,983 $3,186 $250 $239.3 7.8% 7.5% 11.9x 12.5x 10.7x 19.6x 45.5%
Panalpina World Transport Holding Ltd.
SWX:PWTN $143.51 $108.68 $148.49 $3,406 $3,046 $6,752 $150 $130.7 2.2% 1.9% 20.3x 23.3x 13.9x 28.6x 16.0%
Quality Distribution NasdaqGM:QLTY $10.73 $8.32 $15.83 $301 $651 $992 $70 $30.1 7.1% 3.0% 9.3x 21.6x 7.5x 13.2x 15.4%
Radiant Logistics AMEX:RLGT $5.02 $2.72 $5.33 $174 $181 $392 $13 $11.4 3.3% 2.9% 14.2x 15.9x 9.9x 38.6x 15.3%
Roadrunner Transportation Systems
NYSE:RRTS $25.82 $19.57 $29.02 $982 $1,402 $1,873 $121 $75.6 6.4% 4.0% 11.6x 18.5x 9.5x 15.7x 9.5%
UTi Worldwide NasdaqGS:UTIW $13.38 $9.00 $14.75 $1,411 $1,947 $4,291 $72 $40.1 1.7% 0.9% NMF NMF 10.6x 52.8x 1.6%
XPO Logistics NYSE:XPO $46.48 $22.84 $46.85 $3,689 $3,681 $2,357 $95 $50.1 4.0% 2.1% NMF NMF 16.8x NMF (0.0%)
Median $1,639 $1,947 $3,186 $127 $75.6 5.6% 3.0% 12.8x 18.4x 11.6x 22.4x 16.0%
Source: CapIQ as of March 2015. (1) OCF (Operating Cash Flow) represents EBITDA less Capital Expenditures.
Indexed Stock Performance – LTM Indexed Stock Performance – Last Three Years
Source: Factset. Source: Factset.
Asset-Light – EV/LTM EBITDA
Source: Capital IQ.
80%
100%
120%Asset-Light (18.8%) S&P 500 (12.6%)(Indexed Price)
70%
120%
170%Asset-Light (16.6%) S&P 500 (50.0%)(Indexed Price)
13.5x
0.0x5.0x
10.0x15.0x20.0x
Median: 12.4x

William Blair & Company
Supply Chain Services Investment Banking 20 Public Comparables by Sector
Integrators
($ in millions, except share price data)
52-Week LTM
Company Exchange Ticker
Current Stock Price Low High
Equity Value
Enterprise Value (EV) Revenue EBITDA OCF
EBITDA Margin
OCF Margin
EV/ EBITDA
EV/ OCF
15F EV/ EBITDA
15F P/E ROIC
Deutsche Post AG XTRA:DPW $30.63 $22.68 $32.39 $37,098 $39,250 $69,098 $4,424 $2,305.9 6.4% 3.3% 8.9x 17.0x 8.1x 16.3x 17.6%
FedEx Corporation NYSE:FDX $173.32 $130.64 $183.51 $49,104 $51,573 $47,178 $6,748 $2,800.0 14.3% 5.9% 7.6x 18.4x 6.8x 17.3x 16.8%
United Parcel Service NYSE:UPS $98.53 $94.05 $114.40 $88,927 $96,491 $58,232 $6,864 $4,536.0 11.8% 7.8% 14.1x 21.3x 10.0x 19.1x 42.6%
Median $49,104 $51,573 $58,232 $6,748 $2,800.0 11.8% 5.9% 8.9x 18.4x 8.1x 17.3x 17.6%
Source: CapIQ as of March 2015. (1) OCF (Operating Cash Flow) represents EBITDA less Capital Expenditures.
Indexed Stock Performance – LTM Indexed Stock Performance – Last Three Years
Source: Factset. Source: Factset.
Integrators – EV/LTM EBITDA
Source: Capital IQ.
80%
100%
120%Integrators (4.4%) S&P 500 (12.6%)(Indexed Price)
70%
120%
170%Integrators (46.7%) S&P 500 (50.0%)(Indexed Price)
10.5x
0.0x
5.0x
10.0x
15.0x Median: 8.3x

William Blair & Company
Supply Chain Services Investment Banking Public Comparables by Sector 21
Less-Than-Truckload Carriers
($ in millions, except share price data)
52-Week LTM
Company Exchange Ticker
Current Stock Price Low High
Equity Value
Enterprise Value (EV) Revenue EBITDA OCF
EBITDA Margin
OCF Margin
EV/ EBITDA
EV/ OCF
15F EV/ EBITDA
15F P/E ROIC
Con-way NYSE:CNW $44.51 $39.12 $53.54 $2,563 $2,868 $5,806 $493 $203.3 8.5% 3.5% 5.8x 14.1x 5.0x 16.0x 13.5%
Old Dominion Freight Line
NasdaqGS:ODFL $78.19 $53.63 $81.48 $6,719 $6,839 $2,788 $587 $219.4 21.1% 7.9% 11.7x NMF 10.0x 21.4x 27.3%
Saia NasdaqGS:SAIA $44.97 $35.19 $57.60 $1,110 $1,188 $1,272 $145 $47.0 11.4% 3.7% 8.2x 25.3x 6.8x 17.2x 20.1%
YRC Worldwide NasdaqGS:YRCW $17.72 $14.03 $29.21 $561 $1,500 $5,069 $197 $128.0 3.9% 2.5% 7.6x 11.7x 4.5x 25.7x 10.3%
Median $1,836 $2,184 $3,928 $345 $165.6 9.9% 3.6% 7.9x 14.1x 5.9x 19.3x 16.8%
Source: CapIQ as of March 2015. (1) OCF (Operating Cash Flow) represents EBITDA less Capital Expenditures.
Indexed Stock Performance – LTM Indexed Stock Performance – Last Three Years
Source: Factset. Source: Factset.
Less-Than-Truckload – EV/LTM EBITDA
Source: Capital IQ.
80%
100%
120%
140%Less-Than-Truckload (27.9%) S&P 500 (12.6%)(Indexed Price)
80%
130%
180%
230%Less-Than-Truckload (108.6%) S&P 500 (50.0%)(Indexed Price)
7.4x
0.0x2.0x4.0x6.0x8.0x
10.0x12.0x
Median: 7.0x

William Blair & Company
Supply Chain Services Investment Banking 22 Public Comparables by Sector
Truckload Carriers
($ in millions, except share price data)
52-Week LTM
Company Exchange Ticker
Current Stock Price Low High
Equity Value
Enterprise Value (EV) Revenue EBITDA OCF
EBITDA Margin
OCF Margin
EV/ EBITDA
EV/ OCF
15F EV/ EBITDA
15F P/E ROIC
Celadon Group NYSE:CGI $26.35 $18.12 $26.86 $624 $1,043 $806 $107 ($4.1) 13.2% (0.5%) 9.8x NA 7.3x 17.3x 9.5%
Covenant Transportation Group
NasdaqGS:CVTI $36.55 $8.88 $36.70 $663 $844 $719 $89 ($75.0) 12.3% (10.4%) 9.5x NA 7.3x 20.0x 12.1%
Heartland Express NasdaqGS:HTLD $24.47 $19.96 $27.96 $2,148 $2,156 $871 $208 $3.0 23.9% 0.3% 10.4x NMF 8.1x 22.7x 19.6%
JB Hunt Transport Services
NasdaqGS:JBHT $86.76 $69.33 $87.90 $10,109 $11,036 $6,165 $926 $117.5 15.0% 1.9% 11.9x NMF 10.6x 24.1x 33.4%
Knight Transportation
NYSE:KNX $32.77 $21.62 $34.69 $2,687 $2,806 $1,102 $239 ($21.2) 21.7% (1.9%) 11.7x NA 9.1x 22.8x 18.0%
Marten Transport Ltd. NasdaqGS:MRTN $22.92 $15.36 $25.71 $767 $791 $673 $115 ($47.7) 17.1% (7.1%) 6.9x NA 5.7x 20.4x 11.3%
Swift Transportation Company
NYSE:SWFT $28.33 $18.53 $29.44 $4,026 $5,422 $4,299 $583 $272.6 13.6% 6.3% 9.3x 19.9x 7.9x 16.5x 19.9%
Werner Enterprises NasdaqGS:WERN $31.94 $23.50 $32.65 $2,302 $2,355 $2,139 $318 $21.2 14.9% 1.0% 7.4x NMF 6.2x 20.1x 15.5%
Median $2,225 $2,255 $987 $224 ($0.6) 14.9% (0.1%) 9.6x 19.9.x 7.6x 20.2x 16.7%
Source: CapIQ as of March 2015. (1) OCF (Operating Cash Flow) represents EBITDA less Capital Expenditures.
Indexed Stock Performance – LTM Indexed Stock Performance – Last Three Years
Source: Factset. Source: Factset.
Truckload – EV/LTM EBITDA
Source: Capital IQ.
80%
100%
120%
140%Truckoad (26.3%) S&P 500 (12.6%)(Indexed Price)
70%
120%
170%Truckload (70.5%) S&P 500 (50.0%)(Indexed Price)
9.2x
0.0x2.0x4.0x6.0x8.0x
10.0xMedian: 7.0x

William Blair & Company
Supply Chain Services Investment Banking Public Comparables by Sector 23
Rail Carriers
($ in millions, except share price data)
52-Week LTM
Company Exchange Ticker
Current Stock Price Low High
Equity Value
Enterprise Value (EV) Revenue EBITDA OCF
EBITDA Margin
OCF Margin
EV/ EBITDA
EV/ OCF
15F EV/ EBITDA
15F P/E ROIC
Canadian National Railway Company
TSX:CNR $67.54 $46.65 $69.51 $54,628 $61,163 $10,478 $4,900 $2,916.1 46.8% 27.8% 12.5x 21.0x 12.4x 20.1x 22.3%
CSX Corp. NYSE:CSX $34.13 $27.14 $37.99 $33,808 $42,613 $12,669 $4,764 $2,315.0 37.6% 18.3% 8.9x 18.4x 8.3x 15.8x 17.5%
Genesee & Wyoming NYSE:GWR $103.28 $80.61 $106.02 $5,574 $7,136 $1,639 $574 $242.1 35.0% 14.8% 12.4x 29.5x 10.2x 21.0x 10.7%
Kansas City Southern NYSE:KSU $114.43 $95.41 $126.49 $12,634 $14,917 $2,577 $1,106 $135.2 42.9% 5.2% 13.5x NMF 11.9x 21.2x 14.4%
Norfolk Southern Corporation
NYSE:NSC $108.65 $91.91 $117.64 $33,400 $41,733 $11,624 $4,522 $2,404.0 38.9% 20.7% 9.2x 17.4x 8.7x 15.9x 16.5%
Union Pacific Corporation
NYSE:UNP $114.52 $90.36 $124.52 $100,925 $110,819 $23,988 $10,657 $6,311.0 44.4% 26.3% 10.4x 17.6x 9.4x 17.4x 27.2%
Median $33,604 $42,173 $11,051 $4,643 $2,359.5 40.9% 19.5% 11.4x 18.4x 9.8x 18.7x 17.0%
Source: CapIQ as of March 2015. (1) OCF (Operating Cash Flow) represents EBITDA less Capital Expenditures.
Indexed Stock Performance – LTM Indexed Stock Performance – Last Three Years
Source: Factset. Source: Factset.
Asset-Light – EV/LTM EBITDA
Source: Capital IQ.
80%
100%
120%
140%Rail Carriers (21.3%) S&P 500 (12.6%)(Indexed Price)
70%
120%
170%
Rail Carriers (80.0%) S&P 500 (50.0%)(Indexed Price)
10.8x
0.0x
5.0x
10.0x
15.0xMedian: 9.2x

William Blair & Company
Supply Chain Services Investment Banking 24 Public Comparables by Sector
Stock Price Performance – LTM
Source: FactSet.
Stock Price Performance – Last Three Years
Source: FactSet.
90
95
100
105
110
115
120
125
130
135
140
Asset-Light (18.8%) Integrators (4.4%) Less-Than-Truckload (27.9%)
Truckoad (26.3%) S&P 500 (12.6%) Rail Carriers (21.3%)(Indexed Price)
4.4%
12.6%
18.8%
21.3%
26.3%27.9%
50
100
150
200
250
300
Asset-Light (16.6%) Integrators (46.7%) Less-Than-Truckload (108.6%)
Truckload (70.5%) S&P 500 (50.0) Rail Carriers (80.0%)(Indexed Price)
46.7%
50.0%
16.6%
80.0%
70.5%
108.6%

William Blair & Company
Supply Chain Services Investment Banking Logistics Industry Insights 25
Logistics Industry Insights
Top 20 U.S. Domestic and Global 3PL Providers ($ in millions)
U.S. Domestic Global
Rank Company
2013 Gross Logistics Revenue Company
2013 Gross Logistics Revenue
1 C. H. Robinson Worldwide $12,752 DHL Supply Chain & Global Forwarding $31,432
2 UPS Supply Chain Solutions $8,935 Kuehne + Nagel $22,587
3 Expeditors International of Washington $6,080 DB Schenker Logistics $19,732
4 Kuehne + Nagel (The Americas) $5,140 Nippon Express $17,317
5 UTi Worldwide $4,441 C.H. Robinson Worldwide $12,752
6 Exel (DHL Supply Chain - Americas) $3,851 CEVA Logistics $8,517
7 DB Schenker Logistics ~$4,000 DSV $8,140
8 Hub Group $3,374 Sinotrans $7,738
9 Burris Logistics ~$2,900 Panalpina $7,293
10 CEVA Logistics (The Americas) $2,673 SDV (Bolloré Group) $7,263
11 Schneider Logistics & Dedicated ~$2,700 DACHSER $6,627
12 Ryder Supply Chain Solutions $2,383 Toll Holdings $6,266
13 Panalpina (The Americas) $2,595 Expeditors International of Washington $6,080
14 BDP International ~$2,200 Geodis $5,828
15 Neovia Logistics Services ~$1,730 UPS Supply Chain Solutions $5,492
16 Menlo Worldwide Logistics ~$1,730 GEFCO $5,300
17 Americold ~$1,580 J.B. Hunt (JBI, DCS & ICS) $5,224
18 J.B. Hunt Dedicated Contract Services & Integrated Capacity Solutions $1,768 UTi Worldwide $4,441
19 GENCO ~$1,600 Agility $4,415
20 Total Quality Logistics $1,600 Yusen Logistics $4,042
Sources: Armstrong & Associates, trade publications, Capital IQ, and public filings.

William Blair & Company
Supply Chain Services Investment Banking 26 Logistics Industry Insights
Top 20 Truckload and LTL Carriers
($ in millions)
Truckload LTL
Rank Company 2013 Revenue Company
2013 Revenue
1 Swift Transportation $3,052 FedEx Freight $5,095
2 Schneider National $2,320 Con-Way Freight $3,466
3 Werner Enterprises $1,642 YRC Freight $3,127
4 J.B. Hunt Transport Services $1,622 UPS Freight $2,502
5 Landstar System $1,606 Old Dominion Freight Line $2,126
6 U.S. Xpress Enterprises $1,480 ESTES Express Lines $1,835
7 Prime $1,478 ABF Freight Systems $1,721
8 C.R. England $1,203 R+L Carriers $1,298
9 CRST International $1,070 SAIA Motor Freight Line $1,139
10 Crete Carrier $1,008 Holland $1,010
11 Knight Transportation $822 Southeastern Freight Lines $914
12 Cardinal/Greatwide Logistics $780 TransForce $619
13 Ruan Transportation Management Services $712 Averitt Express $606
14 Ryder Systems $709 Roadrunner Transportation $559
15 Covenant Transport $634 AAA Cooper Transportation $500
16 Con-way Truckload $630 Central Transport International $488
17 Stevens Transport $621 Manitoulin Transport $435
18 Celadon Group $601 Day & Ross Group $390
19 Anderson Trucking Service $567 Dayton Freight Lines $386
20 Central Refrigerated Service $534 Reddaway $367
Source: The Journal of Commerce.

William Blair & Company
Supply Chain Services Investment Banking Logistics Industry Insights 27
Transportation Statistics
Jan-14 Feb-14 Mar-14 Apr-14 May-14 Jun-14 Jul-14 Aug-14 Sept-14 Oct-14 Nov-14 Dec-14 Jan-15
Truck
Volume (ATA Truck Tonnage) 127.27 127.84 127.18 127.36 129.84 128.84 130.16 131.36 131.09 133.11 134.02 134.13 135.82
YOY growth 2.6% 6.8% 3.3% 3.6% 2.6% 2.8% 3.5% 3.4% 3.4% 5.7% 2.5% 4.8% 6.7%
Seq. growth (0.6%) 0.4% (0.5%) 0.1% 1.9% (0.8%) 1.0% 0.9% (0.2%) 1.5% 0.7% 0.1% 1.3%
Price (Rev/mile ex-fuel) 1.58 1.59 1.61 1.61 1.63 1.62 1.64 1.64 1.64 1.65 1.67 1.69 1.66
YOY growth 1.9% 2.6% 3.9% 3.9% 5.2% 3.8% 5.1% 4.5% 3.8% 4.4% 5.0% 5.0% 5.1%
Seq. growth (1.9%) 0.6% 1.3% 0.0% 1.2% (0.6%) 1.2% 0.0% 0.0% 0.6% 1.2% 1.2% (1.8%)
Intermodal
Volume (Originated vol.) 1,169,331 1,231,240 1,600,443 1,323,578 1,670,267 1,357,410 1,298,337 1,711,393 1,361,315 1,386,178 1,653,314 1,263,097 1,522,524
YOY growth 1.2% 0.1% 8.0% 8.8% 33.8% (12.7%) 6.3% 5.7% 4.9% 4.4% 3.4% 6.1% 30.2%
Seq. growth (1.8%) 5.3% 30.0% (17.3%) 26.2% (18.7%) (4.4%) 31.8% (20.5%) 1.8% 19.3% (23.6%) 20.5%
Price (Cass Intermodal Linehaul Index) 133.20 132.10 135.40 136.80 133.10 126.60 130.40 130.60 128.00 134.30 128.50 132.30 132.80
YOY growth 1.8% 1.4% 1.8% 1.4% 2.5% 3.9% 3.5% 3.5% 2.6% 3.9% 3.0% 1.5% (0.3%)
Seq. growth 2.1% (0.8%) 2.5% 1.0% (2.7%) (4.9%) 3.0% 0.2% (2.0%) 4.9% (4.3%) 3.0% 0.4%
Air
Volume (Intl. FTKs) YOY growth 5.2% 2.8% 6.7% 3.1% 5.1% 2.9% 6.4% 4.8% 5.1% 5.6% 4.6% 5.1% 3.9%
Price (Drewry Air Freight Price Index) 98.91 96.22 102.78 103.78 99.30 101.59 102.49 102.98 103.58 115.51 120.78 107.95 99.60
YOY growth (1.4%) (5.8%) 6.0% 5.0% 2.4% 7.7% 8.8% 6.5% 3.7% 0.6% 2.9% (2.2%) 0.7%
Seq. growth (10.4%) (2.7%) 6.8% 1.0% (4.3%) 2.3% 0.9% 0.5% 0.6% 11.5% 4.6% (10.6%) (7.7%)
Ocean
Volume (Asia-NA TEUs) 1,326,200 861,100 1,231,100 1,344,300 1,352,700 1,310,000 1,392,100 1,418,900 1,433,500 1,374,100 1,230,000 1,290,800 1,343,100
YOY growth (4.2%) (6.2%) 2.2% 2.1% 0.3% 1.5% 5.4% 7.6% 9.0% 5.4% 3.3% 5.8% 1.3%
Seq. growth 8.7% (35.1%) 43.0% 9.2% 0.6% (3.2%) 6.3% 1.9% 1.0% (4.1%) (10.5%) 4.9% 4.1%
Price (Ocean Container Rate Index) 2086.00 1986.00 1886.00 1850.00 1800.00 1650.00 1800.00 2075.00 1875.00 1975.00 1925.00 1978.00 1953.00
YOY growth (14.4%) (18.5%) (13.4%) (12.8%) (16.3%) (10.1%) (15.7%) 13.0% (0.6%) 13.8% 2.1% 4.9% (6.4%)
Seq. growth 10.6% (4.8%) (5.0%) (1.9%) (2.7%) (8.3%) 9.1% 15.3% (9.6%) 5.3% (2.5%) 2.8% (1.3%)
Source: Bloomberg.

Specialty Distribution Sector Overview

William Blair & Company
Supply Chain Services Investment Banking 28 Specialty Distribution Sector Overview
Specialty Distribution Sector Overview
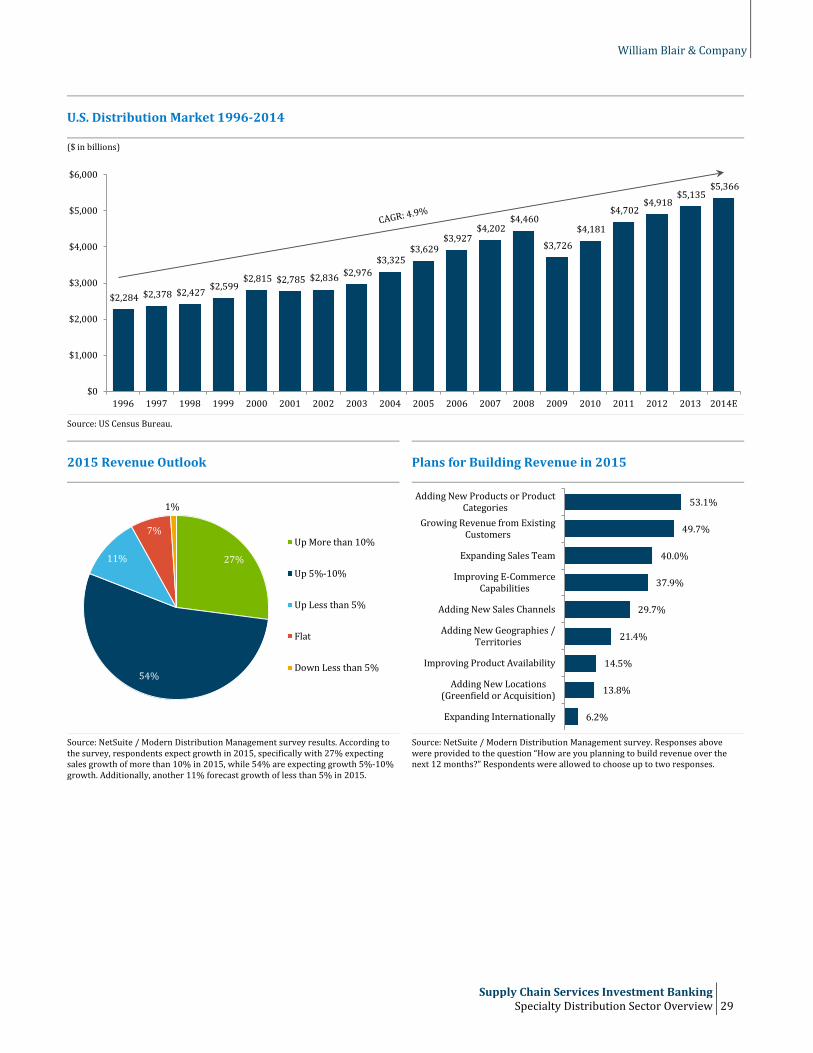
Consistent with U.S. GDP growth and production indices, the total wholesale distribution market in the U.S. has shown consistent, modest growth over the past five years, growing at a CAGR of 4.9% and reaching a market size of $5.4 trillion in 2014. Supported by continued market trends of outsourcing non-core functions, supply chain integration and coordination, and streamlining inventory and working capital dynamics, growth across all sectors remains strong, led by the building products and construction segment, which has grown revenue in excess of 10% in each of the last two years. This segment has been supported by the ongoing recovery in residential construction, as well as the more nascent beginnings of a recovery in the non-residential channel.
One common success factor among all of the various distribution end markets is the ability to differentiate. Whether that comes in the form of proprietary products, exclusive supplier relationships, or a strong technical support staff, understanding and being able to articulate this “secret sauce” is critical to driving value, both in terms of business performance and in achieving successful sale outcomes. Similarly, the addition of value-added services to enhance the core product distribution value proposition for customers drives additional value and increases customer loyalty and stickiness. Strong customer service and technical support capabilities also help mitigate the competitive threat from purely online retailers and e-commerce entrants to the market. However they do not eliminate the need to maintain a sophisticated multi-channel platform (including online) to accommodate growing customer demand for online-order channel capabilities – even in segments where the majority of orders are still processed via phone or fax.
In a related trend, accessibility of information and data, along with robust analytics capabilities, are also increasingly becoming a requirement to staying competitive. Customers expect their sales and customer service representatives to know (or quickly be able to access) everything possible about their orders and products: dimensions, modifications, cost, availability, etc.), which requires robust platform and data analysis capabilities. However, from an operations/fulfillment perspective, too much data and information without the ability to properly synthesize into useful analysis can be counterproductive and inefficient. A sophisticated technology platform and data capabilities are only useful to the extent that they can drive improvements to customer interactions or create an ability to better manage operational processes.
Specialty distributors are actively working to expand product portfolios and redefine traditional markets through acquisition, which also helps supplement limited organic growth opportunities in some sectors. Against a backdrop of a relatively stable and growing market environment, distributors are more willing to aggressively expand outside of their core comfort zone and into adjacent new markets or product categories to increase customer penetration or cross-sell services into different end markets. An example of these dynamics can be found in Fastenal’s acquisition of Av-Tech Industries, which provided new product categories with which to cross-sell into its core customer base.
M&A activity in distribution remained strong in 2014, generating 428 closed transactions, representing $106.4 billion in aggregate transaction value. This represented an increase of 4.9% in transaction volume over 2013 metrics. Consumer and industrial distribution were the two largest segments, comprising 62% by total number of deals and 70% by transaction value.
The outlook for 2015 remains strong in the distribution industry, which is expected to grow at ~5% in 2015 in aggregate, bolstered by continued broad-based strength in U.S. industrial activity and improvements in nonresidential construction. In addition, 27% of publicly traded companies in the distribution industry are estimated to grow +10% in 2015, while 54% are estimated to grow 5% to 10%.
William Blair & Company
Supply Chain Services Investment Banking
Specialty Distribution Sector Overview 29
U.S. Distribution Market 1996-2014
($ in billions)
Source: US Census Bureau.
2015 Revenue Outlook Plans for Building Revenue in 2015
Source: NetSuite / Modern Distribution Management survey results. According to the survey, respondents expect growth in 2015, specifically with 27% expecting sales growth of more than 10% in 2015, while 54% are expecting growth 5%-10% growth. Additionally, another 11% forecast growth of less than 5% in 2015.
Source: NetSuite / Modern Distribution Management survey. Responses above were provided to the question “How are you planning to build revenue over the next 12 months?” Respondents were allowed to choose up to two responses.
$2,284 $2,378 $2,427 $2,599 $2,815 $2,785 $2,836 $2,976
$3,325 $3,629
$3,927 $4,202
$4,460
$3,726
$4,181
$4,702 $4,918
$5,135 $5,366
$0
$1,000
$2,000
$3,000
$4,000
$5,000
$6,000
1996 1997 1998 1999 2000 2001 2002 2003 2004 2005 2006 2007 2008 2009 2010 2011 2012 2013 2014E
27%
54%
11%
7%
1%
Up More than 10%
Up 5%-10%
Up Less than 5%
Flat
Down Less than 5%
53.1%
49.7%
40.0%
37.9%
29.7%
21.4%
14.5%
13.8%
6.2%
Adding New Products or ProductCategories
Growing Revenue from ExistingCustomers
Expanding Sales Team
Improving E-CommerceCapabilities
Adding New Sales Channels
Adding New Geographies /Territories
Improving Product Availability
Adding New Locations(Greenfield or Acquisition)
Expanding Internationally
William Blair & Company
Supply Chain Services Investment Banking 30 Specialty Distribution Sector Overview
M&A Deal Volume – Distribution
Source: Dealogic as of January 2015.
M&A Deal Value (Aggregate Transaction Size) – Distribution
($ in billions)
Source: Dealogic as of January 2015.
M&A Multiples – Distribution
($ in billions)
Source: Dealogic as of January 2015.
M&A Deal Volume by Distribution Sector LTM, EV >$50 million
M&A Deal Value by Distribution Sector LTM, EV >$50 million (Aggregate Transaction Size)
Source: Dealogic as of March January 2015. Source: Dealogic as of March January 2015.
425567 571 582 616
381387 465 480 408 428
0
200
400
600
800
2004 2005 2006 2007 2008 2009 2010 2011 2012 2013 2014
Median: 465
$48.3
$154.1
$202.3$269.1
$216.6
$97.1 $120.1$92.5 $133.8 $122.6 $106.4
$0.0
$100.0
$200.0
$300.0
2004 2005 2006 2007 2008 2009 2010 2011 2012 2013 2014
Median: $122.6
9.3x12.3x 10.9x 8.7x 10.7x
5.7x7.5x
9.0x 10.4x 10.6x11.7x
0.0x
5.0x
10.0x
15.0x
2004 2005 2006 2007 2008 2009 2010 2011 2012 2013 2014
Median: 10.4x
3.2%
24.6%
43.9%
15.8%
8.7%3.8% Construction
Consumer
Industrial
Technology
Transportation & HeavyEquipmentHealthcare
5.7%
33.1%
34.3%
13.1%
7.4%6.3% Construction
Consumer
Industrial
Technology
Transportation & HeavyEquipmentHealthcare

William Blair & Company
Supply Chain Services Investment Banking Selected M&A Activity – Specialty Distribution 31
Selected M&A Activity – Specialty Distribution
Select Specialty Distribution Transactions
($ in millions)
Date Announced Target
Target (Unit Sold) / Business Description Buyer
Enterprise Value
Enterprise Value/LTM
Revenue EBITDA 04/13/15 ProBuild Distributor of building materials to
professional builders and contractors Builders FirstSource $ 1,930 0.40x NA
03/19/15 OverDrive Distributor of eBooks, audio-books, music, and video content
Rakuten $410.0 NA NA
01/14/15 Anixter (OEM Supply Fastener segment) Distributor fasteners and supplies American Industrial Partners $380.0 0.40x 8.2x
01/13/15 MWI Veterinary Supply Distributor of veterinary products AmerisourceBergen $2,560.8 0.86x 19.3x
12/30/14 Excelligence Learning Corporation Specialty distributor and marketer of educational products
Brentwood Associates NA NA NA
12/18/14 Bumble Bee Foods LLC Distributor of canned seafood Thai Union Frozen Products pcl $1,510.0 1.53x 10.5x
10/24/14 Flinn Scientific Provider of products and services to educational science market
Windjammer Capital Investors NA NA NA
08/25/14 Berlin Packaging Distributes plastic, glass, and metal containers
Oak Hill Capital Partners $1,430.0 NA NA
08/08/14 Tri-Ed Distribution Distribution and integration of security and access controls
Anixter $420.0 0.74x 11.7x
07/01/14 Knox Oil Field Supply Fluid handling and distribution Applied Industrial Technologies $133.0 1.33x NA
05/29/14 Interline Brands Distributor of janitorial, repair, and operations products
Goldman Sachs $1,134.0 0.80x 9.9x
05/19/14 The Hillman Companies Provides hardware-related products CCMP Capital Advisors $1,475.0 2.10x 12.8x
05/01/14 Reliance Industrial Investments Fluid handling and distribution Applied Industrial Technologies $189.0 NA 8.2x
04/01/14 Archway Sales and Jacaab Distributes specialty chemical products
Nexeo Solutions $129.0 0.60x 9.9x
02/11/14 Coleman Cable, Inc. Supplies electrical wire and cable products for consumer
Southwire Company, Inc. $781.4 0.85x 8.6x
01/31/14 Hercules Tire & Rubber Company Distributing and selling after-market replacement tires
America Tire Distributors Holdings $321.5 0.64x 10.7x
01/02/14 B27, LLC Distributes pumps and integrated flow control solutions
DXP Enterprises, Inc. $326.4 1.88x 12.0x
12/09/13 Molex Inc Distributes electrical and electronic devices
Koch Industries Inc $6,759.0 1.87x 18.4x
07/31/13 Indura S.A. Industria y Comercio Industrial gas production and distribution
Air Products & Chemicals Inc. $1,273.3 2.39x 11.6x
06/27/13 CH Energy Group Inc. Electric natural gas utility and fuel distribution
Fortis Inc. $1,485.1 1.51x 10.6x
10/15/12 Brightpoint Inc. Device lifecycle services to the wireless and high-tech industries
Ingram Micro Inc. $826.9 0.15x 6.8x
07/03/12 Interfast Inc. Distributor of fasteners to the commercial and military
Wesco Aircraft Europe, Ltd. $130.6 1.80x 7.3x
01/30/12 UFC Aerospace Corp. Aerospace logistics integrated supply chain solutions
BE Aerospace Inc. $400.0 NA 9.5x
12/30/11 Barnes Group (North America) Distributor of fasteners and other low cost consumables
MSC Industrial Supply Co. $550.0 2.00x 16.0x
08/31/11 FABORY Group Distributes fasteners, tools, and industrial supplies
W.W. Grainger $344.0 1.15x 11.0x
Mean 1.26x 11.3x
Median 1.24x 10.6x
Sources: Capital IQ, MergerMarket, and William Blair data.

William Blair & Company
Supply Chain Services Investment Banking 32 Recent Notable Specialty Distribution Transactions
Recent Notable Specialty Distribution Transactions
Date: 4/13/2015 Observations/Rationale:
Target:
With $4.5 billion in revenue, ProBuild is one of the largest distributors of building materials to professional builders, contractors and project-oriented consumers in the U.S. Headquartered in Denver, the company operates approximately 400 lumber and building product distribution, manufacturing and assembly centers serving 40 states.
• The combination creates a diversified national pro dealer with 2014 combined revenue of ~$6.1 billion, with enhanced diversification of products and services
• Opportunity to realize $100-$120 million in annual run-rate cost synergies during the first two years
• Improved geographic footprint and scale to capitalize on continued recovery in the housing market
Denver, CO
Acquirer:
Dallas, TX
Key Metrics: Implied Enterprise Value ($M): EV/LTM Revenue: EV/LTM EBITDA:
$ 1,930
0.40x NA
Date: : 2/12/15 Observations/Rationale:
Target: Anixter Inc. distributes communication products, electrical/electronic wire and cable, fasteners and other inventory parts to original equipment manufacturers. The Fasteners division is a global distributor and manufacturer of highly-engineered fasteners for customers in the heavy truck, power train, luxury automotive, agriculture, construction, recreational vehicles and other verticals.
• The divestiture allows Anixter to have a sharper strategic focus on its Enterprise Cabling & Security Solutions and Wire & Cable segments, additional financial flexibility to build on these global platforms through organic investments or strategic acquisitions.
• The affiliation with American Industrial Partners allows Fasteners access to operational expertise and additional financial resources for growth.
New York, NY
Acquirer:
(OEM Supply-Fasteners business, “Fasteners”) Glenview, IL
Key Metrics: Implied Enterprise Value ($M): EV/LTM Revenue: EV/LTM EBITDA:
$380 0.40x
9.7x
Date: 1/12/15 Observations/Rationale:
Target:
MWI Veterinary Supply distributes animal health products (specifically, pharmaceuticals, vaccines, parasiticides, diagnostics, micro feed ingredients, supplies, specialty products, veterinary pet food, capital equipment, and nutritional products) to veterinarians in the United States and the United Kingdom.
• Significantly extends Amerisource’s pharmaceutical distribution and services business into the growing companion and production markets.
• Amerisource provides MWI with significant knowledge of manufacturer and provider services, as well as an expanded global reach.
• With the scale and volume from Amerisource, synergies are expected to come from stronger procurement sourcing and lower expenses, primarily through shipping, freight, and insurance acitivites.
Chesterbrook, PA
Acquirer:
Boise, ID Key Metrics: Implied Enterprise Value ($M) EV/LTM Revenue: EV/LTM EBITDA:
$2,523
0.82x 18.5x
Sources: Capital IQ, MergerMarket, Press Releases, and Publicly Available Information.

William Blair & Company
Supply Chain Services Investment Banking
Recent Notable Specialty Distribution Transactions 33
Date: 12/30/14 Observations/Rationale:
Target:
Excelligence Learning Corporation is a multi-channel specialty distributor and direct marketer of educational products to the early childhood and elementary markets. The company has 20,000+ proprietary and consumable product offerings across 25+ product categories. Excelligence serves 200,000+ customers, including public and private preschools and elementary schools.
• Brentwood was excited about the company’s deep management team as well as the long-term growth prospects of the early childhood industry.
• Long-term focus on building a strong portfolio of proprietary brands and consumable products drives high degree of recurring revenue and predictability in a fragmented, hard to access customer base.
• International sourcing capabilities drive supply chain efficiencies and strong profit margins.
Monterey, CA
Acquirer:
Los Angeles, CA Key Metrics: Implied Enterprise Value ($M): EV/LTM Revenue: EV/LTM EBITDA:
ND ND ND
Date: 11/06/14 Observations/Rationale:
Target:
Kelway provides international IT services and solutions to private and public sectors, through their global supply chain in over 130 countries with focus on the midmarket. The Company offers managerial services, including service management, field engineering, and service desk, as well as professional services, including consulting, project and program management, engineering, training, and onsite deployment. Kelway also provides supply chain software solutions and cloud-based services.
• The investment will enable CDW to serve new and existing multi-national customers, and provide a more comprehensive solution offering with improved international capabilities through Kelway’s global supply chain relationships.
• Kelway provides CDW with an opportunity expand their geographic footprint and enhance their diverse customer base; customers should benefit from reliable procurement and deployment services from the combined entity.
• Both companies have similar customer objectives and aligned cultures, which strengthens the brand recognition for each company.
United Kingdom
Acquirer:
Vernon Hills, IL Key Metrics: Implied Enterprise Value ($M): EV/LTM Revenue: EV/LTM EBITDA:
$341 N/A N/A
Date: 10/24/14 Observations/Rationale:
Target:
Flinn Scientific is an industry-leading provider of unique value-added products, services and resources to the K-12 educational science market. The company’s value proposition is driven by a number of proprietary products, value-added teacher resources, and dedication to quality and safety. Representative products include packaged chemicals and solutions, safety products, glassware, laboratory equipment and supplies, and ready-to-use laboratory activity kits
• Windjammer was attracted to the company’s market position, defensible barriers to entry, tangible growth opportunities, and strong management team.
• Very difficult to access customer base of teachers and school administrators; Flinn has a uqniue capability to help address this
• Exceptional brand reputation among educators and a focus on value-added services (safety, reference manuals, online resources and content, etc.) drove strong interest in the business and ultimately a premium valuation
Batavia, IL
Acquirer:
Newport Beach, CA
Key Metrics: Implied Enterprise Value ($M): EV/LTM Revenue: EV/LTM EBITDA:
ND ND ND
Sources: Capital IQ, MergerMarket, Press Releases, and Publicly Available Information
BREN T WOOD ASSOCI ATESP R I V A T E E Q U I T Y I N V E S T M E N T S

William Blair & Company
Supply Chain Services Investment Banking 34 Public Comparables – Annual EBITDA Multiples
Public Comparables – Annual EBITDA Multiples
Industrial Distribution
EV/LTM EBITDA Key Statistics
Median: 10.3x High: 13.5x Low: 7.2x
Note: See page 36 for comparable group.
Transportation & Heavy Equipment
EV/LTM EBITDA Key Statistics
Median: 11.4x High: 13.5x Low: 6.8x
Note: See page 37 for comparable group.
Building Products & Construction Distribution
EV/LTM EBITDA Key Statistics
Median: 11.4x High: 12.9x Low: 7.3x
Note: See page 38 for comparable group.
9.6x
13.5x10.5x
8.5x7.2x
10.4x 9.6x 10.1x 10.5x 11.4x
2005 2006 2007 2008 2009 2010 2011 2012 2013 2014
Median: 10.3x
11.6x12.8x
11.3x
8.3x6.8x
10.5x 11.7x 10.8x11.9x
13.5x
2005 2006 2007 2008 2009 2010 2011 2012 2013 2014
Median: 11.4x
11.9x 12.3x
9.0x 8.6x7.3x
12.9x10.9x
9.5x
12.8x 12.6x
2005 2006 2007 2008 2009 2010 2011 2012 2013 2014
Median: 11.4x

William Blair & Company
Supply Chain Services Investment Banking
Public Comparables – Annual EBITDA Multiples 35
Technology Distribution
EV/LTM EBITDA Key Statistics
Median: 7.2x High: 9.5x Low: 5.9x
Note: See page 39 for comparable group.
Energy / Oil & Gas Distribution
EV/LTM EBITDA Key Statistics
Median: 13.2x High: 16.3x Low: 9.8x
Note: See page 40 for comparable group.
Specialty Chemicals Distribution
EV/LTM EBITDA Key Statistics
Median: 9.3x
High: 10.6x
Low: 7.6x
Note: See page 41 for comparable group.
Source: CapIQ.
9.3x 9.5x 8.9x
6.1x 6.3x 7.3x 5.9x 6.0x 7.1x 7.8x
2005 2006 2007 2008 2009 2010 2011 2012 2013 2014
Median: 7.2x
13.7x 12.1x 12.7x
10.9x 9.8x
12.8x 13.8x15.1x 15.8x 16.3x
2005 2006 2007 2008 2009 2010 2011 2012 2013 2014
Median: 13.2x
9.0x 9.4x10.3x
8.6x7.6x
9.7x8.8x 9.2x
10.3x 10.6x
2005 2006 2007 2008 2009 2010 2011 2012 2013 2014
Median: 9.3x
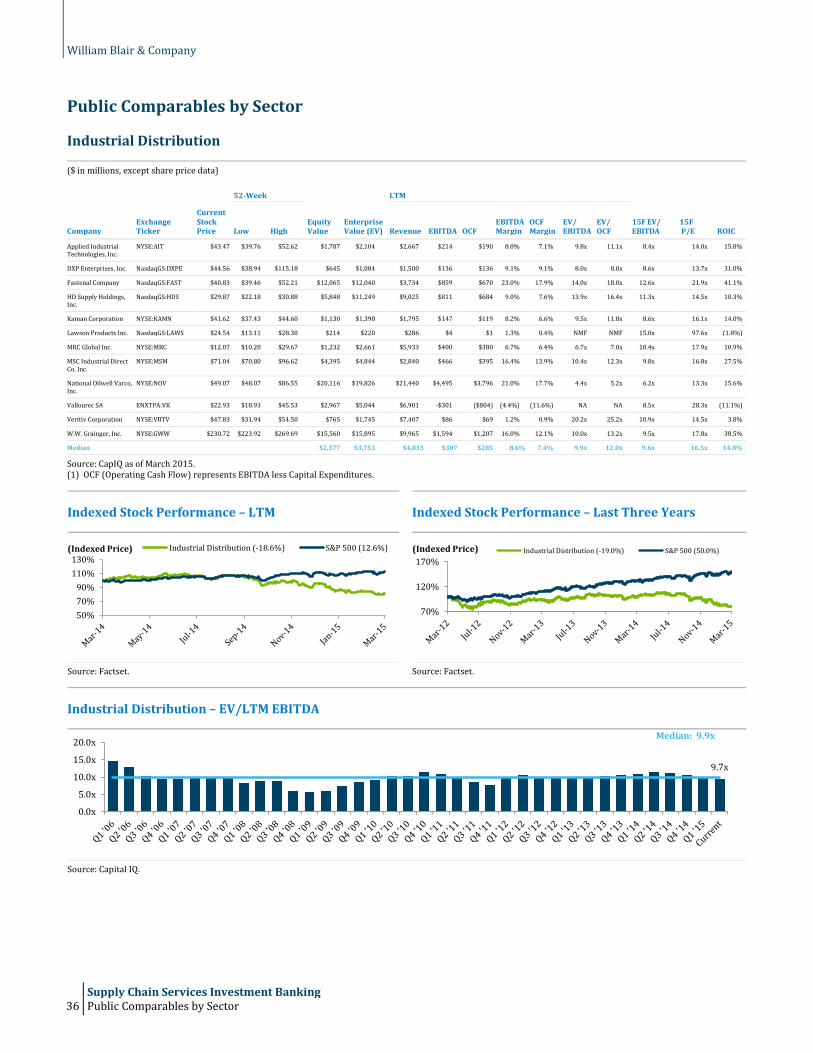
William Blair & Company
Supply Chain Services Investment Banking 36 Public Comparables by Sector
Public Comparables by Sector
Industrial Distribution
($ in millions, except share price data)
52-Week LTM
Company Exchange Ticker
Current Stock Price Low High
Equity Value
Enterprise Value (EV) Revenue EBITDA OCF
EBITDA Margin
OCF Margin
EV/ EBITDA
EV/ OCF
15F EV/ EBITDA
15F P/E ROIC
Applied Industrial Technologies, Inc.
NYSE:AIT $43.47 $39.76 $52.62 $1,787 $2,104 $2,667 $214 $190 8.0% 7.1% 9.8x 11.1x 8.4x 14.0x 15.8%
DXP Enterprises, Inc. NasdaqGS:DXPE $44.56 $38.94 $115.18 $645 $1,084 $1,500 $136 $136 9.1% 9.1% 8.0x 8.0x 8.6x 13.7x 31.0%
Fastenal Company NasdaqGS:FAST $40.83 $39.46 $52.21 $12,065 $12,040 $3,734 $859 $670 23.0% 17.9% 14.0x 18.0x 12.6x 21.9x 41.1%
HD Supply Holdings, Inc.
NasdaqGS:HDS $29.87 $22.18 $30.88 $5,848 $11,249 $9,025 $811 $684 9.0% 7.6% 13.9x 16.4x 11.3x 14.5x 10.3%
Kaman Corporation NYSE:KAMN $41.62 $37.43 $44.60 $1,130 $1,398 $1,795 $147 $119 8.2% 6.6% 9.5x 11.8x 8.6x 16.1x 14.0%
Lawson Products Inc. NasdaqGS:LAWS $24.54 $13.11 $28.30 $214 $220 $286 $4 $1 1.3% 0.4% NMF NMF 15.0x 97.6x (1.8%)
MRC Global Inc. NYSE:MRC $12.07 $10.20 $29.67 $1,232 $2,661 $5,933 $400 $380 6.7% 6.4% 6.7x 7.0x 10.4x 17.9x 10.9%
MSC Industrial Direct Co. Inc.
NYSE:MSM $71.04 $70.80 $96.62 $4,395 $4,844 $2,840 $466 $395 16.4% 13.9% 10.4x 12.3x 9.8x 16.8x 27.5%
National Oilwell Varco, Inc.
NYSE:NOV $49.07 $48.07 $86.55 $20,116 $19,826 $21,440 $4,495 $3,796 21.0% 17.7% 4.4x 5.2x 6.2x 13.3x 15.6%
Vallourec SA ENXTPA:VK $22.93 $18.93 $45.53 $2,967 $5,044 $6,901 -$301 ($804) (4.4%) (11.6%) NA NA 8.5x 28.3x (11.1%)
Veritiv Corporation NYSE:VRTV $47.83 $31.94 $54.50 $765 $1,745 $7,407 $86 $69 1.2% 0.9% 20.2x 25.2x 10.9x 14.5x 3.8%
W.W. Grainger, Inc. NYSE:GWW $230.72 $223.92 $269.69 $15,560 $15,895 $9,965 $1,594 $1,207 16.0% 12.1% 10.0x 13.2x 9.5x 17.8x 38.5%
Median $2,377 $3,753 $4,833 $307 $285 8.6% 7.4% 9.9x 12.0x 9.6x 16.5x 14.8%
Source: CapIQ as of March 2015. (1) OCF (Operating Cash Flow) represents EBITDA less Capital Expenditures.
Indexed Stock Performance – LTM Indexed Stock Performance – Last Three Years
Source: Factset. Source: Factset.
Industrial Distribution – EV/LTM EBITDA
Source: Capital IQ.
50%70%90%
110%130%
Industrial Distribution (-18.6%) S&P 500 (12.6%)(Indexed Price)
70%
120%
170%Industrial Distribution (-19.0%) S&P 500 (50.0%)(Indexed Price)
9.7x
0.0x
5.0x
10.0x
15.0x
20.0xMedian: 9.9x

William Blair & Company
Supply Chain Services Investment Banking
Public Comparables by Sector 37
Transportation & Heavy Equipment Distribution
($ in millions, except share price data)
52-Week LTM
Company Exchange Ticker
Current Stock Price Low High
Equity Value
Enterprise Value (EV) Revenue EBITDA OCF
EBITDA Margin
OCF Margin
EV/ EBITDA
EV/ OCF
15F EV/ EBITDA
15F P/E ROIC
AAR Corp. NYSE:AIR $32.99 $22.37 $33.05 $1,313 $1,823 $1,939 $204 $174.3 10.5% 9.0% 9.0x 10.5x 8.0x 20.5x 8.0%
B/E Aerospace Inc. NasdaqGS:BEAV $61.23 $53.30 $101.13 $6,488 $8,385 $2,599 $465 $209.2 17.9% 8.0% 18.0x NMF 13.7x 19.9x 17.6%
Finning International Inc.
TSX:FTT $18.87 $16.05 $26.85 $3,253 $4,030 $5,974 $620 $549.9 10.4% 9.2% 6.5x 7.3x 7.4x 13.5x 14.5%
Genuine Parts Company
NYSE:GPC $94.47 $82.15 $109.00 $14,425 $15,104 $15,342 $1,273 $1,164.9 8.3% 7.6% 11.9x 13.0x 10.9x 19.4x 29.5%
HEICO Corporation NYSE:HEI $59.76 $46.03 $64.38 $3,490 $3,968 $1,134 $268 $251.4 23.6% 22.2% 14.8x 15.8x 13.8x 29.5x 18.4%
LKQ Corp. NasdaqGS:LKQ $24.42 $22.90 $29.84 $7,426 $9,181 $6,740 $790 $649.2 11.7% 9.6% 11.6x 14.1x 10.1x 16.7x 14.7%
Titan Machinery, Inc. NasdaqGS:TITN $12.77 $10.69 $20.40 $267 $1,192 $2,118 $84 $68.7 4.0% 3.2% 14.2x 17.4x 23.5x NMF 8.9%
Triumph Group, Inc. NYSE:TGI $58.17 $51.18 $72.31 $2,935 $4,343 $3,745 $428 $297.8 11.4% 8.0% 10.2x 14.6x 6.7x 9.6x 8.6%
Wesco Aircraft Holdings, Inc.
NYSE:WAIR $15.35 $11.98 $22.98 $1,485 $2,477 $1,505 $210 $199.6 13.9% 13.3% 11.8x 12.4x 10.0x 11.4x 8.9%
Median $3,253 $4,030 $2,599 $428 $251.4 11.4% 9.0% 11.8x 13.6x 10.1x 18.0x 14.5%
Source: CapIQ as of March 2015. (1) OCF (Operating Cash Flow) represents EBITDA less Capital Expenditures.
Indexed Stock Performance – LTM Indexed Stock Performance – Last Three Years
Source: Factset. Source: Factset.
Transportation & Heavy Equipment – EV/LTM EBITDA
Source: Capital IQ.
80%
100%
120%
Transportation & Heavy (-2.2%) S&P 500 (12.6%)(Indexed Price)
70%
120%
170%Transportation & Heavy (32.5%) S&P 500 (50.0%)(Indexed Price)
12.0x
0.0x5.0x
10.0x15.0x20.0x
Median: 11.2x

William Blair & Company
Supply Chain Services Investment Banking 38 Public Comparables by Sector
Building Products & Construction Distribution
($ in millions, except share price data)
52-Week LTM
Company Exchange Ticker
Current Stock Price Low High
Equity Value
Enterprise Value (EV) Revenue EBITDA OCF
EBITDA Margin
OCF Margin
EV/ EBITDA
EV/ OCF
15F EV/ EBITDA
15F P/E ROIC
Beacon Roofing Supply NasdaqGS:BECN $28.34 $23.04 $40.10 $1,403 $1,628 $2,371 $126 $91.1 5.3% 3.8% 12.9x 17.9x 9.8x 19.9x 9.2%
Builders FirstSource. NasdaqGS:BLDR $6.00 $4.85 $9.40 $589 $955 $1,604 $61 $34.9 3.8% 2.2% 15.8x 27.4x 10.7x 17.4x 13.0%
Houston Wire & Cable Company
NasdaqGS:HWCC $9.37 $9.29 $14.00 $163 $220 $390 $28 $26.2 7.3% 6.7% 7.8x 8.4x 10.7x 15.6x 15.4%
Pool Corp. NasdaqGS:POOL $69.33 $51.61 $70.69 $3,024 $3,333 $2,247 $204 $186.9 9.1% 8.3% 16.3x 17.8x 14.5x 24.6x 33.3%
Watsco NYSE:WSO $120.39 $84.28 $121.66 $3,897 $4,424 $3,945 $324 $302.2 8.2% 7.7% 13.7x 14.6x 12.6x 23.8x 21.3%
WESCO International NYSE:WCC $68.19 $65.38 $93.07 $3,039 $4,362 $7,890 $524 $503.2 6.6% 6.4% 8.3x 8.7x 8.0x 12.8x 14.2%
Wolseley plc LSE:WOS $60.48 $43.74 $60.81 $15,549 $16,644 $22,170 $1,430 $1,122.8 6.5% 5.1% 11.6x 14.8x 11.0x 17.0x 18.8%
Median $3,024 $3,333 $2,371 $204 $186.9 6.6% 6.4% 12.9x 14.8x 10.7x 17.4x 15.4%
Source: CapIQ as of March 2015. (1) OCF (Operating Cash Flow) represents EBITDA less Capital Expenditures.
Indexed Stock Performance – LTM Indexed Stock Performance – Last Three Years
Source: Factset. Source: Factset.
Construction – EV/LTM EBITDA
Source: Capital IQ.
80%
100%
120%Construction (5.8%) S&P 500 (12.6%)(Indexed Price)
70%
120%
170%Construction (44.4%) S&P 500 (50.0%)(Indexed Price)
14.1x
0.0x5.0x
10.0x15.0x20.0x
Median: 10.6x

William Blair & Company
Supply Chain Services Investment Banking
Public Comparables by Sector 39
Technology Distribution
($ in millions, except share price data)
52-Week LTM
Company Exchange Ticker
Current Stock Price Low High
Equity Value
Enterprise Value (EV) Revenue EBITDA OCF
EBITDA Margin
OCF Margin
EV/ EBITDA
EV/ OCF
15F EV/ EBITDA
15F P/E ROIC
Anixter International NYSE:AXE $76.82 $73.34 $105.84 $2,525 $3,640 $6,446 $402 $361.3 6.2% 5.6% 9.1x 10.1x 8.7x 13.0x 15.8%
Arrow Electronics NYSE:ARW $59.68 $45.47 $63.78 $5,708 $7,402 $22,769 $1,036 $913.6 4.6% 4.0% 7.1x 8.1x 6.9x 9.5x 14.1%
Avnet NYSE:AVT $44.39 $35.53 $48.18 $6,054 $7,252 $28,124 $1,050 $890.4 3.7% 3.2% 6.9x 8.1x 6.4x NA 14.2%
Black Box Corporation NasdaqGS:BBOX $21.60 $19.34 $26.60 $332 $476 $986 $56 $47.8 5.7% 4.9% 8.5x 9.9x 7.5x 11.0x 7.4%
Ingram Micro NYSE:IM $23.28 $22.22 $30.96 $3,637 $4,357 $46,487 $763 $674.8 1.6% 1.5% 5.7x 6.5x 4.9x 8.2x 11.7%
Insight Enterprises NasdaqGS:NSIT $27.25 $21.59 $31.94 $1,083 $1,105 $5,316 $180 $170.3 3.4% 3.2% 6.1x 6.5x 5.8x 12.5x 17.9%
Premier Farnell plc LSE:PFL $2.80 $2.17 $3.57 $1,028 $1,397 $1,597 $164 $152.5 10.3% 9.5% 8.5x 9.2x 8.7x 12.9x 24.8%
ScanSource NasdaqGS:SCSC $37.63 $31.32 $42.99 $1,078 $962 $3,040 $119 $93.9 3.9% 3.1% 8.1x 10.2x 7.4x 13.7x 13.4%
Tech Data Corp. NasdaqGS:TECD $54.60 $52.22 $71.31 $2,089 $2,023 $28,304 $318 $301.0 1.1% 1.1% 6.4x 6.7x 5.4x 10.4x 7.9%
Universal Power Group
OTCPK:UPGI $2.00 $1.41 $2.48 $10 $16 $87 $2 $1.4 1.7% 1.6% 10.7x 11.4x NA NA 1.8%
Median $1,586 $1,710 $5,881 $249 $235.7 3.8% 3.2% 7.6x 8.7x 6.9x 11.8x 13.8%
Source: CapIQ as of March 2015. (1) OCF (Operating Cash Flow) represents EBITDA less Capital Expenditures.
Indexed Stock Performance – LTM Indexed Stock Performance – Last Three Years
Source: Factset. Source: Factset.
Technology – EV/LTM EBITDA
Source: Capital IQ.
80%
100%
120%
Tecnology Distribution (-3.0%) S&P 500 (12.6%)(Indexed Price)
70%
120%
170%Tecnology Distribution (24.0%) S&P 500 (50.0%)(Indexed Price)
7.5x
0.0x2.0x4.0x6.0x8.0x
10.0x12.0x
Median: 7.1x

William Blair & Company
Supply Chain Services Investment Banking 40 Public Comparables by Sector
Energy / Oil & Gas Distribution
($ in millions, except share price data)
52-Week LTM
Company Exchange Ticker
Current Stock Price Low High
Equity Value
Enterprise Value (EV) Revenue EBITDA OCF
EBITDA Margin
OCF Margin
EV/ EBITDA
EV/ OCF
15F EV/ EBITDA
15F P/E ROIC
DCP Midstream Partners LP
NYSE:DPM $36.20 $35.10 $57.98 $4,125 $6,462 $3,488 $567 $229.0 16.3% 6.6% 11.4x 28.2x 10.1x 13.2x 9.0%
Enbridge Inc. TSX:ENB $46.22 $36.82 $50.93 $39,367 $75,729 $32,503 $4,125 ($4,962.6) 12.7% (15.3%) 18.4x NA 15.7x 26.4x 5.8%
Energy Transfer Partners, L.P.
NYSE:ETP $54.41 $53.01 $69.66 $19,451 $44,545 $51,158 $3,605 ($553.0) 7.0% (1.1%) 12.4x NA 9.1x 17.8x 6.8%
Global Partners LP NYSE:GLP $35.07 $30.45 $45.75 $1,073 $1,727 $17,270 $254 $158.7 1.5% 0.9% 6.8x 10.9x 7.7x 15.2x 13.4%
Martin Midstream Partners LP
NasdaqGS:MMLP $32.29 $24.03 $43.89 $1,145 $2,061 $1,642 $141 $57.2 8.6% 3.5% 14.6x NMF 10.6x 26.1x 5.2%
Suburban Propane Partners, L.P.
NYSE:SPH $44.00 $39.91 $48.61 $2,660 $3,842 $1,835 $332 $303.3 18.1% 16.5% 11.6x 12.7x 11.2x 17.3x 8.7%
Median $3,393 $5,152 $10,379 $449 $107.9 10.7% 2.2% 12.0x 12.7x 10.3x 17.5x 7.7%
Source: CapIQ as of March 2015. (1) OCF (Operating Cash Flow) represents EBITDA less Capital Expenditures.
Indexed Stock Performance – LTM Indexed Stock Performance – Last Three Years
Source: Factset. Source: Factset.
Energy / Oil & Gas – EV/LTM EBITDA
Source: Capital IQ.
80%
100%
120%Energy, Oil, & Gas (4.5%) S&P 500 (12.6%)(Indexed Price)
70%
120%
170%Energy, Oil, & Gas (19.6%) S&P 500 (50.0%)(Indexed Price)
11.6x
0.0x5.0x
10.0x15.0x20.0x25.0x
Median: 13.0x

William Blair & Company
Supply Chain Services Investment Banking
Public Comparables by Sector 41
Specialty Chemicals Distribution
($ in millions, except share price data)
52-Week LTM
Company Exchange Ticker
Current Stock Price Low High
Equity Value
Enterprise Value (EV) Revenue EBITDA OCF
EBITDA Margin
OCF Margin
EV/ EBITDA
EV/ OCF
15F EV/ EBITDA
15F P/E ROIC
Aceto Corp. NasdaqGS:ACET $21.25 $16.52 $23.78 $619 $688 $519 $49 $48.0 9.5% 9.3% 14.0x 14.3x NA 18.0x 11.4%
Airgas NYSE:ARG $114.84 $101.36 $119.00 $8,627 $11,030 $5,271 $970 $533.7 18.4% 10.1% 11.4x 20.7x 10.4x 21.3x 16.8%
Air Products & Chemicals
NYSE:APD $152.00 $114.28 $158.20 $32,570 $38,866 $10,454 $2,662 $922.5 25.5% 8.8% 14.6x NMF 13.0x 22.5x 13.6%
AmeriGas Partners LP NYSE:APU $47.50 $40.96 $52.72 $4,412 $6,994 $3,556 $473 $351.9 13.3% 9.9% 14.8x 19.9x 10.7x 17.4x 7.9%
Brenntag AG XTRA:BNR $58.05 $36.25 $58.32 $8,969 $10,535 $12,394 $879 $750.3 7.1% 6.1% 12.0x 14.0x 12.5x 21.2x 15.7%
Ferrellgas Partners LP NYSE:FGP $22.98 $21.24 $28.70 $1,901 $3,416 $2,230 $242 $182.5 10.8% 8.2% 14.1x 18.7x 11.1x 23.3x 12.4%
Hawkins NasdaqGS:HWKN $38.29 $32.98 $45.13 $408 $373 $356 $41 $29.1 11.5% 8.2% 9.1x 12.8x NA 17.8x 15.3%
Innophos Holdings NasdaqGS:IPHS $55.29 $50.96 $63.29 $1,188 $1,287 $839 $142 $114.3 17.0% 13.6% 9.1x 11.3x 9.0x 17.3x 17.9%
L'Air Liquide SA ENXTPA:AI $126.99 $90.65 $127.73 $43,768 $50,712 $18,866 $4,688 $2,386.0 24.8% 12.6% 10.8x 21.3x 11.4x 22.5x 14.9%
Linde Aktiengesellschaft
DB:LIN $198.62 $145.57 $203.09 $36,878 $46,963 $20,634 $4,638 $2,269.6 22.5% 11.0% 10.1x 20.7x 10.7x 22.1x 8.2%
Praxair NYSE:PX $123.80 $117.32 $134.84 $35,752 $45,447 $12,273 $3,885 $2,196.0 31.7% 17.9% 11.7x 20.7x 11.6x 19.6x 18.3%
Median $8,627 $10,535 $5,271 $879 $533.7 17.0% 9.9% 11.7x 19.3x 11.1x 21.2x 14.9%
Source: CapIQ as of March 2015. (1) OCF (Operating Cash Flow) represents EBITDA less Capital Expenditures.
Indexed Stock Performance – LTM Indexed Stock Performance – Last Three Years
Source: Factset. Source: Factset.
Specialty Chemicals – EV/LTM EBITDA
Source: Capital IQ.
80%
100%
120%
Specialty Chemicals (6.5%) S&P 500 (12.6%)(Indexed Price)
70%
120%
170%Specialty Chemicals (27.0%) S&P 500 (50.0%)(Indexed Price)
12.6x
0.0x
5.0x
10.0x
15.0x
Median: 9.6x

William Blair & Company
Supply Chain Services Investment Banking 42 Public Comparables by Sector
Stock Price Performance – LTM
Source: FactSet.
Stock Price Performance – Last Three Years
Source: FactSet.
75
80
85
90
95
100
105
110
115
120
125
Construction (5.6%) Energy / Oil & Gas (4.5%) Industrial (-18.6%)Specialty Chemicals (6.5%) Technology (-3.0%) Transportation & Heavy Equip (-2.2%)S&P 500 (12.6%)
(Indexed Price)
4.5%
(3.0%)
5.6%
(2.2%)
6.5%
(18.6%)
12.6%
70
80
90
100
110
120
130
140
150
160
170
Construction (47.5%) Energy / Oil & Gas (23.6%) Industrial (-8.0%) Specialty Chemicals (26.0%)
Technology (18.8%) Transportation (34.2%) S&P 500 (50.0%)(Indexed Price)
23.6%18.8%
47.5%
34.2%26.0%
(8.0)%
50.0%
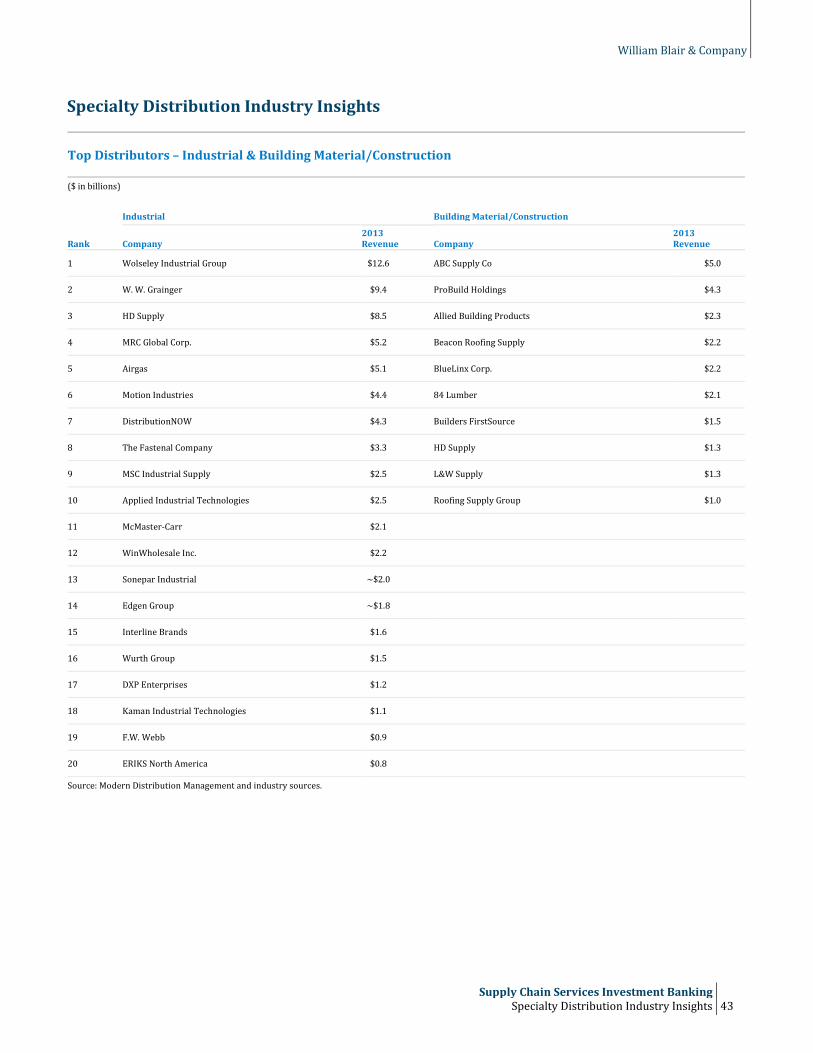
William Blair & Company
Supply Chain Services Investment Banking
Specialty Distribution Industry Insights 43
Specialty Distribution Industry Insights
Top Distributors – Industrial & Building Material/Construction
($ in billions)
Industrial Building Material/Construction
Rank Company 2013 Revenue Company
2013 Revenue
1 Wolseley Industrial Group $12.6 ABC Supply Co $5.0
2 W. W. Grainger $9.4 ProBuild Holdings $4.3
3 HD Supply $8.5 Allied Building Products $2.3
4 MRC Global Corp. $5.2 Beacon Roofing Supply $2.2
5 Airgas $5.1 BlueLinx Corp. $2.2
6 Motion Industries $4.4 84 Lumber $2.1
7 DistributionNOW $4.3 Builders FirstSource $1.5
8 The Fastenal Company $3.3 HD Supply $1.3
9 MSC Industrial Supply $2.5 L&W Supply $1.3
10 Applied Industrial Technologies $2.5 Roofing Supply Group $1.0
11 McMaster-Carr $2.1
12 WinWholesale Inc. $2.2
13 Sonepar Industrial ~$2.0
14 Edgen Group ~$1.8
15 Interline Brands $1.6
16 Wurth Group $1.5
17 DXP Enterprises $1.2
18 Kaman Industrial Technologies $1.1
19 F.W. Webb $0.9
20 ERIKS North America $0.8
Source: Modern Distribution Management and industry sources.

William Blair & Company
Supply Chain Services Investment Banking 44 Specialty Distribution Industry Insights
2015 Revenue Outlook by Subsector
Up More than 10% Up 5%-10% Up Less than 5% Flat Down Less than 5% Down 5%-10%
Building Materials 29.8% 46.8% 19.2% 4.3% 0.0% 0.0%
Chemicals & Plastics 23.8% 71.4% 4.8% 0.0% 0.0% 0.0%
Consumer Products 33.3% 61.2% 0.0% 4.8% 0.0% 0.0%
Electrical / Electronics 30.8% 56.4% 10.3% 2.3% 0.0% 0.0%
Grocery/ Foodservice* 55.6% 44.4% 0.0% 0.0% 0.0% 0.0%
HVACR / Plumbing 33.3% 54.6% 12.1% 0.0% 0.0% 0.0%
Industrial 26.0% 58.3% 6.3% 7.3% 2.1% 0.0%
Janitorial Supplies 25.0% 58.3% 12.5% 0.0% 4.2% 0.0%
Oil & Gas Products 29.6% 63.0% 3.8% 3.8% 0.0% 0.0%
Pharmaceutical* 0.0% 100.0% 0.0% 0.0% 0.0% 0.0%
Pulp & Paper 26.1% 73.9% 0.0% 0.0% 0.0% 0.0%
Safety Products 33.3% 47.1% 9.8% 7.8% 1.2% 0.0%
Source: Modern Distribution Management. * Denotes few than 20 respondents in the sample.
Distribution Industry by Sector – 2013 Top 5 Sectors by Revenue Growth (2014 Growth)
1. Oil & Gas Products
2. Grocery & Foodservice
3. Pharmaceutical 4. Industrial
5. Electrical & Electronics
6. Motor Vehicles & Parts
7. Computer Equipment & Software
8. Other Consumer Products
9. Agricultural Products
10. Misc. Durable Goods
11. Commercial Equipment & Supplies
12. Metal Service Centers
13. Apparel & Piece Goods
14. Beer, Wine & Liquor
15. Chemicals & Plastics 16. Building Material & Construction
17. Hardware, Plumbing & Heating
18. Office Products 19. Furniture & Home Furnishings
Source: Modern Distribution Management. Source: Modern Distribution Management.
14.6%
11.5%
8.5%
8.3%
8.2%7.7%
5.0%
5.0%
4.9%
4.4%
3.8%
3.0%
2.8%2.5%
2.4%2.3%
2.3%1.8% 1.2%
11.9%
9.0%8.4%
7.7%
6.5%
12.8%
2.9%
6.4%
4.5%
11.8%
0.0%
2.0%
4.0%
6.0%
8.0%
10.0%
12.0%
14.0%
BuildingMaterial &
Construction
MotorVehicles& Parts
Hardware,Plumbing& Heating
Oil &Gas Products
IndustrialDistributors
2014 Growth 2013 Growth2013 Industry Average 2014 Industry Average
Key Economic Data

William Blair & Company
Supply Chain Services Investment Banking 45 Key Economic Data
Key Economic Data
Production Metrics
Industrial Production Index ISM Manufacturing: PMI Composite Index
Source: Federal Reserve Board/Haver Analytics. Source: Institute for Supply Management/Haver Analytics.
Manufacturers’ Inventories: All Industries Merchant Wholesalers: Total Inventories
($ in millions) ($ in millions)
Source: Census Bureau/Haver Analytics. Source: Census Bureau/Haver Analytics.
0
20
40
60
80
100
120
010203040506070
$0$100,000$200,000$300,000$400,000$500,000$600,000$700,000
$0$100,000$200,000$300,000$400,000$500,000$600,000

William Blair & Company
Supply Chain Services Investment Banking
Key Economic Data 46
Construction Metrics
Housing Starts Total Residential Construction
(thousands of units) ($ in millions)
Source: Census Bureau/Haver Analytics. Source: Census Bureau/Haver Analytics.
Total Nonresidential Construction Architectural Billings Index (ABI)
($ in millions)
Source: Census Bureau/Haver Analytics. Source: American Institute of Architects/Haver Analytics.
0
500
1,000
1,500
2,000
2,500
$0$10,000$20,000$30,000$40,000$50,000$60,000$70,000
$0$100,000$200,000$300,000$400,000$500,000$600,000$700,000$800,000
30
40
50
60
70Expansion
Contraction
Current: 50.9
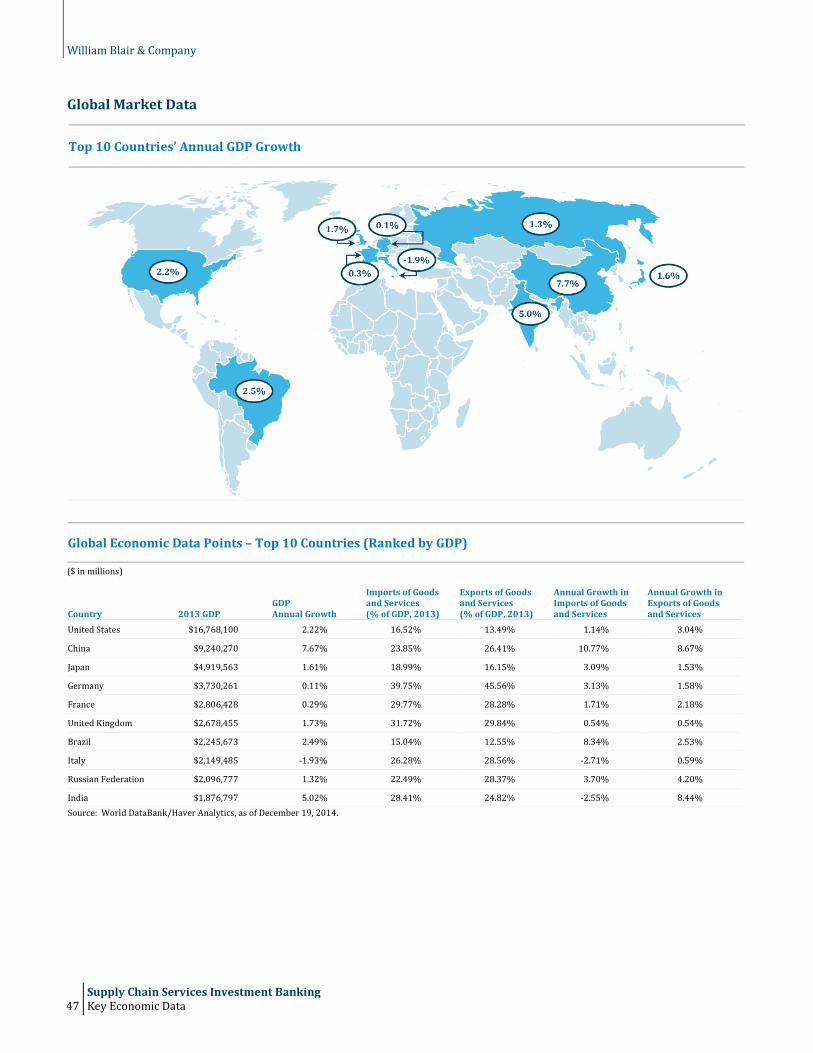
William Blair & Company
Supply Chain Services Investment Banking 47 Key Economic Data
Global Market Data
Top 10 Countries’ Annual GDP Growth
Global Economic Data Points – Top 10 Countries (Ranked by GDP)
($ in millions)
Country 2013 GDP GDP Annual Growth
Imports of Goods and Services (% of GDP, 2013)
Exports of Goods and Services (% of GDP, 2013)
Annual Growth in Imports of Goods and Services
Annual Growth in Exports of Goods and Services
United States $16,768,100 2.22% 16.52% 13.49% 1.14% 3.04%
China $9,240,270 7.67% 23.85% 26.41% 10.77% 8.67%
Japan $4,919,563 1.61% 18.99% 16.15% 3.09% 1.53%
Germany $3,730,261 0.11% 39.75% 45.56% 3.13% 1.58%
France $2,806,428 0.29% 29.77% 28.28% 1.71% 2.18%
United Kingdom $2,678,455 1.73% 31.72% 29.84% 0.54% 0.54%
Brazil $2,245,673 2.49% 15.04% 12.55% 8.34% 2.53%
Italy $2,149,485 -1.93% 26.28% 28.56% -2.71% 0.59%
Russian Federation $2,096,777 1.32% 22.49% 28.37% 3.70% 4.20%
India $1,876,797 5.02% 28.41% 24.82% -2.55% 8.44% Source: World DataBank/Haver Analytics, as of December 19, 2014.

William Blair & Company
Supply Chain Services Investment Banking
Key Economic Data 48
Sales / Consumer Metrics
Total Retail Sales Merchant Wholesalers Sales
($ in millions) ($ in millions)
Source: Census Bureau/Haver Analytics. Source: Census Bureau/Haver Analytics.
Retail E-Commerce Sales Total Retail Inventories
($ in millions) ($ in millions)
Source: Census Bureau/Haver Analytics. Source: Census Bureau/Haver Analytics.
$0
$100,000
$200,000
$300,000
$400,000
$500,000
$0
$100,000
$200,000
$300,000
$400,000
$500,000
$0
$20,000
$40,000
$60,000
$80,000
$100,000
$0
$100,000
$200,000
$300,000
$400,000
$500,000
$600,000

William Blair & Company
Supply Chain Services Investment Banking 49 Key Economic Data
Commodity Prices
Steel Prices Copper Prices
($/ton) ($/ton)
Source: Factset Research Systems. Source: Factset Research Systems.
Oil Prices Natural Gas
($/bbl) ($/million btu)
Source: Factset Research Systems. Source: Factset Research Systems.
$0
$200
$400
$600
$800
$1,000
$0
$2,000
$4,000
$6,000
$8,000
$10,000
$12,000
$0$20$40$60$80
$100$120$140$160
$0
$5
$10
$15
$20

William Blair & Company
Supply Chain Services Investment Banking
Key Economic Data 50
Key Economic Data
U.S. GDP Growth Rate U.S. Unemployment Rate
Source: Factset Research Systems. Source: Factset Research Systems.
Index of Consumer Sentiment 10-Year U.S. Treasuries Yield and CPI
Source: University of Michigan. Source: Factset Research Systems.
-7.5%
-5.0%
-2.5%
0.0%
2.5%
5.0%
7.5% Current: 5.0%
0.0%
2.0%
4.0%
6.0%
8.0%
10.0%
12.0% Current: 5.6%
0
20
40
60
80
100
120
(3.0%)
(1.0%)
1.0%
3.0%
5.0%
7.0% Yield Inflation
Current Yield: 2.5%Current Inflation: 1.4%

William Blair & Company
Supply Chain Services Investment Banking 51 Notes
Notes

William Blair & Company
William Blair is a trade name for William Blair & Company, L.L.C. and William Blair International, Limited. William Blair & Company, L.L.C., is a Delaware company and is regulated by the Securities and Exchange Commission, The Financial Industry Regulatory Authority, and other principal exchanges. William Blair International Limited is authorised and regulated by the Financial Conduct Authority ("FCA") in the United Kingdom. William Blair & Company® only offers products and services where it is permitted to do so. Some of these products and services are only offered to persons or institutions situated within the United States and are not offered to persons or institutions outside of the United States.
This material has been approved for distribution in the United Kingdom by William Blair International Limited, Regulated by the Financial Conduct Authority (FCA), and is directed only at, and is only made available to, persons falling within COB 3.5 and 3.6 of the FCA Handbook (being “Eligible Counterparties” and Professional Clients). This Document is not to be distributed or passed on to any “Retail Clients.” No persons other than persons to whom this document is directed should rely on it or its contents or use it as the basis to make an investment decision.
William Blair & Company | 222 West Adams Street | Chicago, Illinois 60606 | +1 312 236 1600 | williamblair.com
Supply Chain Services Investment Banking Disclosures 52
Disclosures

William Blair’s investment banking group combines significant transaction experience, rich industry knowledge, and deep relationships to deliver successful advisory and financing solutions to our global base of corporate clients. We serve both publicly traded and privately held companies, executing mergers and acquisitions, growth financing, financial restructuring, and general advisory projects. This comprehensive suite of services allows us to be a long-term partner to our clients as they grow and evolve. From 2010-2014, the investment banking group completed more than 330 merger-and-acquisition transactions worth $73 billion in value, involving parties in 36 countries and five continents, was an underwriter on more than 20% of all U.S. initial public offerings, and raised nearly $100 billion in public and private financing.
About William Blair Investment Banking