Supply Chain Management Supply Chain Management Toolkit.html.

Supply Chain Management 101The Importance of Supply Chain Management in Planning and Designing for Successful Freight
Systems
Kate VitasekManaging Partner, Supply Chain Visions
Faculty, University of Tennessee
© Supply Chain Visions 2010 – All Rights Reserved

1
Welcome - Kate Vitasek
Founder, Supply Chain Visions
andFaculty,
University of Tennessee
Thought Leader in Supply Chain ManagementWoman on the Move in Trade and Transportation” by the Journal of Commerce “Rainmaker” by DC Velocity MagazineWoman of International Influence” by Global Executive Woman MagazineStevie Award Finalist for Woman in Business for “Best Entrepreneur”Thought leader and “Resolute Benchmarker” by Supply Chain Management Review
Contributor/Author to 7 books and over 150 articles, including the Council of Supply Chain Management Professionals Supply Chain Process Standards
Served on Board of Directors for the Council of Supply Chain Management Professionals and Deliver Committee for Supply Chain Council
2
Session Topics
Introduction to Supply Chain Management
Case Study: Washington State DOT
Example Supply Chains
Interactive Working Session

SCM is like artMultiple terms exist Everyone has their own interpretationThe key is understanding the customer’s own terminology
SCM is a strategy“It is not about moving stuff”
SCM is not a fiefdomIt crosses organizations and functions and even companies
SCM is not rocket science Or is it?
Supply Chain Management (SCM) -Some Caveats
3
4
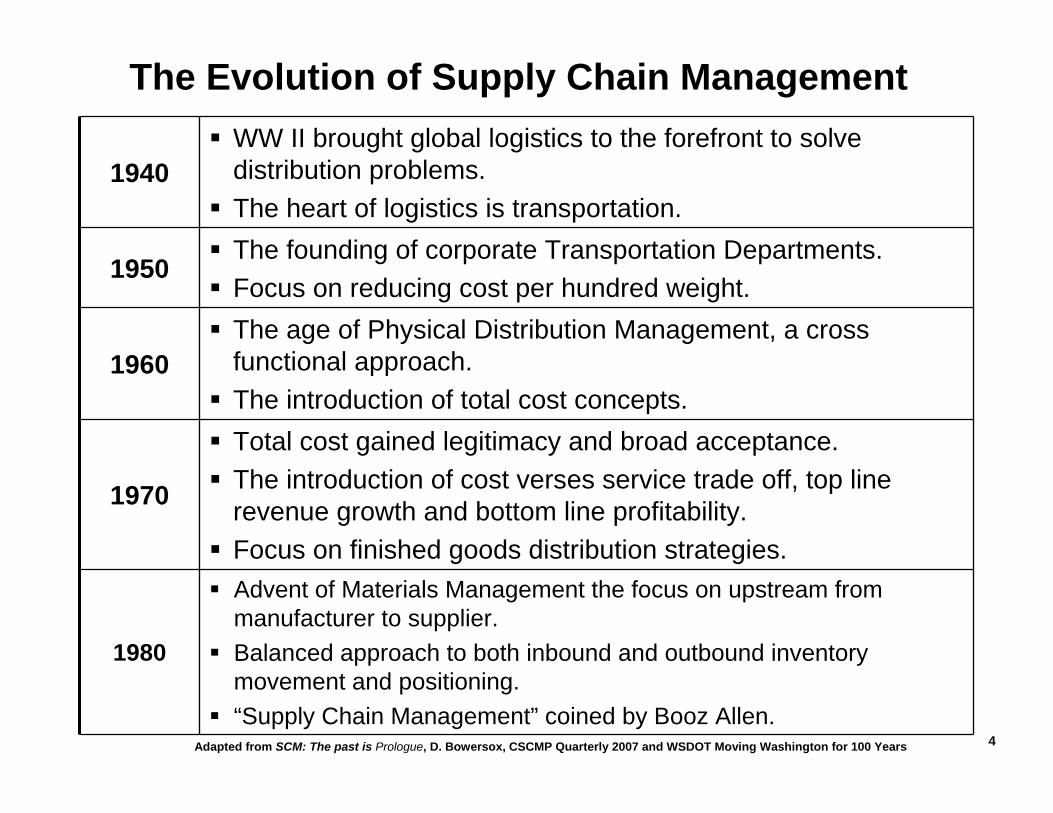
The Evolution of Supply Chain Management
1940WW II brought global logistics to the forefront to solve distribution problems.The heart of logistics is transportation.
1950The founding of corporate Transportation Departments.Focus on reducing cost per hundred weight.
1960The age of Physical Distribution Management, a cross functional approach.The introduction of total cost concepts.
1970
Total cost gained legitimacy and broad acceptance.The introduction of cost verses service trade off, top line revenue growth and bottom line profitability.Focus on finished goods distribution strategies.
1980
Advent of Materials Management the focus on upstream from manufacturer to supplier.Balanced approach to both inbound and outbound inventory movement and positioning.“Supply Chain Management” coined by Booz Allen.
Adapted from SCM: The past is Prologue, D. Bowersox, CSCMP Quarterly 2007 and WSDOT Moving Washington for 100 Years

5
The Evolution of Supply Chain Management
1990Senior leaders embrace the concept of end-to-end integration.The introduction of supply chain collaboration and alignment.
2000
Movement to customer centric supply chains that respond to customer demand verses anticipating it. Introduction of technology that allows collaboration, real-time responsiveness, operational excellence and interactive management. Council of Logistics Mgmt formally changes name to Council of Supply Chain Mgmt Professionals.
New Frontiers
Information-driven supply chains.Development of supply chains with a net-zero environmental impact.The development of interactive business models and extreme postponement strategies.
Adapted from SCM: The past is Prologue, D. Bowersox, CSCMP Quarterly 2007 and WSDOT Moving Washington for 100 Years

6
Supply Chain Management (SCM) Defined
Supply Chain Management encompasses the planning and management of all activities involved in sourcing and procurement, conversion, and all Logistics Management activities.
Importantly it also include coordination and collaboration with channel partners, which can be suppliers, intermediaries, third party service providers, and customers.
In essence, Supply Chain Management integrates supply and demandwithin and across companies.
Source: The National Council of Supply Chain Management Professionals
7
WIP WIP
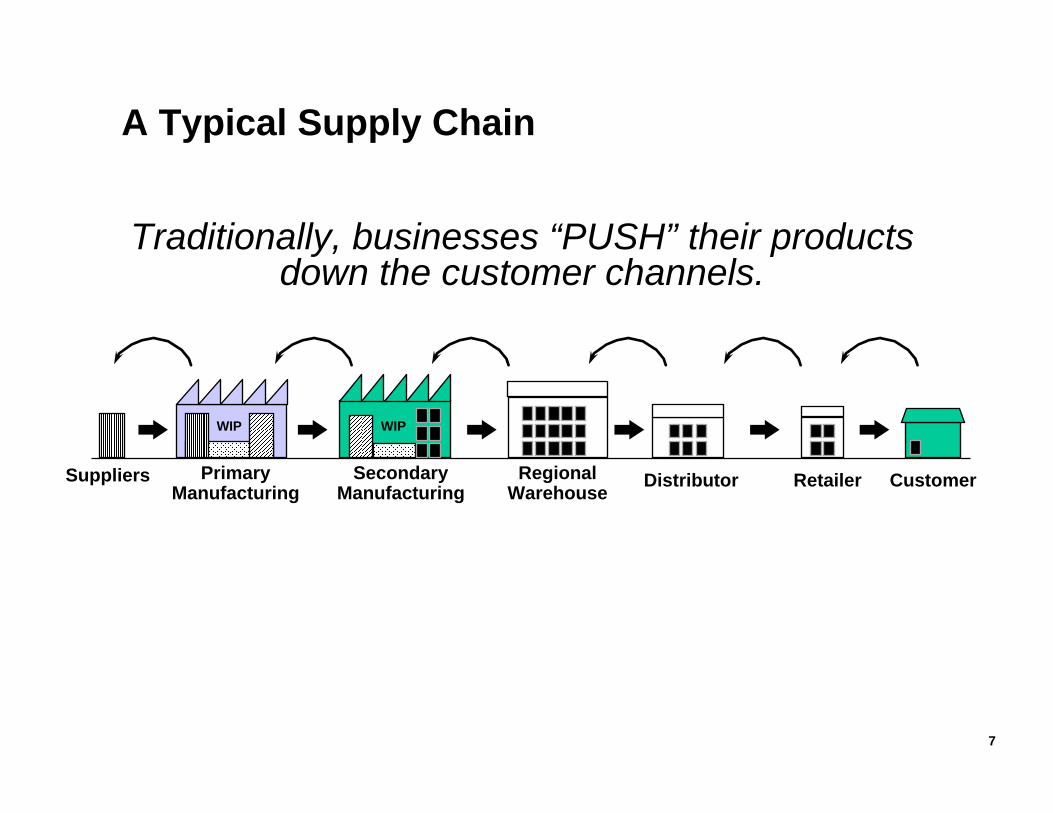
Suppliers PrimaryManufacturing
SecondaryManufacturing
RegionalWarehouse Distributor Retailer Customer
A Typical Supply Chain
Traditionally, businesses “PUSH” their products down the customer channels.
8
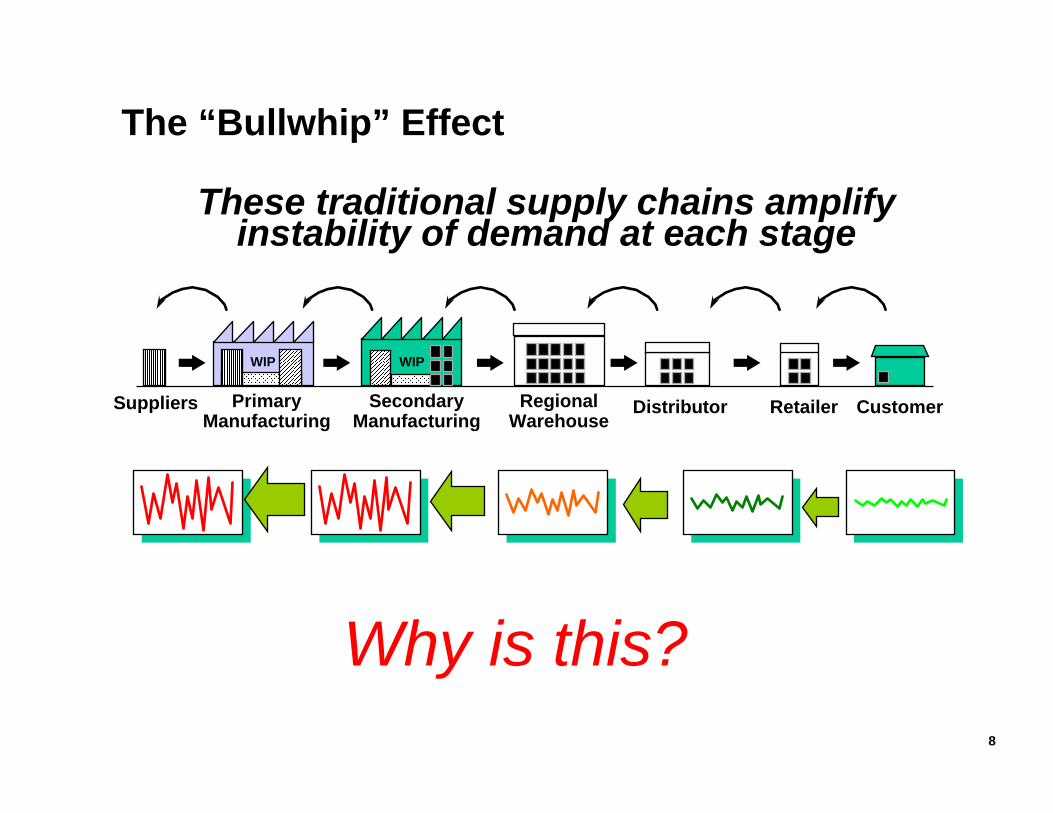
WIP WIP
Suppliers PrimaryManufacturing
SecondaryManufacturing
RegionalWarehouse
Distributor Retailer Customer
These traditional supply chains amplify instability of demand at each stage
The “Bullwhip” Effect
Why is this?
9
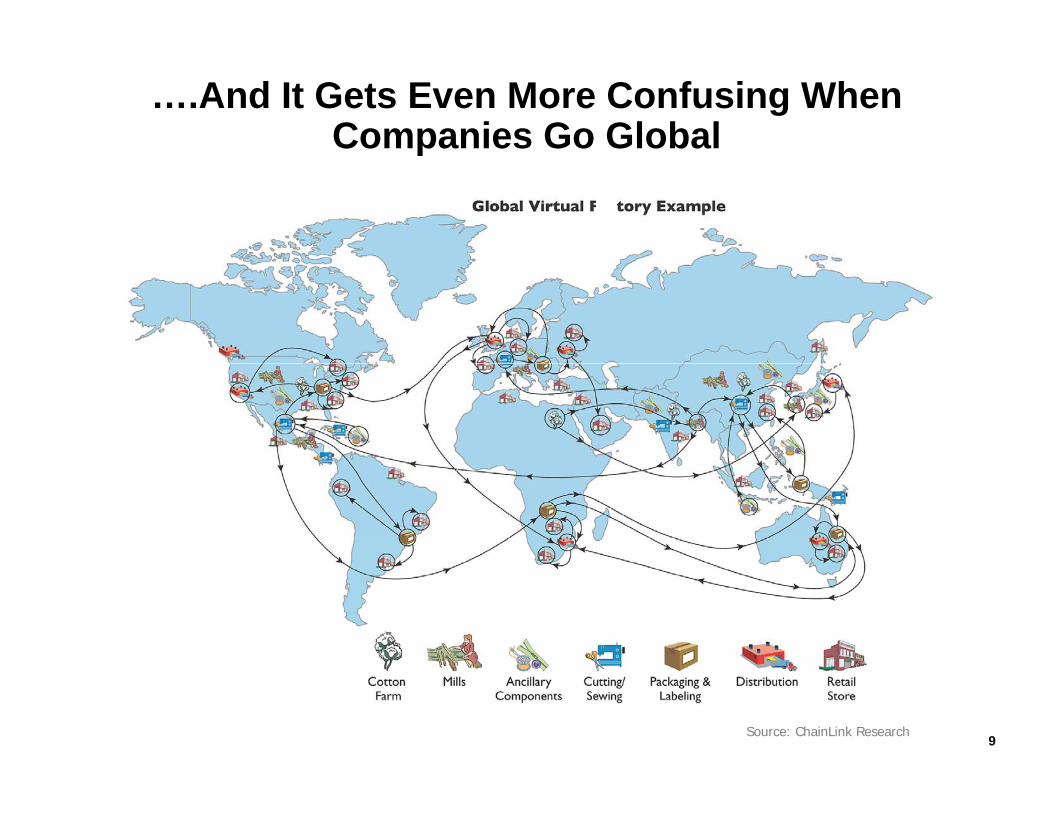
….And It Gets Even More Confusing When Companies Go Global
Source: ChainLink Research

10
The Problem
As customers expand worldwide, the supply chain requirements and capabilities expand.
Lead times expandMore costs are embedded into the enterpriseInformation flow is more complex and prone to errorWorking capital needs increase
As companies outsource, there are more and more touch points.

11
How Can Focusing on the Entire Supply Chain Help?

12
5. CUSTOMER SATISFACTION =REVENUE GROWTH
Supply Chain Management: The GOALS
1. WASTE ELIMINATION
2. TIME COMPRESSION
3. FLEXIBLE RESPONSE
4. UNIT COST REDUCTION
Which is the most important?
13
What’s the Big Deal?
What makes SCM so different from good old Transportation and Warehousing?
It’s much broader and more complicated – due to more ‘players’ and more functions.
It involves precise coordination and lots of cooperation and collaboration among firms and functions.
It requires an entirely new mindset of how to do things: focused on speed, quality, working together, sharing costs and savings.
It requires that functional silos be torn down.

14
The Evolution Will Continue
“I really do believe that supply chain management will be the defining discipline in the 21st
century.”
--Ralph DrayerFormer P&G Logistics Officer

Supply Chain ManagementProcesses and Participants

Supply Chain Participants
Suppliers. Source of raw materials, component parts, semi-manufactured products, and other items that occur early in the supply chain - unfinished or non-consumable products.
Manufacturers. Makers of products. Many consider them to be the heart of the supply chain.
Distributors. Responsible for the packaging, storing, and handling of materials at receiving docks, warehouses, and retail outlets.
Retailers. These are the manufacturer's customers - the stores that buy the actual products. Throughout this course, retailers will also be referred to simply as customers.
Consumers. This is the ultimate user - the person who goes into a store and buys the product.
SCM is made up of many participants that must work together within the supply chain
Who controls the supply chain?16

17
Supply Chain Partners
Freight Companies (local and national)RailroadsOcean Cargo Companies Package and Parcel Companies3PL/4PLs Brokers/Forwarders/ConsolidatorsPortsInland Drayage CompaniesAir Cargo Companies
Partners help Participants by providing infrastructure, equipment and labor when needed.

18
Supply Chain Processes
ForecastingPurchasingProduction PlanningInventory ControlWarehousingOrder ManagementDistributionTransportation
PlanningManufacturing
Distribution
Transportation
SCM is made up of many processes that must be performed within the supply chain. These form the foundational building blocks for the work to be done.

19
Supply Chain Processes - Defined
Forecasting: The process of estimating future demand using various techniques and methods.
Purchasing: The functions associated with buying the goods and services required by the firm.
Production Planning: The process that creates detailed plans and schedules to produce product, taking into account resource, material, and dependency constraints to meet deadlines.

20
Supply Chain Processes - Defined
Inventory Control: The process of ensuring the availability of products through inventory administration (accuracy, strategy & optimization).
Warehousing: The storing of goods and warehouse activities (receiving, put-away, picking, shipping, and inventory control).
Order Management: The planning, directing, monitoring, and controlling of the processes related to customer orders, manufacturing orders, and purchase orders.
Distribution: Outbound logistics, from the end of the production line to the end user. It includes all activities related to physical distribution, as well as the return of goods to the manufacturer.
21
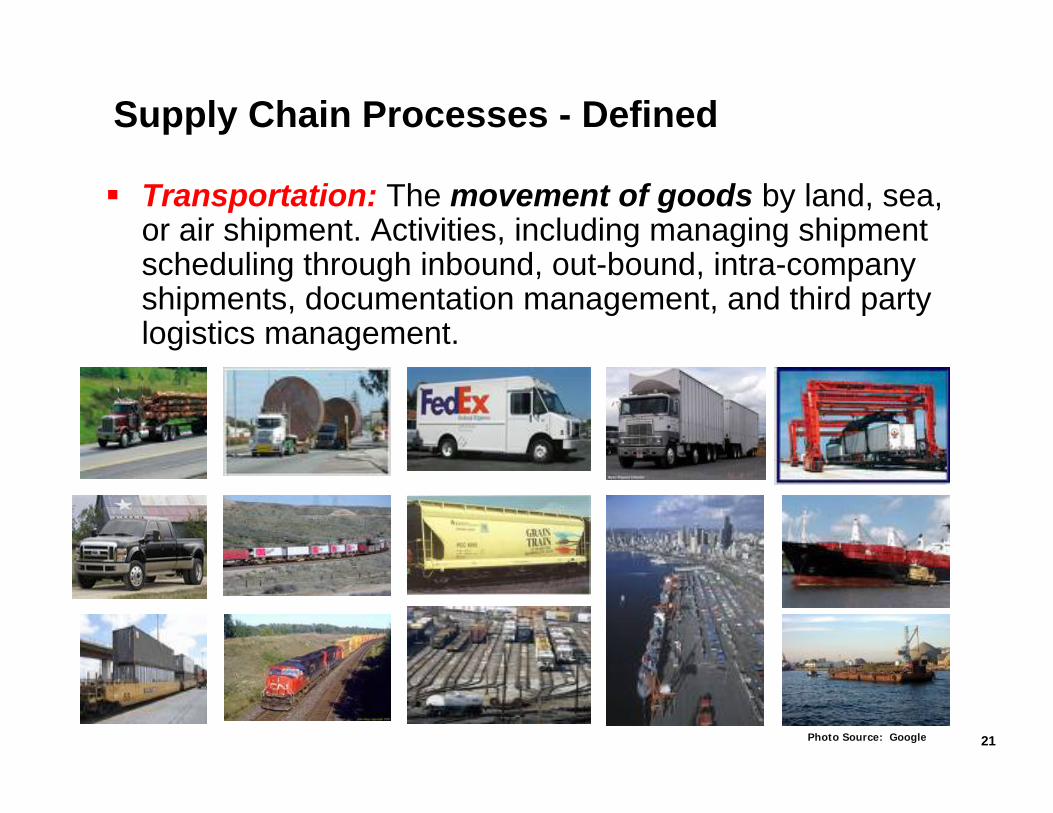
Supply Chain Processes - Defined
Transportation: The movement of goods by land, sea, or air shipment. Activities, including managing shipment scheduling through inbound, out-bound, intra-company shipments, documentation management, and third party logistics management.
Photo Source: Google

The Key is Figuring Out the Best Way That Participants and Processes
Should Work Together
23
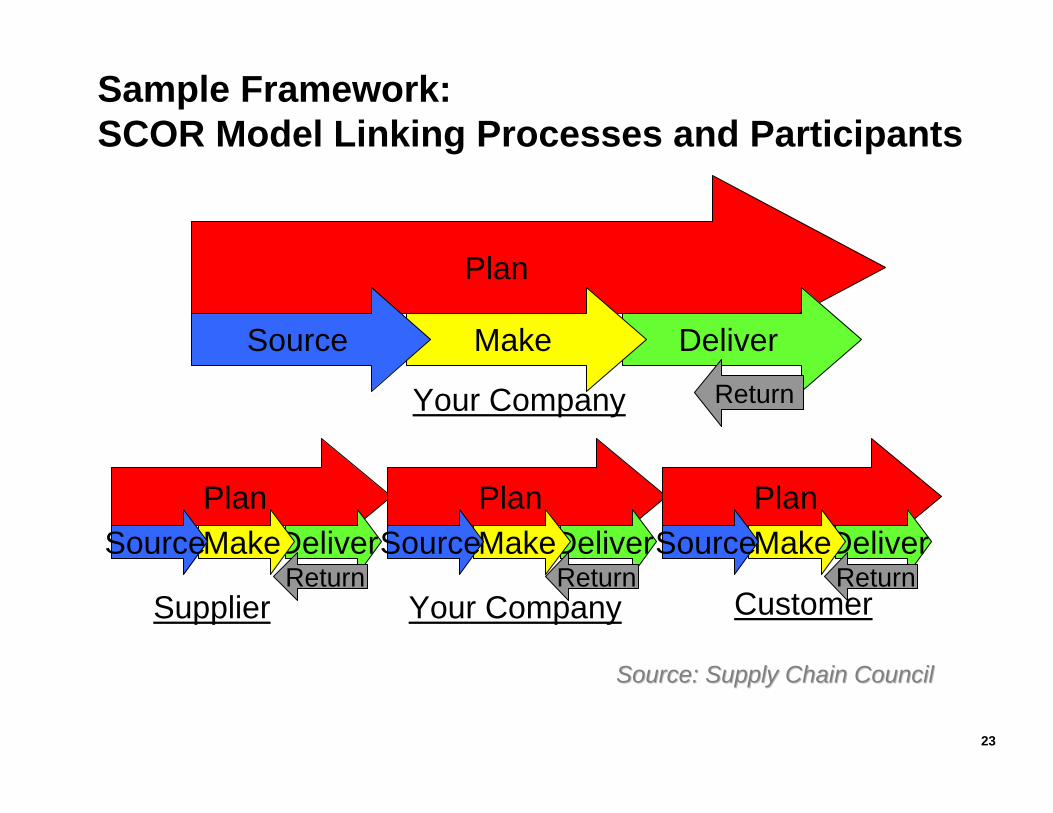
Plan
DeliverMakeSource
Your Company
PlanDeliverMakeSource
PlanDeliverMakeSource
PlanDeliverMakeSource
Your CompanySupplier Customer
Sample Framework: SCOR Model Linking Processes and Participants
Source: Supply Chain CouncilSource: Supply Chain Council
Return
ReturnReturnReturn

24
Session Topics
Introduction to Supply Chain Management
Case Study: Washington State DOT
Example Supply Chains
Interactive Working Session

Why Does Washington State Need a Strategic Plan for Freight Systems?
There are investment constraints:political, financial and economic.
Washington State’s freight systems strategic plan must:
Balance the cost of investments with resulting economic output;
Direct limited resources to their most productive use; and
Set clear priorities linked to the growth of jobs and the state’s economy.
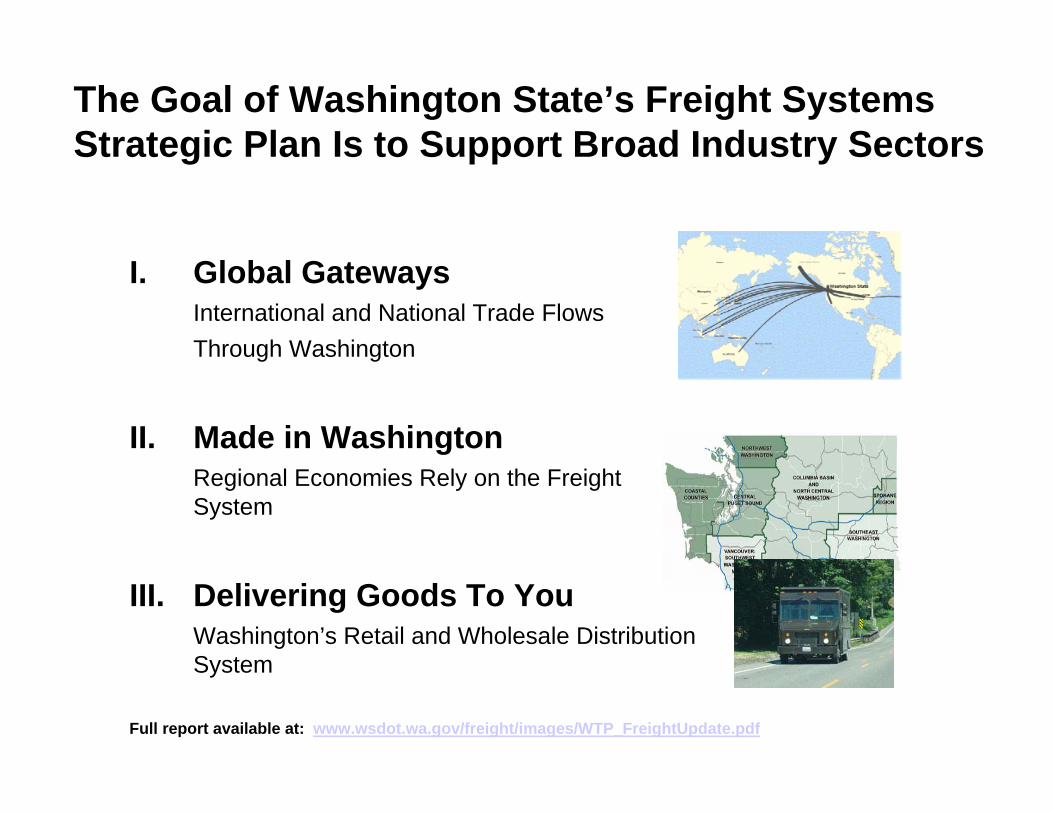
I. Global GatewaysInternational and National Trade Flows Through Washington
II. Made in WashingtonRegional Economies Rely on the Freight System
III. Delivering Goods To YouWashington’s Retail and Wholesale Distribution System
The Goal of Washington State’s Freight Systems Strategic Plan Is to Support Broad Industry Sectors
Full report available at: www.wsdot.wa.gov/freight/images/WTP_FreightUpdate.pdf

27
Washington is a Global Gateway
Goal:Increase import/export volumes.
Requirements:Port infrastructure that pulls from other west coast port options.Access to ports with the least amount of delay.Highways that are not congested or restricted.Regulation and weigh stations that minimize delay.Rail access into and out of state.Available land and facilities to support operations.Northern border crossings that are not congested.
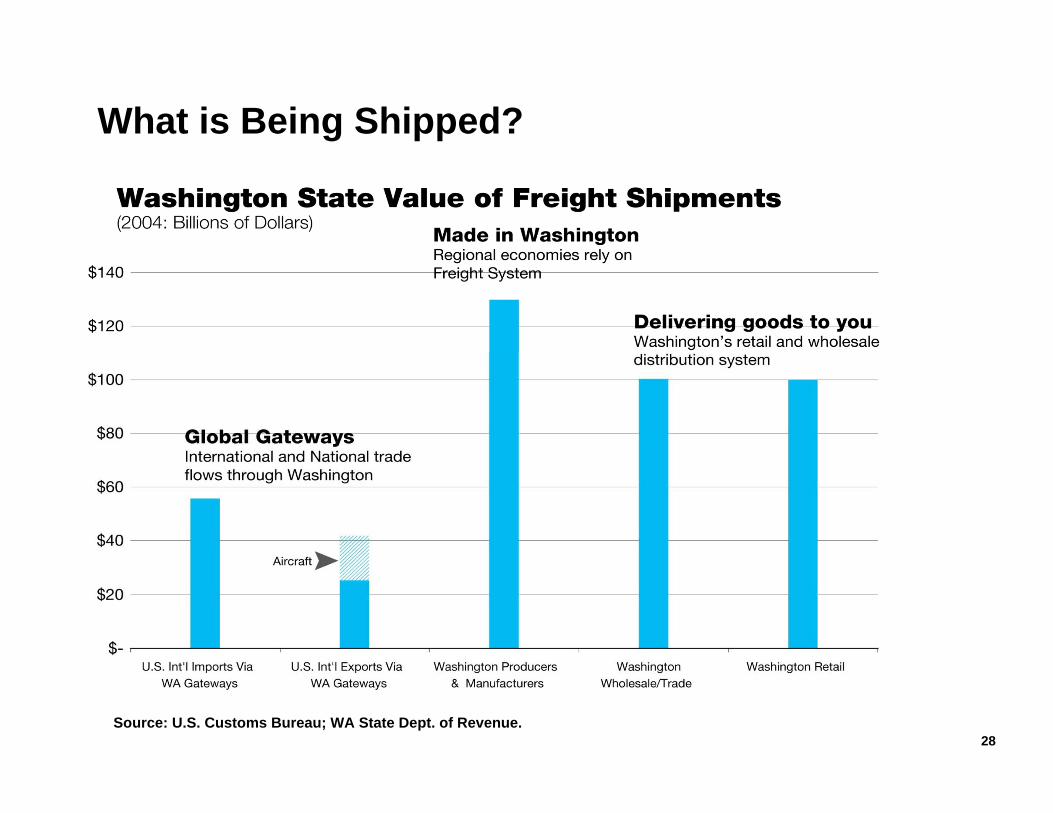
Source: U.S. Customs Bureau; WA State Dept. of Revenue.
What is Being Shipped?
28
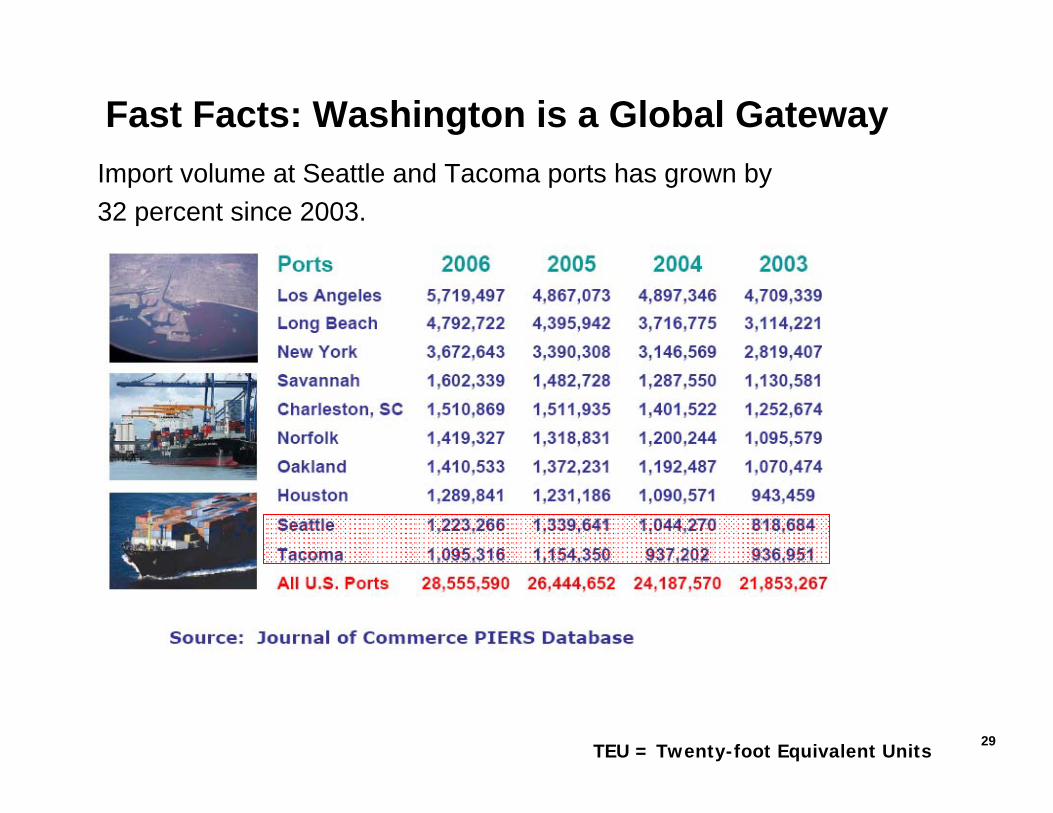
29TEU = Twenty-foot Equivalent Units
Fast Facts: Washington is a Global GatewayImport volume at Seattle and Tacoma ports has grown by 32 percent since 2003.
30TEU = Twenty-foot Equivalent Units
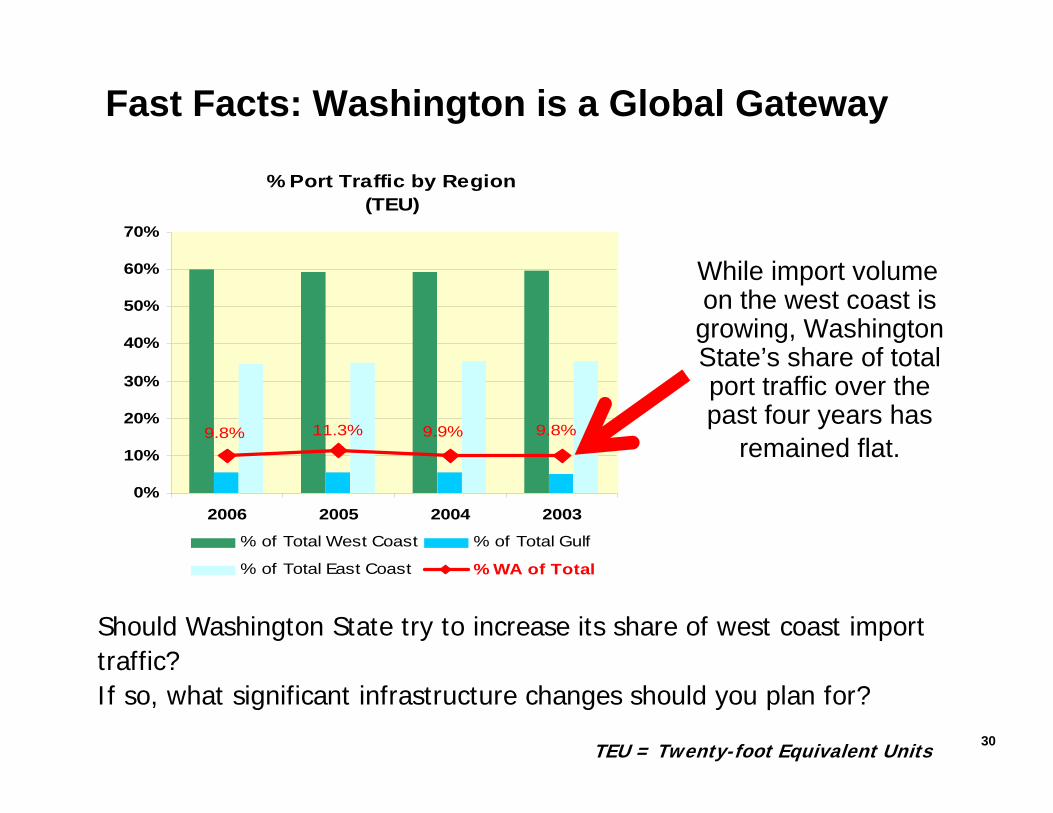
Fast Facts: Washington is a Global Gateway
% Port Traffic by Region (TEU)
9.8% 11.3% 9.9% 9.8%
0%
10%
20%
30%
40%
50%
60%
70%
2006 2005 2004 2003
% of Total West Coast % of Total Gulf
% of Total East Coast % WA of Total
While import volume on the west coast is
growing, Washington State’s share of total port traffic over the past four years has
remained flat.
Should Washington State try to increase its share of west coast import traffic?If so, what significant infrastructure changes should you plan for?

Container Port Growth is Driving the Need for More Warehouse Space
In the PNW, every 10,000 TEUs shipped creates a need for an additional 1M SF of warehouse space according to CB Richard Ellis Brokerage. That’s a ratio of 1:100
The ports of Seattle and Tacoma:- Handled about 4M TEUs in 2005. - Both ports plan rapid growth in the next 5-10 years.- Typically, 30 percent of inbound containers are trucked to
warehouses along the I-5 corridor and about 70 percent are directly transferred to intermodal rail.
- Port growth could create a demand for an additional 150M sf of warehouse space along the I-5 corridor.
How will this impact WSDOT’s plans?31

32
Made In Washington
Goal:•Increase manufacturing and agricultural volumes and lower operating costs.
Requirements:•Reliability and access throughout the road system.•Rural roads that are all-weather accessible.•Rail access into and out of the state.•Inland waterways and ports to handle growing volumes.
•Low-cost freight options (rail, water).•Regulations and weigh stations that minimize delay.
33
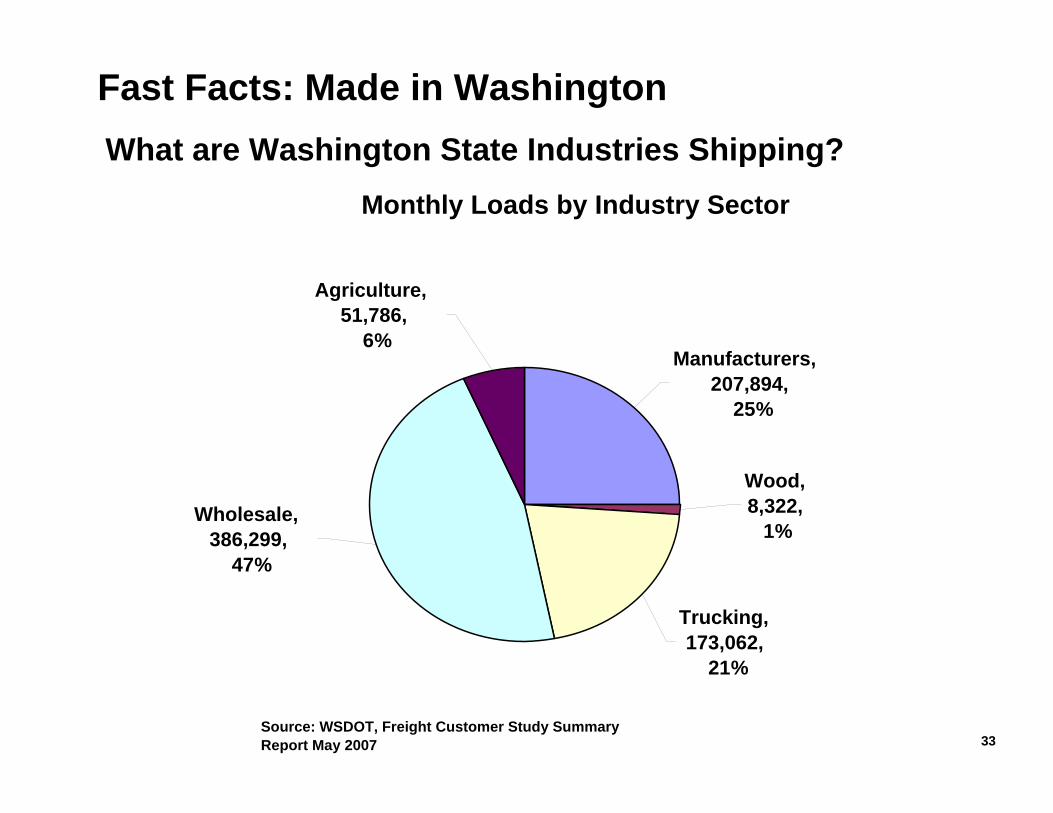
Fast Facts: Made in WashingtonWhat are Washington State Industries Shipping?
Monthly Loads by Industry Sector
Trucking, 173,062,
21%
Wood, 8,322,
1%
Manufacturers, 207,894,
25%
Agriculture, 51,786,
6%
Wholesale, 386,299,
47%
Source: WSDOT, Freight Customer Study Summary Report May 2007

34
Fast Facts: Made in Washington
Where are Washington-made products going?
48% Stays
in State
52% Goes Out ofState

35
Fast Facts: Made in WashingtonSnapshot of Eastside Wholesalers
(largest freight segment by # of shipments)
• 205,279 average loads per month (25% of the total surveyed)
• Ships via every type of shipping method
• 50%/50% split in state vs out of state shipments
What do you think are the profiles of the other segments? Why is knowing the profile important.?

36
Delivering Goods To You
Goal:•Ease of local truck delivery.
Requirements:•Reliability and access throughout the road system.•Regulations and weigh stations that minimize delay.

37
Fast Facts: Delivering the Goods to You
Source: US Department of Transportation
The highways are getting more congested…
The number of trucks on US highways has grown by 27 percent over the last 23 years.

38
Fast Facts: Delivering the Goods to You
Source: WSDOT
• In 2005, almost ten times more light and medium trucks than heavy trucks were licensed in Washington State.
• Up to 80 percent of truck trips operate in the local distribution system.
Licensed Commercial Trucks in WA State: 2005
However, most truck trips in Washington are from smaller trucks delivering goods to local markets.
39
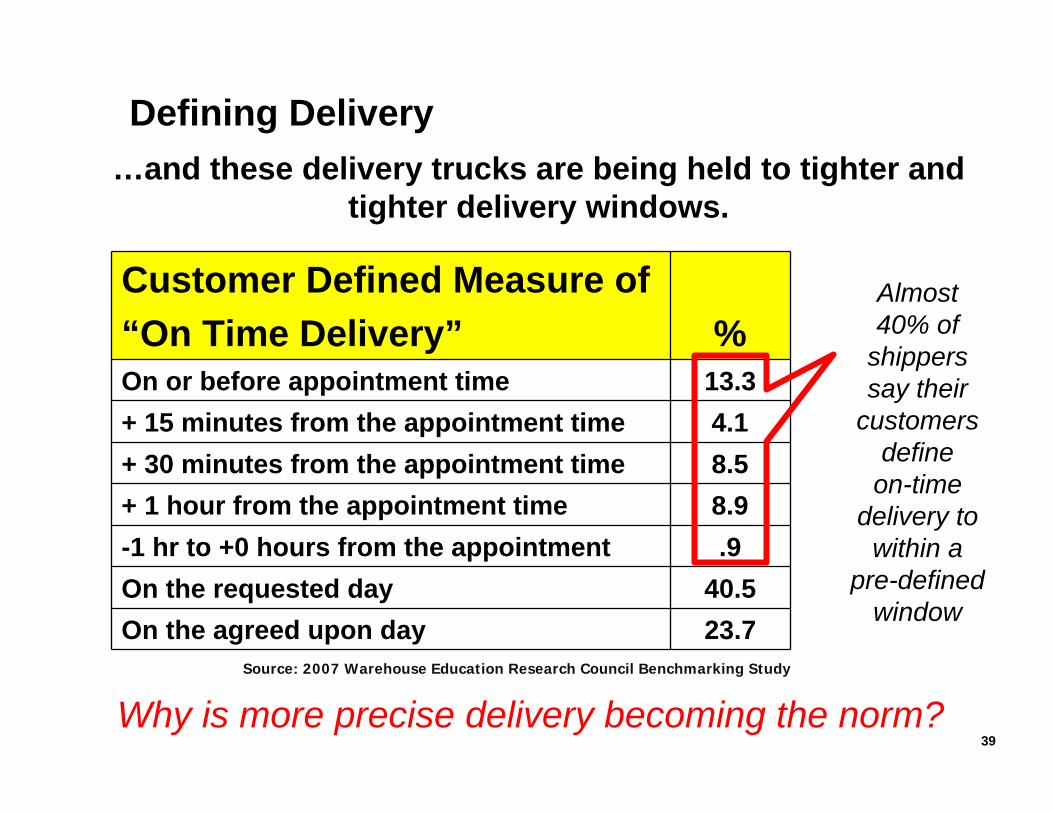
Defining Delivery
Customer Defined Measure of “On Time Delivery” %On or before appointment time 13.3+ 15 minutes from the appointment time 4.1+ 30 minutes from the appointment time 8.5+ 1 hour from the appointment time 8.9-1 hr to +0 hours from the appointment .9On the requested day 40.5On the agreed upon day 23.7
…and these delivery trucks are being held to tighter and tighter delivery windows.
Why is more precise delivery becoming the norm?
Almost40% of
shippers say their
customers define
on-time delivery to
within a pre-defined
window
Source: 2007 Warehouse Education Research Council Benchmarking Study
40
Session Topics
Introduction to Supply Chain Management
Case Study: Washington State DOT
Example Supply Chains
Interactive Working Session

41
5. CUSTOMER SATISFACTION =REVENUE GROWTH
Supply Chain Management: The GOALS
1. WASTE ELIMINATION
2. TIME COMPRESSION
3. FLEXIBLE RESPONSE
4. UNIT COST REDUCTION
Which is the most important?

42
Which SCM Goal Does Each of These Companies Rank as #1?
I. Global Gateways
II. Made in Washington
III. Delivering Goods To You
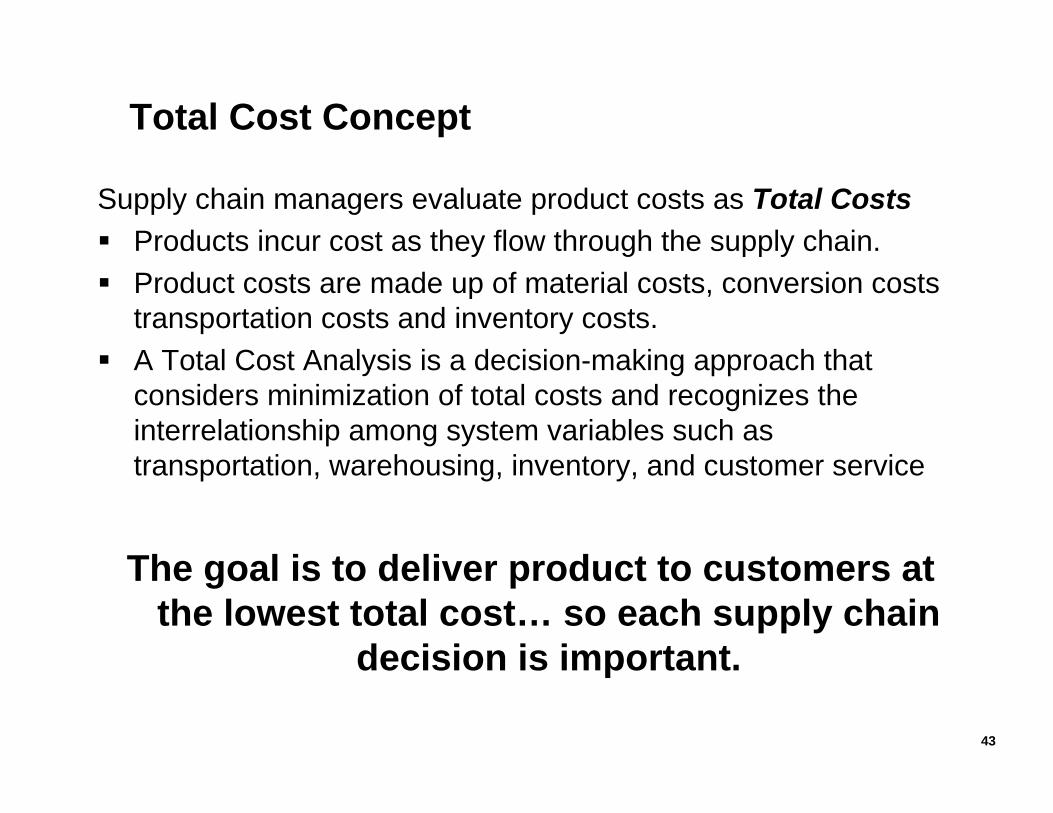
Total Cost Concept
Supply chain managers evaluate product costs as Total CostsProducts incur cost as they flow through the supply chain. Product costs are made up of material costs, conversion costs transportation costs and inventory costs.A Total Cost Analysis is a decision-making approach that considers minimization of total costs and recognizes the interrelationship among system variables such as transportation, warehousing, inventory, and customer service
The goal is to deliver product to customers at the lowest total cost… so each supply chain
decision is important.
43
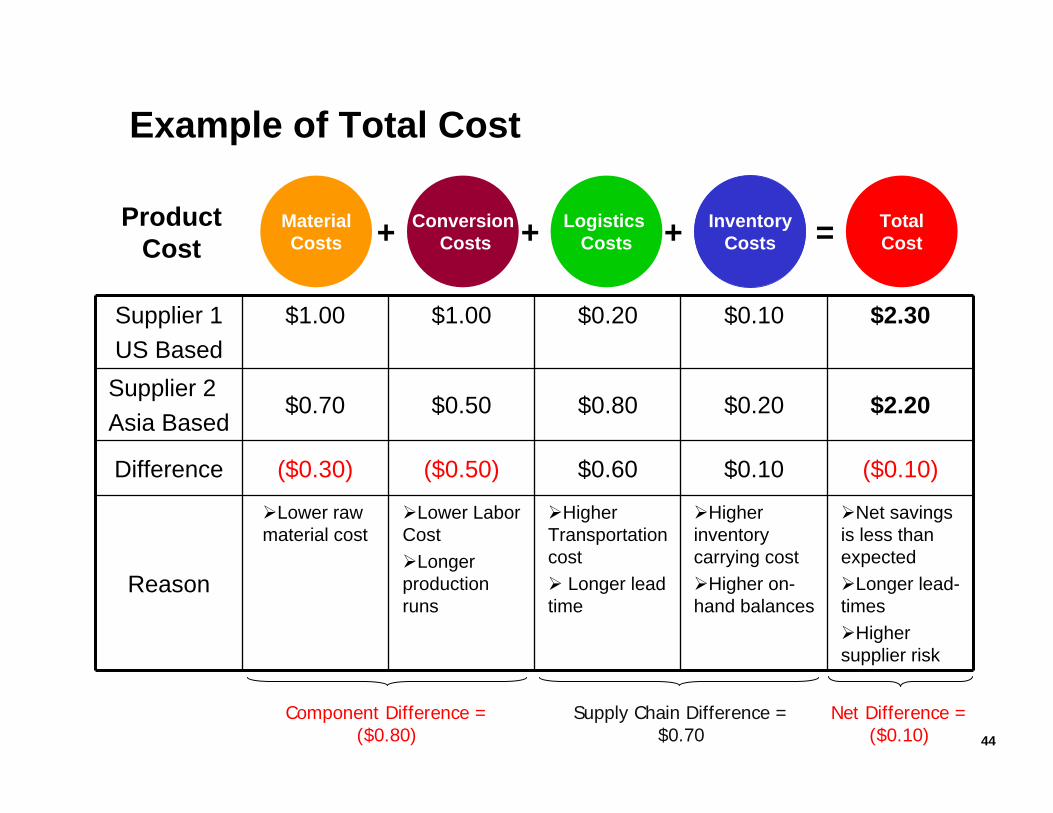
Example of Total Cost
MaterialCosts
ConversionCosts
Logistics Costs
InventoryCosts
44
Supplier 1US Based
$1.00 $1.00 $0.20 $0.10 $2.30
Supplier 2Asia Based
$0.70 $0.50 $0.80 $0.20 $2.20
Difference ($0.30) ($0.50) $0.60 $0.10 ($0.10)
Reason
Lower raw material cost
Lower Labor Cost
Longer production runs
Higher Transportation cost
Longer lead time
Higher inventory carrying cost
Higher on-hand balances
Net savings is less than expected
Longer lead-times
Higher supplier risk
TotalCost=+ + +Product
Cost
Component Difference = ($0.80)
Supply Chain Difference = $0.70
Net Difference = ($0.10)

45
Source: PRTM
Companies Who Manage Total Supply Chain Costs Well Have a Real Advantage
Percentage of Company Revenue Spent on Supply-Chain Activities
0% 2% 4% 6% 8% 10% 12% 14% 16%
AutomotiveAppliances
ChemicalComputer
Packaged Goods
Pharmaceutical
Semiconductor
Telecom
Best in Class
Average
Efficient Supply Chains Increase Profit
46
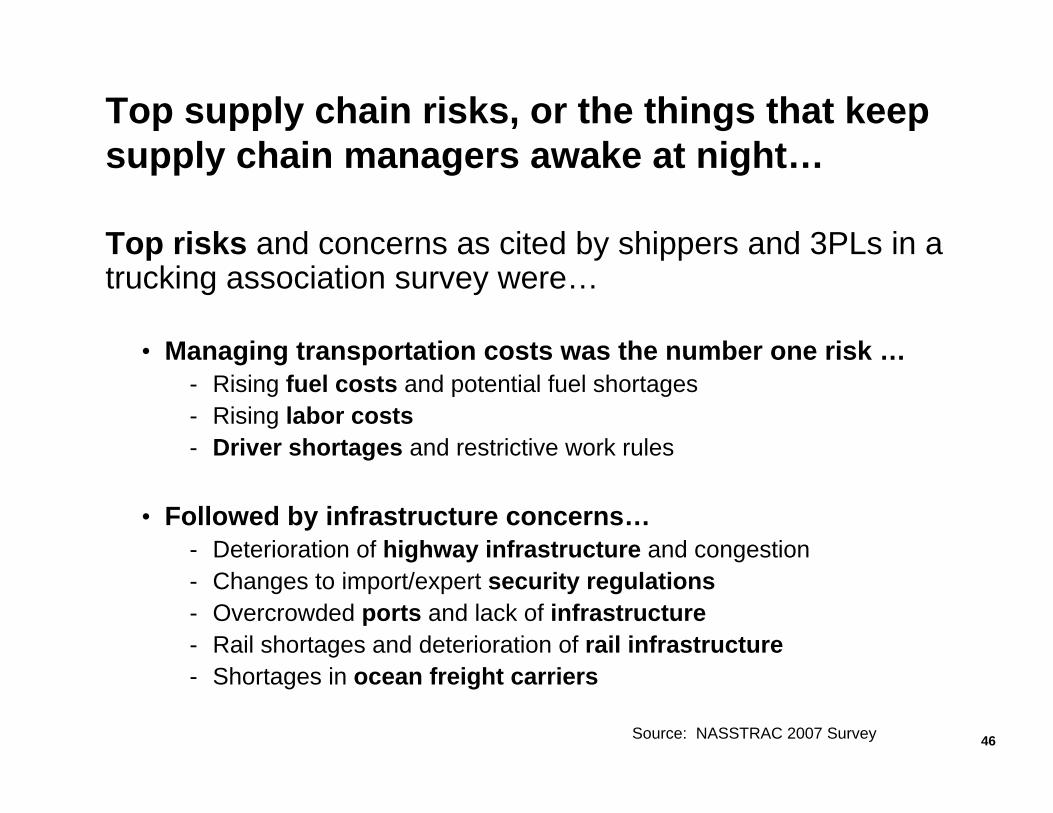
Top supply chain risks, or the things that keep supply chain managers awake at night…
Top risks and concerns as cited by shippers and 3PLs in a trucking association survey were…
• Managing transportation costs was the number one risk …- Rising fuel costs and potential fuel shortages- Rising labor costs- Driver shortages and restrictive work rules
• Followed by infrastructure concerns…- Deterioration of highway infrastructure and congestion- Changes to import/expert security regulations- Overcrowded ports and lack of infrastructure- Rail shortages and deterioration of rail infrastructure- Shortages in ocean freight carriers
Source: NASSTRAC 2007 Survey

47
Ashley Furniture - Typical Retail Supply Chain
Suppliers in China
Ashley Manufacturing & DC Arcadia,
Wisconsin
ASHLEY HOMESTORERichland WA
Customer
1. Short Haul Trucking to port in China
2. Broker/Consolidator 3. Load ship4. Ocean Transport5. Broker/Consolidator6. Port Load/Un-Load in
Tacoma7. Intermodal Rail to
Arcadia, Wisconsin8. Short Haul Trucking from
Rail Terminal to DC
1. Long Haul Trucking to Retail Store
2. Short Haul to Retail Store
1. Local Delivery
Port of Tacoma

48
Discussion Topics
Which WSDOT strategy is impacted by Ashley Furniture’s supply chain decisions?
Why would Ashley (and other companies) import through the Port of Tacoma?
49
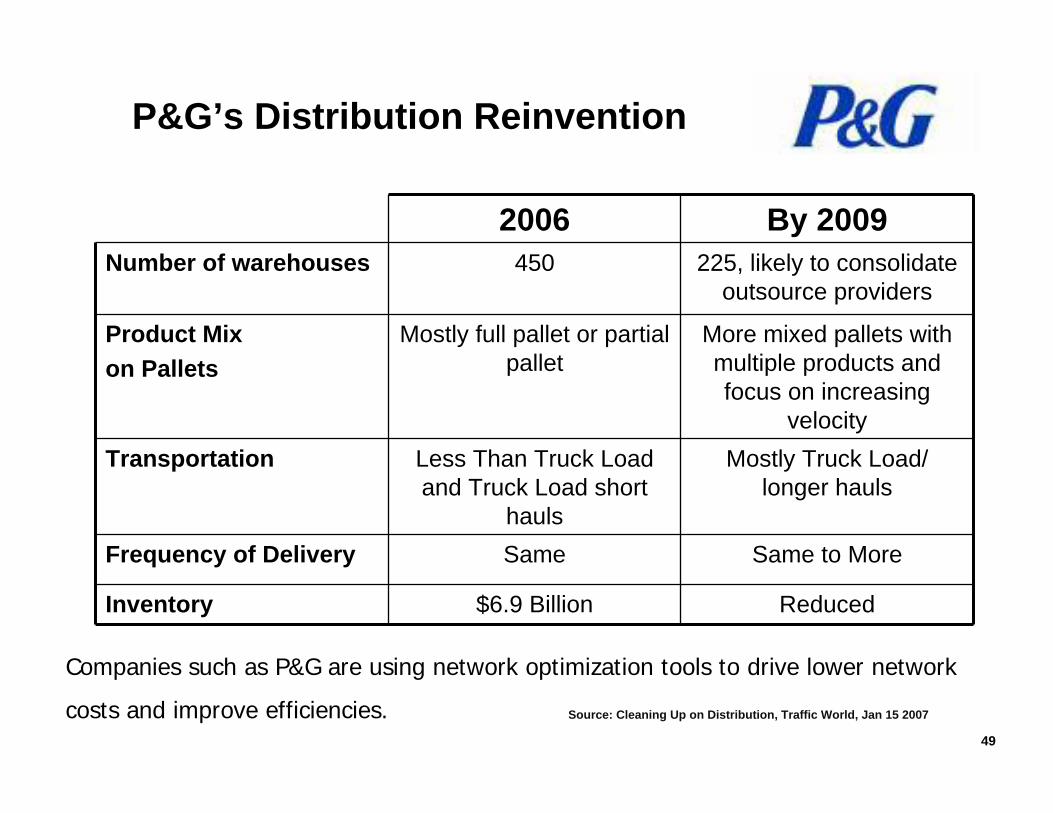
2006 By 2009Number of warehouses 450 225, likely to consolidate
outsource providers
Product Mix on Pallets
Mostly full pallet or partial pallet
More mixed pallets with multiple products and focus on increasing
velocityTransportation Less Than Truck Load
and Truck Load short hauls
Mostly Truck Load/ longer hauls
Frequency of Delivery Same Same to More
Inventory $6.9 Billion Reduced
Source: Cleaning Up on Distribution, Traffic World, Jan 15 2007
P&G’s Distribution Reinvention
Companies such as P&G are using network optimization tools to drive lower network
costs and improve efficiencies.

50
Discussion Topics
How does P&G’s reinvention of its distribution strategy impact Washington State’s transportation system?
What is inventory velocity and why is it important?
How will gas prices impact P&G’s strategy?

51
Offshore Manufacturer Import DC
Wal-Mart’s Import Center
New!
Regional DC
Regional DC
Regional DC
Wal-Mart created a flow-through import center in Houston

52
Wal-Mart’s 4 Million Square Feet Warehousein Bay Port (Houston), Texas
Wal-Mart’s New Import-Focused Warehouse
CFLCFLCFLPhoto courtesy of Cliff Lynch
53
Discussion Topics
Why would a Houston-based import center be more efficient for Wal-Mart than a West-Coast-based facility?
What if all of the top 20 national retailers did the same thing as Wal-Mart? What would be the impact to the WSDOT? What about the impact to the state’s economy?
54
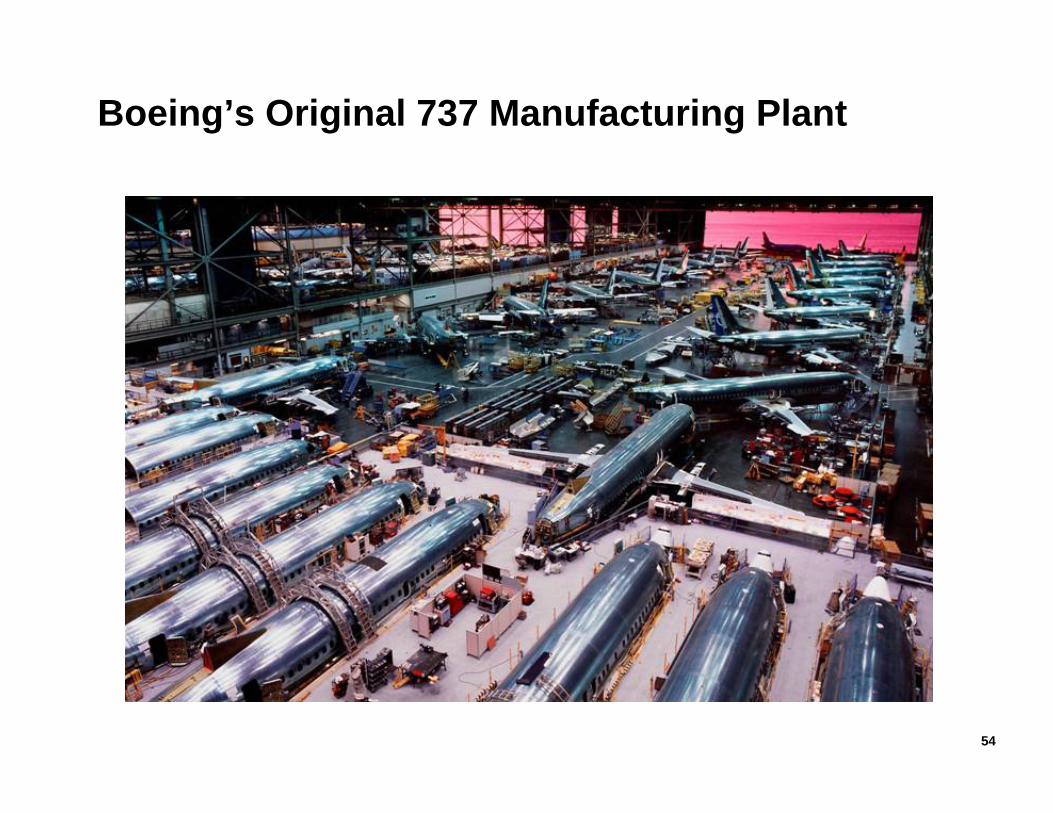
Boeing’s Original 737 Manufacturing Plant

Boeing’s Lean 737 Manufacturing Plant

56
Discussion Topics
What are the major impacts for Boeing to have their suppliers ship product “Just-In-Time” (smaller and more frequent shipments) to the plant with “Kits” ready to be assembled on the plane?
How do these smaller and more frequent shipments affect WSDOT?
What percent of Boeing’s inbound parts shipments are send via air shipment?
How does this impact Boeing outbound shipments?
57
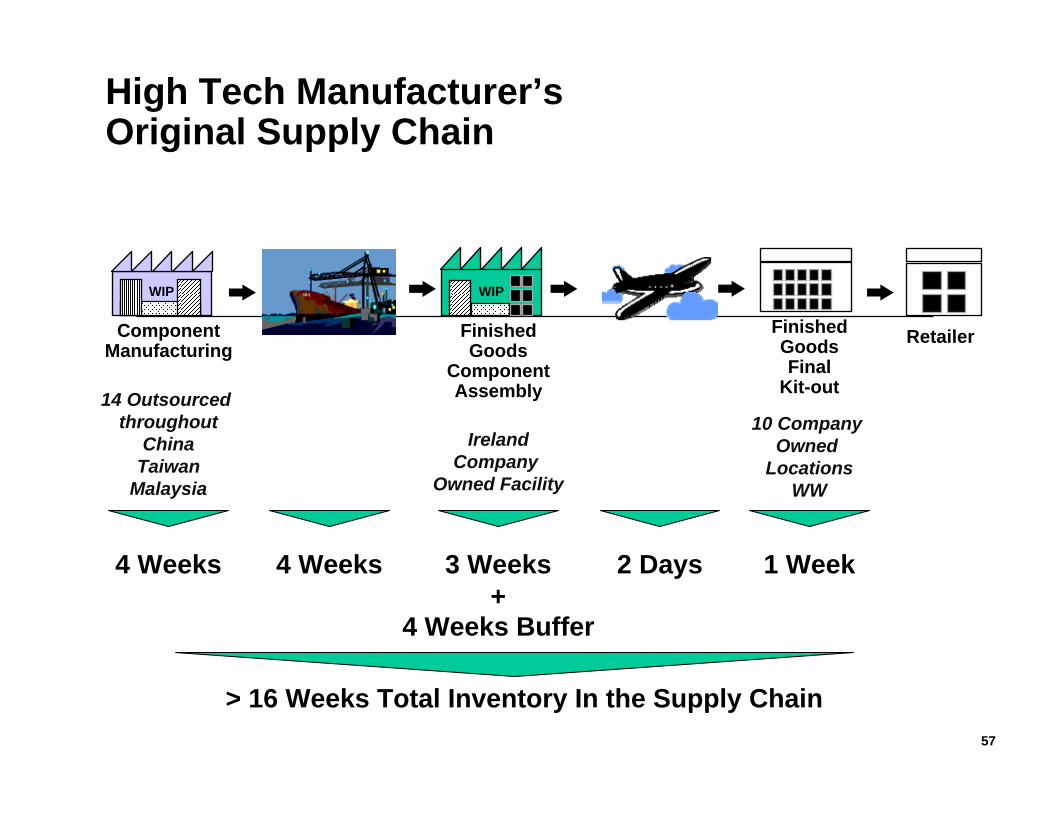
> 16 Weeks Total Inventory In the Supply Chain
4 Weeks Buffer
WIP WIP
ComponentManufacturing
FinishedGoods
ComponentAssembly
FinishedGoodsFinal
Kit-out
Retailer
4 Weeks 4 Weeks 3 Weeks+
1 Week2 Days
14 Outsourced throughout
ChinaTaiwan
Malaysia
IrelandCompany
Owned Facility
10 Company Owned
LocationsWW
High Tech Manufacturer’sOriginal Supply Chain
58
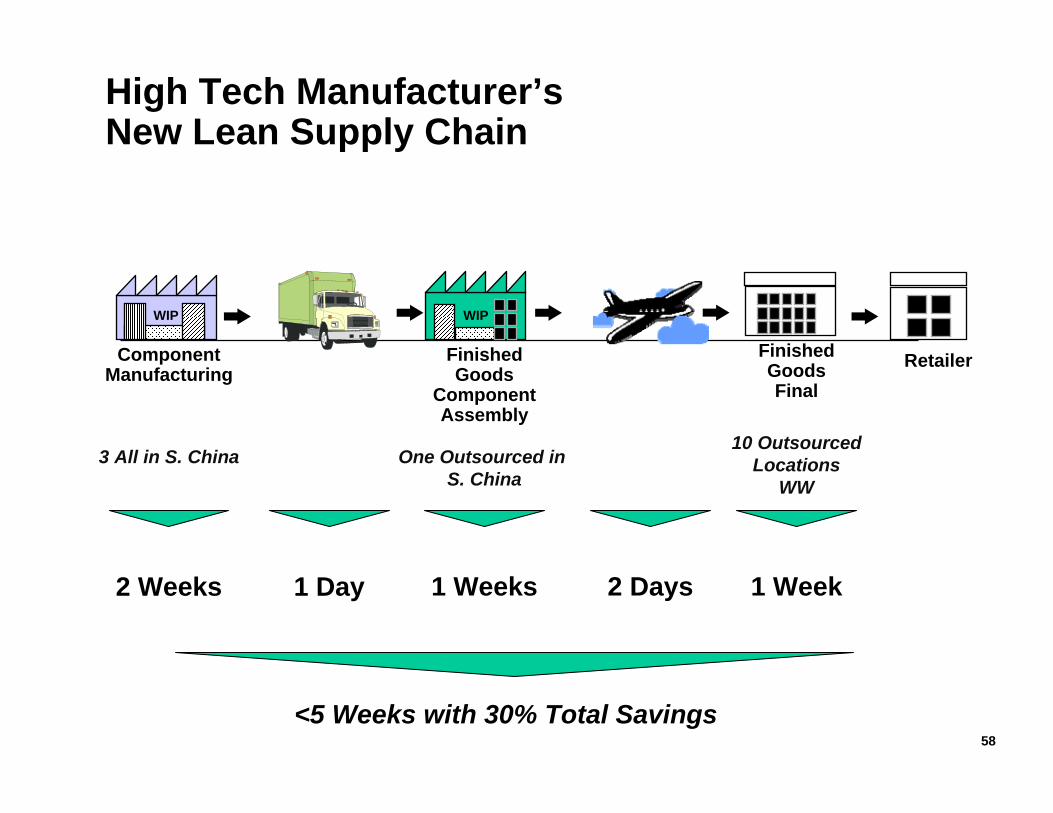
WIP WIP
ComponentManufacturing
FinishedGoods
ComponentAssembly
FinishedGoodsFinal
Retailer
2 Weeks 1 Weeks 1 Week2 Days
<5 Weeks with 30% Total Savings
One Outsourced in S. China
3 All in S. China10 Outsourced
LocationsWW
1 Day
High Tech Manufacturer’s New Lean Supply Chain
59
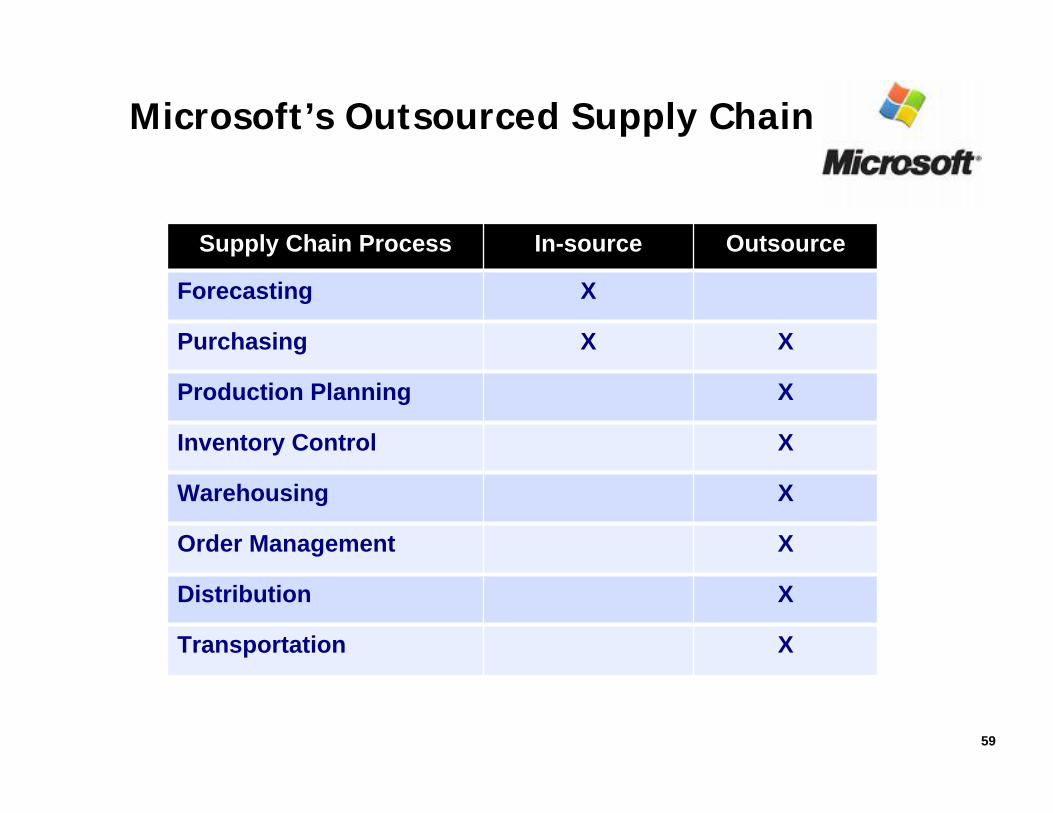
Microsoft’s Outsourced Supply Chain
Supply Chain Process In-source Outsource
Forecasting X
Purchasing X X
Production Planning X
Inventory Control X
Warehousing X
Order Management X
Distribution X
Transportation X

60
Managing out costs and working capital
Source: Armstrong & Associates
56.665.3 71.1
76.989.4
103.7113.6
0
20
40
60
80
100
120
2000 2001 2002 2003 2004 2005 2006
Bill
ion
s of
$
More and more companies like Microsoft are looking to Third Party Logistics Providers (3PLs). 3PL revenue has almost doubled since 2000.
How Does More
Outsourcing Impact
WSDOT’s decisions?

WSDOT Freight Highway Systems Strategic Planning: Seven Steps
Step 1: Quantify freight customer requirements
Step 2: Identify existing performance gaps
Step 3: Get good data
Step 4: Predict future freight demand
Step 5: Estimate additional economic output created by meeting demand
Step 6: Develop solution proposals
Step 7: Prioritize solutions based on their ability to meet the state’s goals

62
Session Topics
Introduction to Supply Chain Management
Key Drivers of Supply Chain Management
Example Supply Chains
Case Study: Washington State DOT
Interactive Working Session

63
Interactive Learning Session
Break into groups
What were the three most important takeways for you?
If you had a magic wand – what do you think should be done
What are the biggest constraints?
Please select a spokesperson to present your team’s answers

Thank You!
Kate VitasekFounder, Supply Chain Visions
Faculty, University of Tennessee
www.scvisions.com64