Supply Chain Excellence in the Pharmaceutical Industry ...ctl.mit.edu/sites/ctl.mit.edu/files/SC2020...
140
Supply Chain Excellence in the Pharmaceutical Industry: Novartis – A Case Study by Gourav Narayan Mukherjee Bachelor of Science in Systems Analysis University of Miami, Miami, FL Submitted to the Zaragoza Logistics Center in Partial Fulfillment of the Requirements for the Degree of MASTER OF ENGINEERING IN LOGISTICS AND SUPPLY CHAIN MANAGEMENT in the MIT-ZARAGOZA INTERNATIONAL LOGISTICS PROGRAM at the ZARAGOZA LOGISTICS CENTER, A RESEARCH INSTITUTE ASSOCIATED WITH THE UNIVERSITY OF ZARAGOZA May 2005 © Gourav Naryan Mukherjee . All rights reserved. The author hereby grants to MIT and to the Zaragoza Logistics Center permission to reproduce and to distribute publicly paper and electronic copies of this thesis document in whole or in part. Signature of Author __________________________________________________________ MIT-Zaragoza International Logistics Program Zaragoza Logistics Center May 17, 2005 Certified by ________________________________________________________________ Prashant Yadav Professor Thesis Supervisor Accepted by________________________________________________________________ María Jesús Saénz Academic Director, Zaragoza Logistics Center
Transcript of Supply Chain Excellence in the Pharmaceutical Industry ...ctl.mit.edu/sites/ctl.mit.edu/files/SC2020...

Supply Chain Excellence in the Pharmaceutical Industry: Novartis – A Case Study
by
Gourav Narayan Mukherjee
Bachelor of Science in Systems Analysis
University of Miami, Miami, FL
Submitted to the Zaragoza Logistics Center in Partial Fulfillment of the Requirements for the Degree of
MASTER OF ENGINEERING IN LOGISTICS AND SUPPLY CHAIN MANAGEMENT
in the
MIT-ZARAGOZA INTERNATIONAL LOGISTICS PROGRAM
at the
ZARAGOZA LOGISTICS CENTER,
A RESEARCH INSTITUTE ASSOCIATED WITH THE UNIVERSITY OF ZARAGOZA
May 2005
© Gourav Naryan Mukherjee . All rights reserved.
The author hereby grants to MIT and to the Zaragoza Logistics Center permission to reproduce and to distribute publicly paper and electronic copies of this thesis document in
whole or in part.
Signature of Author __________________________________________________________ MIT-Zaragoza International Logistics Program
Zaragoza Logistics Center May 17, 2005
Certified by ________________________________________________________________ Prashant Yadav
Professor Thesis Supervisor
Accepted by________________________________________________________________ María Jesús Saénz
Academic Director, Zaragoza Logistics Center

Mukherjee 2

Mukherjee 3
Supply Chain Excellence in the Pharmaceutical Industry: Novartis
– A Case Study
by
Gourav Narayan Mukherjee
Submitted to the Zaragoza Logistics Center in Partial Fulfillment of the Requirements for the Degree of
MASTER OF ENGINEERING IN LOGISTICS AND SUPPLY CHAIN MANAGEMENT
in the
MIT-ZARAGOZA INTERNATIONAL LOGISTICS PROGRAM
at the
ZARAGOZA LOGISTICS CENTER,
A RESEARCH INSTITUTE ASSOCIATED WITH THE UNIVERSITY OF ZARAGOZA
ABSTRACT This thesis is intended to research and explore key aspects of supply chains in the
pharmaceutical industry. The research contained within was part of a larger research effort called the Supply Chain 2020 Project. The Supply Chain 2020 Project was intended to provide insight into major research questions about the future of supply chain excellence. Within the pharmaceutical industry there are many sources of operational efficiencies which contribute to excellence; operational efficiencies alone are not sufficient to deem a supply chain as excellent. The author chose to explore one particular company, Novartis AG, and examine the company’s supply chain to determine if it fit the criterion of “excellence.”
The author utilized existing sources of information about the pharmaceutical industry and the company in addition to personal, on site interviews of key management within Novartis. This report contains a detailed description of the supply chain strategy, framework, and operating model for Novartis. Within the operating model, the author describes key practices which support key company strategies and competencies.
Novartis utilizes unique approaches to managing its supply chain including: customized KPI metrics; logistics and financial hubs; asset and resource sharing; tax and revenue optimization strategies; collaborative forecasting, and parallel production development strategies.
The author describes the details of the internal supply chain management processes and illustrates how these processes support and fit the overall company strategy. Novartis has a clearly focused strategy that revolves around research and development of new, patent protected, chronic illness products and the ability to bring them to market quickly and efficiently.

Mukherjee 4

Mukherjee 5
Acknowledgements I would like to thank Tina, my fiancée, for her continued patience and support
throughout this process.
I am grateful for my best friend Jonathan and his continued support of my
academic career.
I would also like to thank my siblings, Gitali, Rajen, and Tuli, for challenging,
loving, and supporting me unconditionally.
Many thanks to my thesis advisor, Prashant, for his motivation and wisdom.
Dedication I would like to dedicate this work to my parents with their unrelenting faith in my
abilities and future.
Biographical Note On my quest for knowledge the bigger I become, the smaller I feel.

Mukherjee 6

Mukherjee 7
Table of Contents
Acknowledgements .........................................................................................................5 Dedication.......................................................................................................................5 Biographical Note ...........................................................................................................5 Chapter 1 – Introduction................................................................................................10 Supply Chain 2020 Phase 1: Project Scope Definition ...................................................10 Chapter 2 – Literature Review.......................................................................................13 Chapter 3 – Pharmaceutical Industry Overview .............................................................15
3.1 Pharmaceutical Industry Definition......................................................................15 3.2 Pharmaceutical Industry Revenues, Operating Margins, and Employees ..............18 3.3 Pharmaceutical Industry - Evolution of Top Companies.......................................21 3.4 Pharmaceutical Industry Customer Segments and Sales Channels ........................22 3.5 Pharmaceutical Industry - Supply Chain Structure ...............................................24 3.6 Trends and industry drivers..................................................................................30 3.7 Supply Chain Challenges and Opportunities ........................................................32
Chapter 4 – Novartis Industry Position ..........................................................................39 4.1 Novartis History ..................................................................................................39 4.2 Novartis Overview...............................................................................................41 4.3 Novartis Historical Revenues, Operating Margins, and Employees ......................42 4.4 Novartis Business Units .......................................................................................43
4.4.1 The Consumer Heath Division ......................................................................44 4.4.2 Sandoz Generics Division .............................................................................44 4.4.3 The Pharmaceuticals Division .......................................................................44
4.5 Novartis Products ................................................................................................45 4.6 Novartis Sales Channels and Customer Segments ................................................49 4.7 Top Competitors and Positioning .........................................................................50
Chapter 5 – Novartis Supply Chain................................................................................52 5.1 Pharmaceutical Division Historical Revenues, Margins and Employees...............52 5.2 Pharmaceutical Division Business Units ..............................................................54 5.3 Pharmaceutical Division Products (including #s, % new, % promoted) ................55 5.4 Pharmaceutical Division Sales Channels and Customer Segments .......................56 5.5 Pharmaceutical Division Competition and Positioning .........................................57 5.6 Pharmaceutical Division Competitive Business Strategy......................................59 5.7 Pharmaceutical Division Operating Model...........................................................60
5.7.1 Orders by channel .........................................................................................66 5.7.2 Order fulfillment ...........................................................................................67 5.7.3 Facilities .......................................................................................................68 5.7.4 Customers .....................................................................................................70 5.7.5 Suppliers.......................................................................................................71 5.7.6 Products........................................................................................................71
5.8 Pharmaceutical Division Supply Chain Organizational Structure .........................72 5.9 Pharmaceutical Division Supply – Side Business Processes .................................74 5.10 Pharmaceutical Division - Inside Business Processes .........................................80 5.11 Customer – Side Business Process .....................................................................86

Mukherjee 8
Chapter 6 – Novartis Supply Chain Framework.............................................................91 6.1 Novartis Business Strategy ..................................................................................91 6.2 Novartis Operating model....................................................................................92 6.3 Novartis Operational Objectives ..........................................................................93 6.4 Novartis Complementary Processes .....................................................................94
Chapter 7 – The Future of Novartis ...............................................................................99 Appendix.....................................................................................................................105 Bibliography ...............................................................................................................138
List of Figures
Figure 1 NCE Decline with Increased R&D Spending ...................................................19 Figure 2 NCE Approvals Trend .....................................................................................19 Figure 3 R&D Spending ................................................................................................20 Figure 4 NCE Phase Transition Probabilities .................................................................28 Figure 5 Pharmaceutical Company Geographical Concentrations ..................................29 Figure 6 Approval Time for New Products ....................................................................31 Figure 7 Counterfeit Drug Proliferation .........................................................................34 Figure 8 Financial Impact of RFID Implementation on Pharmaceuticals........................36 Figure 9 Net Value of EPC for Pharmaceuticals ............................................................36 Figure 10 Key Benefits of EPC for a Pharmaceutical Company.....................................37 Figure 11 Novartis Therapeutic Categories ....................................................................45 Figure 12 Novartis Pharmaceutical Sales by Region ......................................................49 Figure 13 Pharmaceutical Division 2004 Sales ..............................................................52 Figure 14 Novartis Pharmaceutical Division Key Figures ..............................................52 Figure 15 Top 20 Pharmaceutical Product Sales ............................................................53 Figure 16 Products Coming Off Patent ..........................................................................56 Figure 17 Competitor Sales ...........................................................................................59 Figure 18 R&D Expenditures 00 - 04 ............................................................................60 Figure 19 SKU Proliferation..........................................................................................60 Figure 20 Production Timeline ......................................................................................61 Figure 21 Supply Chain Layout .....................................................................................62 Figure 22 Novartis Headquarters Location Map.............................................................66 Figure 23 Novartis Decoupling Point Illustration...........................................................68 Figure 24 Supply Chain Facility Map ............................................................................69 Figure 25 Plant Listing ..................................................................................................70 Figure 26 TechOps Organizational Chart.......................................................................72 Figure 27 TechOps Organizational Sub Chart................................................................73 Figure 28 Global Supply Chain Management Organizational Chart ...............................74 Figure 29 Collaboration Opportunities Chart .................................................................79 Figure 30 Month On-Hand Inventory Graph..................................................................82 Figure 31 Evolution of the Month on Hand Indicator.....................................................82 Figure 32 Pipeline Management Cycle ..........................................................................84 Figure 33 Brand Pipeline Improvement Illustration .......................................................85 Figure 34 Turntable KPI Illustration..............................................................................95 Figure 35 Turntable Market/Production Illustration .......................................................96

Mukherjee 9
Figure 36 Collaborative Forecasting ..............................................................................97 Figure 37 Operating Model............................................................................................98 Figure 38 Novartis Historical Revenues.......................................................................105 Figure 39 Novartis Historical Stock Prices (Hoovers.com 2005)..................................106 Figure 40 Novartis vs. Industry vs. Market ..................................................................107 Figure 41 Novartis Division Sales Breakdown.............................................................109 Figure 42 Novartis Sales by Division...........................................................................110 Figure 43 Novartis Income by Division .......................................................................110 Figure 44 Company Key Figures .................................................................................111 Figure 45 Share Information........................................................................................111 Figure 46 Net Sales 2004.............................................................................................112 Figure 47 Earnings Per Share ......................................................................................112 Figure 48 Product Offerings ........................................................................................117 Figure 49 NAICS and SIC Product Categories.............................................................118 Figure 50 Comparison of Novartis and Competitors ....................................................121 Figure 51 Global Quarterly Market Growth.................................................................122 Figure 52 Net Sales by Region ....................................................................................122 Figure 53 Portfolio Rejuvenation.................................................................................123 Figure 54 Net Sales 00 - 04 ......................................................................................... 123 Figure 55 Compounds in Development........................................................................129 Figure 56 Company Comparison by NAICS Codes .....................................................130 Figure 57 Company Comparison by SIC Codes...........................................................131 Figure 58 Facility Listing ............................................................................................136 Figure 59 Global Inventory by Product........................................................................136 Figure 60 Average Inventory by Top Brands ...............................................................137

Mukherjee 10
Chapter 1 – Introduction
The thesis is intended to contribute fundamentally to the research effort of
the Supply Chain 2020 project (SC2020). The SC2020 research initiative is
structured toward providing insight into major research questions about the future
of supply chain excellence. There are several distinct areas of interest from the
perspective of the SC2020 project: Aerospace, Apparel, Automotive,
Communications Equipment, Computers, Consumer Products, Distribution,
Pharmaceutical, Retail, and Steel are the industries that are included in the
research sample. The SC 2020 project will attempt to accurately and concisely
describe the structure and nature of how supply chains will have probably
evolved by the year 2020. Additionally, the project will supply research which
supports decisions about which risk management/mitigation strategies and
indicators should be implemented to prepare for supply chains of the future.
In an effort to contribute to a specific portion of the SC2020 initiative, the
following content will provide valuable insight into the current structure of
pharmaceutical supply chains including the key components that make certain
supply chains “excellent.” Subsequently, an in depth look into a specific
company, Novartis AG, will allow the reader to understand what key components
illustrate supply chain excellence with respect to the current pharmaceutical
industry.
Supply Chain 2020 Phase 1: Project Scope Definition
Working Title Supply Chain 2020 Project: Excellent Supply Chain Studies Key Research Question /
Hypothesis Uncover the elements of what constitutes an excellent supply chain within a broad range of industries including:
1. Aerospace 2. Apparel 3. Automotive 4. Communications Equipment 5. Computers

Mukherjee 11
6. Consumer Products 7. Distribution 8. Pharmaceutical 9. Retail 10. Steel
Students can also propose additional industries that they may already know well or in which they have some contacts.
Team Profile Two MLOG/ZLOG students or more per industry Project Description The Supply Chain 2020 Project intends to identify and analyze the factors that are
critical to the success of future supply chains out to the year 2020. Phase 1 largely entails researching today’s excellent supply chains to identify what is important to maintaining a competitive positioning, including the business strategies, operating models, goals, and best supply chain practices. In addition, the enablers of the best business practices will also be researched, as well as the cost-benefit rationale for these micro-based practices in the context of historical macro-based factors.
Data Type & Sources • Company annual and SEC-related reports. • Analyst reports and 3rd party syndicated company/industry reports. • Supply chain and business publications • Phone and on-site interviews with company executives and industry experts
Potential Advisor Thesis advisors include: • Prof Gabriel Bitran • Dr. Kirk Bozdogan • Prof. Charlie Fine • Dr. Larry Lapide • Prof Sharon Novak • Prof. Yossi Sheffi
Company Contact? Main company contacts are with the Supply Chain 2020 Project’s Industry Advisory
Council (IAC) and European Advisory Council (EAC). Council members from researched companies will provide input and access into their companies and industries, while other members will provide input on a broad range of industries and supply chain strategies. These members represent:
Accenture Audi BSH Spain Borealis Group C&S Wholesale Grocers Cisco CSC Consulting Dell DHL Eli Lilly ExxonMobil General Motors Gillette Helix Hewlett-Packard i2 Technologies IBM Intel Intervbrew/Imbev Johnson & Johnson Limited Brands Lucent Metro Group Nike Novartis P&G Roche Scotts SAP Staples Tata Steel Texas Instruments TPG Unilever

Mukherjee 12
UPS Primary Methodology Literature review, phone interviews and on-site field visits to collect information
according to an hypothesized excellent supply chain research framework.
Is The scope is supply chain strategy. Focus will be on the elements of an excellent supply chain that deal with the critical success factors and linkages among competitive business strategies, competitive operating models, goals & objectives, and business practices. Analysis is comprised of synthesizing and analyzing largely qualitative and some quantitative data information.
Is Not This is not a project involving modeling and extensive quantitative data analysis

Mukherjee 13
Chapter 2 – Literature Review
In the process of developing this work several sources were used to
obtain the research data contained within. Some of the sources include a large
variety of print media, internet research, digital media, and books. In addition,
the author used various personal sources for interviews and conversations with
industry experts and company specific internal sources. The author also chose
to enhance the work by including information from his personal industry
experience.
Literature from authors such as Michael Porter, Michael Hammer, Chris
Zook, and C.K. Prahalad created an understanding for the framework under
which to evaluate the research, and in specific, Novartis AG. Corporate reporting
and annual reports were also used to obtain specific information about the
company’s finances and operations.
Sources such as the PhRMA 2005 industry profile provided valuable
insight into the current status of the pharmaceutical industry. The profile also
provided accurate descriptions for the process by which new pharmaceutical
products are researched, approved, and brought to market. In addition to the
process definition, some of the problems which currently face the industry were
depicted and illustrated using PhRMA member company data. The data was
useful in evaluating the nature and trends within the industry regarding research
and development, including specific trends toward biopharmaceutical research.
The author relied heavily on the Hoovers.com website for current
company information and comparative charts and analysis. The Hoovers.com
site provides an accurate financial picture for many of the top companies in the
US and also provided information about organizational structure, product listings,

Mukherjee 14
competitive categories and codes, and industry financial metrics compared to the
respective companies which were researched.
The Novartis publicly filed documents including annual reports and 20f
reports were used extensively for sources of information about the company
mission, philosophy, resources, direction, and leadership. A large portion of this
information overlapped with information provided by Hoovers.com. The 20f
reports were also used for product category information and relevant research
and development efforts and their applicable supply chain implications.
Industry research and development processes, procedures, and
expenditures were carefully depicted through the tufts csdd.tufts.edu website.
After thorough exploration, the author used several graphs and trend analysis
from this source. This source is well regarded and highly referenced among
other sources which the author included in this literature review. The Tufts
CSDD documentation illustrated the declining trend of R&D effectiveness and
some of the complications faced by the industry.
Finally, Novartis employees were also interviewed to acquire information
about non-published information which was essential to the progress of this
research document. Some of the employees provided information which was
complimentary to PowerPoint presentations which the company graciously
provided to the author. The employees interviewed created a very
comprehensive cross-sectional view of the organization in the various functional
support categories of the supply chain. The interviews supplied the author with
accurate information and insight into the supply chain and business processes
and the respective rationale behind each. The information provided in the
interviews also allowed the author to examine certain processes and their future
applicability within the changing landscape of the pharmaceutical industry.
Mukherjee 15
Chapter 3 – Pharmaceutical Industry Overview
3.1 Pharmaceutical Industry Definition
Hoovers defines the Pharmaceutical industry to include “Companies that
research, develop, produce, and sell chemical or biological substances for
medical or veterinary use, including prescription, generic and OTC drugs;
vitamins and nutritional supplements; drug delivery systems and diagnostic
substances; and related products, equipment, and services, including distribution
and wholesale.” (Hoovers.com 2005)
The Hoovers.com definition of the pharmaceutical industry quite broadly
encompasses a large and varied number of logistic and supply chain activities
that could be the basis of excellence. The industry, as a whole, relies on some
standard benchmarking indicators such as months of on-hand inventory, and
inventory turns; however, the existing metrics do not allow for idiosyncrasies of
the industry or provide adequately detailed insight into the key factors that make
a pharmaceutical supply chain excellent.
As defined by (Chopra – Meindl 2004):
“a supply chain consists of all parties involved, directly or indirectly, in
fulfilling a customer request. The supply chain not only includes the
manufacturer and suppliers, but also transporters, warehouses, retailers,
and customers themselves. Within each organization, such as a
manufacturer, the supply chain includes all functions involved in receiving
and filling a customer request. These functions include, but are not limited
to new product development marketing, operations, distribution, finance,
and customer service.”
Marin Christopher defines a supply chain as:
“… is the network of organizations that are involved, through upstream
and downstream linkages, in the different processes and activities that produce

Mukherjee 16
value in the form of products and services in the hands of the ultimate
consumer.” (Christopher 2004)
The pharmaceutical industry, in recent years, underwent significant
reshaping and restructuring via mergers and acquisitions. (Hoovers.com 2005)
Today, pharmaceutical supply chains, although more mature, are subject to
different constraints and restrictions than those of other industries. Generally,
over 75% of the markup on pharmaceutical products takes place at the
manufacturer. This causes inventory carrying costs to increase dramatically
once the product is purchased by the distribution segments of the supply chain.
Wholesalers and large pharmacy chains suffer high carrying costs on the final
product and are inherently encouraged to carry less inventory. This conflict in
interest between service level and holding cost is not new, however
pharmaceutical manufacturers carry increased inventory levels to compensate
for the cost and inventory reduction measures taken by large retail chains such
as Wal-Mart and CVS. Subsequently, placement of inventory becomes
perpetually more difficult and creates consumer shortages. These shortages
which take place at the final consumer level of the supply chain are not
representative of the actual product availability from the manufacturer. As
managed health care increases pricing pressures, the cost of R&D is also
increasing. The resulting profit margins at the retail level decrease with smaller
reimbursements from insurance companies and the availability and placement of
product increases even more in difficulty.
Inside pharmaceutical supply chains, companies must also face issues of
product expiration and limited shelf lives. Seasonal and short shelf life products
such as flu vaccines leave companies without the opportunity to redistribute or
reallocate product in order to meet demand. In these instances the product
placement must be accurate the first time; few second chances are available.
With the increase in biopharmaceutical research, the importance of climate
controlled supply chains and faster response times will continue to increase.

Mukherjee 17
(PhRMA Industry Profile 2005) The evolution of pharmaceutical products to
custom tailored or build to order products will create new challenges in the years
to come. In addition to the proper placement of product to meet demand, the
industry must continue to follow strict standards for the disposal of out of date or
defective product. Although strict production standards are in place to reduce the
chance of defective product; errors do occur. When defective product is
discovered, immediate and complete action must be taken. Adequate systems
for tracking product from the origin to the destination are necessary to enable
reverse logistics in the event of a catastrophic recall. Regulatory agencies such
as the FDA maintain high standards for the visibility of products and the ability for
a company to retrieve substandard goods. Once defective products have been
retrieved, they must be tested and/or disposed of properly. The disposal process
and the controls in place to prevent tampering or intervention also raise concerns
about the security measures within pharmaceutical supply chains. Certain
anomalies also exist within the pharmaceutical industry. In recent years, with the
threat of bioterrorism increasing, a number of products have become the source
of large governmental or media induced variations in demand. Anti-infective
products such as Cipro and Avelox were in short supply following the anthrax
scares in the United States.
Many companies in the pharmaceutical industry are also exploring new
methods of research and development which form collective collaboration
agreements between two or more parties. These parties must later work out
arrangements for the production, distribution, and sales channels through which
the product will enter the market. Some of the cooperative arrangements can be
quite complex and include cross organizational sales staff or third party
production. Subsequently, tracking and monitoring of product and revenue flows
can pose challenges.
Among the myriad of standard supply chain issues faced by most
industries, pharmaceutical manufacturers tend to design their supply chains

Mukherjee 18
around tax and revenue optimization strategies. The cost of transportation and
inventory holding lack significance in comparison to the amount of money spent
on taxes. Pharmaceutical companies pay higher taxes than other members of
the supply chain since the cost of goods sold remains low without taking R&D
expenses into consideration. The manufacturers try to locate their final
production facilities where taxation of their operating income is the lowest. Until
recently, US pharmaceutical companies located most of their manufacturing in
Puerto Rico since it provided a tax haven for products entering the US market.
Puerto Rico has since changed its taxation structure to reduce the tax benefits
offered to major pharmaceutical companies. The affected companies have
continued production in Puerto Rico for historical reasons, but other countries
such as Ireland have recently created their taxation structures to attract these
manufacturers. The nature of the margin structure on manufacturing causes
pharmaceutical companies to pay more attention to the strategic level of
manufacturing facility placement than to operational cost considerations with
respect to transportation of goods.
The industry can be defined further by the products and markets which are
served. Hoovers classifies the industry with SIC and NACIS codes and product
descriptions. See the Appendix for a table.
3.2 Pharmaceutical Industry Revenues, Operating Margins, and Employees
Based on a detailed survey conducted by Tufts University, the average
cost of developing a new drug in the United States is $802 million (csdd.tufts.edu
2005). This figure updates the last estimate by Tufts University from 1987 which
estimated the average cost at $231 million.

Mukherjee 19
Figure 1 NCE Decline with Increased R&D Spending (Singh 2004)
Dr. Kenneth I. Kaitin says “Bringing new drugs to market has always been
an expensive, high-risk proposition, and our latest analysis indicates that costs
have continued to skyrocket” “The single largest challenge facing drug
developers — both pharmaceutical and biotechnology companies — is to contain
R&D costs and reduce development times without compromising clinical test
design. It’s a tall order.” (csdd.tufts.edu 2005)
Figure 2 NCE Approvals Trend (Singh 2004)
Definition: NCE (New Chemical Entity): “Any new molecular compound
[excluding diagnostic agents, vaccines, and other biologic compounds] not

Mukherjee 20
previously approved for human use by the CDER. Also excluded are new salts,
esters, and dosage forms of previously approved compounds.” (csdd.tufts.edu
2005)
Dr. Joseph A. DiMasi, director of economic analysis at the Tufts Center,
believes that the increased cost of clinical trials contributes most significantly to
the increased cost of new drug development. (csdd.tufts.edu 2005)
DiMasi also said, “The difficulty in recruiting patients into clinical trials in an era
when drug development programs are expanding, and the increased focus on
developing drugs to treat chronic and degenerative diseases, has added
significantly to clinical costs,”
Cash Flows Throughout the Product Life Cycle
Figure 3 R&D Spending (Singh 2004)
Currently the annual sales for pharmaceutical products, including
prescription and over-the-counter products, exceed $300 billion dollars annually.
(Hoovers.com 2005) This figure is expected to increase to over $350 billion by
2014. (Milkeninstitute.org 2005) Also, an estimated $49.3 billion was spent on
Biopharmaceutical R&D in 2004 (PhRMA Industry Profile 2005) while the
average revenue per company in the pharmaceutical industry is $10 billion.
(Singh 2004) Presently, only 20% of industry companies’ revenue is allocated to

Mukherjee 21
R&D. The pharmaceutical industry is quite large and employs over 400,000
people in US biopharmaceutical companies alone. (Milkeninstitute.org 2005)
Other segments of the industry, including generic product manufacturing, are
also growing. Generic sales are expected to top the $50 billion mark within the
next 3 years. Returns can also add significant expense and loss. Each year,
over $2 billion worth of expense is absorbed by pharmaceutical companies for
returns of recalled, overstocked, or out of date products. (Singh 2004)
According to Hoovers.com pharmaceutical companies currently operate
with the following average financial statistics:
Gross Profit Margin 78.83%
Net Profit Margin 16.55%
Inventory Turnover 1.8
Companies’ Revenues:
Cost of goods sold 100.0%
Selling and general administration 25.3%
Research and development 32.8%
Taxes 7.3%
After-tax net profits 20.6%
(Health Affairs 2004)
3.3 Pharmaceutical Industry - Evolution of Top Companies
The US leads the worldwide pharmaceutical industry and is home to five
of the ten largest pharmaceutical companies: Bristol-Myers Squibb, Johnson &
Johnson, Merck & Co, Pfizer, and Abbott Laboratories. Pfizer is currently
considered the market leader in terms of revenue and recently advanced its lead
in the industry through the 2003 acquisition of Pharmacia. (Hoovers.com 2005)
Behind the United States, the European Union also hosts five of the ten largest

Mukherjee 22
pharmaceutical companies: AstraZeneca, Sanofi-Aventis, Novartis, Roche
Group, and GlaxoSmithKline. (Hoovers.com 2005)
Japan falls into third place in terms of revenue in the pharmaceutical
industry. Extremely high levels of regulation exist in the Japanese market. The
Japanese market is currently recovering from an economic downturn that took
place during the late 1990’s and dropped it to third place behind the EU in sales.
The top pharmaceutical companies in Japan are Sankyo Co., Takeda Chemical
Industries, and Yamanouchi Pharmaceutical. Japan has remained unaffected by
the industry wide consolidation which transpired in recent years. (Hoovers.com
2005)
The remainder of the world currently accounts for about 12% of the sales
in the pharmaceutical market; however, this is rapidly increasing with advances
in the living standards throughout the world. Subsequently, the demand for more
advanced medical drugs and better overall health care will continue to increase
outside of the three main pharmaceutical sales regions. (Hoovers.com 2005)
3.4 Pharmaceutical Industry Customer Segments and Sales Channels The pharmaceutical industry primarily caters to large pharmacy retail
chains and wholesalers of medical products. In addition to these primary
customers, governmental agencies can also provide large quantity orders of
prescription medications. With respect to prescription medication, the end
consumer must purchase products from one of the above mentioned
organizations, a few exceptions and anomalies withstanding. There has been an
increasing trend in the number of consolidations amongst the wholesalers and
pharmacy chains which is resulting in stronger customer purchasing power and
in many cases this translates into lower margins for the pharmaceutical
companies. The pharmaceutical industry also provides product directly to clinics
and hospitals, however these are not the main market channels for prescription
medications. The industry also encompasses the OTC (Over-The-Counter)

Mukherjee 23
market for products. These products can be sold in less controlled and less
stringent venues such as grocery stores and other retail outlets.
According to UPS consulting, “The increasing use of formularies,
therapeutic interchange and step-care therapy by managed care means that
sales and marketing efforts should cater to the root of these programs: cost
management in treatment programs.” (UPS Consulting 2005) The trend of cost
cutting and formulary use appears to be ongoing. As a result of formulary use,
certain products’ revenues rely more on sales and marketing than on product
effectiveness. The managed health care contracts often drive the market and
changes in a formulary for one organization can often upset sales forecasts
throughout an entire supply chain.
UPS consulting believes that, “2 marketing efforts must address the total
cost management needs of both managed care and providers. Moreover, the
time in which sales and marketing has to generate and influence demand is
shrinking due to increased generics competition and shortening exclusivity
periods. These shrinking timeframes and price pressures require that new
product marketing and sales methods continuously address evolving sales
channels. Pharmaceutical companies and their partners must also be able to
quickly build differentiating capability in marketing to such sales channels.” (UPS
Consulting 2005)
Companies in the US have started marketing directly to the end consumer
instead of their customer. This marketing effort is designed to counter the pricing
pressures which are amounting from increased buying power amongst pharmacy
chains and wholesalers. Additionally, more consumers are purchasing both
prescription and OTC medication via virtual stores such as mail order and
Internet pharmacies. This change in the distribution channels can create an
imbalance in sales forecasts. Subsequently, the manufacturers are not able to
track demand on a geographic level. The migration of sales to non-
Mukherjee 24
geographically specific forms of commerce will continue to grow and create
parallel trade within markets. This parallel trade already exists in the EU
because of regulated pricing. “The McKinsey Quarterly, 2002 second quarter,
stated that direct-to-consumer (DTC) advertising produced mixed results, and
while DTC budgets have significantly increased, efficacy has not.” (UPS
consulting 2005) This increasing trend in DTC marketing expenditures along with
lower margins due to pricing pressures could lead to a shift in the market;
pharmaceutical companies could start selling product directly to the end
consumer through vertical integration.
In the event that new channels develop, pharmaceutical companies will
need to adjust their distribution and logistics strategies to support the changing
market needs. (UPS consulting 2005) “Drug makers can now sell direct to
retailers and providers through e-marketplaces such as the Worldwide Retail
Exchange and Global Healthcare Exchange” (UPS consulting 2005)
Companies must remain flexible in their strategy. Without flexibility new
evolutions in sales channels could be detrimental to organizations. Parallel trade
already poses problems within the EU; non-geographically specific retailers will
continue to influence the shape of the distribution channels throughout the rest of
the world.
Companies also face the increased threat of counterfeit drugs in the
supply chain. It is estimated that, internationally, as much as 7% of drug
products in supply chains are fake. (Singh 2004)
3.5 Pharmaceutical Industry - Supply Chain Structure
The pharmaceutical industry continues to exhibit some of the longest
product pipelines and lead times. The process of drug development is becoming
increasingly more complicated. The lead time for the development of a new
product is exceptionally long; often times in excess of 10 - 15 years.

Mukherjee 25
(csdd.tufts.edu 2005). Higher pressures from generic manufacturers force
companies to seek recuperation of expenses in shorter time frames.
Government agencies encourage generic manufacturers to enter the market
once products’ patents expire by providing market exclusivity for 180 days.
(cms.hhs.gov 2005) CMS (Center for Medicare and Medicaid Services)
encouraged the development of ANDAs (Abbreviated New Drug Applications) to
assist generic manufacturers and expedite the approval process for new generic
products.
The pharmaceutical industry has some of the highest research and
development expenditures. R&D efforts often provide fruitless results and leave
companies struggling to recuperate investments. Within the pharmaceutical
industry it is not uncommon for over 5000 drug compounds to be tested for every
5 products that reach clinical trials. Once a product reaches clinical trials, only 1
out of every 5 will actually receive approval and enter the market. (PhRMA
Industry Profile 2005) Once in the market, only 30% of the prescription drugs will
ever provide a return on the initial R&D expenditure. (Singh 2004)
Stages of Pharmaceutical Product Development:
Drug Discovery:
Identify a target molecule or compound that scientists believe will affect
certain medical conditions. Scientists then screen thousands of variations of this
compound using computer screening or chemical testing. After testing, each
compound that is identified as a potential medicine will then be further evaluated
to determine its potential value with respect to existing products and its ability to
be manufactured on a large scale. (PhRMA Industry Profile 2005)
Mukherjee 26
Pre-clinical Testing:
The drugs which make it through the discovery process are then subjected
to laboratory and animal testing for an additional 1 – 3 years. This testing
assesses the safety of the compound and provides some insight into its activity
against specific diseases. The purity, stability, and shelf life of the compound are
also tested along with its manufacturability in different galenical forms. (PhRMA
Industry Profile 2005)
IND (Investigational New Drug) Review:
In the US, a company must submit an application to the FDA (Food and
Drug Administration) before it can begin clinical trials. (PhRMA Industry Profile
2005). The application process varies across regions and countries.
Phase 1 Clinical Trial:
In Phase 1, the drug compound undergoes testing regarding safety,
dosage ranges, and action mechanisms. This phase of clinical trials involves
between 20 and 100 healthy volunteers. (PhRMA Industry Profile 2005)
Phase 2 Clinical Trial:
Upon conclusion of Phase 1, the drug compound must undergo placebo-
controlled trials on 100 to 500 volunteers who are afflicted with the target disease
or condition. (PhRMA Industry Profile 2005)

Mukherjee 27
Phase 3 Clinical Trial:
Phase 3 is the largest of the clinical trials and involves between 1000 and
5000 patients. The drug compound is tested on patients in clinics, hospitals, and
other health care facilities. (PhRMA Industry Profile 2005)
FDA or Other Agency Approval:
FDA or agency scientists and committees review the application and
decide the fate of the drug compound. Only 1 in 5 drugs that enters clinical trials
are approved. (PhRMA Industry Profile 2005)
Production:
Once a drug compound receives regulatory approval it can still take
upwards of 1 full year for the product to reach the market. The raw material for
some pharmaceutical products takes over a year to traverse the supply chain
and become a finished product. Processing and distribution comprises less than
25 days of the lead time (Singh 2004)
The industry needs more than ever to improve and expedite the process
of launching new products. Forrester Research calculates that the per-day cost
in lost sales for a $1 billion drug is $2.74 million. (McKinsey Quarterly 2002)
“The location of [new drug] launches affects how quickly doctors and patients can
access the most advanced treatments. One study shows that the U.S. averages
a 4-month delay from initial drug launch to market. In Europe, this delay ranges
from 7 to 19 months…. The reason: lengthy reimbursement negotiations that
follow government approval of any new drug.” (PhRMA Industry Profile 2005)

Mukherjee 28
Figure 4 NCE Phase Transition Probabilities (Tufts CSDD)
The pharmaceutical industry experiences a high level of scrap and rework
in manufacturing processes. The industry average for rework and discarded
product is 50%. Rework and scrap cost companies millions of dollars. Estimates
place the cost of a scrapped batch of product around $3-$4 million. (Singh 2004)
The industry is also notorious for maintaining high levels of WIP (work in
progress) and finished good inventory. WIP inventories up to 100 days are not
uncommon. (Singh 2004) Pharmaceutical inventories in the US have nearly
doubled in the last decade and are approaching record high levels estimated
around $18 billion. (Singh 2004)
Even amongst some of the highest recorded inventory levels, the industry
still faces inevitable shortages. The American Society of Health System
Pharmacists recognizes over 40 drug and vaccine products which experience
unavailability and shortages. (Wall Street Journal, 2/15/2002) There is an
escalation of the shortages throughout the supply chains of pharmaceutical
companies. In the 5-6 years preceding 2002, the industry only experienced 8 –

Mukherjee 29
10 shortages a year; as of 2002, the industry expected shortages of over 40
products annually. (Wall Street Journal, 2/15/2002) In the 1980’s and 1990’s
backordered products were uncommon. (Associated Press, 12/8/2002)
Reasons for drug shortages:
Regulatory issues (7%)
Product discontinuation (20%)
Raw materials issues (8%)
Manufacturing problems (28%)
Supply and demand problems (10%)
Approximately 27% of shortages are unexplained.
(Singh 2004)
The capacity utilization in many companies’ plants remains low causing
lower contribution margins for products. Plant utilizations often fall around 50%.
(Singh 2004)
Figure 5 Pharmaceutical Company Geographical Concentrations (US Department of Labor 2004)
Concentration of Pharmaceutical Distribution J&J, Merc, BMS, Pfizer – Parsippany, NJ BI, Bayer – CT Eli Lilly - Indiana

Mukherjee 30
3.6 Trends and industry drivers
PhRMA (Pharmaceutical Research and Manufacturers of America)
member companies collectively invested over $38.8 billion in 2004 setting a
record high for R&D expenditures. This represents a 12.6% increase over the
previous year. (PhRMA Industry Profile 2005)
The global landscape of the pharmaceutical industry changed in the past
few years as European pharmaceutical companies relocated a large number of
researchers and facilities to the United States. The trend of relocation stems
from the United States governmental attitude and policy that fosters new drug
innovation and development. The European Union also imposes regulatory price
and cost controls which make research and development unattractive. (Charles
River Associates 2004) The European Union’s policies and controls place undue
downward pressure on research and innovation. In the last decade, the United
States pharmaceutical industry has surpassed the European industry in the
number of new products being introduced to the market. The incentive
misalignment results in a shrinking market share for European pharmaceutical
manufacturers. (Who.int 2005) From 1998 to 2002 the United States had almost
twice as many new drug launches than the European Union. (PhRMA Industry
Profile 2005)
According to the FDA, the number of new drug applications has declined
significantly in the past few years. (Singh 2004) The rising cost of R&D has
contributed to a more selective process for choosing new products. Companies
are only interested in creating blockbuster drugs that will provide a positive net
return on their investment and provide added shareholder equity. With the
increased pressure of generic replacements for off patent products and less time
to earn profits, drug companies often drop compounds which exhibit a marginal
probability of success before they enter clinical trials.

Mukherjee 31
Figure 6 Approval Time for New Products
(Singh 2004)
“Demand directs drug development. With R&D costs climbing, drugmakers
tend to focus on products for chronic rather than acute diseases with large
patient populations (such as cancer, arthritis, cardiovascular conditions). Ulcer
medications, cholesterol treatments, and antidepressants are the top three drug
categories; the world's two best-selling drugs, Merck's Zocor and Pfizer's Lipitor,
both treat high cholesterol. Advances in biotechnology are not only opening up
new product opportunities but are also trimming the time and expense of
development.” (Hoovers.com 2005)
“Another factor driving the industry is the world's increasing elderly
population. The over-65 set, which consumes three times as many drugs as
younger populations, is expected to reach 690 million by 2025, and people are
living longer thanks to drugs. Some 150 products for age-related conditions were
brought to market in the 1990s, and some 600 more are in development. The
aging population has also increased the demand for low-cost prescriptions. As
drug prices continue to climb, many states are taking hard-line bargaining
positions to reduce their Medicaid drug costs. The industry also faces the

Mukherjee 32
possibility that the government will launch a Medicare prescription drug benefit.”
(Hoovers.com 2005)
“While the buyers may be living longer, monopoly profits from patents
don't last forever. Patent expiration, in part, is fueling the M&A activity reshaping
the industry. Although holders try to extend those precious patents with lawsuits
and reformulations (such as Eli Lilly's failed move to extend its Prozac patent) or
by simply paying generic rivals to keep generic versions of popular drugs off the
market, such generic drugmakers as Barr Laboratories, Mylan
Laboratories, Teva Pharmaceutical Industries, and Watson Pharmaceuticals will
be adding big sellers to their product lists.” (Hoovers.com 2005)
“Building a bigger, stronger drug pipeline can stave off losses when best
sellers go off patent, and the push for new blockbusters is also driving industry
consolidation. Pooling R&D potential has been part of the logic behind such
megamergers as those between Pfizer and Pharmacia, Glaxo Welcome and
SmithKline Beecham, and the companies that today are known as Sanofi-
Aventis, Novartis, and AstraZeneca. Couplings with biotechnology companies
provide another possible stream to fill emptying pipelines. As competition to
create the next Viagra heats up, more companies will be merging and seeking
collaborations to discover another blockbuster wonder drug.” (Hoovers.com
2005)
3.7 Supply Chain Challenges and Opportunities
The practice of drug counterfeiting is escalating worldwide. Advances in
technology, intermediary proliferation, high prices, excess demand, and a lack of
regulatory intervention drive the escalation of counterfeiting in the pharmaceutical
industry. (Wertheimer, Santella, Chaney, 2004). The counterfeit drugs continue
to proliferate in existing pharmaceutical supply chains; the introduction of these
counterfeit drugs taints the quality, effectiveness, and safety of the drug supply.
Drug counterfeiting estimates range from “8% of the total drug supply in the
Mukherjee 33
United States and other industrialized nations, and as high as 60% in poor
countries” (Wertheimer, Santella, Chaney, 2004). Counterfeiting results in lost
revenues, profits and lives.
The economic impact of counterfeit drugs extends and multiplies
worldwide. Counterfeit drugs cause substantial losses in revenue and profit.
The faux products also tarnish reputations; cause costly lawsuits from adverse
drug reactions; and create expensive recalls and reverse logistics expenses.
Indirectly, the counterfeit products can increase regulatory and political
involvement in the industry which creates lengthened product approval times and
costs. The end result: law suits, insurance costs and injuries, create higher
prices for the end consumer and lower profit margins for pharmaceutical
companies.
Industry wide profitability for pharmaceutical companies in 1996 was
estimated conservatively at 18.8% (CEBR, 1998) this would translate into almost
$95 billion for 2004. Subsequently, estimates for lost revenue due to
counterfeiting in the pharmaceutical industry were approximately 5.8% or $29.3B
in terms of 2004 industry profit (CEBR, 1998). This staggering figure represents
the significant impact that counterfeit products impose on the pharmaceutical
industry. Within the European Union the same comparison would represent an
annual loss of profit equal to €292M (CEBR, 1998). In terms of GDP, the loss to
the respective EU countries’ GDPs exceeded €937M, and resulted in almost
2000 forfeited potential jobs (CEBR, 1998). The WHO (World Health
Organization) estimated that the percentage of counterfeit drugs world wide
could be as high as 10% (WHO, 1999).

Mukherjee 34
Figure 7 Counterfeit Drug Proliferation (Singh 2004)
One of the future challenges for the pharmaceutical industry involves the
combat of counterfeiting. The FDA has recognized that RFID (Radio Frequency
Identification) technology possesses potential to reduce the treat of counterfeit
drug introduction. The FDA believes, “Modern electronic technology is rapidly
approaching the state at which it can reliably and affordably provide much
greater assurances that a drug product was manufactured safely and distributed
under conditions that did not compromise its potency” (Fda.gov 2004). As the
FDA continues to examine alternatives to act against the counterfeiting
pandemic, “Radiofrequency Identification (RFID) tagging of products by
manufacturers, wholesalers, and retailers appears to be the most promising
approach to reliable product tracking and tracing.” (Fda.gov 2004) Additionally,
“Authentication technologies for pharmaceuticals have been sufficiently perfected
that they can now serve as a critical component of any strategy to protect
products against counterfeiting.” (Fda.gov 2004) If the FDA imposed mandatory
implementation of RFID, the industry on a whole could experience vast changes
in the cost basis for supply chains.

Mukherjee 35
Although the pharmaceutical industry would take a significant cost hit to
implement the new technology, the end result, if counterfeiting were reduced,
would create substantial savings and additional profit. Presently, the average
price of a bottle of prescription medication is estimated at around $53.10. It is
estimated that 76% of that profit is received by the manufacturer ($7.60), the
wholesaler receives 3% ($0.30), and the other 21% is retained by the retailer
($2.10) (Singh, 2004). According to the previous calculations and estimates,
almost $3.10 of profit is lost per bottle due to counterfeiting.
The cost of the infrastructure to implement RFID would be a one time sunk
cost; however the benefits would continue to contribute to the bottom line. Even
if the cost of the RFID tags, which is where the main portion of the cost exists,
remained high at $.20 /tag, the benefits would still show significant increases in
profit from the reduction in counterfeit products. The benefits of RFID
implementation far outweigh the costs (Lagasse 2003).
In addition to the quantitative losses suffered by the pharmaceutical
industry, the world also experiences immeasurable humanitarian losses as a
result of counterfeit drug introduction. In China over 192,000 lives were lost
(cumulatively) throughout 2001 (Wertheimer, Santella, Chaney 2004).
Mukherjee 36
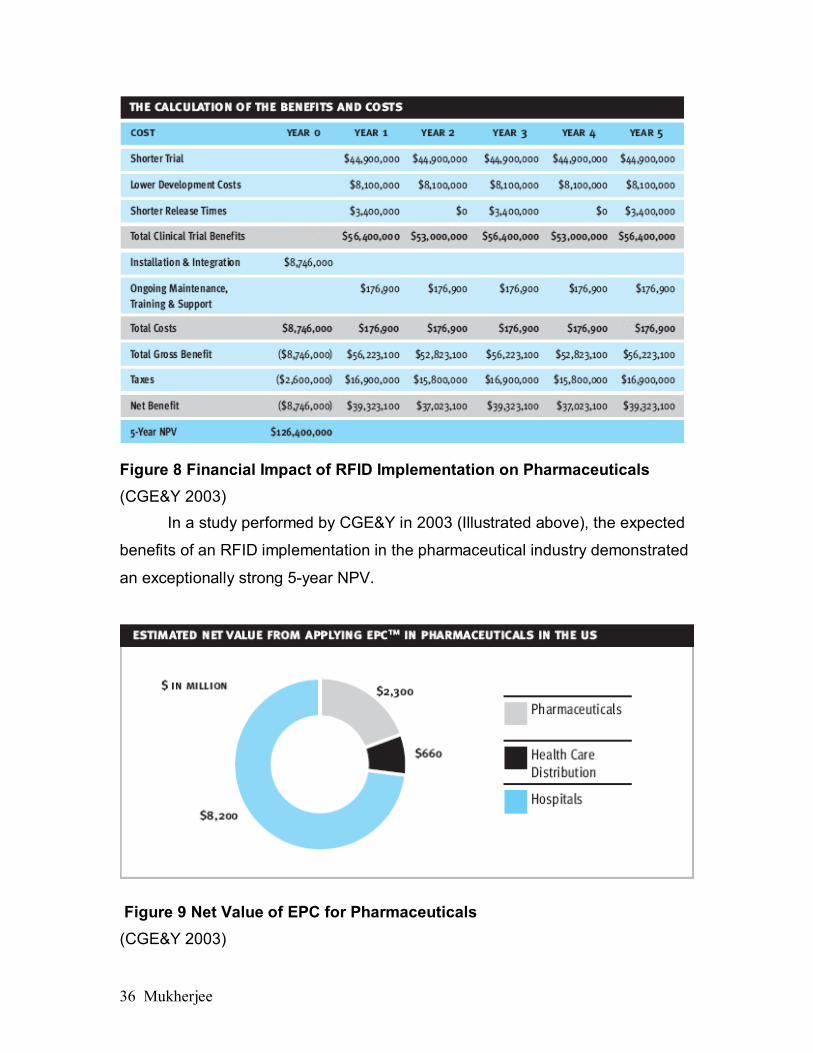
Figure 8 Financial Impact of RFID Implementation on Pharmaceuticals (CGE&Y 2003)
In a study performed by CGE&Y in 2003 (Illustrated above), the expected
benefits of an RFID implementation in the pharmaceutical industry demonstrated
an exceptionally strong 5-year NPV.
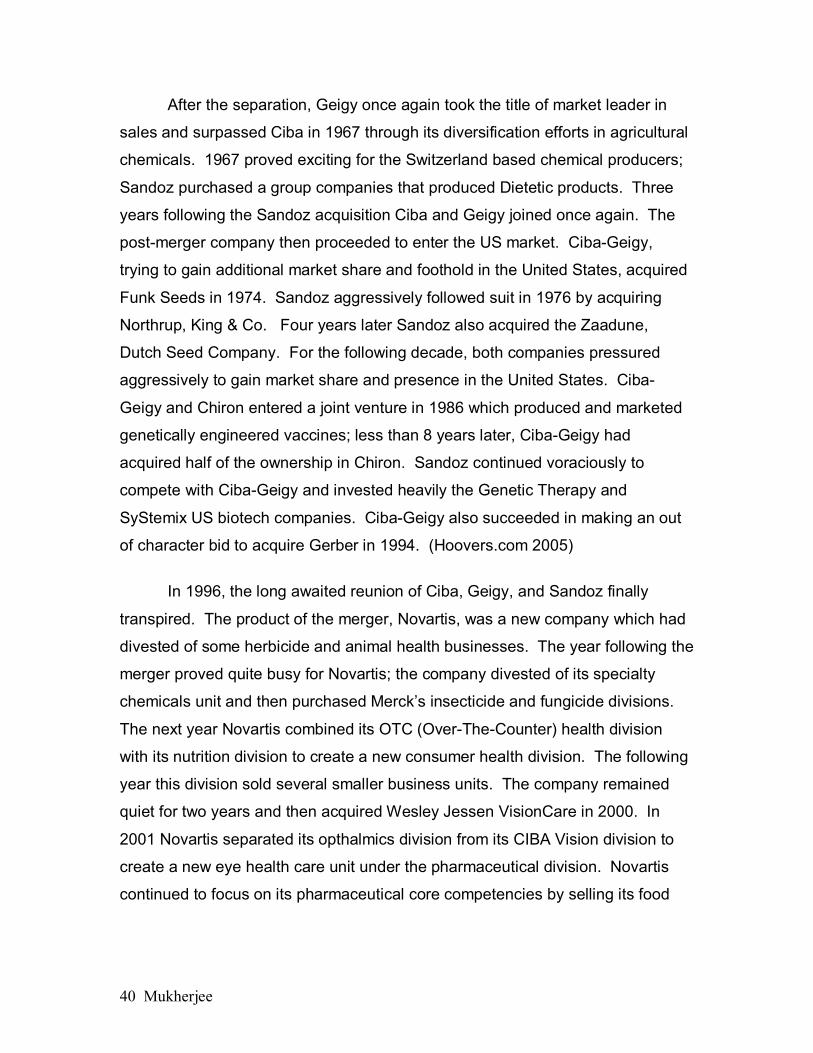
Figure 9 Net Value of EPC for Pharmaceuticals (CGE&Y 2003)

Mukherjee 37
Figure 10 Key Benefits of EPC for a Pharmaceutical Company (CGE&Y 2003)
The benefits of RFID seem promising in the pharmaceutical industry. The
implementation may pose challenges, but with the backing and possible subsidy
of regulatory agencies, these great giants of the pharmaceutical world may
gracefully adopt the new technologies.
In addition to the already challenging issues within the pharmaceutical
industry, there are also future concerns about the capacity sufficiency. As the
pharmaceutical industry undergoes metamorphosis into a biopharmaceutical
industry, the new therapies and products will be manufactured using new
techniques including protein based manufacturing. Currently, laboratories are
producing new research in product development; however the current

Mukherjee 38
manufacturing equipment is not capable of manufacturing the newer more
advanced drugs. According to Euractive.com, there are several factors which
create a gap between research and production capabilities:
1. Large capital requirements for R&D with short patent protection and
capital recovery time
2. Long build-out periods for new plants and facilities. Some of the new
plants take in excess of 5 years to design and build.
3. Monoclonal antibodies are developing into a highly effective class of
treatment, however manufacturing requires the use of mammalian cell
cultures; the world capacity for this type of production is around 450,000
liters annually.
4. Biologics manufacturing facilities and plants can cost in excess of $500
million.
5. There is a vast shortage of talent in the fields of production and
engineering for biopharmaceutical products
(Euractiv.com 2005)

Mukherjee 39
Chapter 4 – Novartis Industry Position
4.1 Novartis History
In 1758 a man by the name of Johann Geigy started selling natural dyes
and spices in Basel, Switzerland. For almost a century the family business which
he started continued under the Geigy family name and in the mid 1800’s the
business began producing synthetic dyes in addition to their existing products.
During the time frame in which the family began synthetic dye production,
another man in Basel by the name of Alexander Clavel also entered the
presumably lucrative business of synthetic dye production. The company
founded by Clavel was formally named “Gesellschaft fur Chemische Industrie
Basel” (Ciba). Following in the success of the Giegy family and Ciba, another
synthetic dye manufacturer, by the name of Sandoz, was established in 1886.
By the turn of the century Ciba had become the most prominent chemical
production company in Switzerland and continued to prosper through the
beginning of the 20th century. (Hoovers.com 2005)
Around 1920, the 3 companies of Ciba, Geigy, and Sandoz allied with
each other to form the Basel AG cartel in an effort to compete with the major
German competitor at the time, I.G. Farben. The cartel generated greater profits
which were reinvested into the diversification of its product line to include
pharmaceuticals and other chemicals. The cartel grew throughout the 1920’s
and in 1929 merged with a German company. In the 1930’s the Cartel merged
further with French and British companies to form the Quadrapartite Cartel, but in
1939 the start of the Second World War caused the relationship to splinter. The
only survivor of the dissolution was the Basel AG cartel. In 1948 one of the
cartel’s scientists received the Nobel Prize for the invention of DDT. Shortly after
the award the Basel AG Cartel broke apart into its original component
companies. (Hoovers.com 2005)
Mukherjee 40
After the separation, Geigy once again took the title of market leader in
sales and surpassed Ciba in 1967 through its diversification efforts in agricultural
chemicals. 1967 proved exciting for the Switzerland based chemical producers;
Sandoz purchased a group companies that produced Dietetic products. Three
years following the Sandoz acquisition Ciba and Geigy joined once again. The
post-merger company then proceeded to enter the US market. Ciba-Geigy,
trying to gain additional market share and foothold in the United States, acquired
Funk Seeds in 1974. Sandoz aggressively followed suit in 1976 by acquiring
Northrup, King & Co. Four years later Sandoz also acquired the Zaadune,
Dutch Seed Company. For the following decade, both companies pressured
aggressively to gain market share and presence in the United States. Ciba-
Geigy and Chiron entered a joint venture in 1986 which produced and marketed
genetically engineered vaccines; less than 8 years later, Ciba-Geigy had
acquired half of the ownership in Chiron. Sandoz continued voraciously to
compete with Ciba-Geigy and invested heavily the Genetic Therapy and
SyStemix US biotech companies. Ciba-Geigy also succeeded in making an out
of character bid to acquire Gerber in 1994. (Hoovers.com 2005)
In 1996, the long awaited reunion of Ciba, Geigy, and Sandoz finally
transpired. The product of the merger, Novartis, was a new company which had
divested of some herbicide and animal health businesses. The year following the
merger proved quite busy for Novartis; the company divested of its specialty
chemicals unit and then purchased Merck’s insecticide and fungicide divisions.
The next year Novartis combined its OTC (Over-The-Counter) health division
with its nutrition division to create a new consumer health division. The following
year this division sold several smaller business units. The company remained
quiet for two years and then acquired Wesley Jessen VisionCare in 2000. In
2001 Novartis separated its opthalmics division from its CIBA Vision division to
create a new eye health care unit under the pharmaceutical division. Novartis
continued to focus on its pharmaceutical core competencies by selling its food

Mukherjee 41
divisions and acquiring several companies in 2002 including Grand Laboratories,
Immtech Biologies, and Lek Pharmaceuticals. (Hoovers.com 2005)
4.2 Novartis Overview Mission Statement
Purpose
“We want to discover, develop and successfully market innovative
products to cure diseases, to ease suffering, and to enhance the quality of life.
We also want to provide a shareholder return that reflects outstanding
performance and to adequately reward those who invest ideas and work in our
company.” (Novartis.com 2005)
Aspirations
“We want to be recognized for having a positive impact on people's lives
with our products, meeting needs and even surpassing external expectations.
We strive to create sustainable earnings growth, ranking in the top quartile of the
industry and securing long-term business success. We want to build a reputation
for an exciting workplace in which people can realize their professional
ambitions. We strive for a motivating environment where creativity and
effectiveness are encouraged and where cutting-edge technologies are applied.
In addition, we want to contribute to society through our economic contribution,
through the positive environmental and social benefits of our products, and
through open dialogue with our stakeholders.” (Novartis.com 2005)
Although Novartis operates in over 140 countries worldwide, it’s
headquarters are centrally located in Basel Switzerland. The company provides
a wide array of products from its different divisions. Some of these products
include prescription drugs and other non prescription or OTC (Over-The-Counter)
pharmaceutical products. The pharmaceutical products include treatments for

Mukherjee 42
high blood pressure, cancer, nervous system disorders, ophthalmic conditions
and other cardiovascular disorders. In addition to privately branded and
produced products, the Sandoz generics division produces drug substances and
active pharmaceutical ingredients for sale as intermediary products to other
manufacturers or generic companies. The market demands for generic products
will be met by the ever growing Sandoz division. To that accord, Novartis
recently announced the purchase of controlling interest in Eon Labs, one of the
top producers of generic products in the US. Novartis also has a consumer
health unit which manufactures notable OTC products such as Ex-Lax, Theraflu,
Maalox, and Gas –X. Novartis also manufactures products for an infant and
baby business which includes the branded Gerber baby products. Gerber
produces over 200 branded products in the US alone, and is regarded as the
leading baby food brand in the US. (Novartis.com) Gerber products also include
care and wellness products such as shampoos, lotions, and bottles. Novartis is
also one of the top producers of contact lenses and solutions. The CIBA Vision
division markets products worldwide and is a leader in the US and Europe.
Novartis also owns an animal health unit which products pharmaceutical
products for pet care. Of the list of pet care products, Sentinel is the most known
and reputable brand. (Novartis.com)
Novartis is an industry leader!!! Since 2000, Novartis has led the industry
with regulatory approvals, and has received approval for over 13 new products.
Novartis also has over 75 drug compounds in development with 52 in Phase II,
III, or Registration. (Novartis Annual Report 2004)
4.3 Novartis Historical Revenues, Operating Margins, and Employees
Novartis is one of the top ten pharmaceutical companies in the world and
continues its trends of growth in all aspects of the industry. Novartis increased
its sales by 14% to $28.2 billion in the 2004 fiscal year alone. These increased
sales were attributed to strong growth in both the pharmaceuticals and consumer
health divisions. The US market accounted for 40% of the company’s sales

Mukherjee 43
while Europe, the second largest market for Novartis, accounted for 36%. In part
because of strong growth in Novartis’ top selling pharmaceutical products like
Diovan, the operating income grew by 11% in the 2004 fiscal year. In the 2004
fiscal year most “categories of function expenses had a positive impact on the
operating margin.” The Cost of Goods Sold (COGS) increased to 12% but
remained comparatively the same with respect to percentage of net sales. For
2004 COGS was about 23.5% of net sales while marketing and sales accounted
for 31.4%. Research and development fell slightly to 14.9% in proportion to net
sales. The overall operating margin for Novartis was 23.1% for 2004. Novartis
has maintained high profit margins above 20% since 1999. Figure 38 in the
appendix illustrates the historical revenues and margins for Novartis. For the
2004 fiscal year, Novartis demonstrated strong organic growth and overall net
income of 15% or $5.8 billion; historically, this represents the largest net income
to date for the company. This growth increase resulted in higher earnings per
share, up 16% from the pervious year, as well as an ending stock price increase
of about $5 per share. Figure 39 in the appendix illustrates the historical stock
prices and earnings for Novartis. Novartis also demonstrated better profit
margins and per share revenues than the industry averages as illustrated in
appendix figure 40 (Novartis 20F 2004)
4.4 Novartis Business Units
“Novartis is a world leader in both patent-protected and generic
pharmaceuticals as well as consumer health products.” (Novartis 20F 2004) At
the end of 2004, Novartis was divided into three divisions: Pharmaceuticals,
Consumer Heath, and Sandoz (generics).

Mukherjee 44
4.4.1 The Consumer Heath Division
The consumer heath division of Novartis is organized in to 5 business
units: OTC self-medication, animal health, medical nutrition, infant & baby, and
CIBA Vision. (Novartis 20F 2004)
4.4.2 Sandoz Generics Division
The Sandoz generics division is structured as a retail generics
manufacturer which also produces products for two other sub-businesses:
industrial products and biopharmaceuticals. Within the retail generics core,
Sandoz manufactures finished dosage galenical forms which are purchased by
pharmacies, wholesalers, hospitals, and other non core customers. Sandoz
manufactures active pharmaceutical ingredients and other ingredients for the
pharmaceutical drug manufacturing process; these products are sold to other
pharmaceutical companies. Additionally, Sandoz sells biopharmaceutical and
biotech products to the open market. (Novartis 20F 2004)
4.4.3 The Pharmaceuticals Division
The pharmaceuticals division is further broken down into the two
marketing organizations of primary care and specialty medicines. The
pharmaceutical division markets pharmaceutical products in seven therapeutic
concentration areas. The Novartis Institutes for Biomedical Research (NIBR),
which focuses on “redefining drug discovery in a new era marketed by the
completion of the human genome sequence,” also resides under the umbrella of
the pharmaceuticals division. (Novartis 20F 2004) The pharmaceutical division is
comprised of over 80 affiliated companies and employs over 47,000 people.
Products from the different therapeutic areas are also sold in over 140 different
countries worldwide.
Mukherjee 45
4.5 Novartis Products
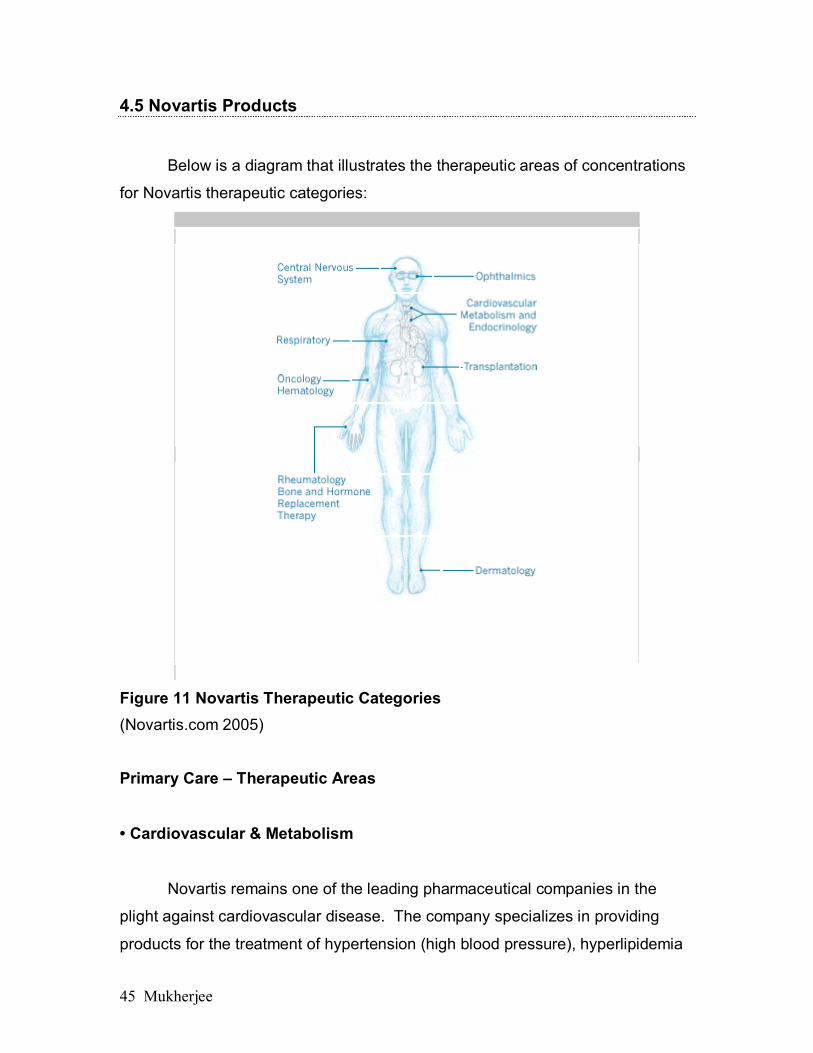
Below is a diagram that illustrates the therapeutic areas of concentrations
for Novartis therapeutic categories:
Figure 11 Novartis Therapeutic Categories (Novartis.com 2005) Primary Care – Therapeutic Areas
• Cardiovascular & Metabolism
Novartis remains one of the leading pharmaceutical companies in the
plight against cardiovascular disease. The company specializes in providing
products for the treatment of hypertension (high blood pressure), hyperlipidemia

Mukherjee 46
(high cholesterol), and heart failure. Novartis also provides additional treatments
for related prognoses including Type II diabetes. (Novartis 20F 2004) • Neuroscience
Novartis was one of the first companies to create breakthrough treatments
for neurological diseases and disorders. Some of the treatments for diseases
such as Parkinson’s Disease, Attention Deficit/Hyperactivity Disorder (AD/HD),
schizophrenia, epilepsy, and Alzheimer’s Disease date back more than 50 years
in the history of Novartis. The company currently markets an anti-epileptic
product, Trileptal, which is used by millions of people worldwide. It also provides
a product, Erelon, which offers treatment for certain degrees of Alzheimer’s
disease. Ritalin LA is one of the division’s most well know products because of
its popular use in the United States to combat childhood AD/HD. (Novartis 20F
2004)
Novartis continues to make advances in the field of Neuroscience to
enhance its portfolio of products. There are currently research efforts in the
following fields: psychiatric diseases (bipolar disorder, psychosis, depression and
anxiety), neurological disorders (Alzheimer’s disease, multiple sclerosis,
amyotrophic lateral sclerosis) and chronic pain. (Novartis 20F 2004)
• Respiratory & Dermatology
Novarts’ “focus in dermatology is on the treatment of two very common
diseases—the inflamed skin condition known as atopic dermatitis, or eczema,
and fungal nail infections.” The company’s efforts in eczema are most
recognized for the development of the product Elidel; Elidel was the first non-
steriod cream to treat eczema. Novartis also offers, and is most famous for, its
product Lamisil. Lamisil is used worldwide to treat fungal nail infection. In
addition to the topical remedies, there are several advanced treatments for
repiratory disorders including Foradil; this product provides “long-acting”

Mukherjee 47
treatment for asthma and chronic obstructive pulmonary disease (COPD).
(Novartis 20F 2004)
• ABGHI (Arthritis, bone, gastrointestinal, hormone replacement therapy, infectious diseases)
Novartis pays attention to “significant unmet medical needs, particularly in
the areas of gastrointestinal (GI) disorders (including urinary incontinence),
arthritis, osteoporosis, the treatment of pain and infectious diseases.”
The company initially entered the GI market by launching Zelnorm/Zelmac; this
product provides treatment for irritable bowel syndrome (IBS). This
groundbreaking introduction makes Novartis the first company to receive
regulatory approval for a treatment of IBS. The market for this product is
anticipated to exceed 40 million consumers in the US alone, and should
inevitably boost revenues and profitability in the ABGHI therapeutic area. In
addition to the GI treatments, Novartis also offers treatments for bone disorders
such as osteoporosis. The infectious disease area focuses on there main areas
including anti-bacterial, tropical medicine, and anti-viral. The infectious disease
research of this therapeutic area was acquired from Idenix Pharmaceuticals via
acquisition in 2003. (Novartis 20F 2004)
Specialty Medicines – Therapeutic Areas
• Oncology & Hematology
Some of the most innovative drug substances arise out of research in the
Oncology & Hematology therapeutic area. The products are geared toward the
advancement of patient care and treatment with respect to cancer. Novartis is
currently regarded as the No. 3 worldwide leader in the field of oncology and
boasts an impressive market share in excess of 9%. Some of the most innovative
and famous products in this therapeutic area include Gleevec/Glivec, Femara,
and Zometa. (Novartis 20F 2004)

Mukherjee 48
• Transplantation & Immunology
Novartis revolutionized the field of transplantation with the introduction of
Neoral in 1982. This product is currently the “worlds most commonly used
immunosuppressant.” Novartis takes credit for the discovery of cyclosporine
which is the active ingredient base for Neoral. The company continues its efforts
to research and develop new and better compounds in this therapeutic area.
Thanks to Novartis’ contributions, transplantation success rates throughout the
world have increased. (Novartis 20F 2004)
• Ophthalmics
Not to be confused with the contact lens business of CIBA vision, this
therapeutic area develops and markets products for the treatment of eye
diseases and disorders. Currently the product portfolio consists of treatments for
“Back of the Eye” and “Dry Eye.” Although colloquial sounding in name, these
problem areas represent “significant unmet medical needs.” Currently Novartis
Opthalmics is best known for its product Visudyne which can successfully
prevent or stop forms of age related vision loss. Currently there are not many
product offerings in this area, however it seems to demonstrate significant
potential for growth through R&D. (Novartis 20F 2004)

Mukherjee 49
4.6 Novartis Sales Channels and Customer Segments
Figure 12 Novartis Pharmaceutical Sales by Region Below is a list of the Particular area in which Novartis pharmaceuticals competes: • SIC Codes
– 2833Medicinals and botanicals – 2834Pharmaceutical preparations – 3851Ophthalmic goods – 5048Ophthalmic goods
• NAICS Codes – 32541Pharmaceutical and Medicine Manufacturing – 325411Medicinal and Botanical Manufacturing – 325412Pharmaceutical Preparation Manufacturing – 339115Ophthalmic Goods Manufacturing
(Hoovers.com 2004)
Sales By Region
Canada and LatinAmericaUS
Europe
Africa/Asia/Australia

Mukherjee 50
4.7 Top Competitors and Positioning Johnson & Johnson
Johnson & Johnson (J&J) is one of the world’s largest pharmaceutical
companies. J&J competes with Novartis in the pharmaceutical industry including
prescription and OTC drug products. J&J also competes in the consumer health
and baby products areas. One main differentiating factor is that J&J is one of the
most diverse companies in the health care sector. Novartis demonstrates far
more focus in its objectives and is able to compete in more specific product
categories while J&J continues to diversify. In this respect, Novartis may actually
produce better results with a focus on its core strategic competencies and
brands. J&J continues, like many other pharmaceutical companies to grow
through M&A. (Hoovers.com 2005)
Merck
Unlike J&J, Merck is comparatively more like Novartis. Merck focuses on
the pharmaceutical industry and the production of products within. Through the
last couple of years Merck has proved to be a formidable competitor in several
facets of the pharmaceutical industry. Merck is more comparable in size to
Novartis with its annual revenue for the year ending in 2004 within the same
range as that of Novartis. Additionally, Merck tends to focus on some particular
areas of illness and treatment; some of those areas overlap with therapeutic
areas which Novartis attacks. According to Hoovers.com, “Merck helps those
who are hooked on hamburgers.” Although financially well off, Merck has
encountered a series of setbacks in recent months including premature loss of
patent protection and lawsuits with respect to major revenue generating
products. (Hoovers.com 2005)

Mukherjee 51
Pfizer
Pfizer is recognized as the “world’s largest research-based
pharmaceuticals firm.” Pfizer, like Novartis and Merck, focuses its effort solely in
the pharmaceutical industry. Although very broad in pharmaceutical product
category competition, Pfizer does not diversify its business like J&J. Pfizer also
tends to focus its effort on the creation of Blockbuster drugs. This year Pfizer
touted its size with 10 of its drug products each toping the $1 billion mark in
sales. Pfizer competes extensively in the US and remains in the lead of the
industry with respect to sales. Novartis realizes some of its stiffest competition
from Pfizer. (Hoovers.com 2005)
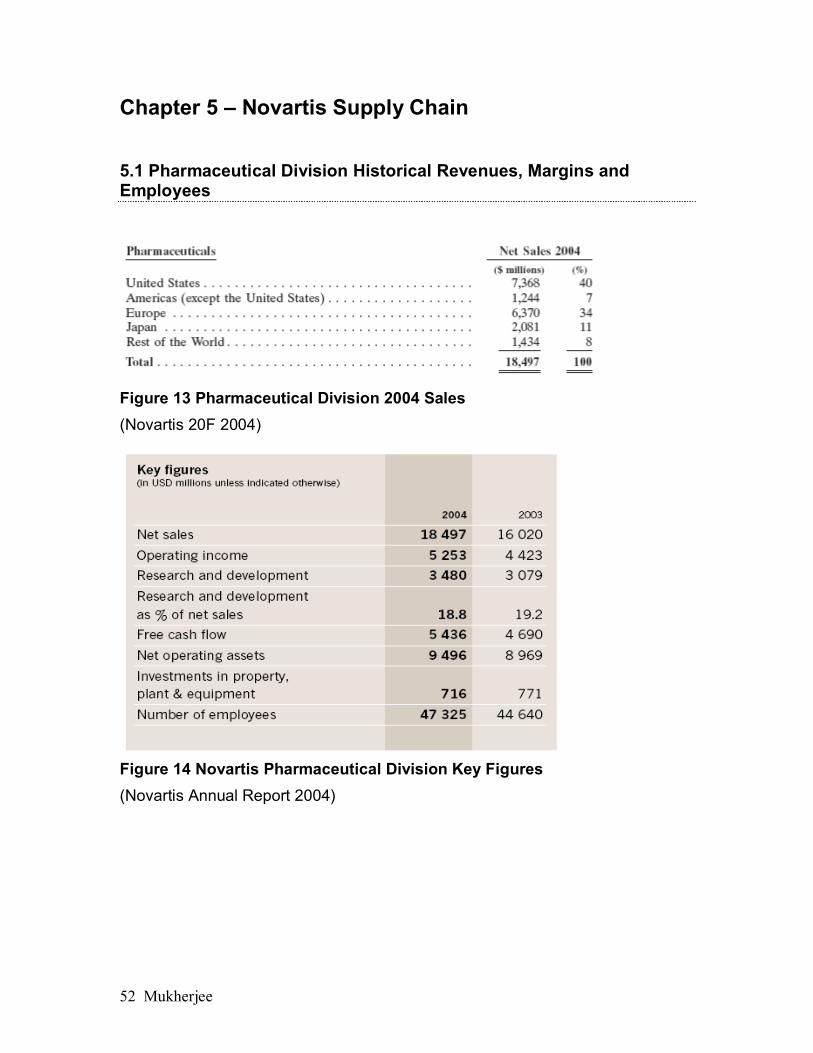
Mukherjee 52
Chapter 5 – Novartis Supply Chain
5.1 Pharmaceutical Division Historical Revenues, Margins and Employees
Figure 13 Pharmaceutical Division 2004 Sales (Novartis 20F 2004)
Figure 14 Novartis Pharmaceutical Division Key Figures (Novartis Annual Report 2004)

Mukherjee 53
Figure 15 Top 20 Pharmaceutical Product Sales (Novartis 20F 2004)
“In 2004, group sales increased 14% to $28.2 billion. Pharmaceutical
sales climbed 15% to $18.5 billion. The oncology and cardiovascular
franchises grew 22% and 21% respectively and continued to be the main drivers
throughout the year with market share expanding globally. At the consumer
health division, full-year sales grew 10%.” (Novartis 20F 2004)
“Novartis has launched 13 new medicines in the US since 2000. Our rich
pipeline, with a total of 75 compounds and 52 projects in advanced development
or registration, was rated as one of the industry’s strongest by financial analysts.”
(Novartis 20F 2004)
Mukherjee 54
5.2 Pharmaceutical Division Business Units
The nature of the Novartis supply chain subdivides responsibilities for the
purpose of vertical integration. Historically, the Novartis supply chain is
comprised of multiple locations throughout the world.
Subdivision of Supply Chain:
Chemical Operations (ChemOps): The ChemOps facilities are
responsible for the transformation of raw materials or chemicals into the final
drug substance. This process can take between 7 and 15 months and can
involve as many as 8-9 chemical processing steps. The ChemOps facilities
procure chemicals in a very basic form and transform them into a final
concentrated drug substance.
Pharmaceutical Operations (PharmOps): The PharmOps facilites are
responsible for taking the highly purified and concentrated drug substance and
transforming it into the final galenical forms. This process involves the milling
and blending of the drug substance. This process usually takes between 2-3
months. Once the final galenical form is produced, the product is then packaged
and placed into finished product inventory in Basel, Switzerland.
Country Pharmaceutical Office (CPO): The CPO is responsible for the
sales and distribution of products within a specific geographic region. Some of
the CPOs are owned and operated by Novartis while others are operated by third
parties or country specific agents. Novartis prefers to own and operate their own
CPOs however some country regulations require partnerships or third party
interactions.

Mukherjee 55
5.3 Pharmaceutical Division Products (including #s, % new, % promoted)
Novartis adopted a new philosophy for bringing products to market. Once
a product receives approval, TechOps (Technical operations) plans to “Launch in
1000 Days.” (Novartis Interview 2005) Eventually, the TechOps group plans to
implement an improved policy which will allow them to “Launch in 600 Days.” By
shortening the time which it takes to get a product to market, Novartis can
capitalize on the additional time under patent protection. An extra year in the
market without competition from generic drugs, for instance, could make a
significant difference in the overall financial success of a new product with
respect to its R&D cost basis. Novartis is reducing the time to launch by creating
closer integration between the clinical trials production process and the final
manufacturing process. By learning and improving on the manufacturing process
while Novartis is still performing clinical trials, they can learn more about the
efficiencies of manufacturing the final product and create a repository of
information. Novartis is also beginning to start manufacturing the final product for
market based on estimates of when the drug substance will receive approval. By
anticipating the approval date in a given region, Novartis is able to go to market
with the product much more quickly after approval is received. There are risks
involved; Novartis could be refused approval and have additional sunk costs in a
manufactured product which will never sell. This sunk manufacturing cost,
however, is relatively insignificant in comparison to the loss of R&D funds for a
failed product and is considered an acceptable financial risk.
Products coming off patent
• Neoral 2009 • Sandostatin Expiring • Cibacen/Lotensin/Cibadrex Expiring • Lotrel 2017 • Lamisil 2006 • Miacalcin/Miacalcic 2015 • Voltaren Expired
(Novartis 20F 2003)
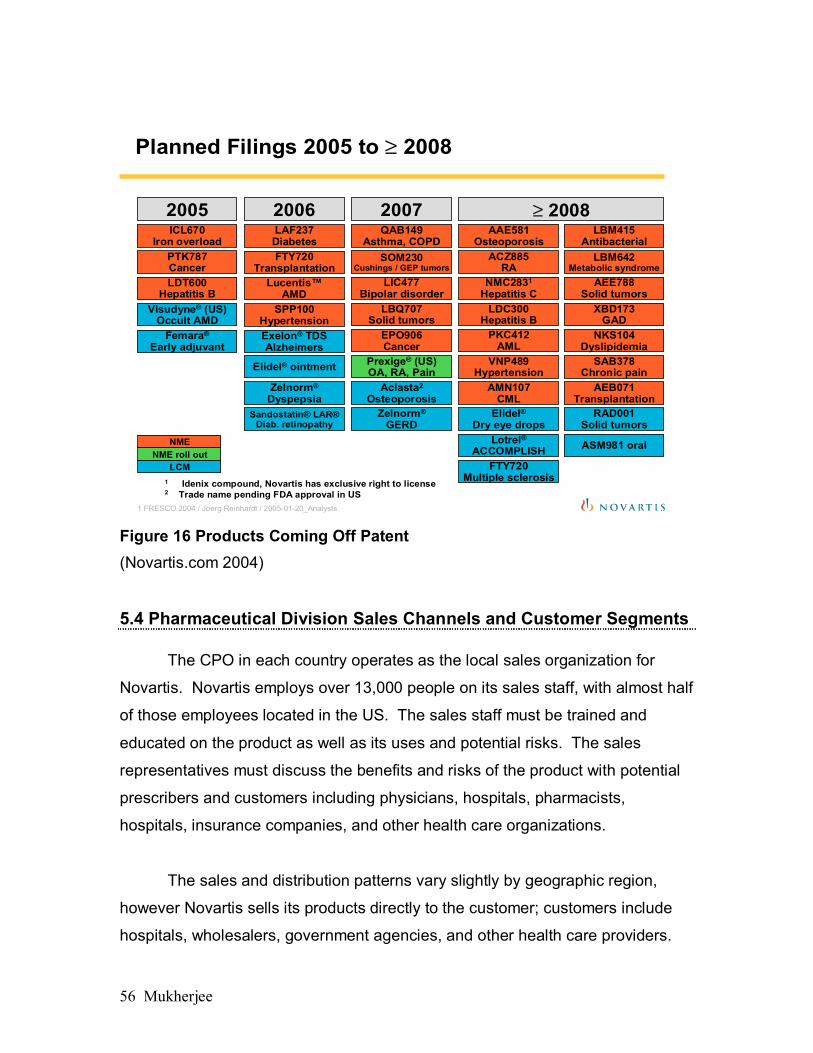
Mukherjee 56
1 FRESCO 2004 / Joerg Reinhardt / 2005-01-20_Analysts
Planned Filings 2005 to ≥ 2008
1 Idenix compound, Novartis has exclusive right to license2 Trade name pending FDA approval in US
LCM
NMENME roll out
2006 ≥ 20082005
FTY720Transplantation
Zelnorm®
DyspepsiaSandostatin® LAR®
Diab. retinopathy
Femara®
Early adjuvantEPO906Cancer
ICL670Iron overload
LAF237Diabetes
SPP100Hypertension
Elidel® ointment
Zelnorm®
GERD
ASM981 oral
SOM230Cushings / GEP tumors
QAB149Asthma, COPD
Aclasta2
Osteoporosis
FTY720Multiple sclerosis
RAD001Solid tumors
PTK787Cancer
Lucentis™AMD
LDT600Hepatitis B
SAB378Chronic pain
LDC300Hepatitis B
Exelon® TDSAlzheimers
LIC477Bipolar disorder
Prexige® (US)OA, RA, Pain
Visudyne® (US)Occult AMD
LBQ707Solid tumors
NKS104Dyslipidemia
PKC412AML
ACZ885RA
Elidel®
Dry eye drops
AAE581Osteoporosis
Lotrel®ACCOMPLISH
LBM642Metabolic syndrome
2007
AMN107CML
VNP489Hypertension
AEB071Transplantation
XBD173GAD
AEE788Solid tumors
NMC2831
Hepatitis C
LBM415Antibacterial
Figure 16 Products Coming Off Patent (Novartis.com 2004)
5.4 Pharmaceutical Division Sales Channels and Customer Segments
The CPO in each country operates as the local sales organization for
Novartis. Novartis employs over 13,000 people on its sales staff, with almost half
of those employees located in the US. The sales staff must be trained and
educated on the product as well as its uses and potential risks. The sales
representatives must discuss the benefits and risks of the product with potential
prescribers and customers including physicians, hospitals, pharmacists,
hospitals, insurance companies, and other health care organizations.
The sales and distribution patterns vary slightly by geographic region,
however Novartis sells its products directly to the customer; customers include
hospitals, wholesalers, government agencies, and other health care providers.

Mukherjee 57
Novartis does not segment its customers or sales channels. The nature of the
pharmaceutical industry makes it very difficult for the organization to accurately
track and measure the performance of sales staff and allocation of sales credits.
For this reason, Novartis only segments its customers on a geographic basis.
The geographical segmentation is attributed to the difference in regulations within
the various respective geographic regions. (Novartis 20F 2004)
5.5 Pharmaceutical Division Competition and Positioning
Competition amongst drug manufacturers remains high. Novartis
competes in both the branded pharmaceutical market as well as the generics
market. Novartis regards the following companies as top competitors: Abbott,
AstraZeneca, Bristol-Myers Squibb, Eli Lilly, GlaxoSmithKline, Johnson &
Johnson, Merck, Pfizer, Sanofi-Aventis, Schering-Plough and Wyeth. (Novartis
20F 2004) The majority of competition in the pharmaceutical industry takes
place at the R&D level. Once new products are created, companies usually
receive exclusivity and patent protection for several years before a competitor
can reproduce the product. Companies will, however try to create alternative
products which address the same treatment area but provide better results.
According to Novartis, once two companies have produced comparable products
then the competition takes place in the following arenas: “commercial activities,
including pricing, product characteristics, customer service, sales and marketing,
and research and development.” (Novartis 20F 2004)
In addition to the branded pharmaceutical products, Novartis also
encounters competition from generic players when products lose patent
protection. Novartis notes, that even with patent protection, some markets do not
honor intellectual property rights. (Novartis 20F 2004)

Mukherjee 58
According to the author’s interview sources, Novartis considers the
following companies competition in the respective categories listed below:
1. Pfizer – Top competitor based on overall size.
2. Roche and BMS – Top competitors in the therapeutic category of
oncology.
3. J & J – presents the heaviest competition in the US in the field of
ophthalmics.
4. Pfizer, Glaxo, and Merck – all present heavy competition in the
hypertension therapeutic category.
With respect to its own competencies and positioning, Novartis
management considers the following areas as strengths within its own
organization:
1. Transplantation - Novartis considers itself the market leader in
transplantation
2. General Medicine - strongest therapeutic category in sales
3. Oncology - the strongest therapeutic category in terms of profitability
4. Ophthalmics - small comparatively, but very profitable
5. Antibiotics – Novartis does not currently compete in this market
6. Vaccines – Novartis owns licenses for vaccine products, however they do
not product vaccines because of the high barriers to entry for vaccine
production; it is more cost effective to license the products to a third party.
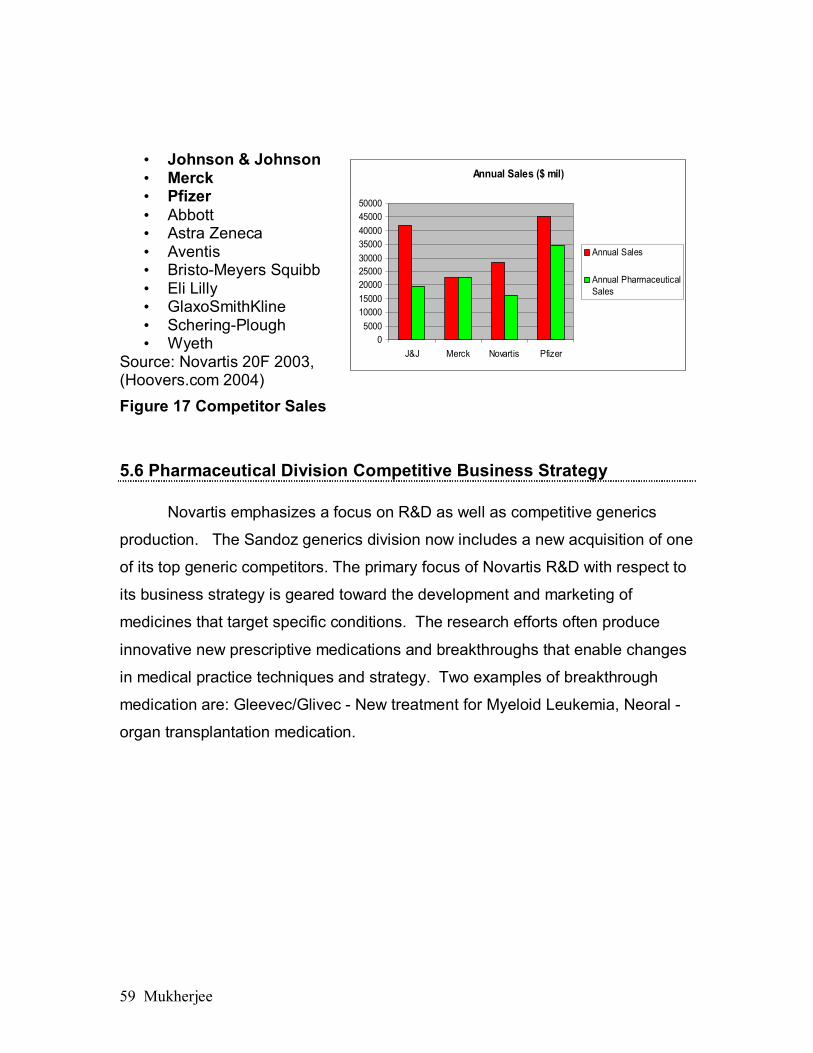
Mukherjee 59
• Johnson & Johnson • Merck • Pfizer • Abbott • Astra Zeneca • Aventis • Bristo-Meyers Squibb • Eli Lilly • GlaxoSmithKline • Schering-Plough • Wyeth
Source: Novartis 20F 2003, (Hoovers.com 2004) Figure 17 Competitor Sales
5.6 Pharmaceutical Division Competitive Business Strategy
Novartis emphasizes a focus on R&D as well as competitive generics
production. The Sandoz generics division now includes a new acquisition of one
of its top generic competitors. The primary focus of Novartis R&D with respect to
its business strategy is geared toward the development and marketing of
medicines that target specific conditions. The research efforts often produce
innovative new prescriptive medications and breakthroughs that enable changes
in medical practice techniques and strategy. Two examples of breakthrough
medication are: Gleevec/Glivec - New treatment for Myeloid Leukemia, Neoral -
organ transplantation medication.
Annual Sales ($ mil)
05000
100001500020000250003000035000400004500050000
J&J Merck Novartis Pfizer
Annual Sales
Annual PharmaceuticalSales

Mukherjee 60
Figure 18 R&D Expenditures 00 - 04 (Novartis Annual Report 2004)
5.7 Pharmaceutical Division Operating Model
Because of the vast differences in regulations between the different
markets (manufacturing process, language, warning labels, package/dosage
size) as well as the wide variety of galenical forms, Novartis experiences a high
degree of SKU proliferation as the following figure illustrates.
Figure 19 SKU Proliferation (Novartis Presentation 2005)
One batch DS Multiple batches DP Multiple batches of packed Finished Products and Primary Packs

Mukherjee 61
Figure 20 Production Timeline (Novartis Presentation 2005) The drug substance manufacturing (or in some instances procurement) takes
place under the chemical operations unit (ChemOps).
Customer9 - 12 mth 2-3
ChemOps PharmOps CPO
Finished Products
Drug Substance Drug
Product
Organization
Timeline
Production Steps

Mukherjee 62
Figure 21 Supply Chain Layout (Novartis Presentation 2005) DS is Drug Substance. This is stored in Basel and
is made to stock. The remainder of the supply chain after the DS Stock is pulled
The generics business primarily focuses on the replication of other
companies’ products but there may be some future competitive advantage to
having collaboration with their own pharmaceutical division for their own products
coming off patent. As of now there is very little collaboration between the
divisions; the divisions are managed and run like separate entities. Based on
interview information, the generics manufacturing is primarily driven by the local
markets, and there is not much production that is transferred from one region to
another.
February 2005/BSt Introduction program GSCM9
Supply Chain StructureNovartis Pharma worldwide
Pharma Chemical Operations
UnitedKingdomIreland
Switzerland
Pharmaceutical Operations
CPO’s3rd parties
Europe Pool
North America Pool
Latam Pool
National plants
Pharmacy
Wholesaler
Hospital
Agents
Patient
Asia Pacific
Europe
NorthAmerica
LatinAmerica
Novartis: UK, DE, FR, ES, IT, TR, CH, 3rd party: CH, FR,
Novartis: US, 3rd party: US, CA
Novartis: MX, BR3rd party: AR
Novartis: MA; EG, ID, JP3rd party: many locally managed
Other Countries
DSStock

Mukherjee 63
The pharmaceutical division purchases some active ingredients from the
generics division but the relationship is similar to a supplier-customer
relationship. Presently they do not share facilities between the generics and
pharmaceutical division. Novartis recently completed a substantial acquisition for
its Sandoz division and based on interview information, the supply chain
management does not know what the post acquisition landscape will look like.
Resource and facility sharing may be on the forefront.
Production -
The production process starts with the procurement of raw chemicals and
the manufacturing of the active ingredients. After the active ingredient is
manufactured, the product must be granulized for the manufacture of different
galenical forms. There is very little fault tolerance and variability allowed in the
granulation process. After the granulation process, the product is then
compressed (tablet or capsule galenical forms) and then coated. Once the
coating takes place the product is then labeled and packaged for distribution. It
only takes 2-3 days for the finished product to arrive at the CPO (country
pharmaceutical organization). The CPO’s consist of corporate owned facilities as
well as third party and agent owned organizations. The CPO in a specific
country is responsible for the distribution and sale of product to Novartis’ end
customer. This end consumer is usually a pharmacy, wholesaler, hospital, or
agent. Novartis operates their own CPO in 64 of the 140 countries in which they
sell products. (Novartis Interview 2005)
The PharmOps (Pharmaceutical Operations) facilities perform the
manufacturing of the final galenical forms. This manufacturing is performed as
toll-manufacturing process in which the substance is moved to the PharmOps
facility from Basel through a transfer price that is set by the funds flow committee.
After the PharmOps facility finishes the manufacturing, the product is then
Mukherjee 64
marked up and sent back to Basel with a new transfer price. (Novartis Interview
2005)
M&A - Since its inception and throughout the history of its component
companies, Novartis has been the product of mergers and acquisitions. In recent
years the acquisition of new firms has posed new organizational challenges as
Novartis tries to consolidate supply chain activities. Each time the company
acquires a new firm, they must rethink their existing infrastructure and reevaluate
their SCM operations. Many of the company’s facility locations are historically
determined from M&A. This history also tends to be structured around the
optimization (minimization) of the company’s income taxes.
The active ingredients for the drug compounds are manufactured in a
batch process. Batch production is necessary because of the nature of chemical
manufacturing and the regulatory approval process. Batch production also
facilitates a desire to maintain high standards of quality control. Batch sizes are
generally determined by the availability of existing technology and equipment.
With batch production quality control is easier to maintain. The product mix
remains the same while the testing processes and manufacturing process are
certified by the regulatory body. When a drug compound receives regulatory
approval, the criterion for the manufacturing process and testing are very
specifically and explicitly defined. Any deviation from the process will place the
company at risk of having production suspended. It is possible to change the
production process; however the new batch mixtures and formulas must also be
re-approved by the agencies. These changes are sometimes necessary when
newer and more efficient methods of production are discovered. The process of
amending regulatory approval to include new or altered production techniques
and batch sizes can take as little as 30 days and as long as 2 years depending
on several factors including the nature of the particular product and the laws
within a particular country. Changes in the manufacturing recipe can cost
between $200k and $500k; changes to the galenical form of a product are much

Mukherjee 65
more costly and for that reason galenical form decisions are made early in the
new product development process. The manufacturer is also responsible for
maintaining batch level production for tracking and tracing of recalls. Continuous
production does not allow for the manufacturer to eliminate products containing
faults, identify the failure in the production process, and recall all effected
product. Technology primarily dictates batch formulation and sizing. (Interview
2005)
The manufacturing process can often be tedious. In an effort to maintain
proper standards within each of the countries, the manufacturing process must
adhere to all standards for all countries. If there are discrepancies, separate and
specific manufacturing processes may be necessary for particular regions and
countries. This causes additional complexity in the quality control and
manufacturing processes.
Production scheduling remains a difficult process. Products which share a
galenical form will often share the same equipment. It is necessary to determine
how to best utilize the equipment which is available. There is also a corporate
initiative to maximize asset utilization so down time on equipment is usually
restricted to cleanings and changeovers between production campaigns. When
material changes in demand occur, it is possible to shift production. Given the
long lead/production times required for pharmaceutical products it is not feasible
to adjust for small nonmaterial demand changes on a short term basis. Novartis
also utilizes an inventory buffer of finished goods to compensate for small
nonmaterial fluctuations in demand.
Manufacturing production quantities are primarily driven by aggregate
demand forecasting. The demand forecasts are broken into three categories:
optimistic, realistic, and pessimistic.

Mukherjee 66
• Products are mostly developed for the treatment of chronic illness and
therefore sales are not subject to material changes in seasonal demand
(Novartis 20F 2003)
• Key Goal: “…ensure the uninterrupted, timely and cost-effective supply of
products that meet all product specifications.” (Novartis 20F 2003)
Figure 22 Novartis Headquarters Location Map (SPG Media Limited a subsidiary of SPG Media Group PLC 2004) Novartis chooses to utilize Basel Switzerland as its “Tax Haven”
5.7.1 Orders by channel Novartis does not segment its orders by channel, but rather on a
geographically specific distribution model. The orders in a particular country are
taken by the local CPO in the respective country. All orders are treated the same
and routed to the appropriate CPO for distribution. Once the product has arrived
at the CPO, it is then forwarded to the final customer and payment is arranged.
All transactional coordination of orders is managed at the country specific
location. The CPO is responsible for the distribution of both prescription and

Mukherjee 67
nonprescription products. In some instances where the CPO is owned and
operated by an agent or third party, the CPO actually is the customer.
5.7.2 Order fulfillment
In a press release from SAP dated June 16th, 2003, Novartis AG
announced that it had selected SAP to handle its information system software
needs. This software is intended to support the global strategy by which Novartis
intends to synchronize its global operations. The SAP solution is intended to
replace legacy systems across the world and create new research and develop
efficiencies in administration, production, HR, supplier relationships, and other
supply chain functions. The company intends to reduce integration costs through
the implementation of SAP. Peter Sany, Corporate CIO, said, “When faced with a
choice between stand-alone systems or a suite solution, the added value,
scalability, and flexibility of mySAP Business Suite made SAP the clear choice,
“Novartis needed a long-term strategic commitment and decided that
SAP's industry experience and innovative solutions could best help them quickly
reach their immediate aims while enabling them to carve an evolutionary path for
deploying new solutions as future demands arise," said Henning Kagermann,
chairman and CEO, SAP AG. "SAP solutions can streamline fragmented
manufacturing, supply chain, and human capital management processes,
enabling better collaboration with Novartis's worldwide supplier network and give
Novartis the transparency and efficiency it needs across its global operations."
Novartis has chosen to implement mySAP™ Supply Chain Management.
This adoption of new technology was driven in part by US FDA regulation
compliance requirements.
The SAP solution will help to accelerate the procurement process for
direct material acquisition by reducing communication errors. The system will
also increase visibility of materials during the procurement process allowing more
accurate tracking, tracing, and forecasting of product in the pipeline. SAP

Mukherjee 68
promises to increase the reliability of delivery dates and quantities and provide
more seamless integration with suppliers. The system will also standardize the
platform for data interchange allowing management to eliminate the need for
various proprietary interfaces and document interchanges, or “middleware”.
The system also provide a web-based supplier interface to support the
deployment of the SAP® Advanced Planning & Optimization (SAP APO)
component of mySAP SCM. These tools will assist in demand and supply
network planning processes for drug substances, drug products, and finished
goods. Novartis should gain shorter forecasting cycles and planning intervals
overall reducing the costs of operating their global supply chain.
For the purpose of order fulfillment, Novartis has identified the decoupling
point in their supply chain. Novartis must carefully manage the inventory level at
the decoupling point in order to prevent stockouts and surplus.
Figure 23 Novartis Decoupling Point Illustration (Novartis Presentation 2005)
5.7.3 Facilities
Novartis maintains a policy of owning and operating its own facilities. The
belief that this policy will add to shareholder value as well as ensure the ability to
adequately control the operations within each facility remains an underlying
concern of the organization. There are a few exceptions to this policy; however
these agreements reflect idiosyncrasies in the particular locations which
prevented ownership. Below, in Figure 24 you will see a map of the supply chain
for the Pharmaceutical division and the dispersion of facilities across the world.
Chemical Intermediates
Drug Product
Finished Product
Drug Substance

Mukherjee 69
Additionally, Figure 25 provides a listing of the facilities which are depicted in
Figure 24. Furthermore, figure 58 in the appendix describes the size, location,
and primary functions of each of the Novartis facilities within their division.
Please note that Novartis also maintains research facilities in addition to their
production facilities. These facilities play an essential role in the R&D process
which offers Novartis substantial competitive advantages as well as ensures
future revenues. (Novartis 2004 20F)
February 2005/BSt Introduction program GSCM6
An International Supply Network
8,300 Associates18 Countries
4 ChemOps Plants15 PharmOps Plants
8 3rd party suppliers
Figure 24 Supply Chain Facility Map (Novartis Presentation 2005)
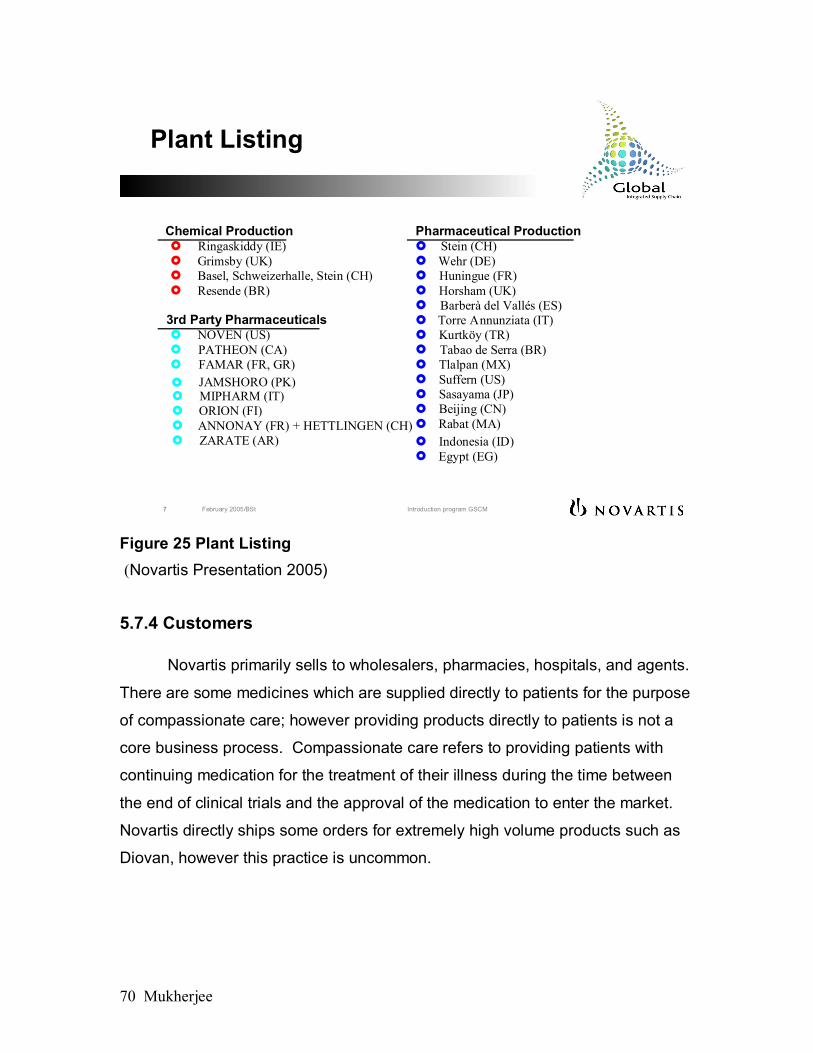
Mukherjee 70
February 2005/BSt Introduction program GSCM7
Plant Listing
Chemical Production Pharmaceutical ProductionRingaskiddy (IE) Stein (CH)Grimsby (UK) Wehr (DE)Basel, Schweizerhalle, Stein (CH) Huningue (FR)Resende (BR) Horsham (UK)
Barberà del Vallés (ES)3rd Party Pharmaceuticals Torre Annunziata (IT)
NOVEN (US) Kurtköy (TR)PATHEON (CA) Tabao de Serra (BR)FAMAR (FR, GR) Tlalpan (MX)
MIPHARM (IT)Suffern (US)
ORION (FI)Sasayama (JP)
ANNONAY (FR) + HETTLINGEN (CH)Beijing (CN)
ZARATE (AR)Rabat (MA)
JAMSHORO (PK)
Indonesia (ID)Egypt (EG)
Figure 25 Plant Listing (Novartis Presentation 2005)
5.7.4 Customers
Novartis primarily sells to wholesalers, pharmacies, hospitals, and agents.
There are some medicines which are supplied directly to patients for the purpose
of compassionate care; however providing products directly to patients is not a
core business process. Compassionate care refers to providing patients with
continuing medication for the treatment of their illness during the time between
the end of clinical trials and the approval of the medication to enter the market.
Novartis directly ships some orders for extremely high volume products such as
Diovan, however this practice is uncommon.

Mukherjee 71
5.7.5 Suppliers
Although global contracts exist for the purchase of raw materials, each
location is responsible for its own procurement. For example, each PharmOps
location will have access to some purchasing arrangements and benefits from
the global organization; but the local organization is responsible for the
procurement. They must sign an individual contract with their suppliers for the
procurement of both active and exigent ingredients.
5.7.6 Products
The Novartis pharmaceutical division focuses primarily on prescription
drug products. The products are segmented into various therapeutic categories
for management and distribution. The products share resources including:
production facilities and equipment; packaging and processing equipment;
distribution facilities; and even sales staff. The higher revenue products are
managed on a brand pipeline basis while the smaller products are managed in
aggregation with others. Novartis does not usually dedicate any resources to a
particular product; one exception however, is their largest product, Diovan, which
receives some dedicated equipment that was purchased to accommodate
demand.

Mukherjee 72
5.8 Pharmaceutical Division Supply Chain Organizational Structure
February 2005/BSt Introduction program GSCM16
Tech Ops Organisation Matrix
BiotechOpssite n
PharmOpssite n
GlobalFunctions
HR, IT, Finance
Manu-facturingGQO SCM Purchasing
GlobalFunctions
HR, IT, Finance
Manu-facturingGQO SCM Purchasing
GlobalTechOps
PharmOps
ChemOps
BiotechOps
CPO
PharmOps
ChemOps
BiotechOps
CPO
ChemOpssite n
Manu-facturing
Manu-facturing
Manu-facturing
QA SCM
SCM
SCM
Purchasing HR, IT, Finance
HR, IT, FinanceHR, IT, Finance
LocalFunctionsQA
QA HR, IT, FinanceHR, IT, Finance
CPOsite n QA SCM
Purchasing
Purchasing
HR, ITFinance
Purchasing
Figure 26 TechOps Organizational Chart (Novartis Presentation 2005)

Mukherjee 73
February 2005/BSt Introduction program GSCM17
Tech Ops OrganisationAs of January 2005
Figure 27 TechOps Organizational Sub Chart (Novartis Presentation 2005)

Mukherjee 74
February 2005/BSt Introduction program GSCM18
GSCM structureOrganisation
•This chart indicates the members of the Global Supply Chain Management Function.
•Actual reporting relationships of these members are within the companies which employ them.
Kurt ReberGlobal Supply Chain
Management
Jerh CollinsChemOps SCM
Jim EdwardsCPO SCM Operations
NNPharmOps SCM
Pieter de KoningTurntable Operations
Basel
NNGlobal
Supply Chain PlanningImplementation
Karl LangArtwork Operation
Basel
Stanislaw BukowieckiOrganizational
Development & ChangeManagement
Corine GrosheitschAdministrative Assistant
Harald SchützQuality Assurance
Global SCMOperations
Global SCMUnits
FunctionalSupport
Staff
Martin KäppnerPurchasing W&T
Olga FurioFinance / BPA
Roland KienzlerHuman Resources
Olivier ThomasBrand PipelineManagement
Martin SchmidSupply ProjectImplementation
Antonio MazzarielloGlobal Material Master
Management
Scott CameronInformation Management
Figure 28 Global Supply Chain Management Organizational Chart (Novartis Presentation 2005)
5.9 Pharmaceutical Division Supply – Side Business Processes • Source/Make Decision-Making
Each ChemOps location is able to make its own decisions about where to
source the chemical components for making drug substances. Some of the
ChemOps locations rely on global sourcing agreements by which they receive
competitive pricing. There is a global purchasing group within Novartis that
manages the purchasing requirements for all the Novartis facilities. The
purchasing group, however, does not purchase the product and then distribute it
to the various production facilities. Each production facility has independent
contracts with its suppliers and is able to seek the best prices on products.

Mukherjee 75
Because of the differences in the pricing for raw chemical materials in the
different regions, this allows each ChemOps location to receive the best pricing
for its particular location by sourcing locally.
Novartis manufactures its own drug substances. It is possible to purchase
active ingredients on the open market or to outsource the production of
proprietary drug substances, however Novartis chooses to keep all of its
production in-house to reduce costs and maximize asset utilization. The Sandoz
division of Novartis also manufactures active ingredients and drug substances for
other manufacturers.
All of the ChemOps locations are currently running SAP. In the next year,
all the production locations should be on the SAP system which will allow the
chemical production process for the various drug substances to better coordinate
with the remainder of the supply chain.
• Supplier selection and supply chain design
In the past, Novartis has not experienced any major interruptions in the
supply of raw materials. Although the supply of materials is expected to continue
without interruption, Novartis has implemented a global manufacturing strategy to
maximize their business continuity. In doing so, Novartis chooses to do business
with suppliers who have high service levels; Novartis also does not depend on
any one particular supplier. Management believes that, because of the highly
regulated nature of the pharmaceutical business, at any point in time one of their
suppliers could fail in their responsibilities for regulatory compliance. In the event
that a third party supplier was to fail to meet requirements, the implications
through the supply chain could be far reaching. Some of the implications could
include a government mandated recall of products containing materials from a
particular supplier. In addition, governmental agencies could suspend
manufacturing facilities until costly inspections and recertification is performed.

Mukherjee 76
Any major disruptions of this nature could result in shortages in the overall supply
of products to the customers.
In addition to limiting the quality and number of external suppliers,
Novartis also subscribes to a philosophy of producing as many of their materials
in-house as possible; this assists in their goal for maximized asset utilization.
When Novartis decides to source externally, policy dictates for the company “to
maintain multiple supply sources so that the business is not dependant on a
single or limited number of suppliers.” Novartis takes business continuity
seriously; they monitor market developments and the potential effects on the
supply of materials. One benefit of the in-house manufacturing philosophy is that
the materials that Novartis procures are quite basic in nature. As a result, the
raw materials have both high pricing stability as well as good availability. As
always, no supplier is chosen without rigorous attention to quality standards.
(Novartis 2004 20F/Interview 2005)
• Supplier segmentation
Since the nature of the products which Novartis procures is fairly standard
and readily available on the commodity market, Novartis makes other
commitments to supplier segmentation. The company maintains strong
objectives for creating and maintaining supplier diversity. By diversity Novartis
means that prospective suppliers must adhere to the following four basic
operating principles:
1. “Ensuring business opportunities for minority and women-owned suppliers
and other diverse businesses.”
2. “Leveraging multiple sources of talent wherever that talent is to be found.”
3. “Developing and extending diverse supplier relationships.”
4. “Communicating the value of supplier diversity, both internally and
externally.” (Novartis.com 2005)

Mukherjee 77
Novartis believes that by abiding by the 4 stated principles their company
will move into a “top tier of best-in class companies that are recognized for
creating and maintaining such diverse partnerships.” In addition, Novartis
subscribes to the philosophy that diverse suppliers will enhance the end
customer and community experience. The diversity instilled in the supplier base
is intended to more accurately reflect the diversity of their customer base.
Novartis also encourages 1st tier suppliers to instill the same diversity
requirements in their suppliers creating a diversified 2nd tier of suppliers.
(Novartis.com 2005)
• Supplier management
The suppliers for the ChemOps facilities are contracted locally. The
suppliers must meet requirements for production and regulatory standards.
Generally, Novartis has individual contracts between suppliers and the local
facilities. The facility management works directly with suppliers to create and
manage these relationships. This local level of interaction allows the facility
management the autonomy to make decisions and act quickly without the red
tape of a large bureaucracy. There is not much collaboration between Novartis
and its suppliers since the products are generally considered commodities and
Novartis is vertically integrated; they only procure very basic chemicals. Novartis
utilizes some SAP functions for supplier integration.
• Collaborative new product development
Novartis realizes the need to bring new pharmaceutical products to market
as rapidly as possible. In the global pharmaceutical industry, other companies
often produce similar or copycat products once a new product or treatment is
released to market. The competitive landscape makes the rapid discovery and
development of new products essential for success. Because of the need for
expediency, Novartis tries to build on the success of other partner companies.

Mukherjee 78
“Novartis has a long tradition of collaboration with partners with complimentary
strengths.” (Novartis.com 2005) Through collaboration Novartis partners with
companies who are often smaller in size and do not have the resources or capitol
to bring new products to market rapidly. Novartis creates “…fair, effective, and
mutually beneficial – winning – collaborations.” (Novartis.com 2005) Novartis
believes that they are among the top companies in terms of their total number of
collaborations. Additionally, the collaboration allows Novartis to acquire research
and development in intermediate stages and shorten the time necessary to bring
the product to market. These collaboration efforts are also useful when a product
has multiple potential uses. In the even that a product may treat conditions
which are not in one of Novartis’ core therapeutic categories, Novartis may
choose only to market the product for a particular use. Another company,
through a cooperative agreement, will market the same product produced by
Novartis for other therapeutic categories in its respective core. These
agreements also allow Novartis to share the risks associated with R&D
expenditures as well as the marketing cost if the product receives regulatory
approvals.
CEO and chairman, Dr. Daniel Vasella believes,
“The importance that we place on building winning collaborations is
evidenced by the early and substantial involvement of senior
management. In this way, we achieve quick decision making and the
allocation of necessary resources to achieve success. Thereafter, in the
case of project and product commercialization collaborations, we aim to
establish teams with representation from both partners. Both the NIBR
Strategic Alliances and the Pharma Business Development and Licensing
groups work hand-in-hand to seamlessly integrate the cooperation
process.”

Mukherjee 79
The following is a list of current licensing and collaboration opportunities with
Novartis: Product Indication Mechanism Phase
QAD171A Male Erectile Dysfunction
Phosphodiesterase 5 (PDE5) Inhibitor
Phase II
MGR793 Pain MGluR5 antagonist pre-clinical
MAR327 Schizophrenia
Dopamine D2/ serotonin 5 HT1A partial antagonist
pre-clinical
KC0912 Asthma K Channel Activator Phase IIa
Product Description
Biochip - Microarray Platform
Significantly enhanced sensitivity as compared to commercial chips. To be applied for genetics, genomics, and proteomics
Cibacen® Cibadrex®
Product acquisition in Europe
Figure 29 Collaboration Opportunities Chart (Novartis.com 2005)
• Purchasing/procurement
Although there is a global purchasing and procurement group, they only
provide guidance and assistance for the local facilities. The global purchasing
group assists in the creation of contracts and the decision support for the
sourcing, however the final decision for sourcing and procurement is made at the
local facility level. The role of the global purchasing group is still being defined
since it was only recently created in support of turntable operations. Previously,
each facility had a purchasing department which handled its local decisions.
Now the global purchasing group facilitates the procurement, however the
procurement still takes place on a local level.

Mukherjee 80
5.10 Pharmaceutical Division - Inside Business Processes • Product portfolio management
The portfolio of products includes innovative medicines such as Neoral
and Gleevec, as well as generic and self medication drug products. Generic
production provides the company with the opportunity to capitalize on products,
mostly those of competitors, which have lost patent protection. With heavy
pressure from regulatory agencies and managed health care, the generic market
allows the company to hedge its R&D investments against the R&D success of
its competitors. The company also has the ability to compete in mature product
markets which are not within the scope of its R&D core competency. The
generics production unit of Novartis, Sandoz, provides generic low cost
alternatives to the market. The Sandoz business unit experienced some delays
in new product launches in recent years and requires additional focus on the
expediting of product launches. Additionally, price competition in the generics
business remains substantial; companies lack government protection and
therefore must compete in a commodity market. Usually, this commodity style of
competition is foreign to pharmaceutical companies who compete primarily on
R&D differentiation. Time to market and cost will continue to drive the generics
businesses profitability. Novartis also utilizes its consumer health, OTC, animal
health, medical nutrition, and infant and baby business units to balance their
portfolio of products; in 2004 these business units all outperformed their
respective markets. (Novartis Annual Report 2004) Novartis created dedicated
customer teams for key accounts including companies such as Wal-Mart to
discover cross-functional capabilities and enhance future growth. (Novartis
Annual Report 2004)
• Facility and capacity planning
Novartis tries to maximize the utilization of assets for production. They
schedule for capacity planning on a 6 month production schedule basis. As they

Mukherjee 81
plan batches of products, they decide what products and quantities should be
allocated to which production equipment. There are overlaps in the utilization of
resources which must be eliminated. On rare occasions, when material changes
occur in the production requirements, changes can be made to the schedule.
These changes can be costly, but usually do not require the disposal of product.
In the event that a change is necessary and a product in production is delayed or
postponed, the batch is processed until an appropriate stopping point where the
production can be restarted without causing degradation of the drug substance.
• Inventory segmentation
The majority of the inventory in Novartis is held in the form of drug
substances or finished products in Switzerland. It only takes 2-3 days for the
inventory to reach the CPO and therefore inventory is pulled from the
warehouses in Basel, Switzerland. The products which are packaged for a
specific country are then shipped to the respective CPO; from there products are
distributed further to the customer base in that country. (Novartis Interview 2005)
Novartis experiences a high degree of SKU proliferation because of the country
specific needs regarding labeling and languages. (Novartis Interview 2005)
• Inventory management
Novartis is making progress with reductions in its MOH (Month on hand)
inventory. Currently Novartis’ pharmaceutical division maintains a target of
reducing its inventory to an average of 7 MOH. Since 80% of sales come from
the top 25 brands, most inventory planning takes place at a brand pipeline level.
(Novartis Interview 2005) The primary driver for the supply chain remains tax
and revenue optimization; however the goals of inventory management and tax
optimization are aligned. The reduction in inventory is complimentary to the
cause of tax reduction. (Novartis Interview 2005)
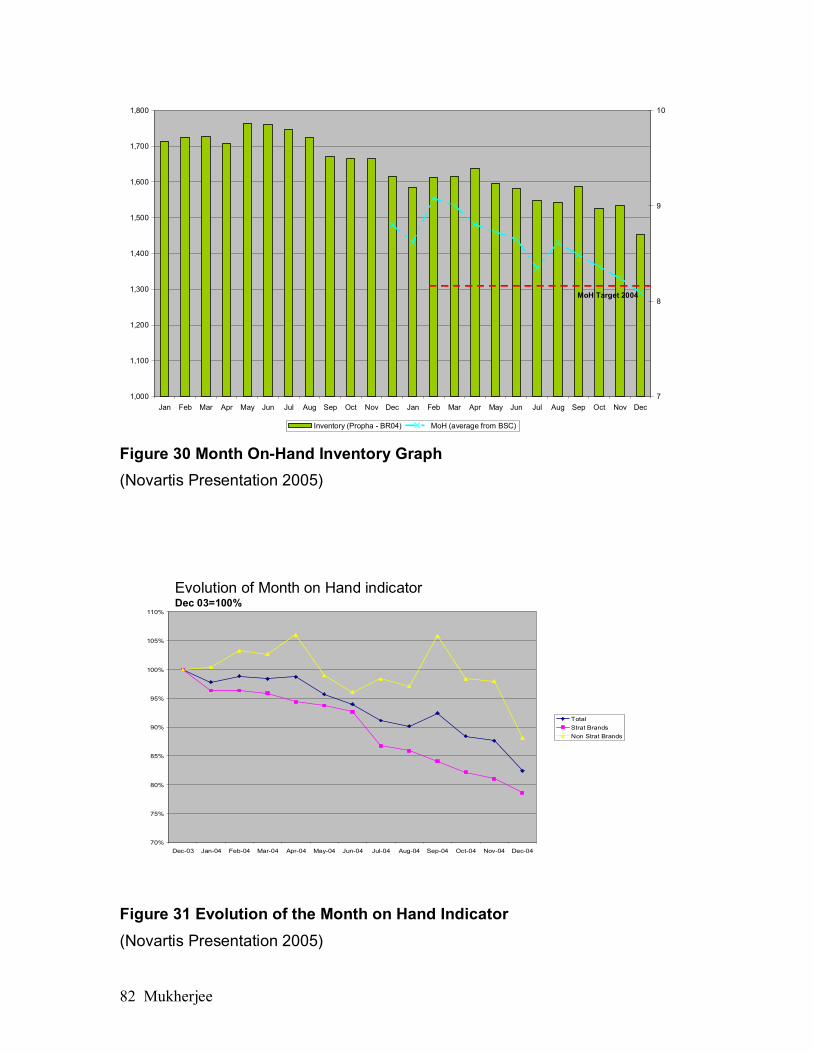
Mukherjee 82
Figure 30 Month On-Hand Inventory Graph (Novartis Presentation 2005)
Evolution of Month on Hand indicatorDec 03=100%
70%
75%
80%
85%
90%
95%
100%
105%
110%
Dec-03 Jan-04 Feb-04 Mar-04 Apr-04 May-04 Jun-04 Jul-04 Aug-04 Sep-04 Oct-04 Nov-04 Dec-04
TotalStrat BrandsNon Strat Brands
Figure 31 Evolution of the Month on Hand Indicator (Novartis Presentation 2005)
1,000
1,100
1,200
1,300
1,400
1,500
1,600
1,700
1,800
Jan Feb Mar Apr May Jun Jul Aug Sep Oct Nov Dec Jan Feb Mar Apr May Jun Jul Aug Sep Oct Nov Dec7
8
9
10
Inventory (Propha - BR04) MoH (average from BSC)
MoH Target 2004

Mukherjee 83
• Production management
The production management for the top 25 strategic brands is handled on
a brand pipeline level. Novartis looks at each new drug launch as a potential
strategic brand. If the new product demonstrates high sales potential and
revenue, then the brand will be managed separately on a pipeline basis.
The pipeline management starts with a comparison of actual information
against previous projections. This can be done during the weekly management
cycle in which previous forecasts are compared with the actual sales. If there are
errors in the forecasting process or in demand fulfillment they are noted at the
beginning of the cycle. If changes are necessary, the brand pipeline team will
then propose changes to the overall market and brand strategy. Once the team
reaches a consensus they proceed by changing the appropriate forecasts and
assumptions.
The forecast changes will lead to demand planning and fulfillment
changes. These changes, at a major level, could result in the reallocation of
production assets and changes in production schedules. Demand changes are
then used to adjust the supply needs for the particular brand. These changes will
also affect the inventory levels and changes in the capacity planning throughout
the production schedule. Finally, the necessary investments and changes in the
financial plan are considered and the team must agree on the new projection
figures for their brand. The team will then be accountable for their decisions
since they will be used as a baseline during the next management cycle. Below
is a figure that illustrates the steps in the pipeline management cycle.

Mukherjee 84
Pipeline Management links different functions in a cyclical process
Step 1
Compare previous projections with
actuals
BrandPipeline
Management
Step 3
Agree forecast changes and assumptions
Step 5
Agree supply plan changes
Step 6
Agree inventory and capacity
changes
Step 7
Agree investments and financial
decisionsStep 8
Agree projections of key figures for
brand
Step 4
Agree demand plan changes
Step 2
Agree changes to overall market and
brand strategy
Marketing & Sales
Forecasting
Operations
Financials
Performance
Focus Area
Figure 32 Pipeline Management Cycle (Novartis Presentation 2005)
As a result of the pipeline management cycle, the team achieves better
visibility and lower inventory throughout the entire brand pipeline. The same
approach is used when determining the requirements throughout the supply
chain for new product launches. Once the first galenical form is decided for a
new product, the team assigned to the product launch will begin working on the
forecasts for the product launch. (Novartis Interview 2005) The pipeline
management approach yields better results on an organization wide level than
the previous methods of resource management employed by Novartis. (Novartis
Interview 2005)

Mukherjee 85
ChemOpsPlant
PharmOpsPlant CPO
StoreCustomerSupplier
Store Store Store
Throughput time reduction
Inventoryreduction
Full transparency
CPO Supplier
StoreChemOps
Plant
Store
PharmOpsPlant
Store
Store
Customer
Figure 33 Brand Pipeline Improvement Illustration (Novartis Presentation 2005)
• Transportation management
All transportation for products within the Novartis internal supply chain is
handled by the turntable operations. Products will often travel in and out of Basel
several times during the production process. Transportation within the supply
chain represents less that 1% of the total COGS for a finished product. (Novartis
Interview 2005) Because of the low significance of transportation costs, Novartis
uses fast and reliable methods of moving product between locations; sometimes
cheaper alternatives which may be available are not chosen. Generally Novartis
uses air freight to move product between locations. Air freight shortens delivery
time and provides additional security for products and WIP inventories.

Mukherjee 86
• Warehouse Management
The final product warehouse management is performed at the CPO level.
Each country’s CPO or third party agency manages the internal operations of the
local facility. The facilities will generate orders for finished product and the
finished product is then shipped from the main warehouse in Basel.
5.11 Customer – Side Business Process
• Distribution channel management
The distribution to the final customer is handled at the CPO level. The
CPO is responsible for maintaining the inventory levels at the country specific
location. Once an end customer places an order, the company will then ship out
product to the end customer. The shipments are usually sent via air freight.
Transportation costs are not a significant portion of the product cost; importance
is placed on the timeliness and accuracy of the distribution process. The
reliability of air freight offers better customer service and responsiveness for the
end customer. Almost half of the country specific distribution centers are
operated by a third party or agency. The facilities which are operated by third
parties will purchase product from Novartis directly; in these instances, Novartis
considers the wholesaler to be the end customer.
50% of the CPO locations that are owned and operated by Novartis are
now running SAP to assist in the management and distribution process. Novartis
is trying to implement SAP across the entire supply chain, including third party
facilities, in an effort to reduce inventories and increase order accuracy. The
data provided by the SAP system will also assist in anticipating parallel trade and
compensating in the supply chain.

Mukherjee 87
• Customer segmentation
The majority of the products that Novartis produces are sold to
wholesalers and large pharmacy chains. Some of the large wholesalers in the
US are served directly from the distribution in Basel, however the majority of the
customers are served from the CPO. Novartis does not typically segment
customers on any basis other than geography. The customers in particular
countries are served by their respective CPOs.
• Customer management
Customers that receive product from a CPO are managed by the CPO
staff. Each country has its own sales staff which is responsible for customer
relationships.
• Demand planning and forecasting
The demand planning for the end customer takes place at the CPO
location. The CPO sales planning group reports back to the brand pipeline
management group for the aggregation of forecasts. These forecasts are then
used further, as described before, to initiate planning for the entire supply chain.
The planning and forecasting for strategic brands is done through a brand
pipeline management team. Previously, planning was performed annually and
the planning horizons spanned 3 years. Today, for strategic brands, the planning
is done on a weekly basis. The pipeline management team reviews the status of
the entire pipeline and makes minor adjustments as needed.
Sales forecasting is done on a semi-annual basis. Each SKU, at each
CPO, receives a 5 year forecast which is passed up to global sales forecasting
for planning and aggregation. These forecasts are updated more frequently for
the top 25 strategic brands.
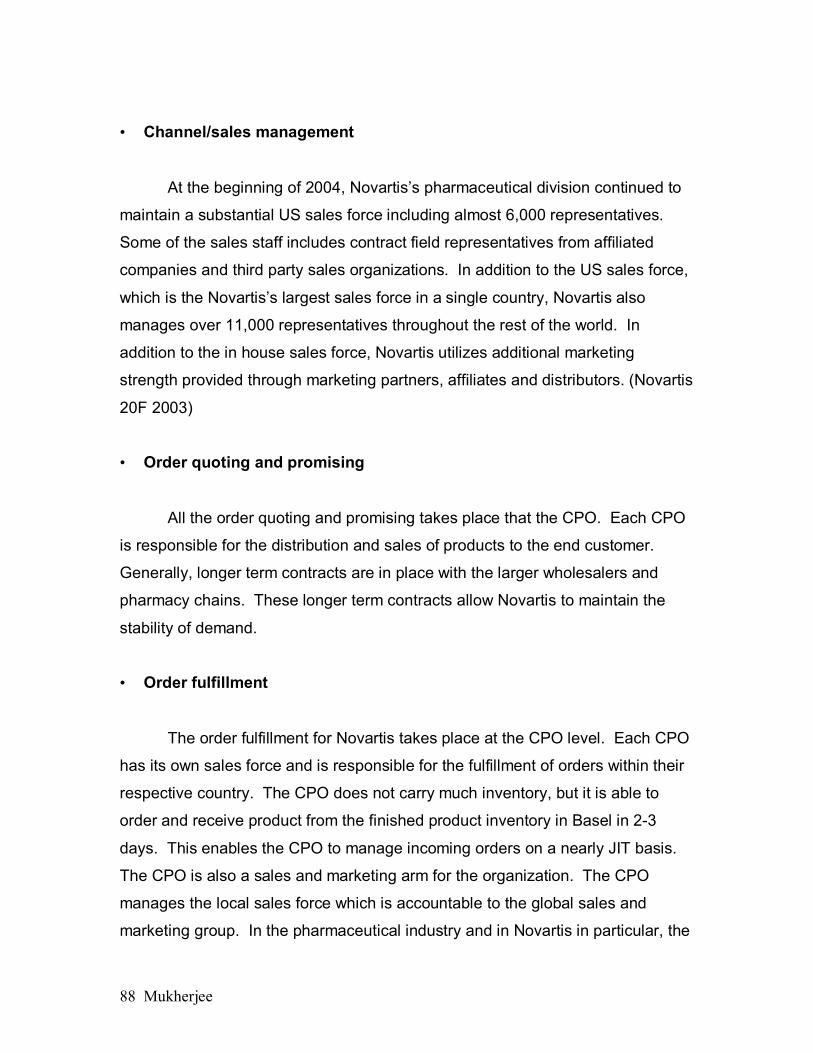
Mukherjee 88
• Channel/sales management
At the beginning of 2004, Novartis’s pharmaceutical division continued to
maintain a substantial US sales force including almost 6,000 representatives.
Some of the sales staff includes contract field representatives from affiliated
companies and third party sales organizations. In addition to the US sales force,
which is the Novartis’s largest sales force in a single country, Novartis also
manages over 11,000 representatives throughout the rest of the world. In
addition to the in house sales force, Novartis utilizes additional marketing
strength provided through marketing partners, affiliates and distributors. (Novartis
20F 2003)
• Order quoting and promising
All the order quoting and promising takes place that the CPO. Each CPO
is responsible for the distribution and sales of products to the end customer.
Generally, longer term contracts are in place with the larger wholesalers and
pharmacy chains. These longer term contracts allow Novartis to maintain the
stability of demand.
• Order fulfillment
The order fulfillment for Novartis takes place at the CPO level. Each CPO
has its own sales force and is responsible for the fulfillment of orders within their
respective country. The CPO does not carry much inventory, but it is able to
order and receive product from the finished product inventory in Basel in 2-3
days. This enables the CPO to manage incoming orders on a nearly JIT basis.
The CPO is also a sales and marketing arm for the organization. The CPO
manages the local sales force which is accountable to the global sales and
marketing group. In the pharmaceutical industry and in Novartis in particular, the
Mukherjee 89
sales representatives only provide information to the supplementary decision
makers such as doctors and nurses. The representatives make calls to the
wholesalers, but are measured based on the performance of product which is
sold within their district. Some of the sales take place in the form of contract
formularies. In these types of situations, a representative will market a product to
a particular hospital or clinic and encourage them to add their product to the
formulary, or list of approved medications for physician use. Even in these
situations, the representatives do not market directly to the consumer or even in
many cases not even directly to the customer. The sales representatives are
also responsible for the distribution and tracking of samples to care givers.
These samples encourage care givers to issue the first dosage directly to the
consumer and then the consumer can later purchase the remaining needed
supply from a retail location.
• Returns and recycle management
Drug manufacturers deal with the issues of returns and recycling. The
products are rarely recycled unless there is an overstocking situation that is not
pressured by product expiration. When products expire, the customer usually is
responsible for the destruction of the product. There are certain regulatory
requirements that must be met regarding the tracking and documentation for
destroyed product after expiration. In addition to the instances where product
expires, there are times, as with any industry, in which Novartis must recall
defective product. In the event that a product is defective the company primarily
destroys the product or issues an order for the destruction of product at the
customer location. Novartis does however request the return of some product for
testing and diagnosis purposes when applicable. In the event that the product is
a controlled substance or a biological agent requiring a specific destruction
procedure, Novartis will either have the product returned via courier, or contract
for the destruction at the customer location.

Mukherjee 90
• After-market and post sales support
Once sales take place, the sales representative is responsible for
answering standard informational questions about products. If the questions
exceed the scope or capacity of the sales representative, then the representative
must put the customer in contact with the appropriate person within Novartis to
answer the questions. This contact could include researchers or physicians who
are on hand to answer questions. Novartis does also offer some consumer
support, however most instances recommend that a consumer speak with his/her
pharmacist or physician.

Mukherjee 91
Chapter 6 – Novartis Supply Chain Framework
6.1 Novartis Business Strategy
The pharmaceutical division for Novartis focuses on its core business
strategy of adding new profitable and patent protected products to its broad
portfolio of treatments for chronic illnesses; Novartis must employ the appropriate
operational efficiencies which allow the production and marketing of new
products both rapidly and efficiently after the receipt of regulatory approval.
Through the use of a broad portfolio of products, Novartis also reduces the
company’s reliance on key blockbuster drug products. Unlike some of its key
competitors, the company also has established a generics products division. The
generics division allows the company to maintain market share after the
expiration of patent protection for its key products and also its competitors’ off-
patent products.
Although there is significant market potential for many breakthrough
products in a varied array of therapeutic categories, Novartis chooses to focus
R&D efforts primarily on chronic illness products. Since chronic illness products
are administered on a perpetual basis, these treatments are not subject to
material variations in demand. Novartis focuses its R&D efforts in eight
therapeutic categories which exhibit both market potential and social benefit.
Novartis strives for global market reach. It operates in over 140 countries
worldwide and maintains a broad and geographically diverse asset base. This
asset base allows Novartis to serve extremely diverse markets and was
established in part through a history of successful M&A activities. The broad
geography of facility locations also promotes a business continuity strategy.
Novartis achieves global risk mitigation through a broad market base which
reduces the company’s reliance on any single geographic region.

Mukherjee 92
6.2 Novartis Operating model Novartis chooses an operating model that supports its strategy of creating
a diversified product portfolio. The company seeks to produce a large variety of
products in a highly vertically integrated supply chain. High vertical integration
allows Novartis to retain more profits and increase control over production,
however, this also increases complexity. The increased complexity is managed
through a focused brand pipeline management structure. Each key product is
evaluated throughout the production process from procurement to customer
delivery.
The company operates production and sales facilities across a very broad
geographical base. This broad base allows Novartis to employ customized sales
practices in each country that it services. Country specific regulatory and
language requirements are managed locally in their respective countries.
Novartis also receives financial benefits from the broad array of facility locations.
Taxation structures vary between countries and regions; Novartis is able to
produce products in the regions which allow the company to retain the highest
amount of profit.
The Novartis operating model is designed to support the high degree of
complexity that occurs with a broad portfolio and vertical integration. The
company maintains a globally and centrally managed approach to certain
aspects of its supply chain. Throughout the production process, key products
which are managed at a brand pipeline level remain visible to global
management, while local facility decisions are managed locally. Novartis
employs a matrix organization that allows both functional and process efficiency.

Mukherjee 93
6.3 Novartis Operational Objectives
The Novartis SCM group places a focused emphasis on reducing both the
cycle and lead times for the production. Novartis employs a strategy entitled
“Launch in 1000 days” which is designed to limit the time it takes to bring a new
product to market; in the past, it often took in excess of 5 years to bring new
product launches to market. Once a product receives patent protection and
regulatory approval, the clock starts ticking; Novartis has a limited time frame in
which to recover R&D costs and produce a positive effective return on their
investments.
While attempting to launch products more quickly, Novartis also tries to
focus on higher asset utilization. One of the key goals in place for the SCM
group is centered on maximizing production capacity utilization. The centralized
operating model allows Novartis to accurately allocate production capacity
amongst product production campaigns. Through the centralized brand pipeline
management approach Novartis achieves superior information flows which lead
to better physical flows of products. The centralized approach also allows
Novartis to maintain end to end visibility of products in the production process.
The global SCM group tries to achieve better traceability and control over
material flows and asset utilization. Novartis SCM also tries to achieve global
inventory reduction throughout the supply chain. Management utilizes
benchmarking techniques to monitor overall inventory levels on both an
aggregate and brand pipeline level.

Mukherjee 94
6.4 Novartis Complementary Processes Parallel Development and Production of New Products
In an effort to facilitate shorter lead and cycle times, Novartis employs a
parallel approach to the development and production of new products. While
products are still in clinical development, Novartis removes boundaries and
separation between their clinical and production supply chains. This allows
better sharing of knowledge and information during the development process.
Key aspects of the clinical production process are shared with production
engineers. The early knowledge transfer allows Novartis to begin the certification
process for their production techniques in sync with the product’s regulatory
approval.
Turntable
Novartis utilizes a supply chain turntable to exercise control over
production and to better manage the high degree of complexity resulting from a
broad product portfolio, vertical integration, and broad geographical asset base.
The turntable is located in Basel Switzerland, and often manages over 10,000
simultaneous open orders with over 50,000 order lines per year (Novartis
Interview 2005). Even with over 20,000 inter-company shipments annually,
Novartis spends less than $20 million annually on transportation. The turntable
allows Novartis to centrally manage their vertically integrated supply chain and
improve visibility and tracking of products and materials through the production
process. Additionally, in support of the company’s tax optimization strategy, the
turntable serves as a financial hub for all inter-company transactions.

Mukherjee 95
Turntable
Country Organizations Production Plants
Demand info Demand info & orders& orders
DeliveriesDeliveries
KPI‘s KPI‘s
350 customers120 countries
23 multinational plants
Basel Hub
Figure 34 Turntable KPI Illustration (Novartis Presentation 2005)
Turntable
Global GSCM Support Functions
CPO I
Market Production
CPO II
CPO III
CPO n
ChemOps
PharmOps
Purchasing
Finance

Mukherjee 96
Figure 35 Turntable Market/Production Illustration (Novartis Presentation 2005)
Collaborative Forecasting Process
Novartis employs a well developed collaborative process for sales
forecasting. Each country or region specific sales organization develops its own
sales forecast which is then passed up to the global sales and planning group.
The supply chain process begins with a sales forecast. The forecasts will include
information about the expected volume of sales as well as the projected financial
impact of those sales. The sales staff must also produce accurate accounting of
their assumptions about the forecast including explanations as to how and why
each value was determined. The forecasting team must take into consideration
each particular Brand Strategy, Historical Sales information, Market Intelligence,
and other pertinent inputs to the forecasting process. Through better sharing of
assumptions in the sales forecasting process, Novartis is able to achieve lower
safety stock and inventory through the supply chain.
From Forecasting To Planning
SalesForecast•Volume•Value•Assumptions
DemandPlan
SupplyPlan
SalesForecasting•Brand strategy•Historic sales•MPH scenario •Market intelligence etc.
SupplyPlanning
+Inventory+Supply parameters +Resource constraints
DemandPlan
DemandPlanning
+Other Demands+Risk Management +Distribution Channel
SalesForecast
Mukherjee 97
Figure 36 Collaborative Forecasting (Novartis Presentation 2005)
Planning and Scheduling
To achieve high levels of asset utilization Novartis uses well founded
planning and scheduling methods. Their broad product portfolio combined with a
need for asset sharing requires more frequent setups and changeovers of
production equipment. This added complexity requires Novartis to undergo a
robust and formalized scheduling and planning process. The production planning
process must be composed of both centralized and distributed decision making
activities simultaneously. The brand pipeline management approach helps
facilitate this process and reduce overlap in planning efforts. Novartis also
utilizes their accurate sales forecasts to assist in producing better facility
production plans. Novartis tries to operate approximately two production
campaigns per product per year in order to keep changeovers and setup costs to
a minimum. Improper planning could result in lowered efficiency throughout the
supply chain.

Mukherjee 98
Processes
Material Master Management Processes
ChemOps SupplierPharmOpsCPO’s
Global supply agreement
Framecontract
GlobalPurchasing
Global S&OPBusiness Driver Plans & Exceptions Targets, decisions
Regional Supply Chain Planning
Gross & NetDemand
Global Brand Plan
Global Sales Forecasting
Demand planning Productionplanning
Delivery DeliveryDelivery Delivery
Procurementplanning
Production
Productionplanning
Procurementplanning
Production
Salesforecasting
ChemOps Supply Network Planning
Net demand plan
Global Brand Pipeline PlanningSupply planInventory targets
Supply chain rulesSupply
plan
Product Lifecycle Management processes (Launch, Change, Pruning, Transfers, Divestment, Artwork etc.)
Figure 37 Operating Model (Novartis Presentation 2005)

Mukherjee 99
Chapter 7 – The Future of Novartis
The overall supply chain and business strategy of Novartis focuses on
supporting factors for their core competency of research and development for
new pharmaceutical products. The supporting functions of their supply chain
compliment the core strategy by which the company gains competitive advantage
by discovering or creating new products which can reach market and provide a
return on the R&D expenditures. In the current age of blockbuster drugs,
companies disregard many of the potentially life altering or saving potential drug
compounds in development because of lack of profit potential. During the
process of drug compound selection, a company must consider the ability of the
compound to provide a positive ROI which is in line with analysts’ expectations
for double digit growth. In order to meet expectations, especially in the US
markets, pharmaceutical companies must aggressively develop the drugs which
provide the highest margin potentials. Additionally, companies must bring
products to market immediately following approval in order to maximize their time
to recover investments. The market is changing.
Changing Landscape
The days in which blockbuster drugs provide double digit returns and
account for substantial portions of companies’ revenues are numbered. The
latest studies indicate that R&D expenditures are increasing while the correlated
decline in productivity is staggering. At present rates, the cost basis for the
creation of new drug substances allows fewer drug compounds to reach the
development stages, and even fewer to reach market. Pharmaceutical
companies currently optimize their supply chains on a blockbuster drug basis,
often times allocating substantial assets to dedicated production facilities for a
particular blockbuster product. As products loose patent protection, many of the
giants will lose high margin products, and subsequently decline in financial
performance.

Mukherjee 100
• Blockbuster Drugs
As the blockbuster era wanes, manufacturers will be forced to achieve the
same margins and ROI as previously expected of the industry without the help of
golden ticket products. Companies already find R&D and sales costs prohibitive,
and collaborate on expenditures for risk pooling through cooperative agreements.
The change in landscape will effect changes throughout the entire chain from the
laboratory to sales, including end consumers and customers.
• Regulation
The changing landscape currently drives prices up for companies who still
subscribe to the blockbuster drug strategy. The need to maintain margins with
higher prices also produces higher drug pricing and resulting ethical pressures;
governmental agencies and public discord promote pricing pressures and
regulatory changes counter to the pharmaceutical companies’ profit motivation.
In particular the US continues to provide incentives for generic manufacturers
while many countries in the EU create price ceilings for pharmaceutical products.
• Research and Development
Trends in medical research suggest that the future of treatments will
include new and innovative therapies which include biologically or genetically
developed pharmaceutical products. As these trends materialize,
pharmaceutical companies will need to reevaluate the way they do business,
including the structure of their R&D efforts as well as their supply chains.
Pharmaceutical companies’ quest for the next blockbuster drug lead to the
development of landmark products and intense M&A for knowledge assimilation;
but the new era will be driven by new motives and measured by different metrics.

Mukherjee 101
• Production and Technology
New products will incorporate different production techniques, new
controls and methods for distribution and administration, and even catch phrase
logistics concepts such as mass customization and postponement. New
biopharmaceutical and genetic products will require new facilities with new
technologies. The products may be produced in part or entirely through the use
of biological agents instead of traditional chemical synthesis. Most drastically,
products may be one time use and customized for an individual who needs the
product; the luxury of 7-15 month lead times for products will become extinct.
Novartis Strategy for Adaptation to the New Landscape
Novartis currently follows suit and subscribes to an industry wide revenue
strategy based around the blockbuster drug, but they are prepared for the future.
Novartis continues to increase spending on biopharmaceutical research and
development and remains committed to gaining competitive advantage over
other companies through its successful R&D ventures in both new and old
products. Over the past several years Novartis has perpetually increased
spending on R&D and is not at immediate risk of lost revenues with blockbuster
patent protection for top products, such as Diovan, extending through 2012.
However, the pharmaceutical industry operates at a relatively slow “clockspeed”
(Charles Fine) and the seven years between now and then provides very little
time for adaptation. Novartis also responds to the regulatory pressures from
lower cost generics by competing in the generic product markets with its Sandoz
division. Although generic production does not produce the analysts’ expected
high margins for pharmaceuticals, it does allow Novartis to hedge against the
loss of patent protection and declining R&D efficiency. The Sandoz business unit
also sells intermediary products to other pharmaceutical companies who wish to
shorten production times and carry less inventory within their supply chains.
Mukherjee 102
• Counterintuitive Supply Chain Structure
Novartis employs a unique system for the management of its supply chain.
Unlike most companies whose supply chain design stems from the desire for
transportation or materials flow optimization, the motivation and innovation for
their supply chain came from both historical asset location and taxable revenue
optimization. Through a substantial M&A history, Novartis continues to maintain
a geographically diverse and vertically integrated asset base throughout many
countries and regulatory regions. While this would normally create substantial
logistical inefficiency, Novartis gains advantage from the different taxation
structures across the various locations. The desire for revenue maximization and
a need for control across the varied geography lead Novartis to develop a system
of controls which may initially seem counterintuitive from a supply chain
management perspective. Novartis surprisingly transports products through
geographical regions using a hub; products may actually pass through the same
geographic region, or even the same facility, more than once throughout the
production process. Novartis performs optimization and achieves reasonably
efficient logistics within the framework of necessary physical and financial flows.
• Regulatory Adaptation
Although Novartis benefits substantially from their tax optimization
framework, the industry also is expected to experience some changes in tax
structure. Many countries are now competing for the revenues of the
pharmaceutical giants. In the past places like Ireland, Puerto Rico, and Benelux
locations have created incentives through lower taxes to attract pharmaceutical
manufactures. One of the latest developments in this trend is now sponsored by
the US. Without pricing restraints like those in the EU, the US remains the
largest single region for pharmaceutical sales and profits. Currently however, the
US doesn’t benefit from most of the revenues from pharmaceutical companies
who produce in low tax regions. Future changes in the tax structure could

Mukherjee 103
produce lower effective tax rates for pharmaceutical companies. By charging
lower taxes, the US will gain more tax revenue while offering more retained
operating income for the pharmaceutical companies.
Source: New York Times
• Research and Development Direction
The US already provides one of the best environments for R&D which
has attracted a significant number of pharmaceutical research facilities. Novartis,
already carefully chooses the locations for its research facilities; the locations
must correspond with regions in which governmental regulation, funding, and
policy supports and fosters their research. In recent years, Novartis has shifted
many of its research projects to the US, in particular to its ever expanding facility
in Cambridge, MA. (Novartis 20F 2004) This year alone, Novartis has hired an

Mukherjee 104
additional 800 research scientists in their Boston MA facility and has increased
R&D spending by an additional 12% to $4.2 billion. (Novartis Annual Report
2004).
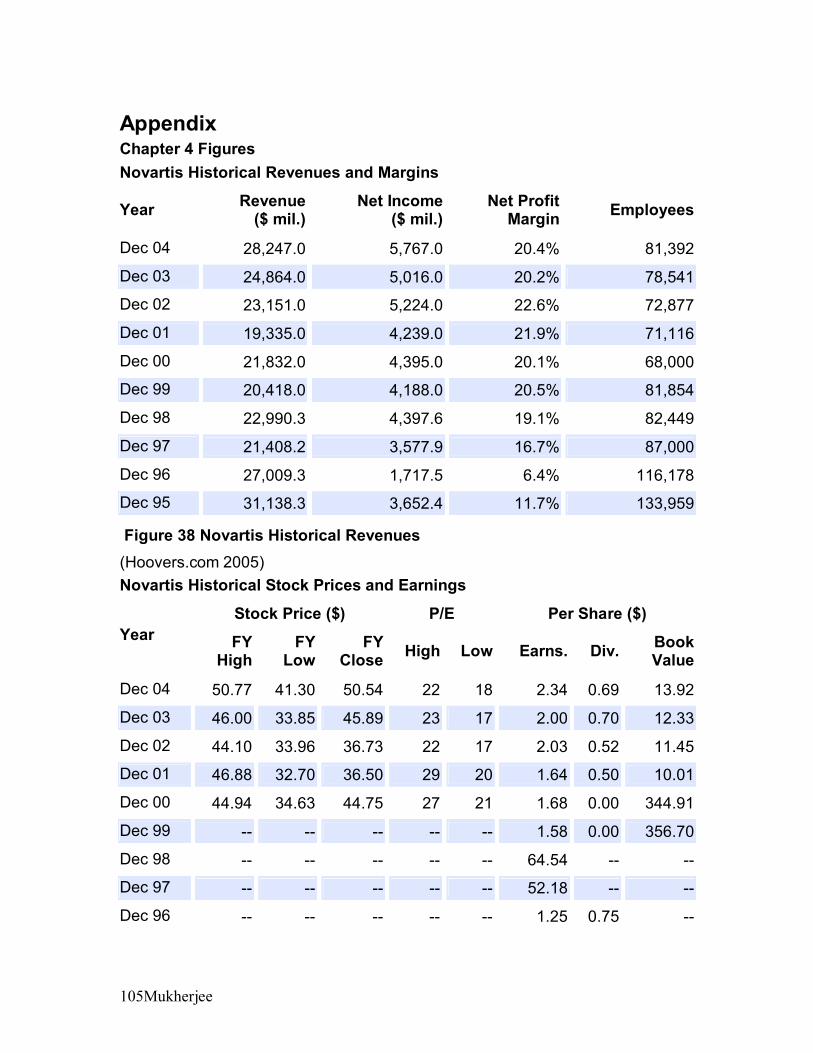
Mukherjee 105
Appendix Chapter 4 Figures Novartis Historical Revenues and Margins
Year Revenue ($ mil.)
Net Income($ mil.)
Net ProfitMargin Employees
Dec 04 28,247.0 5,767.0 20.4% 81,392
Dec 03 24,864.0 5,016.0 20.2% 78,541
Dec 02 23,151.0 5,224.0 22.6% 72,877
Dec 01 19,335.0 4,239.0 21.9% 71,116
Dec 00 21,832.0 4,395.0 20.1% 68,000
Dec 99 20,418.0 4,188.0 20.5% 81,854
Dec 98 22,990.3 4,397.6 19.1% 82,449
Dec 97 21,408.2 3,577.9 16.7% 87,000
Dec 96 27,009.3 1,717.5 6.4% 116,178
Dec 95 31,138.3 3,652.4 11.7% 133,959
Figure 38 Novartis Historical Revenues (Hoovers.com 2005) Novartis Historical Stock Prices and Earnings
Stock Price ($) P/E Per Share ($) Year FY
High FY
Low FY
Close High Low Earns. Div. BookValue
Dec 04 50.77 41.30 50.54 22 18 2.34 0.69 13.92
Dec 03 46.00 33.85 45.89 23 17 2.00 0.70 12.33
Dec 02 44.10 33.96 36.73 22 17 2.03 0.52 11.45
Dec 01 46.88 32.70 36.50 29 20 1.64 0.50 10.01
Dec 00 44.94 34.63 44.75 27 21 1.68 0.00 344.91
Dec 99 -- -- -- -- -- 1.58 0.00 356.70
Dec 98 -- -- -- -- -- 64.54 -- --
Dec 97 -- -- -- -- -- 52.18 -- --
Dec 96 -- -- -- -- -- 1.25 0.75 --

Mukherjee 106
Dec 95 -- -- -- -- -- 2.64 0.65 --
Figure 39 Novartis Historical Stock Prices (Hoovers.com 2005) Novartis vs. Industry vs. Market Profitability Novartis Industry1 Market2
Gross Profit Margin 81.46% 80.10% 48.32%
Pre-Tax Profit Margin 24.46% 23.95% 9.69%
Net Profit Margin 20.42% 17.50% 6.30%
Return on Equity 17.1% 22.1% 11.9%
Return on Assets 10.6% 10.6% 2.0%
Return on Invested Capital 15.8% 17.8% 5.7%
Valuation Novartis Industry1 Market2
Price/Sales Ratio 4.06 3.75 1.35
Price/Earnings Ratio 20.18 21.58 21.66
Price/Book Ratio 3.39 4.74 2.56
Price/Cash Flow Ratio 16.01 15.90 11.71
Operations Novartis Industry1 Market2
Days of Sales Outstanding 61.82 66.29 50.47
Inventory Turnover 1.5 1.7 7.9
Days Cost of Goods Sold in Inventory 237 209 45
Asset Turnover 0.5 0.6 0.3
Net Receivables Turnover Flow 6.1 5.6 7.4
Effective Tax Rate 16.3% 25.7% 32.6%
Financial Novartis Industry1 Market2
Current Ratio 2.22 1.65 1.41
Quick Ratio 1.8 1.2 1.0
Leverage Ratio 1.61 2.09 5.96
Total Debt/Equity 0.20 0.36 1.41
Interest Coverage 27.40 34.70 2.90
Per Share Data ($) Novartis Industry1 Market2

Mukherjee 107
Revenue Per Share 11.64 10.47 21.28
Fully Diluted Earnings Per Share from Total Operations 2.34 1.82 1.33
Dividends Per Share 0.69 0.95 0.48
Cash Flow Per Share 2.95 2.47 2.46
Working Capital Per Share 5.58 2.99 2.27
Long-Term Debt Per Share 1.13 1.97 12.03
Book Value Per Share 13.92 8.28 11.27
Total Assets Per Share 22.44 17.30 67.17
Growth Novartis Industry1 Market2
12-Month Revenue Growth 13.6% 7.0% 11.3%
12-Month Net Income Growth 15.0% 13.6% 28.7%
12-Month EPS Growth 17.0% 13.0% 20.9%
12-Month Dividend Growth (1.4%) 11.8% 9.1%
36-Month Revenue Growth 12.8% 1.3% 7.3%
36-Month Net Income Growth 9.2% (1.4%) 69.2%
36-Month EPS Growth 11.1% (1.7%) 70.0%
36-Month Dividend Growth 13.1% 7.5% 4.9%
Figure 40 Novartis vs. Industry vs. Market (Hoovers.com 2005) 2004 Sales $ mil. % of salesAmericas 13,285 47Europe 10,289 36Asia, Africa, & Australia 4,673 17Total 28,247 100 2004 Pharmaceutical Sales $ mil. % of totalAmericas
US 7,368 40Other countries 1,244 7
Europe 6,370 34

Mukherjee 108
Japan 2,081 11Other regions 1,434 8Total 18,497 100 2004 Sandoz Division Sales $ mil. % of salesEurope 1,448 48Americas
US 981 32Other countries 187 6
Other regions 429 14Total 3,045 100 2004 OTC Division Sales $ mil. % of salesEurope 1,056 53Americas
US 521 26Other countries 190 10
Other regions 208 11Total 1,975 100 2004 Infant & Baby Division Sales $ mil. % of salesNorth America 1,197 83Latin America 194 14Europe, Middle East,
& Africa 35 2Other regions 15 1Total 1,441 100 2004 CIBA Vision Division Sales $ mil. % of salesEurope 572 41Americas
US 481 34Other countries 67 5
Japan 201 14Other regions 91 6Total 1,412 100 2004 Medical Nutrition Sales $ mil. % of salesEurope 563 50

Mukherjee 109
Americas US 413 37Other countries 49 5
Other regions 94 8Total 1,121 100 2004 Animal Health Sales $ mil. % of salesAmericas
US 308 41Other countries 83 11
Europe 246 32Other regions 119 16
Total 756 100 2004 Sales $ mil. % of totalPharmaceuticals
Sandoz 3,045 11OTC 1,975 7Infant & Baby 1,441 5CIBA Vision 1,412 5Medical Nutrition 1,121 4Animal Health 756 3Other 8,747 31
Consumer Health 9,750 34Total 28,247 100
Figure 41 Novartis Division Sales Breakdown (Hoovers.com 2005) Business Unit Revenues as percentage by division
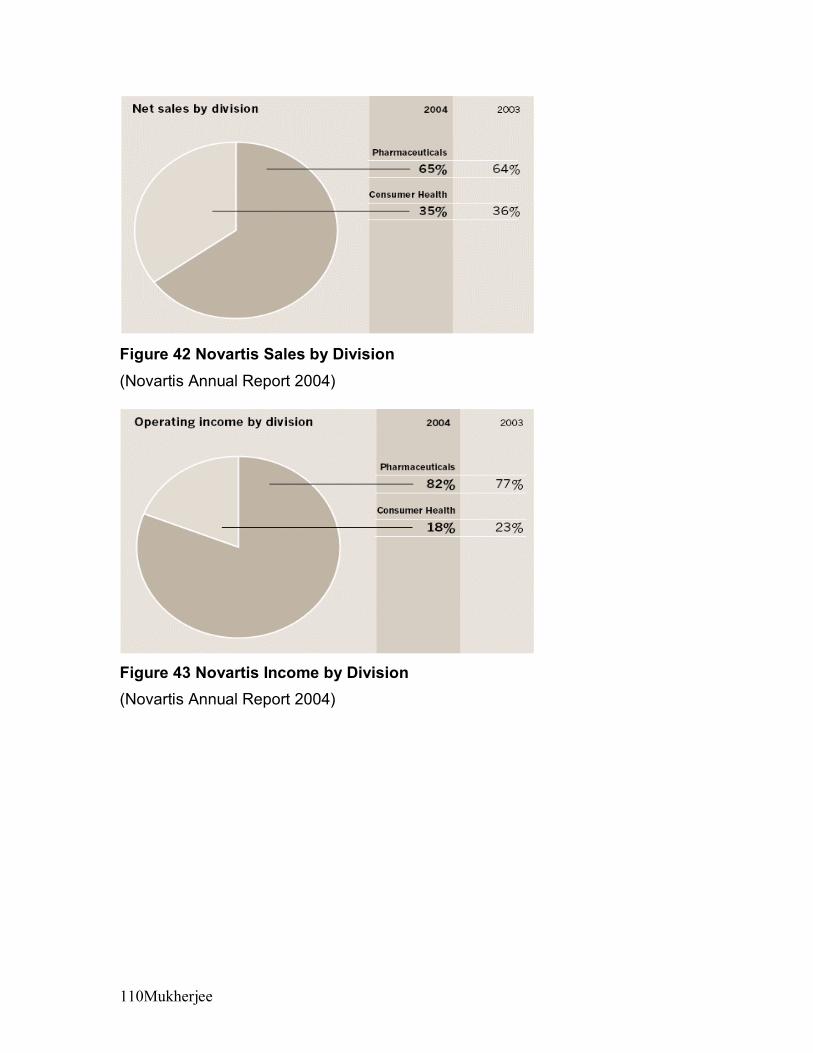
Mukherjee 110
Figure 42 Novartis Sales by Division
(Novartis Annual Report 2004)
Figure 43 Novartis Income by Division (Novartis Annual Report 2004)

Mukherjee 111
Figure 44 Company Key Figures
(Novartis Annual Report 2004)
Figure 45 Share Information
(Novartis Annual Report 2004)

Mukherjee 112
Figure 46 Net Sales 2004
(Novartis Annual Report 2004)
Figure 47 Earnings Per Share
(Novartis Annual Report 2004)

Mukherjee 113
Product Portfolio:

Mukherjee 114
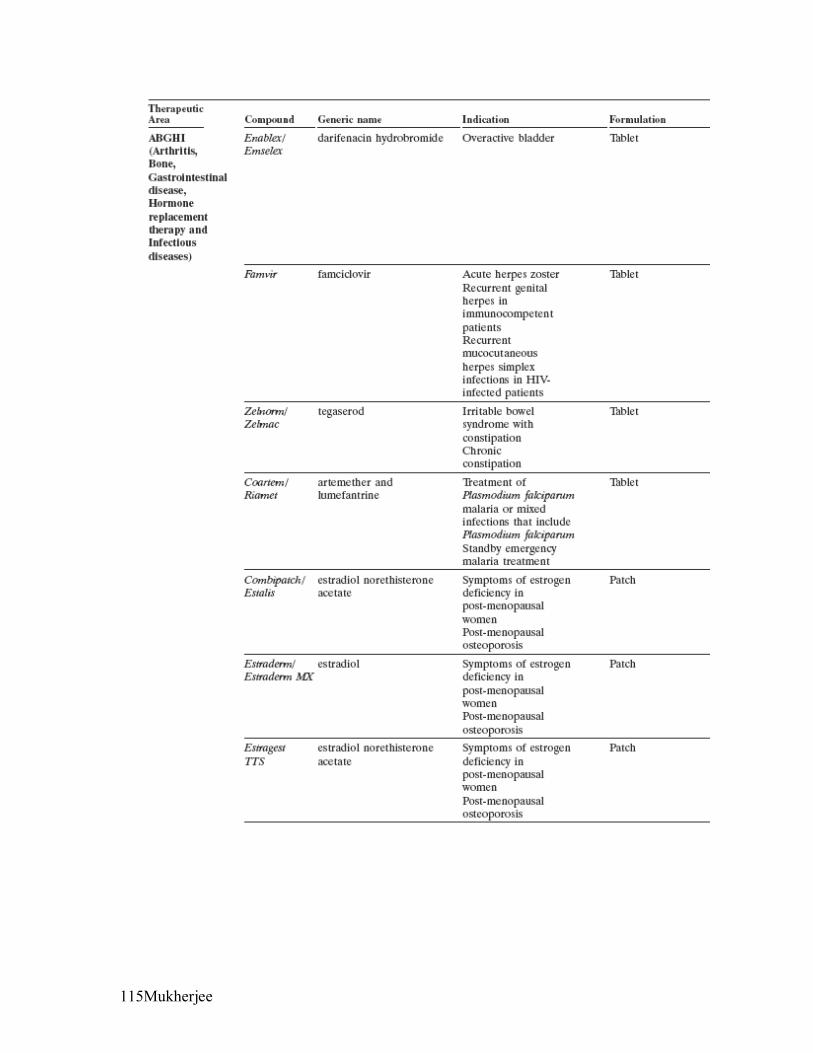
Mukherjee 115

Mukherjee 116

Mukherjee 117
Figure 48 Product Offerings (Novartis 20F 2004)

Mukherjee 118
Associated SIC Codes 2833 Medicinals and botanicals 2834 Pharmaceutical preparations 2835 Diagnostic substances 2836 Biological products exc. Diagnostic 2879 Agricultural chemicals, nec 2899 Chemical preparations, nec 3577 Computer peripheral equipment, nec 3821 Laboratory apparatus and furniture 3826 Analytical instruments 3841 Surgical and medical instruments 3845 Electromedical equipment 7372 Prepackaged software 7374 Data processing and preparation 8731 Commercial physical research 8733 Noncommercial research organizations 8734 Testing laboratories Associated NAICS Codes 32541 Pharmaceutical and Medicine Manufacturing 325411 Medicinal and Botanical Manufacturing 325412 Pharmaceutical Preparation Manufacturing 325413 In-Vitro Diagnostic Substance Manufacturing 325414 Biological Product (except Diagnostic) Manufacturing 334516 Analytical Laboratory Instrument Manufacturing 339111 Laboratory Apparatus and Furniture Manufacturing
541710 Research and Development in the Physical, Engineering, and Life Sciences
621410 Family Planning Centers 62151 Medical and Diagnostic Laboratories 621511 Medical Laboratories 621512 Diagnostic Imaging Centers
Figure 49 NAICS and SIC Product Categories (Hoovers.com 2005)

Mukherjee 119
Comparison of Novartis and Competitors
Key Numbers Novartis Johnson & Johnson
Merck Pfizer
Annual Sales ($ mil.) 28,247.0 47,348.0 22,938.6 52,516.0
Employees 81,392 109,900 63,000 115,000
Market Cap ($ mil.) 114,618.2 204,855.8 73,174.8 197,361.8
Profitability Novartis Johnson & Johnson
Merck Pfizer Industry2 Market3
Gross Profit Margin 81.46% 76.14% 84.70% 90.27% 80.10% 48.32%
Pre-Tax Profit Margin 24.46% 27.11% 35.44% 26.67% 23.95% 9.69%
Net Profit Margin 20.42% 17.97% 25.34% 21.63% 17.50% 6.30%
Return on Equity 17.1% 26.7% 33.6% 16.7% 22.1% 11.9%
Return on Assets 10.6% 16.0% 13.7% 9.2% 10.6% 2.0%
Return on Invested Capital 15.8% 24.8% 26.4% 15.0% 17.8% 5.7%
Valuation Novartis Johnson & Johnson
Merck Pfizer Industry2 Market3
Price/Sales Ratio 4.06 4.33 3.19 3.76 3.75 1.35
Price/Earnings Ratio 20.18 24.26 12.70 17.76 21.58 21.66
Price/Book Ratio 3.39 6.44 4.23 2.90 4.74 2.56
Price/Cash Flow Ratio 16.01 19.24 10.07 11.50 15.90 11.71
Operations Novartis Johnson & Johnson
Merck Pfizer Industry2 Market3
Days of Sales Outstanding 61.82 51.94 56.93 68.69 66.29 50.47
Inventory 1.5 3.1 1.6 0.8 1.7 7.9

Mukherjee 120
Turnover
Days Cost of Goods Sold in Inventory
237 117 228 440 209 45
Asset Turnover 0.5 0.9 0.6 0.4 0.6 0.3
Net Receivables Turnover Flow 6.1 7.1 6.0 5.5 5.6 7.4
Effective Tax Rate 16.3% 33.7% 26.6% 19.0% 25.7% 32.6%
Financial Novartis Johnson & Johnson
Merck Pfizer Industry2 Market3
Current Ratio 2.22 1.96 1.15 1.50 1.65 1.41
Quick Ratio 1.8 1.4 0.9 1.1 1.2 1.0
Leverage Ratio 1.61 1.68 2.46 1.82 2.09 5.96
Total Debt/Equity 0.20 0.09 0.40 0.27 0.36 1.41
Interest Coverage 27.40 69.70 28.20 41.30 34.70 2.90
Per Share Data ($) Novartis
Johnson & Johnson
Merck Pfizer Industry2 Market3
Revenue Per Share 11.64 15.92 10.39 7.04 10.47 21.28
Fully Diluted Earnings Per Share from Total Operations
2.34 2.84 2.61 1.49 1.82 1.33
Dividends Per Share 0.69 1.10 1.49 0.68 0.95 0.48
Cash Flow Per Share 2.95 3.58 3.29 2.30 2.47 2.46
Working Capital Per Share 5.58 4.50 0.78 1.77 2.99 2.27
Long-Term Debt Per Share 1.13 0.86 2.12 0.98 1.97 12.03
Book Value Per 13.92 10.70 7.83 9.13 8.28 11.27

Mukherjee 121
Share
Total Assets Per Share 22.44 17.93 19.28 16.58 17.30 67.17
Growth Novartis Johnson & Johnson
Merck Pfizer Industry2 Market3
12-Month Revenue Growth 13.6% 13.1% 2.0% 16.2% 7.0% 11.3%
12-Month Net Income Growth 15.0% 18.2% (14.9%) 188.4% 13.6% 28.7%
12-Month EPS Growth 17.0% 18.3% (13.9%) 175.9% 13.0% 20.9%
12-Month Dividend Growth (1.4%) 18.3% 2.8% 13.3% 11.8% 9.1%
36-Month Revenue Growth 12.8% 13.0% (26.2%) 19.7% 1.3% 7.3%
36-Month Net Income Growth 9.2% 13.9% (7.0%) 2.5% (1.4%) 69.2%
36-Month EPS Growth 11.1% 15.1% (5.7%) (4.3%) (1.7%) 70.0%
36-Month Dividend Growth 13.1% 16.1% 2.8% 15.6% 7.5% 4.9%
Figure 50 Comparison of Novartis and Competitors (Hoovers.com 2005) Numbers in bold represent the best company’s metric.
Chapter 5 Figures & Tables

Mukherjee 122
Figure 51 Global Quarterly Market Growth (Novartis Annual Report 2004)
Figure 52 Net Sales by Region (Novartis Annual Report 2004)
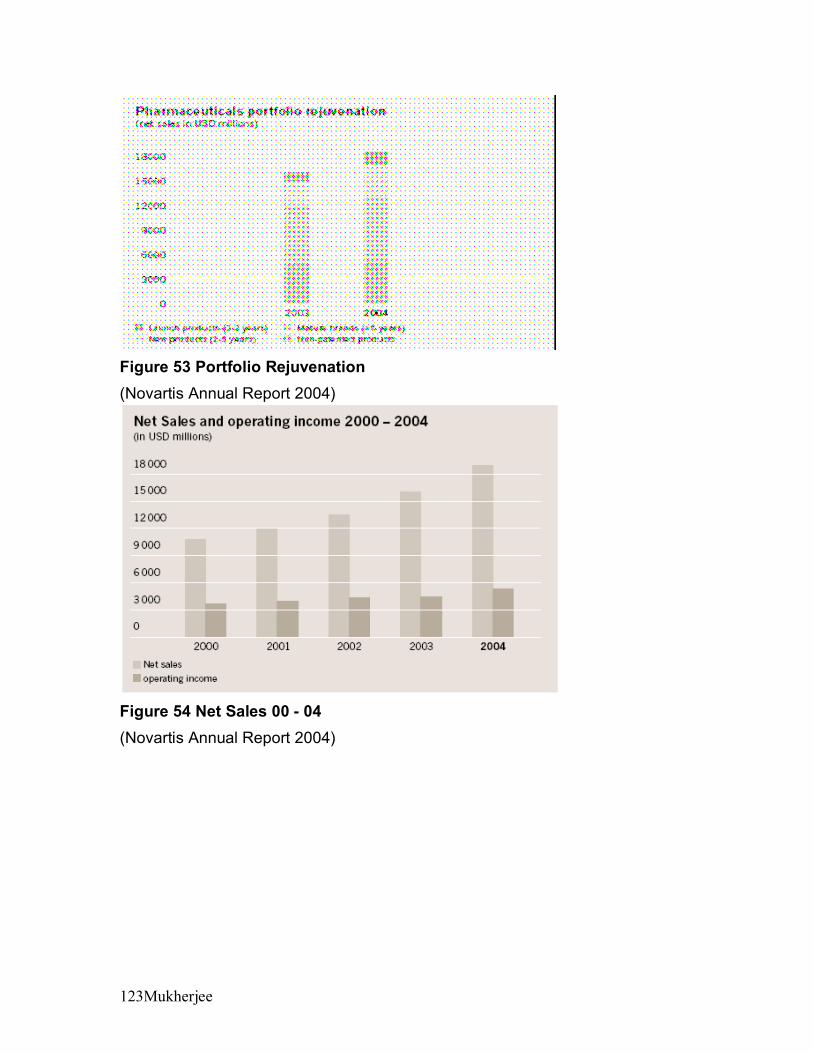
Mukherjee 123
Figure 53 Portfolio Rejuvenation (Novartis Annual Report 2004)
Figure 54 Net Sales 00 - 04 (Novartis Annual Report 2004)

Mukherjee 124
Compounds in Development:

Mukherjee 125

Mukherjee 126

Mukherjee 127

Mukherjee 128
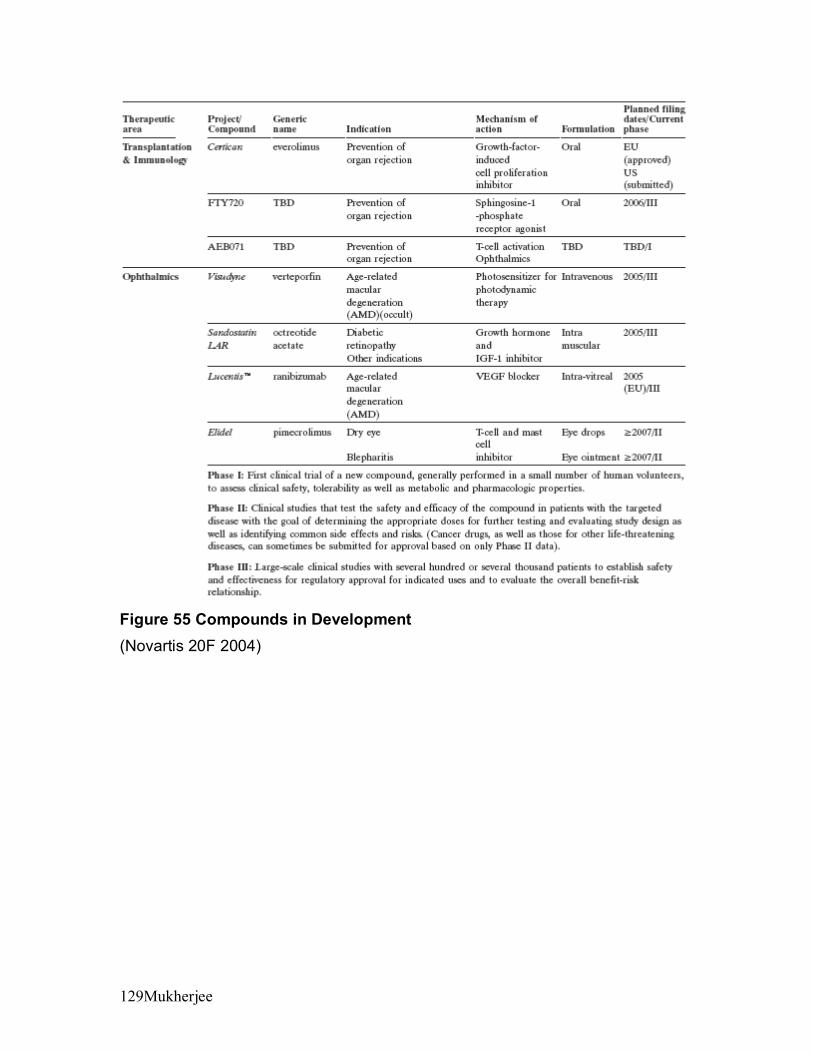
Mukherjee 129
Figure 55 Compounds in Development (Novartis 20F 2004)

Mukherjee 130
Industry Comparison
x54194 Veterinary Services
x54171 Research and Development in the Physical, Engineering, and Life Sciences
x54138 Testing Laboratories
xx339115 Ophthalmic Goods Manufacturing
x339113 Surgical Appliance and Supplies Manufacturing
x339111 Laboratory Apparatus and Furniture Manufacturing
x334516 Analytical Laboratory Instrument Manufacturing
xx325620 Toilet Preparation Manufacturing
x32562 Toilet Preparation Manufacturing
x325414 Biological Product (except Diagnostic) Manufacturing
x325413 In−Vitro Diagnostic Substance Manufacturing
xxxx325412 Pharmaceutical Preparation Manufacturing
xxxx325411 Medicinal and Botanical Manufacturing
xxxx32541 Pharmaceutical and Medicine Manufacturing
x322291 Sanitary Paper Product Manufacturing
PfizerMerckJ&JNovartisNAICS Codes
Figure 56 Company Comparison by NAICS Codes

Mukherjee 131
Industry Comparison
x8734 Testing laboratories
x8731 Commercial physical research
x5122 Drugs, proprietaries, and sundries
x5048 Ophthalmic goods
xx3851 Ophthalmic goods
x3842 Surgical appliances and supplies
x3841 Surgical and medical instruments
x3826 Analytical instruments
x3821 Laboratory apparatus and furniture
xx2844 Toilet preparations
x2836 Biological products exc. diagnostic
x2835 Diagnostic substances
xxxx2834 Pharmaceutical preparations
xxxx2833 Medicinals and botanicals
PfizerMerckJ&JNovartisSIC Codes
J&J Is Very Diversified with
over 200 Subidiaries
Figure 57 Company Comparison by SIC Codes
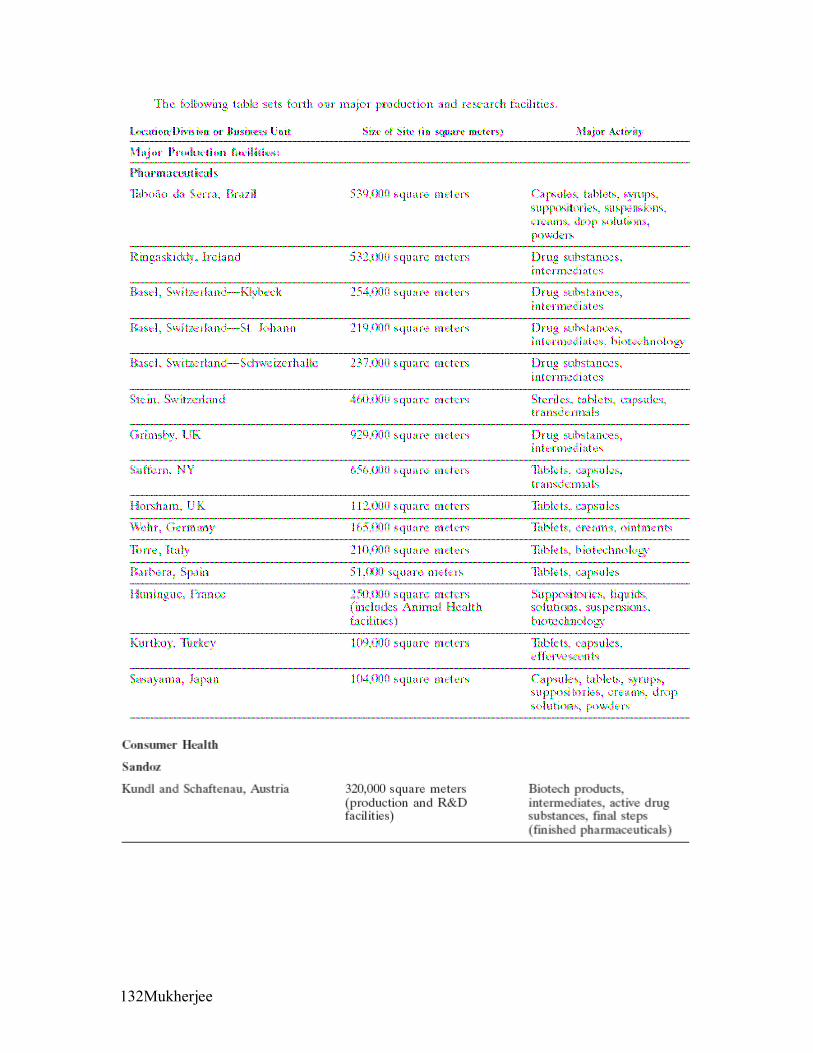
Mukherjee 132
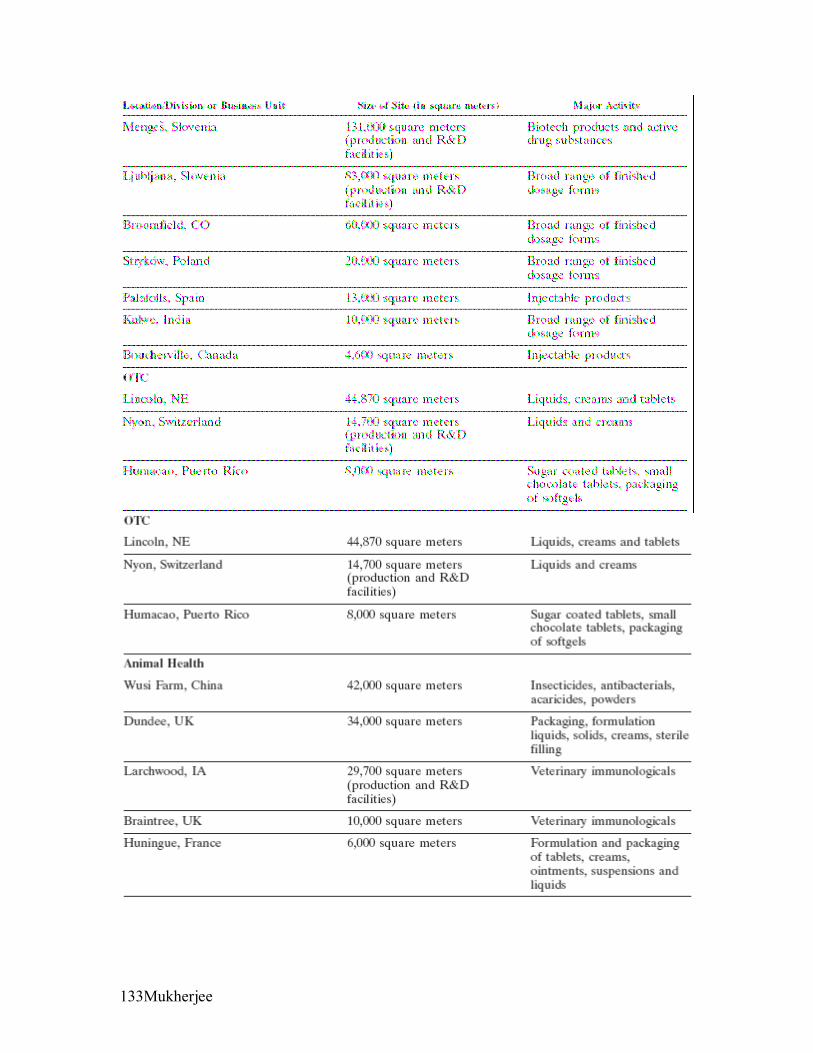
Mukherjee 133

Mukherjee 134
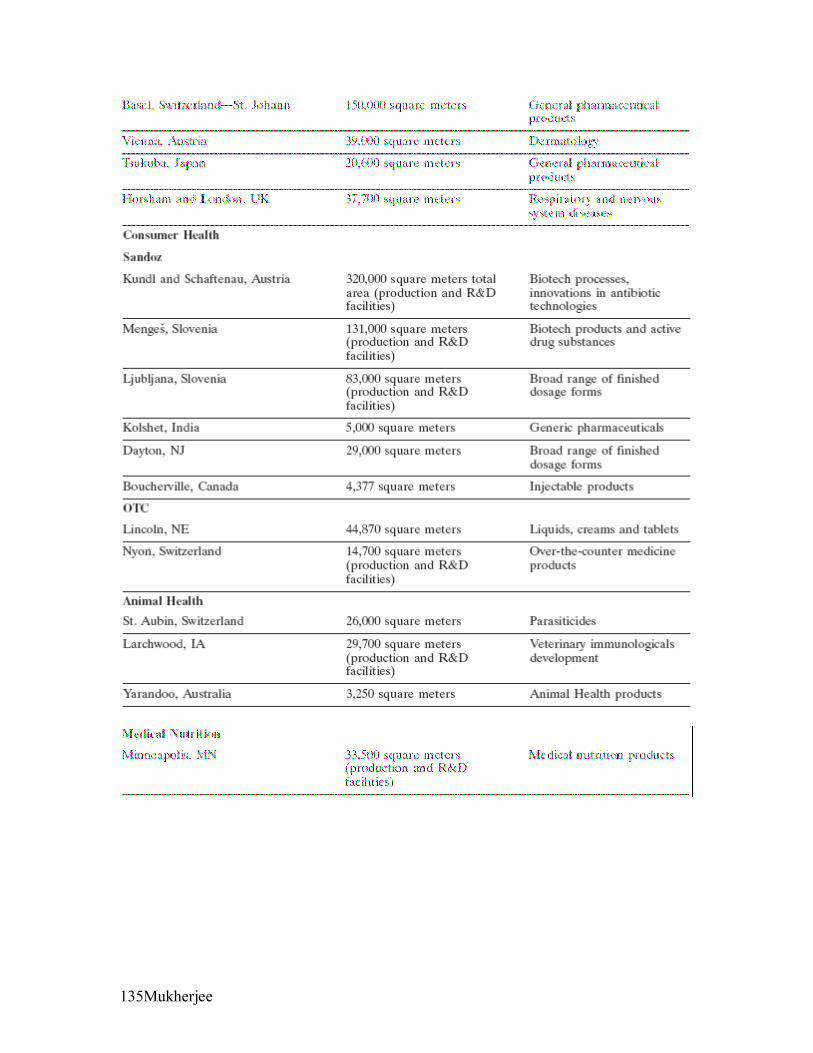
Mukherjee 135

Mukherjee 136
Figure 58 Facility Listing (Novartis 20F 2004)
Finished product Chemical raw material and intermediates Drug substance Reporting product Partly packaged product Bulk product Excipient Packaging material Pharmaceutical intermediate
Global Inventory by Product Category, December 2004
Total Inventory Value1.45 Billion USD
Total Inventory Value1.45 Billion USD
Global Inventory (consolidated, USD @ Budget rate, source: Propha)
Figure 59 Global Inventory by Product

Mukherjee 137
DIOVAN GROUPELIDELNEORAL/SANDIMMUNTRILEPTALVOLTAREN GROUPLESCOL GROUPTEGRETOL inc.CR/XROTHERS
December 04 Average Inventory Top 7 Brands
Top 7 brands account for 41% of the total inventory
MUSD at BR 04, source: Propha
Figure 60 Average Inventory by Top Brands

Mukherjee 138
Bibliography
5Aitken, Murray. Holt, Frazier. A Prescription for Direct Drug Marketing McKinsey
Quarterly, 2000-qtr2.
Barrett, Edward, James Paradis, and Leslie C. Perelman. The Mayfield Handbook of
Technical & Scientific Writing. Mountain View, CA: Mayfield Company, 1998.
Building Supply Chain Capabilities in the Pharmaceutical Industry. Jan. 2005
<http://www.ups.com>.
Chopra, Sunil, and Peter Meindl. Supply Chain Management. Upper Saddle River:
Pearson Education, Inc., 2004.
Christopher, Marin. Logistics and Supply Chain Management. N.p.: Financial Times
Prentice Hall, 2004.
Collins, Jerh. Telephone interview. 10 Mar. 2005.
CRA international. Jan. 2005 <http://www.crai.com>.
de Koning, Pieter. Personal interview. 10 Mar. 2005.
Drapes, Michaela. Hoovers. Jan. 2005 <http://hoovers.com>.
Fine, Charles H. Clock Speed. N.p.: Basic Books, 1998.
Food and Drug Administration Home Page. Jan. 2005 <http://www.fda.gov>.
Furio, Olga. Telephone interview. 10 Mar. 2005.
Hammer, Michael. Deep Change. Harvard Business Review, April 2004
Hoover's Online. Jan. 2005 <http://www.hoovers.com>.

Mukherjee 139
Lagasse, Mike D. “RFID in the Supply Chain: Presentation to the First Canadian RFID
Conference.” 2003.
Lapide, Larry. Supply Chain 2020 Project: Excellent Supply Chain Project
Opportunities for MLOG Students. And subsequent presentation made to ZLOG
students. Zaragoza, Spain. 2004
Mallik, A, G S. Pinkus, and S Sheffy. Biopharma's capacity crunch. June 2002. Jan. 2005
<http://http://www.euractiv.com/Article?tcmuri=tcm:29-117602-
16&type=Analysis>.
Manugistics.com. Jan. 2005 <http://www.manugistics.com>.
McTigue Pierce, Lisa. LookSmart's FindArticles. 12 Nov. 2003. 12 Apr. 2005
<http://www.findarticles.com/p/articles/mi_m0UQX/is_6_68/ai_n6095334/print>.
Milkeninstitute.org. Jan. 2005 <http://www.milkeninstitute.org>.
Novartis.com Home Page. Jan. 2005 <http://www.novartis.com>.
Pharmaceutical Research and Manufacturers of America, PhRMA Home Page. Jan. 2005
<http://www.phrma.org>.
Pharmaceutical Research and Manufacturers of America, Pharmaceutical Industry
Profile 2005 (Washington, DC: PhRMA, March 2005)
Porter, M.E. What Is Strategy? Harvard Business Review, November-December.
1996.
Prahalad, C.K., and Hamel, Gary. The Core Competence of the Corporation. Harvard
Business Review. May-June Issue. 1990.
Reber, Kurt. Personal interview. 10 Mar. 2005.
SAP - Sap.com. Jan. 2005 <http://www.sap.com>.

Mukherjee 140
Shah, Nilay. Pharmaceutical Supply Chains: key issues and strategies for optimization.
Diss. Centre for Process Systems Engineering, Department of Chemical
Engineering, Imperial College of Science, Technology and Medicine, London ,
Jan. 2005
Singh, Mahender Supply Chain 2020 Presentation: “An Overview of the Pharmaceutical
Supply Chain” 2004-2005
SPG Media Limited a subsidiary of SPG Media Group PLC 2004
Thomas, Olivier. Personal interview. 10 Mar. 2005.
Tufts Center for the Study of Drug Development. 1 Nov. 2001. Tufts University. 12 Apr.
2005 <http://csdd.tufts.edu>.
Tufts CSDD. Tufts Center for the Study of Drug Development. Jan. 2005
<http://csdd.tufts.edu>.
Wertheimer, Albert I., and Santella, Thomas M., Chaney, Nicole M. Business
Briefing: Pharmagenerics. 2004.
Welcome to the Centre for Economics and Business Research Ltd . Jan. 2005
<http://www.cebr.com>.
WHO | World Health Organization. Jan. 2005 <http://www.who.int>.
World Health Organization. “Counterfeit Drugs: Guidelines for the Development of
Measures to Combat Counterfeit Drugs.” 1999.
WSJ.com - U.S. Home. Jan. 2005 <http://www.wsj.com>.
Zook, Chris. Beyond the Core. Harvard Business School Press. 2004.


![STRATEGIES FOR HIGH VOLUME SUPPLY CHAINS …ctl.mit.edu/sites/ctl.mit.edu/files/library/public/...Tata Motors Analysis Cross Analysis [1] Challenges are characteristic of the automotive](https://static.fdocuments.in/doc/165x107/5eb2b134f44d7d2ee202a825/strategies-for-high-volume-supply-chains-ctlmitedusitesctlmitedufileslibrarypublic.jpg)