SUPPLY CHAIN COLLABORATION: A CASE STUDY IN TEXTILE …
136
SUPPLY CHAIN COLLABORATION: A CASE STUDY IN TEXTILE INDUSTRY by OSMAN SERDAR BASMACI Submitted to the Graduate School of Engineering and Natural Sciences in partial fulfillment of the requirements for the degree of Master of Science Sabanci University August 2003
Transcript of SUPPLY CHAIN COLLABORATION: A CASE STUDY IN TEXTILE …

SUPPLY CHAIN COLLABORATION: A CASE STUDY IN TEXTILE INDUSTRY
by
OSMAN SERDAR BASMACI
Submitted to the Graduate School of Engineering and Natural Sciences
in partial fulfillment of
the requirements for the degree of
Master of Science
Sabanci University
August 2003

SUPPLY CHAIN COLLABORATION: A CASE STUDY IN TEXTILE INDUSTRY
APPROVED BY:
Assist. Prof. Dr. Bülent Çatay ................................................... (Thesis Advisor)
Assoc. Prof. Dr. Dilek Çetindamar ................................................... (Thesis Co-Advisor)
Assoc. Prof. Dr. Yildiz Arikan ...................................................
Assist. Prof. Dr. Tonguç Ünlüyurt ...................................................
Assist. Prof. Dr. Gürdal Ertek ...................................................
DATE OF APPROVAL: 22.08.2003

© Osman Serdar Basmaci 2003
ALL RIGHTS RESERVED.

iv
ACKNOWLEDGEMENTS
I am deeply indebted to my advisors Dr. Bülent Çatay and Dr. Dilek Çetindamar
whose collaborative manner, stimulating suggestions, and encouragement helped me in all
the time of research and writing of this thesis.
I would like to thank my graduate committee members, Dr. Yildiz Arikan, Dr.
Tonguç Ünlüyurt, and Dr. Gürdal Ertek for their comments and critical suggestions.
I would also like to express my gratitude to Göksun Özensoy, Ilksen Emiroglu (3T),
Timuçin Gürer (Eliar), and M. Ali Ince (Pisa) for their collaboration and assistance during
my study. I have furthermore to thank the companies that helped me with their responses to
the questionnaires.
I am very grateful to my friends in Sabanci University for their invaluable support
and friendship.
At last, I would like to give my special thanks and devote this thesis to my family and
Gamze Ceyhan whose patient love, moral support, and daily collaboration enabled me to
complete this work.

v
ABSTRACT
Supply chain management (SCM) system is an integrated and collaborative network
of suppliers, factories, warehouses, distribution centers, and retailers, through which the
whole chain of logistic processes is managed for a fast and flexible coordination between a
company, its customers and suppliers within the chain. Among the members of supply
chain, “collaboration,” which is based on “sharing” sense - like information sharing,
resource sharing, risk sharing and activity sharing - plays a critical role to implement an
effective SCM. So, an increasing number of companies subscribe to the idea that
developing long-term collaboration, cooperation and partnership, can take significant
wastes out of the supply chain and provide a route for securing the best commercial
advantage. However, the implementation of partnering involves radical changes, which can
demand considerable work and is hard to implement.
At this point, collaborative networks of enterprises, such as Tekstil Terbiye
Teknolojileri A.S. (3T), have a crucial role to enable those enterprises to respond to
consumer demand more quickly, integrate with suppliers more effectively, adapt to market
variations more efficiently, and evolve product designs with manufacturing practices more
seamlessly. Certainly, performance evaluation of this collaboration is very important for
gaining and maintaining competitive advantage. Consequently, this thesis “Supply Chain
Collaboration: A Case Study In Textile Industry” aims to investigate the current
collaboration architecture of this network and to generate appropriate collaboration
performance metrics for a convenient performance measurement system. Thus,
performance of this collaborative system can be assessed in terms of these metrics to
identify the improvement areas of the system.
vi
ÖZET
Tedarik zinciri yönetim sistemi; tedarikçilerden, fabrikalardan, ambarlardan, dagitim
merkezlerinden ve bayilerden olusan; üzerinde, bir sirketin, o sirketin müsterilerinin ve
tedarikçilerinin hizli ve esnek koordinasyonu için gerekli tüm lojistik islerinin yönetildigi;
entegre ve isbirlikçi bir ag olarak tanimlanabilir. Tedarik zincirinin üyeleri arasindaki, bilgi
paylasimi, kaynak paylasimi, risk paylasimi ve faaliyet paylasimi gibi “paylasma” temeline
dayali “isbirligi,” etkili bir tedarik zinciri yönetiminin uygulanmasinda çok önemli bir rol
oynamaktadir. Bu nedenle de, uzun dönemli isbirliklerin ve ortakliklarin, tedarik
zincirlerini önemli harcamalardan arindirdigi ve tedarik zincirlerine önemli rekabet avantaji
sagladigi fikrini benimseyen sirketlerin sayisi gün geçtikçe artmaktadir. Bununla birlikte,
isbirlikleri ve ortakliklar, önemli degisiklikler gerektiren, kurulmasi ve yürütülmesi zor,
karsilikli fedakarlik isteyen beraberliklerdir.
Bu noktada, Tekstil Terbiye Teknolojileri A.S. (3T) gibi, farkli sirketlerin
olusturduklari isbirlikçi aglar; bu sirketlerin müsteri ihtiyaçlarina daha çabuk cevap
vermelerinde, tedarikçileriyle daha verimli çalismalarinda, pazar degiskenliklerine daha
kolay adapte olmalarinda ve ürün gelistirme faaliyetlerini daha etkin bir sekilde
gerçeklestirmelerinde hayati rol oynamaktadirlar. Tabii ki, bu isbirliklerin performansinin
ölçümü de, rekabet avantajinin saglanabilmesi ve korunabilmesi bakimindan büyük önem
tasimaktadir. Dolayisiyla, “Tedarik Zincirinde Isbirligi: Tekstil Endüstrisinde Bir Vaka
Çalismasi” isimli bu tez çalismasi, 3T’nin mevcut isbirligi yapisinin incelenmesini ve
uygun bir performans degerlendirme sistemi için gerekli isbirligi performans ölçütlerinin
belirlenmesini amaçlamaktadir. Böylece, bu ölçütler kullanilarak, bu isbirligi yapisinin
performansi ölçülüp degerlend irilebilecek ve sistemin potansiyel gelisim alanlari
belirlenebilecektir.

vii
TABLE OF CONTENTS
TABLE OF CONTENTS......................................................................................................vii
LIST OF TABLES ..................................................................................................................x
LIST OF FIGURES ...............................................................................................................xi
1. INTRODUCTION ..............................................................................................................1
2. SUPPLY CHAIN COLLABORATION.............................................................................6
2.1. Why Is Supply Chain Collaboration Needed? .................................................................9
2.1.1. Driving Forces of Supply Chain Collaboration ....................................................9
2.1.1.1. Meeting Customer Needs.............................................................................11
2.1.1.2. Cost Reduction by Supply Chain Productivity............................................11
2.1.1.3. A Competitive and Dynamic Environment ..................................................12
2.1.1.4. Other Driving Forces ...................................................................................12
2.1.2. Benefits of Supply Chain Collaboration.............................................................13
2.1.2.1. Customer Service Benefits...........................................................................14
2.1.2.2. Productivity Benefits ...................................................................................15
2.1.2.3. Other Benefits ..............................................................................................15
2.2. How Can Supply Chain Collaboration Be Implemented? .............................................16
2.2.1. The Elements and Players Involved in Supply Chain Management ...................16
2.2.1.1. Supply Chain Network Structure .................................................................17
2.2.1.2. Supply Chain Business Processes for Each Member...................................17
2.2.1.3. Supply Chain Management Components.....................................................18
2.2.2. Bridges to Effective Supply Chain Collaboration ..............................................20
2.2.2.1. Communication as a Bridge .........................................................................20
2.2.2.2. Alliance Management as a Bridge ...............................................................21
2.2.2.3. People Empowerment as a Bridge ...............................................................22
2.2.2.4. Alignment Mechanisms as a Bridge ............................................................22

viii
2.2.2.5. Performance Measurement as a Bridge .......................................................23
2.2.2.6. Process Change as a Bridge .........................................................................24
2.2.3. A Framework for Supply Chain Collaboration...................................................26
2.2.3.1. Stage 1: Develop an Overall Understanding of the Supply Chain...............26
2.2.3.2. Stage 2: Position the Organization within the Supply Chain.......................29
2.2.3.3. Stage 3: Build the Supply Chain Infrastructure Needed for Success...........29
2.2.3.4. Stage 4: Create and Communicate a Common Supply Chain Vision..........31
2.2.3.5. Stage 5: Cultivate Integrative Mechanisms .................................................32
2.2.3.6. Stage 6: Constantly Re-evaluate and Continuously Improve ......................32
2.3. What Are The Challenges Encountered For The Implementation of Supply Chain
Collaboration? .......................................................................................................................34
2.3.1. Barriers to Effective Supply Chain Collaboration..............................................34
2.3.1.1. Technology Barriers.....................................................................................35
2.3.1.2. Relationship Barriers ...................................................................................36
2.3.1.3. Alignment Barriers.......................................................................................37
3. SUPPLY CHAIN COLLABORATION STRUCTURE IN TEXTILE INDUSTRY IN
TURKEY: A CASE STUDY................................................................................................39
3.1. Turkish Textile and Apparel Industry............................................................................40
3.2. Tekstil Terbiye Teknolojileri A.S. (3T).........................................................................45
3.3. Research Methodology ..................................................................................................49
3.3.1. Questionnaire for Dyers......................................................................................49
3.3.2. Questionnaire for Suppliers ................................................................................50
4. QUESTIONNAIRE RESULTS ........................................................................................51
4.1. Company Profiles...........................................................................................................51
4.2. General Statistics About Data ........................................................................................54
4.2.1. Production Performance Targets.........................................................................54
4.2.2. Number of Companies Collaborated With .........................................................55
4.2.3. Benefits of Supply Chain Collaboration.............................................................56
4.2.4. Bridges to Supply Chain Collaboration..............................................................57
4.2.5. Barriers to Supply Chain Collaboration..............................................................58
4.2.6. Reasons for Collaboration with 3T .....................................................................59

ix
4.2.7. Performance Contribution of 3T to the Partners .................................................59
4.2.8. Agreement Levels of Partners to the Statements Related with 3T .....................61
4.2.9. Participation Frequency of 3T Partners to 3T Meetings .....................................62
4.2.10. Discussion Levels of Partners About Executive, Commercial, and Technical
Issues in 3T Meetings ...................................................................................................63
4.2.11. Supplier Selection Strategies of the Partners ....................................................64
4.2.12. Comparison of 3T and Other Suppliers ............................................................65
4.2.13. Companies that Have or Do Not Have Information About 3T.........................66
4.2.14. Potential Performance Improvement Areas ......................................................66
4.3. Correlations Between the Questions ..............................................................................67
4.4. Crosstab Analysis: Dissimilarities Between Partners of 3T and Other Companies ......72
4.5. Comparison of 3T Model and The Collaboration Framework Proposed by International
Trading Organization............................................................................................................76
5. PERFORMANCE EVALUATION..................................................................................79
5.1. Performance Metrics for 3T...........................................................................................79
5.2. Performance Metrics for Suppliers ................................................................................80
5.3. Performance Metrics for Dyers......................................................................................81
5.4. Performance Results ......................................................................................................81
6. CONCLUSION AND FURTHER RESEARCH..............................................................88
REFERENCES .....................................................................................................................92
APPENDIX A: Process Flow Chart of a Typical 3T Project ...............................................95
APPENDIX B: Collaboration Questionnaire For Dyers ......................................................97
APPENDIX C: Collaboration Questionnaire For Suppliers ...............................................105

x
LIST OF TABLES
Table 4.1 Proportions about R&D budgets and number of employees ................................53
Table 4.2 Percentage of “4” or “5” responses regarding given production targets ..............54
Table 4.3 Number of firms claiming a performance target among first 3 ............................55
Table 4.4 Percentage of “4” or “5” responses regarding given benefits...............................56
Table 4.5 Percentage of “4” or “5” responses of all participants regarding given bridges...57
Table 4.6 Percentage of “4” or “5” responses of 3T partner dyers regarding given bridges58
Table 4.7 Percentage of “4” or “5” responses regarding given barriers ...............................58
Table 4.8 Percentage of “4” or “5” responses regarding given reasons ...............................59
Table 4.9 Percentage of “4” or “5” responses regarding performance contribution of 3T...60
Table 4.10 Percentage of “4” or “5” responses about statements about partners and 3T.....61
Table 4.11 Percentage of “1=strongly disagree” and “2=disagree” answers of partners .....62
Table 4.12 Percentage of the partners that choose four supplier selection strategies ...........64
Table 4.13 Comparison of 3T and other suppliers: average superiority level......................65
Table 4.14 Percentage of “4” or “5” responses regarding given potential performance
improvement areas ................................................................................................................67
Table 4.15 Interpretation of correlation coefficients ............................................................68
Table 4.16 Pairs of variables having a correlation coefficient greater than 0.8....................69
Table 4.17 Chi-square test output for “R&D budget / total sales” .......................................72
Table 4.18 Crosstab output for “R&D budget / total sales” .................................................73
Table 4.19 Crosstab output for “producing high value-added products” .............................73
Table 4.20 Crosstab output for “number of companies collaborated with” .........................74
Table 4.21 Crosstab output for “existence of performance measurement system” ..............75
Table 4.22 Crosstab output for “difficulty of calculation of each partner’s contribution to
the collaboration”..................................................................................................................75

xi
LIST OF FIGURES
Figure 2.1 SCC framework (International Trading Organization, 2001) .............................28
Figure 3.1 Position of dyeing and finishing industry in textile chain (Tobler-Rohr, 2001) .39
Figure 4.1 Grouping of companies according to the number of employees .........................52
Figure 4.2 Grouping of companies according to their total sales in 2002 ............................52
Figure 4.3 Grouping of companies according to R&D budgets in 2002 ..............................53
Figure 4.4 Percentage of companies collaborating with the given numbers of companies ..56
Figure 4.5 Percentage of “1” responses regarding given performance contribution areas...61
Figure 4.6 Participation frequencies of the partners to 3T meetings ....................................63
Figure 4.7 Percentage of the partners that express ideas about three main issues ................63
Figure 4.8 Percentage of companies that have or do not have information about 3T ..........66
Figure 5.1 Performance contribution of 3T to its partners about communication................83
Figure 5.2 Performance contribution of 3T to its partners about product quality ................83
Figure 5.3 Performance contribution of 3T projects to the dyers about defect rate .............84
Figure 5.4 Performance contribution of 3T projects to dyers about breakdowns.................85
Figure 5.5 Performance contribution of 3T projects to dyers about production capacity ....85
Figure 5.6 Realization level of the cost reductions in labor, raw material and energy costs86

SUPPLY CHAIN COLLABORATION: A CASE STUDY IN TEXTILE INDUSTRY
by
OSMAN SERDAR BASMACI
Submitted to the Graduate School of Engineering and Natural Sciences
in partial fulfillment of
the requirements for the degree of
Master of Science
Sabanci University
August 2003

SUPPLY CHAIN COLLABORATION: A CASE STUDY IN TEXTILE INDUSTRY
APPROVED BY:
Assist. Prof. Dr. Bülent Çatay ................................................... (Thesis Advisor)
Assoc. Prof. Dr. Dilek Çetindamar ................................................... (Thesis Co-Advisor)
Assoc. Prof. Dr. Yildiz Arikan ...................................................
Assist. Prof. Dr. Tonguç Ünlüyurt ...................................................
Assist. Prof. Dr. Gürdal Ertek ...................................................
DATE OF APPROVAL: 22.08.2003

© Osman Serdar Basmaci 2003
ALL RIGHTS RESERVED.
iv
ACKNOWLEDGEMENTS
I am deeply indebted to my advisors Dr. Bülent Çatay and Dr. Dilek Çetindamar
whose collaborative manner, stimulating suggestions, and encouragement helped me in all
the time of research and writing of this thesis.
I would like to thank my graduate committee members, Dr. Yildiz Arikan, Dr.
Tonguç Ünlüyurt, and Dr. Gürdal Ertek for their comments and critical suggestions.
I would also like to express my gratitude to Göksun Özensoy, Ilksen Emiroglu (3T),
Timuçin Gürer (Eliar), and M. Ali Ince (Pisa) for their collaboration and assistance during
my study. I have furthermore to thank the companies that helped me with their responses to
the questionnaires.
I am very grateful to my friends in Sabanci University for their invaluable support
and friendship.
At last, I would like to give my special thanks and devote this thesis to my family and
Gamze Ceyhan whose patient love, moral support, and daily collaboration enabled me to
complete this work.

v
ABSTRACT
Supply chain management (SCM) system is an integrated and collaborative network
of suppliers, factories, warehouses, distribution centers, and retailers, through which the
whole chain of logistic processes is managed for a fast and flexible coordination between a
company, its customers and suppliers within the chain. Among the members of supply
chain, “collaboration,” which is based on “sharing” sense - like information sharing,
resource sharing, risk sharing and activity sharing - plays a critical role to implement an
effective SCM. So, an increasing number of companies subscribe to the idea that
developing long-term collaboration, cooperation and partnership, can take significant
wastes out of the supply chain and provide a route for securing the best commercial
advantage. However, the implementation of partnering involves radical changes, which can
demand considerable work and is hard to implement.
At this point, collaborative networks of enterprises, such as Tekstil Terbiye
Teknolojileri A.S. (3T), have a crucial role to enable those enterprises to respond to
consumer demand more quickly, integrate with suppliers more effectively, adapt to market
variations more efficiently, and evolve product designs with manufacturing practices more
seamlessly. Certainly, performance evaluation of this collaboration is very important for
gaining and maintaining competitive advantage. Consequently, this thesis “Supply Chain
Collaboration: A Case Study In Textile Industry” aims to investigate the current
collaboration architecture of this network and to generate appropriate collaboration
performance metrics for a convenient performance measurement system. Thus,
performance of this collaborative system can be assessed in terms of these metrics to
identify the improvement areas of the system.

vi
ÖZET
Tedarik zinciri yönetim sistemi; tedarikçilerden, fabrikalardan, ambarlardan, dagitim
merkezlerinden ve bayilerden olusan; üzerinde, bir sirketin, o sirketin müsterilerinin ve
tedarikçilerinin hizli ve esnek koordinasyonu için gerekli tüm lojistik islerinin yönetildigi;
entegre ve isbirlikçi bir ag olarak tanimlanabilir. Tedarik zincirinin üyeleri arasindaki, bilgi
paylasimi, kaynak paylasimi, risk paylasimi ve faaliyet paylasimi gibi “paylasma” temeline
dayali “isbirligi,” etkili bir tedarik zinciri yönetiminin uygulanmasinda çok önemli bir rol
oynamaktadir. Bu nedenle de, uzun dönemli isbirliklerin ve ortakliklarin, tedarik
zincirlerini önemli harcamalardan arindirdigi ve tedarik zincirlerine önemli rekabet avantaji
sagladigi fikrini benimseyen sirketlerin sayisi gün geçtikçe artmaktadir. Bununla birlikte,
isbirlikleri ve ortakliklar, önemli degisiklikler gerektiren, kurulmasi ve yürütülmesi zor,
karsilikli fedakarlik isteyen beraberliklerdir.
Bu noktada, Tekstil Terbiye Teknolojileri A.S. (3T) gibi, farkli sirketlerin
olusturduklari isbirlikçi aglar; bu sirketlerin müsteri ihtiyaçlarina daha çabuk cevap
vermelerinde, tedarikçileriyle daha verimli çalismalarinda, pazar degiskenliklerine daha
kolay adapte olmalarinda ve ürün gelistirme faaliyetlerini daha etkin bir sekilde
gerçeklestirmelerinde hayati rol oynamaktadirlar. Tabii ki, bu isbirliklerin performansinin
ölçümü de, rekabet avantajinin saglanabilmesi ve korunabilmesi bakimindan büyük önem
tasimaktadir. Dolayisiyla, “Tedarik Zincirinde Isbirligi: Tekstil Endüstrisinde Bir Vaka
Çalismasi” isimli bu tez çalismasi, 3T’nin mevcut isbirligi yapisinin incelenmesini ve
uygun bir performans degerlendirme sistemi için gerekli isbirligi performans ölçütlerinin
belirlenmesini amaçlamaktadir. Böylece, bu ölçütler kullanilarak, bu isbirligi yapisinin
performansi ölçülüp degerlend irilebilecek ve sistemin potansiyel gelisim alanlari
belirlenebilecektir.

vii
TABLE OF CONTENTS
TABLE OF CONTENTS......................................................................................................vii
LIST OF TABLES ..................................................................................................................x
LIST OF FIGURES ...............................................................................................................xi
1. INTRODUCTION ..............................................................................................................1
2. SUPPLY CHAIN COLLABORATION.............................................................................6
2.1. Why Is Supply Chain Collaboration Needed? .................................................................9
2.1.1. Driving Forces of Supply Chain Collaboration ....................................................9
2.1.1.1. Meeting Customer Needs.............................................................................11
2.1.1.2. Cost Reduction by Supply Chain Productivity............................................11
2.1.1.3. A Competitive and Dynamic Environment ..................................................12
2.1.1.4. Other Driving Forces ...................................................................................12
2.1.2. Benefits of Supply Chain Collaboration.............................................................13
2.1.2.1. Customer Service Benefits...........................................................................14
2.1.2.2. Productivity Benefits ...................................................................................15
2.1.2.3. Other Benefits ..............................................................................................15
2.2. How Can Supply Chain Collaboration Be Implemented? .............................................16
2.2.1. The Elements and Players Involved in Supply Chain Management ...................16
2.2.1.1. Supply Chain Network Structure .................................................................17
2.2.1.2. Supply Chain Business Processes for Each Member...................................17
2.2.1.3. Supply Chain Management Components.....................................................18
2.2.2. Bridges to Effective Supply Chain Collaboration ..............................................20
2.2.2.1. Communication as a Bridge .........................................................................20
2.2.2.2. Alliance Management as a Bridge ...............................................................21
2.2.2.3. People Empowerment as a Bridge ...............................................................22
2.2.2.4. Alignment Mechanisms as a Bridge ............................................................22
viii
2.2.2.5. Performance Measurement as a Bridge .......................................................23
2.2.2.6. Process Change as a Bridge .........................................................................24
2.2.3. A Framework for Supply Chain Collaboration...................................................26
2.2.3.1. Stage 1: Develop an Overall Understanding of the Supply Chain...............26
2.2.3.2. Stage 2: Position the Organization within the Supply Chain.......................29
2.2.3.3. Stage 3: Build the Supply Chain Infrastructure Needed for Success...........29
2.2.3.4. Stage 4: Create and Communicate a Common Supply Chain Vision..........31
2.2.3.5. Stage 5: Cultivate Integrative Mechanisms .................................................32
2.2.3.6. Stage 6: Constantly Re-evaluate and Continuously Improve ......................32
2.3. What Are The Challenges Encountered For The Implementation of Supply Chain
Collaboration? .......................................................................................................................34
2.3.1. Barriers to Effective Supply Chain Collaboration..............................................34
2.3.1.1. Technology Barriers.....................................................................................35
2.3.1.2. Relationship Barriers ...................................................................................36
2.3.1.3. Alignment Barriers.......................................................................................37
3. SUPPLY CHAIN COLLABORATION STRUCTURE IN TEXTILE INDUSTRY IN
TURKEY: A CASE STUDY................................................................................................39
3.1. Turkish Textile and Apparel Industry............................................................................40
3.2. Tekstil Terbiye Teknolojileri A.S. (3T).........................................................................45
3.3. Research Methodology ..................................................................................................49
3.3.1. Questionnaire for Dyers......................................................................................49
3.3.2. Questionnaire for Suppliers ................................................................................50
4. QUESTIONNAIRE RESULTS ........................................................................................51
4.1. Company Profiles...........................................................................................................51
4.2. General Statistics About Data ........................................................................................54
4.2.1. Production Performance Targets.........................................................................54
4.2.2. Number of Companies Collaborated With .........................................................55
4.2.3. Benefits of Supply Chain Collaboration.............................................................56
4.2.4. Bridges to Supply Chain Collaboration..............................................................57
4.2.5. Barriers to Supply Chain Collaboration..............................................................58
4.2.6. Reasons for Collaboration with 3T .....................................................................59
ix
4.2.7. Performance Contribution of 3T to the Partners .................................................59
4.2.8. Agreement Levels of Partners to the Statements Related with 3T .....................61
4.2.9. Participation Frequency of 3T Partners to 3T Meetings .....................................62
4.2.10. Discussion Levels of Partners About Executive, Commercial, and Technical
Issues in 3T Meetings ...................................................................................................63
4.2.11. Supplier Selection Strategies of the Partners ....................................................64
4.2.12. Comparison of 3T and Other Suppliers ............................................................65
4.2.13. Companies that Have or Do Not Have Information About 3T.........................66
4.2.14. Potential Performance Improvement Areas ......................................................66
4.3. Correlations Between the Questions ..............................................................................67
4.4. Crosstab Analysis: Dissimilarities Between Partners of 3T and Other Companies ......72
4.5. Comparison of 3T Model and The Collaboration Framework Proposed by International
Trading Organization............................................................................................................76
5. PERFORMANCE EVALUATION..................................................................................79
5.1. Performance Metrics for 3T...........................................................................................79
5.2. Performance Metrics for Suppliers ................................................................................80
5.3. Performance Metrics for Dyers......................................................................................81
5.4. Performance Results ......................................................................................................81
6. CONCLUSION AND FURTHER RESEARCH..............................................................88
REFERENCES .....................................................................................................................92
APPENDIX A: Process Flow Chart of a Typical 3T Project ...............................................95
APPENDIX B: Collaboration Questionnaire For Dyers ......................................................97
APPENDIX C: Collaboration Questionnaire For Suppliers ...............................................105

x
LIST OF TABLES
Table 4.1 Proportions about R&D budgets and number of employees ................................53
Table 4.2 Percentage of “4” or “5” responses regarding given production targets ..............54
Table 4.3 Number of firms claiming a performance target among first 3 ............................55
Table 4.4 Percentage of “4” or “5” responses regarding given benefits...............................56
Table 4.5 Percentage of “4” or “5” responses of all participants regarding given bridges...57
Table 4.6 Percentage of “4” or “5” responses of 3T partner dyers regarding given bridges58
Table 4.7 Percentage of “4” or “5” responses regarding given barriers ...............................58
Table 4.8 Percentage of “4” or “5” responses regarding given reasons ...............................59
Table 4.9 Percentage of “4” or “5” responses regarding performance contribution of 3T...60
Table 4.10 Percentage of “4” or “5” responses about statements about partners and 3T.....61
Table 4.11 Percentage of “1=strongly disagree” and “2=disagree” answers of partners .....62
Table 4.12 Percentage of the partners that choose four supplier selection strategies ...........64
Table 4.13 Comparison of 3T and other suppliers: average superiority level......................65
Table 4.14 Percentage of “4” or “5” responses regarding given potential performance
improvement areas ................................................................................................................67
Table 4.15 Interpretation of correlation coefficients ............................................................68
Table 4.16 Pairs of variables having a correlation coefficient greater than 0.8....................69
Table 4.17 Chi-square test output for “R&D budget / total sales” .......................................72
Table 4.18 Crosstab output for “R&D budget / total sales” .................................................73
Table 4.19 Crosstab output for “producing high value-added products” .............................73
Table 4.20 Crosstab output for “number of companies collaborated with” .........................74
Table 4.21 Crosstab output for “existence of performance measurement system” ..............75
Table 4.22 Crosstab output for “difficulty of calculation of each partner’s contribution to
the collaboration”..................................................................................................................75

xi
LIST OF FIGURES
Figure 2.1 SCC framework (International Trading Organization, 2001) .............................28
Figure 3.1 Position of dyeing and finishing industry in textile chain (Tobler-Rohr, 2001) .39
Figure 4.1 Grouping of companies according to the number of employees .........................52
Figure 4.2 Grouping of companies according to their total sales in 2002 ............................52
Figure 4.3 Grouping of companies according to R&D budgets in 2002 ..............................53
Figure 4.4 Percentage of companies collaborating with the given numbers of companies ..56
Figure 4.5 Percentage of “1” responses regarding given performance contribution areas...61
Figure 4.6 Participation frequencies of the partners to 3T meetings ....................................63
Figure 4.7 Percentage of the partners that express ideas about three main issues ................63
Figure 4.8 Percentage of companies that have or do not have information about 3T ..........66
Figure 5.1 Performance contribution of 3T to its partners about communication................83
Figure 5.2 Performance contribution of 3T to its partners about product quality ................83
Figure 5.3 Performance contribution of 3T projects to the dyers about defect rate .............84
Figure 5.4 Performance contribution of 3T projects to dyers about breakdowns.................85
Figure 5.5 Performance contribution of 3T projects to dyers about production capacity ....85
Figure 5.6 Realization level of the cost reductions in labor, raw material and energy costs86

1
1. INTRODUCTION
Collaborative networks of enterprises have a crucial role to enable the enterprises to
respond to consumer demand more quickly, to integrate with suppliers more effectively, to
adapt to market variations more efficiently, and to evolve product designs with
manufacturing practices more seamlessly. And certainly, performance evaluation of those
networks is very important for gaining and maintaining competitive advantage in today’s
business environment. This study mainly aims to investigate the current collaboration
architecture of Tekstil Terbiye Teknolojileri A.S. (3T), which is an interesting example of
collaborative networks and has some unique characteristics not only in the textile industry in
Turkey but also around the world and to generate appropriate collaboration performance
metrics for a convenient performance measurement system. The performance of this
collaborative network may be assessed in terms of these metrics to identify the improvement
areas of the network. Furthermore, this study was conducted to gain an insight into
perception of supply chain collaboration in Turkey. For this purpose, two questionnaires
were performed on the firms in textile dyeing and finishing industry.
In today’s business world, supply chain management (SCM) and electronic commerce
are among the most frequently discussed topics. Indeed, the quest to meet the needs of
demanding customers is driving dramatic changes in the way companies operate. For the
past decade, companies have restructured, reorganized, and re-engineered in order to
increase organizational effectiveness and better satisfy key customers. The goal is to
develop value-added processes that deliver innovative, high-quality, low-cost products on
time with shorter cycle times, and greater responsiveness than ever before. Yet, even as
superior levels of performance are pursued, many managers have begun to realize that their
organizations lack some of the resources and the competencies required for success. This
realization has led them to look beyond their companies’ organizational boundaries to

2
evaluate how the resources of their suppliers and customers can be utilized to create the
exceptional value that is demanded by downstream customers. Efforts to align objectives
and integrate resources across organizational boundaries in order to deliver greater value are
known as SCM initiatives. The typical supply chain involves various tiers of materials
suppliers, service providers, the firm itself, and one or more levels of customers, each of
which depending on the others to a greater or lesser extent to achieve high levels of
competitiveness (Pagh and Cooper, 1998).
In theory, supply chain collaboration allows the organization to focus on doing
exceptionally well a few things for which it has unique skills and advantages. Non-core
activities and processes are then shifted to other channel members that possess superior
capabilities in those areas, regardless of their positions in the supply chain. When
appropriate, close relationships are formed to assure outstanding and seamless performance
levels. In effect, “teams” of suppliers, finished-goods producers, service providers, and
retailers are formed to create and deliver the very best product / service offerings possible.
As with other teams, successful supply chain teams not only comprise the best players
available but also have established true chemistry; a common understanding of supply chain
success factors, an understanding of individual roles, an ability to work together, and a
willingness to adjust and adapt in order to create superior value. These allied teams of
companies form a collaborative supply chain, which often competes against other supply
chains in today’s global economy (Cox, 1999).
In order to achieve supply chain collaboration, effective supply chain integrators
possess the following characteristics (Ellinger, 2000):
• They are customer centric.
• They recognize interfirm collaboration as critical.
• They focus on processes rather than functions.
• They view open communication as a must.
• They factor people into every decision.
• They invest in information technology as an enabler.
• They are obsessed with performance measurement.

3
Managers need to better understand the nature of SCM for at least three reasons. First,
the convergence of several competitive factors has left many managers feeling that they
have no options other than to participate in collaborative SCM programs. Foremost among
the environmental factors driving channel collaboration include the following (Beamon,
1998):
• The emergence of information-empowered customers who demand greater
responsiveness.
• The existence of fiercely competitive global rivals that impose cost pressures and
squeeze margins.
• The recognized need to focus resources on core competencies.
• The desire to be a team with strong channel partners before competitors do.
• High levels of merger activity, which alter the balance of channel power.
Ultimately, the fact that key customers request participation while serious competitors
are willing to enter into integrated channel alliances provides a strong impetus for adopting
a SCM perspective. Thus, a better understanding of the motivations driving SCM initiatives
is needed. Second, today’s competitive mandate is to serve valued customers better, faster,
and at lower costs. Anecdotal evidence suggests that when implemented appropriately, SCM
has the potential to help companies do this. Thus, it is important to document SCM’s
competitive benefits and impact.
Finally, attempts to increase supply chain integration often create a sense of
organizational vulnerability, requiring workers and managers to step out of traditional
comfort zones. Unwillingness created by the resistance to organizational change makes
supply chain collaboration inherently difficult. Many emotionally charged questions arise as
an organization begins to consider supply chain collaboration (Elliff, 1996):
• Who is really in charge?
• Can we really trust the other supply chain members not to take advantage of us?
• What does SCM really mean for our bottom line performance?

4
• How is our role going to change in new, collaborative supply chain environment?
• How am I going to develop the skills needed for success in the new “team”
environment?
• Who are the best partners to align our competitive efforts with?
• How are we going to measure who adds what value?
• With how many different supply chains can we work effectively?
Even when these questions are answered, the challenge of meshing unique
organizational cultures, incompatible information systems, diverse worker attitudes, and
different approaches to performance measurement can seem insurmountable. Thus,
managers need to understand the nature of the many barriers that hinder supply chain
collaboration as well as the mechanisms that can facilitate SCM success (Elliff, 1996).
The literature review, presented in Chapter 2, looks into the academic domain to
review “supply chain collaboration” philosophy with its reasons, implementation ways, and
barriers. First, the term “supply chain management” will formally be defined and then,
forces that motivates supply chain collaboration and benefits of collaboration will be
discussed. Furthermore, the elements and players involved in SCM and bridges to supply
chain collaboration will be reviewed, along with a framework for this collaboration. Finally
the barriers that stand on the way of collaboration will be discussed. In Chapter 3, a case
study on collaboration in textile industry in Turkey will be presented. In this chapter, current
situation of Turkish textile industry will be discussed and interesting collaboration structure
of 3T will be introduced. As this study mainly aims to have an insight into perception of
collaboration concept in Turkey and to examine, evaluate and improve current collaboration
structure of 3T; the questionnaires were prepared for these purposes, since there were no
available data for such a study. The questionnaires include many questions to have
information about employee profiles, some financial issues and production targets of the
companies in dyeing and finishing industry, as well in order to understand their attitudes
about collaboration. So in Chapter 3, the methodology of the questionnaires that were
conducted on textile dyers and 3T partners will also be explained. In Chapter 4, the results
and statistical analysis of these questionnaires will be discussed. In addition, since the

5
questionnaires also purpose to determine to what extent 3T collaboration model matches
with the collaboration framework presented in Chapter 2, the results of this comparison will
also be discussed in Chapter 4. In Chapter 5, the performance metrics developed for 3T and
its partners and their measurement values will be presented. Finally, Chapter 6 will conclude
this study and provide insights for future work.

6
2. SUPPLY CHAIN COLLABORATION
As the competitive battle is truly shifting from company versus company to supply
chain versus supply chain, managers need to understand better why supply chain
collaboration (SCC) is needed, how it can be implemented, what the barriers to
collaboration are, and how well it functions. A SCC roadmap that helps answer these
questions is vital to the quest to achieve greater supply chain alignment. Such a framework
begins to emerge as managers gain an understanding of the benefits, bridges, and barriers
associated with SCC. These three issues determine not only if and when, but also how
collaborative supply chain strategies should be implemented (Quinn, 1997):
• Understanding the benefits helps managers make informed decisions about
whether or not it is worthwhile to undertake the arduous SCC journey. Quantifying the
benefits also makes it possible to justify the cost.
• Understanding the bridges to successful SCC defines the scope and the nature of
the collaboration initiative. It also helps managers evaluate specific mechanisms that
facilitate cross-functional and inter-organizational collaboration. This evaluation is needed
to develop an overall SCC plan and establish priorities regarding individual collaboration
activities.
• Understanding the barriers to successful SCC enables managers to weigh both the
costs and the viability of adopting a supply chain strategy. Knowing where the barriers are
likely to be found also makes it possible to establish valid expectations about the
collaboration process as well as appropriate contingency plans for overcoming some of the
expected challenges.

7
As the collaboration road passes through effective supply chain management (SCM),
first, the SCM concept must be well understood and perceived by the managers to build
cross-functional and inter-organizational collaboration.
The frequency with which the term “supply chain management” is used in today’s
materials management environment would lead an observer to conclude that SCM is a well
understood concept accompanied by an accepted set of managerial practices (Marien, 2000).
In reality, definitions of and approaches to SCM vary substantially from organization to
organization and even from manager to manager within the same organization. While most
purchasing and materials managers can say the familiar supply chain mantra of “suppliers’
supplier to customers’ customer,” few companies are actually engaged in such extensive
supply chain integration and collaboration. Indeed, few companies have adopted and
published a formal definition of SCM. Even fewer organizations have carefully mapped out
their supply chains so that they know who their suppliers’ suppliers or customers’ customers
really are. While definitions of SCM vary greatly, several themes became apparent as this
study was carried out. The followings are some of the definitions of SCM taken from the
literature:
• “SCM is the delivery of enhanced customer and economic value through
synchronized management of the flow of physical goods and associated information through
sourcing to consumption” (LaLonde and Masters, 1994).
• “SCM is the coordination and integration of all activities associated with moving
goods from the raw materials to the end user, for sustainable competitive advantage. This
includes systems management, sourcing, production scheduling, order processing, inventory
management, transportation, warehousing, and customer service” (Cooke, 1997).
• “SCM embraces and links all of the partners in the chain. In addition to the
departments within the organization, these partners include vendors, carriers, third-party
companies, and information systems providers” (Quinn, 1997).

8
• “SCM is a process for achieving a clear line of sight from the supply base to our
customers with buyer and seller working jointly to drive out non-value-added costs, improve
quality, speed order fulfillment, and introduce new product and process technology” (Porter,
1997).
• “The global network used to deliver products and services from raw materials to
end customers through engineered flows of information, physical distribution, and cash”
(Alber and Walker, 1998).
• “SCM is characterized by control based on networking and integration of
processes across functional, geographical, and organizational interfaces” (van Hoek, 1998).
• “SCM is the coordinated flow of materials and products across the enterprise and
with trading partners. It also includes the management of information flow, cash flow, and
process/work flows” (Tyndall et al., 1998).
• “SCM is the integration of key business processes from end user through original
suppliers that provides products, services, and information that add value for customers and
other stakeholders” (Lambert et al., 1998).
• “Integrated SCM is a process-oriented approach to procuring, producing, and
delivering products and services to customers and has a broad scope that includes sub-
suppliers, suppliers, internal operations, trade customers, retail customers, and end users”
(Marien, 2000).
• “SCM increases customer service and profitability through
coordination/integration of multiple echelons, processes, and functions like suppliers,
purchasing, manufacturing, distribution, marketing / sales, & customers” (Akkermans et al.,
1999).

9
• “SCM involves all activities associated with the transformation and flow of goods
and services, including their information flows, from sources of raw materials to end users.
For coordination to continue, there is a need for metrics that can identify and capture chain-
wide benefits and costs, information sharing mechanism to distribute this data among chain
members, and an allocation mechanism for redistributing the rewards of collaboration”
(Ballou et al., 2000).
• “SCM is a set of approaches to efficiently integrate suppliers, manufacturers,
warehouses, and stores, so that merchandise is produced and distributed at the right
quantities, to the right locations, and at the right time, in order to minimize system-wide
costs while satisfying service level requirements” (Simchi-Levi et al., 2000).
Given the common occurrence of these themes among supply chain leaders, the
definition of SCM used throughout this study is as follows:
“Supply Chain Management is the collaborative effort of multiple channel members to
design, implement, and manage seamless value-added processes to meet the real needs of
the end customers. The development and integration of people and technological resources
as well as the coordinated management of materials, information, and financial flows
underlie successful supply chain collaboration.”
2.1. Why Is Supply Chain Collaboration Needed?
In order to expose the reasons of supply chain collaboration (SCC), the driving forces
of SCC and the benefits of this collaboration should be explained first.
2.1.1. Driving Forces of Supply Chain Collaboration
A critical issue for managers, thinking about the relative merit of SCC as well as its
applicability to their organization, is the question of why. That is, why should they

10
undertake a strategy that is clearly resource intensive and inherently difficult not just to
initiate but also to make successful over the long haul? Another way to view this question is
to ask: Are there compelling reasons in my particular industry or for my specific
organization to engage in SCM? If there are no compelling reasons, it will be next to
impossible to generate the organizational support and establish the momentum required to
successfully align and integrate the supply chain (Fitzgerald et al., 2000).
The following is a list of the motivating factors driving SCC (Fitzgerald et al., 2000):
• Need to meet customer requirements
• Desire to reduce costs
• Unyielding and intensifying competition
• Rapid and dynamic change in the market
• Widespread information availability
• Greater focus on core competencies
• Expiring patents and shorter innovation cycles
• The threat of disintermediation
• Economic globalization
• Competition to link with the best partners
• Increased reliance on outsourcing
• Significant merger activity
• Technological innovation
• Desire to share resources
Among these driving forces, three of them have relatively more importance. These are
the need to meet the requirements of increasingly demanding customers, the desire to reduce
costs by increasing the supply chain productivity to fend off fierce competition, and the
competitive and dynamic environment.
“Retailers and third-party service providers are more focused on customer needs while
finished goods assemblers and suppliers place greater emphasis on supply chain efficiencies.
At many companies, these two motivations exist together and create a broad-based appeal

11
for supply chain strategies. Companies that believe in and advertise only the cost reduction
benefits of SCM tend to face greater resistance to change and more disbelief from managers
and employees” (Lapide, 1998).
2.1.1.1. Meeting Customer Needs
Improving customer satisfaction is clearly the dominant motivation encouraging
organizations to begin the journey toward SCC. The perceived need to enhance customer
value is universal across the three functional areas examined and supports what business
analysts have been saying for years. The underlying implication is that companies must
continually struggle “to improve customer satisfaction and that SCC can help them do so.”
In today’s world, inhabited by demanding customers, companies can no longer rely on the
operational efficiencies provided by lean activities within the four walls of the organization
to drive profitability. Rather, an organization’s value-added activities and efforts must be
targeted at delivering value to customers and must include other supply chain entities. The
focus on customer satisfaction emerges from a combination of several issues including the
following (Lambert and Cooper, 2000):
• The cumulative effect of years of quality management thinking, which has
emphasized the importance of meeting customers’ real needs.
• The globalization of competition, which has brought an increased number of viable
competitors to the marketplace - giving customers access to a variety of valid competitive
options.
• The emergence of the Internet, which has greatly empowered customers by
providing access to comparative quality, price, and performance information.
• The compression of innovation cycle times coupled with higher levels of cost,
quality, and delivery performance, which has led to elevated expectations and therefore
more demanding customers.
2.1.1.2. Cost Reduction by Supply Chain Productivity
The second most critical motivating factor is a desire for organizations to increase
supply chain productivity, and thereby reduce the costs associated with satisfying customers.
This is the reason why SCM is receiving so much attention these days - if planned and

12
managed correctly, changes in supply chain relationships can simultaneously increase
revenues and decrease costs (Marien, 2000). This “double- impact” of SCM enables
companies to financia lly justify the expense and difficulties inherent in SCC. That is, when
increased revenue flows and reduced day-to-day expense streams are factored into net
present value (NPV) or other financial models, SCM projects can clear the bar that is set via
hurdle rates and payback periods. In recent years, the connection between SCM and value
creation as measured by economic value-added (EVA) and shareholder value analysis
(SVA) has been highlighted (Lambert and Cooper, 2000).
2.1.1.3. A Competitive and Dynamic Environme nt
The third motivating force has increased industry competition. Marien (2000) states
that companies are paying more attention to SCM because they have to in order to be a
winner in this competitive environment. As with customer satisfaction, a multitude of
factors including globalization, better information availability, and more demanding
customers are responsible for the perception that the business world is increasingly
competitive. Likewise, regardless of the source of competition in any given industry, the
consensus is that SCC can at least partially counter the adverse impact of intensifying
competition. Once again, the simultaneous supply chain benefits of increased customer
satisfaction (higher revenues) and higher productivity (lower costs) can he lp ease the
challenges of increased competition.
2.1.1.4. Other Driving Forces
There are other factors moderately important in driving the implementation of SCC.
Foremost among these is the perception that “the time to build the best team of supply chain
partners by collaboration” is “now.” That is, there is some competition to link up with the
best partners available before a competitor establishes sound relationships with them.
Toyota recently announced that it is increasing its ownership stake in many of its best
suppliers in order to keep competitors like General Motors from making too much of an
inroad in tapping the technologies and expertise of these world-class suppliers. “The desire
to lock up the best supply chain partners is consistent with the belief that competition is
moving from the company level to the supply chain level” (Salcedo and Grackin, 2000).

13
Marien (2000) also notes that the desire to “focus on the company’s core
competencies” is a force that leads to greater efforts to build stronger supply chain
relationships. In a highly competitive world, it is difficult to meet the competitive standard
across a broad range of activities. Recognizing that it is increasingly challenging to be all
things to all people, companies have focused more intently on those activities where they
possess a unique skill or technology. As a result, they have chosen to “out-source non-core
activities.” So, greater emphasis on outsourcing combined with the emphasis on customer
satisfaction requires more efficient and effective SCM.
Another driving factor is the desire to access to global markets. However, the reality is
that for many companies, cultivating stronger supply chain relationships in the home market
is a complex and difficult task with which they are still struggling. Dealing with the diverse
cultures, longer distances, language barriers, unfamiliar laws and regulations, exchange
rates, and infrastructure problems found in the global marketplace greatly magnifies the
difficulty of building tight supply chain relationships. Thus, while expanding supply chain
initiatives worldwide is often viewed as desirable, global SCM has yet to make it to the top
of the planning agenda for most companies (Lapide, 1998).
2.1.2. Benefits of Supply Chain Collaboration
Before beginning a long and difficult implementation journey, most managers want to
know that the results will make the effort worthwhile. Identifying and quantifying the
expected benefits is a critical part of any cost/benefit analysis used to evaluate the
attractiveness of strategic supply chain initiatives. If the benefits are viewed as sizable and
managers believe that the company can realistically attain them, then it makes sense to
thoroughly evaluate SCM to develop a viable implementation plan. The competitive benefits
of SCC can be grouped in three groups as customer service benefits, productivity benefits
and other benefits. The following is the list of the main benefits of SCC (Van Hoek, 1998):
14
• Increased customer responsiveness
• More consistent on-time delivery
• Increased customer satisfaction
• Shorter order fulfillment lead times
• Lower cost of purchased items
• Increased firm profitability
• Ability to handle unexpected events
• Reduced inventory costs
• Reduced overall product cost
• Increased productivity
• Higher product quality
• Better asset utilization
• Reduced transportation costs
• Faster market penetration
• Faster product innovation
• Reduced cost of new product development
• Preferred & tailored relationships
2.1.2.1. Customer Service Benefits
“Customer service benefits include responsiveness to customer requests, improved on-
time delivery, and better customer satisfaction. Additionally, SCC also reduces order
fulfillment lead times. Three of these benefits directly target the company’s ability to
compete on the basis of time. Closer collaborative relationships enable more accurate
information to be shared on timelier basis. Supply chain partners are also better able to
anticipate their collaborators’ needs and handle unexpected events. Time and inventory can
be taken out of the supply chain system. These benefits foster collaboration, promote
interdependence, and raise switching costs. Equally important, such benefits are directly
aligned with the motivating factor for SCC - the desire and need to increase customer
satisfaction” (Beamon, 1999).

15
As has been seen in the areas of total quality control, just- in-time production, and
other high-profile strategic initiatives, early efforts often fail to deliver effective results. A
certain threshold of change in practice seems to be needed for the attractive benefits to be
realized. Anecdotal evidence from these other strategic endeavors suggests quite strongly
that many companies are not patient enough to pursue difficult implementations that require
changed mindsets and altered organizational responsibilities. This precedence could present
a substantial hurdle for supply chain champions (Beamon, 1999).
2.1.2.2. Productivity Benefits
The next most recognized benefit of SCC is in the area of cost reduction as it is
directly related with the productivity. Among productivity benefits, there are reductions in
the cost of purchased items, reduced inventory costs, reduced overall product costs, and
enhanced productivity. Tighter and more collaborative relationships improve information
exchange and facilitate joint problem solving and improvement activities. For example,
some of the most visible supply chain initiatives include continual improvement clauses and
supplier development. Buying organizations expect their best suppliers to constantly reduce
the costs of purchased items and in many instances are willing to work with them to
improve their processes in ways that increase productivity and bring down costs. It should
be noted that the second motivating force was improved supply chain productivity (Van
Hoek, 1998). The findings regarding performance improvements thus show a nice
correlation between motivating factors and achieved benefits. Finally, the sixth benefit is
increased organizational profitability - a logical outcome of a firm’s ability to more
efficiently meet customer expectations.
2.1.2.3. Other Benefits
Two benefits, better quality and faster innovation are also very important for the
companies. For many years, closer supplier relationships supported by supplier certification
programs have been discussed as a critical element of quality improvement programs. The
shifting of quality responsibility back to the supplier is a practice that is representative of the
larger notion of SCC. This is particularly true when supplier training and development
initiatives support supplier certification programs. Companies had already achieved a certain
comfort with buyer / supplier quality programs before the “supply chain fad” emerged. A

16
second possibility is that joint quality initiatives are not as widely practiced among all
supply chain levels as they are between leading finished goods assemblers and their most
important first-tier suppliers (Van Hoek, 1998).
Collaborative product development leads to higher-quality, lower-cost products
brought from concept to market in dramatically less time. Companies have obtained some
innovation performance improvements through collaborative product development efforts
that come up with reduced innovation leads and reduced development costs. However, only
a relatively small percent of organizations have been able to successfully develop joint
collaboration as a competitive weapon. Many companies have either not implemented joint
product development programs or are in only the early stages of implementation.
Establishing the trust and communication necessary to share technology, co- locate
personnel, and accept supplier-generated design improvements is not easy and may require
“higher- level” forms of SCC (Beamon, 1999). The collaboration structure investigated in
Chapter 3 is also built for faster innovation and product development, which as mentioned
earlier, it is one of the most difficult collaboration structures to achieve.
2.2. How Can Supply Chain Collaboration Be Implemented?
In order to describe “supply chain management” more fully and to explain how SCC
can be implemented, it will be convenient to review first the elements and players involved
in SCM, which leads into creating definitions for “supply chain collaboration.” Then bridges
to effective SCC and a framework for supply chain collaboration will be reviewed.
2.2.1. The Elements and Players Involved in Supply Chain Management
It is also very important to know the meanings and usages of the elements and the key
decisions of SCM for the successful implementation of SCC. Lambert and Cooper (2000)
developed a framework for SCM that divides elements and key decisions into three areas:

17
• Supply chain network structure
• Supply chain business processes
• Supply chain management components
2.2.1.1. Supply Chain Network Structure
Supply chain network structure gives the answer of the question: “Who are the key
supply chain members with whom to link processes?” The primary aspects of a company's
network structure are (Lambert and Cooper, 2000):
• The members of the supply chain (primary and secondary).
• The structural dimensions of the network.
− Horizontal structure: number of tiers across the supply chain.
− Vertical structure: number of firms represented in each tier.
− A company's horizontal position within the chain.
2.2.1.2. Supply Chain Business Processes for Each Member
Supply chain business processes are the answers of the question; “What processes /
activities that produce a specific value to customers should be linked with each of these key
supply chain members?” These are the main business processes to be performed for any
company to succeed in today’s business world. In the literature, the followings are said to be
the key business processes (Lambert and Cooper, 2000):
• Customer relationship management: Identify key customers, service levels
required and profitability.
• Customer service management: Interface with production and distribution
operations to assist and inform customers.
• Demand management: Balance enterprise-wide supply and demand through
determining what and when customers order, perhaps even synchronizing supply and
demand.
• Order fulfillment: Achieve high order fill rates through seamless integration of
manufacturing, distribution, and transportation plans.
18
• Manufacturing flow management: Pull-based manufacturing with continuous
reduction in cycle times and lot sizes.
• Procurement: Strategic plans developed with suppliers to support manufacturing
flow management and new product development. Suppliers can be segmented and then
appropriate relationships can be determined based on key characteristics. Rapid
communication can be developed freeing buyers to work on relationships rather than
executing orders.
• Product development: Integrate customers and suppliers into the process to reduce
cycle time. Coordinate with customer relationship management, select materials and
suppliers in conjunction with purchasing, and develop production technology that integrates
with manufacturing flow.
• Returns / reverse logistics: It can be a competitive advantage or environmental
requirement. It may be considered a more holistic view of logistics in that fewer materials
flow back, reuse of material is possible and recycling is facilitated.
2.2.1.3. Supply Chain Management Components
SCM components are the issues that are important for the management of supply
chains and they are the answers for the question; “What level of management and
collaboration should be applied for each process link?” Below are the types of links / levels
of collaboration and the areas of management that must be addressed when managing supply
chains (Lambert and Cooper, 2000):
• Types of links / level of collaboration: Different levels of collaboration are called
for in different situations.
− Managed process links: Those considered most important, often with tier one
customers and suppliers. May learn of important processes through monitoring
links (e.g., multiple tier one suppliers all ordering from same tier two supplier).
− Monitored process links: While important, do not merit full resources, so they
are simply monitored and often are between two other tiers.
− Not-managed process links: Products / services do not warrant resources to
manage or monitor (e.g., box supplier's upstream suppliers).

19
− Non-member process links: Links from member of one chain to another chain
(e.g., common supplier to competitor).
• Components of management critical to SCM: Based on literature review the
following components were identified:
− Planning and control: Joint planning between chain members and establishing
key performance metrics.
− Work structure: How a firm performs its tasks and activities. This will affect
the level of collaboration across the chain.
− Organization structure: Whether or not firms engage in joint problem solving
through tools such as cross-functional teams.
− Product flow facility structure: Refers to the network of firms throughout the
chain. May involve decisions on where inventory is best stored in chain.
− Information flow facility structure: The kind of information passed and
frequency of updating are key elements.
− Management methods: Includes cultural and leadership issues. More difficult to
mesh firms of different cultures (e.g., top-down with bottom-up).
− Power and leadership structure: Presence of power brokers within the chain
will affect relationships and attitudes toward collaboration.
− Risk and reward structure: Level of sharing across chain affects long-term
commitments.
− Culture and attitude: Meshing cultures cannot be underestimated; may include
how employees are valued and the degree of empowerment.
The manner in which the numerous elements of supply chains are managed, especially
those that involve behavioral rather than technical items, will always be tricky and always
involve choices. Cox (1999) addresses this point: “There are clearly a variety of power
configurations within different types of supply chains and these configurations occur for a
variety of reasons. The conclusion that must be drawn from this is, therefore, that there
cannot be any one single approach to SCM that is appropriate in all circumstances.”

20
The way in which a firm should approach the challenge of collaboration across the
extended enterprise often starts with a solid understanding of customer requirements, around
which the elements of a supply chain can be aligned. “Segmenting customers by competitive
need or products by demand characteristics is a critical step in enabling a firm to focus
strategic resources on customers’ value. A review of core competencies leads to strategic
outsourcing decisions in which a firm claims its part of the value chain” (Lambert and
Cooper, 2000).
2.2.2. Bridges to Effective Supply Chain Collaboration
As noted before, the potential benefits of effective SCM implementation are quite
impressive. At the same time, the barriers to effective SCM implementation are
considerable. Thus, the decision to move forward with a strategic SCM initiative depends on
whether managers believe that they can put in place mechanisms, or bridges that will
overcome the barriers and help the organization achieve the promised benefits.
2.2.2.1. Communication as a Bridge
“Frequent and regular communication” and “a willingness to share information” are
seen as very effective facilitators by the companies. Thus, a fairly strong consensus says that
better communication is the foundation for SCM. Communication among supply chain
members ensures that products and services make their way to customers efficiently and
effectively. Frequent communication contributes to faster problem resolution, trust, and
relationship building as well as quicker decision-making that results from having access to
up-to-date information. Moreover, a willingness to share information enhances the quality
and relevance of the information that is shared. For example, sharing actual customer order
information combined with rolling forecasts provides an opportunity to improve supply
chain decision-making. Likewise, a willingness to share future product strategies and
technology plans allows more collaboration and integration than simply sharing forecasting
data. If two or more supply chain partners cannot or will not communicate, advanced SCC is
impossible. The two technology mechanisms - “the use of electronic linkages such as EDI”
and “the use of Enterprise Resource Planning (ERP)/SCM software” - are important for

21
information sharing. Since “inadequate information systems” were seen as a barrier to
collaboration, information technology systems can be seen effective at facilitating SCC
(Simchi-Levi et al., 2000).
The other communication items are “sharing technical expertise with suppliers,”
“senior level managerial interaction,” and “sharing technical expertise with customers.” The
notion that expertise is increasingly shared among supply chain members implies certain
openness and trust is emerging, at least among “key” members of the supply chain team.
Experience suggests that this expertise is often shared via training, collaborative teams, and
process development efforts (Simchi-Levi et al., 2000).
2.2.2.2. Alliance Management as a Bridge
A second implementation strategy seems to center on strengthening relationships
within a rationalized supply chain. The first step in this process is to simplify the supply
chain network. This is done upstream through supply base rationalization and downstream
through customer selectivity. The sheer number of players involved in most traditional
supply chains makes collaborative SCM not just complex but also next to impossible. To
reduce the complexity and enhance the organization’s ability to more effectively manage the
supply chain, as a cohesive team requires a reduction in the total number of supply chain
participants. It further requires that supplier and customer relationships be evaluated and
classified, usually through some form of ABC classification. Close relationships are then
formed with a very outstanding group of supply chain partners - the most important of the
“A” suppliers and customers. “Few companies have the necessary resources to manage
alliance relationships without having first rationalized and classified the supply base.
Recognizing this, most organizations have undertaken rationalization initiatives” (Quinn,
1997).
Three additional alliance management tools and techniques are “clear partner selection
guidelines,” “a well-accepted approach to sharing risks and rewards,” and “clear guidelines
to manage supply chain alliances.” Ambiguity persists when it comes to determining whom
to work with on a collaborative, alliance basis. As mentioned before, most companies

22
struggle with the ability to share risks and rewards in a way that promotes trust and unity on
both sides of the relationship. Similarly, “shared risks & rewards” are seen as an important
bridge for collaboration. Self- interest and skepticism are hard to overcome and “the use of
guidelines to manage evolving alliance relationships” is recognized as an effective
facilitator. As difficult as it can be to define and enter into long-term partnerships, such
relationships can be even harder to cultivate on a continued basis (Simchi-Levi et al., 2000).
2.2.2.3. People Empowerment as a Bridge
Some studies have shown that investments in people provide twice the return of
investments in technology. Nonetheless, training and teaming have received some degree of
attention in the past few years. The “use of cross-functional teams” is one of the most
effective approaches to improving inter- firm collaboration. Cross-functional teaming
broadens horizons, creates understanding of opportunities and challenges, and facilitates
relationship building. Each of these outcomes reduces sub-unit loyalties and promotes the
coordination necessary to achieve SCC. Increased employee training in the SCM area is also
perceived to have a positive impact on a firm’s ability to achieve higher levels of
collaboration. The “use of inter-organizational supply chain teams” is also as important as
the “use of cross-functional teams.” Few organizations have achieved a degree of SCM
sophistication that allows the effective use of inter-organizational teams. As a collaboration
mechanism, both inter-organizational teams and the broader area of “people empowerment”
have not been fully explored - much work remains to be done before the average
organization can leverage its people as a bridge to greater SCC (Cox, 1999).
2.2.2.4. Alignment Mechanisms as a Bridge
While aligned mission statements, goals, and operating procedures are not a
prerequisite to SCC, they certainly reduce inter-organizational conflict and help get the
various members of a supply chain team pulling in the same direction. So, the
“establishment of common goals” is seen as a highly effective facilitator. It is usually best to
work closely with other organizations that are working toward similar objectives. The
compatibility of goals can be assessed based on past experience as well as in the negotiation
process. Without some common buy- in on the basic goals underlying the supply chain

23
relationship, seeking greater collaboration and integration would be somewhat early (Quinn,
1997).
Although common goals are viewed as beneficial, shared mission statements and
common operating procedures appear to be quite rare. Expecting independent organizations
to join a supply chain team and immediately adopt a shared mission statement is generally
unrealistic. Shared mission statements are viable only for supply chain teams that have
achieved a high degree of interdependence, maturity, and stability. As long as supply chain
members insist on “playing the field” by participating on multiple supply chains in the same
industry, shared mission statements are unlikely to be adopted. “Common operating
procedures are even less likely, especially for companies that have to keep a diverse group
of customers happy. Because each customer expects the supplier to do things according to
the customer’s book, suppliers’ efforts are fragmented. This fragmentation consistently
limited the feasibility of EDI in industries where a common standard was not adopted. It is
simply too costly to try to standardize operating procedures to meet the divergent standards
of a multitude of customers. If the momentum toward SCC continues, achieving greater
alignment should become easier. This is particularly true for industries where unified teams
emerge to compete against other global supply chains” (Quinn, 1997).
2.2.2.5. Performance Measurement as a Bridge
The strong influence of performance measurement on managerial decision-making
and human behavior has long been discussed. Supply chain oriented measures as well as
measures that promote alignment should greatly facilitate greater inter- firm collaboration.
However, most firms are experiencing difficulty in devising and implementing supply chain
measures. “Experience suggests that modifying performance measures can be a sticky
proposition, especially when the changes have dramatic impact on organization focus.
Certainly, this is part of the challenge in the case of adopting supply chain measures”
(Lapide, 1998).
Looking at the current facilitative role of both supply chain measures and the use of
consistent measures suggests that performance measurement is an overlooked arena where

24
dramatic progress could be achieved. “The key is to clearly identify and define measures
that not only provide an accurate picture of supply chain performance but also highlight
opportunities for improvement at both the individual firm and the overall supply chain
levels. Only then will companies have the confidence to modify long-standing measurement
systems” (Lapide, 1998).
A second dimension of measurement capability that has been identified as vital is “the
use of accurate costing systems.” Companies greatly rely on accurate costing to answer
critical questions regarding how value-added processes should be organized, whether or not
an investment in technology should be pursued, and who should perform what activities
within the firm and across the supply chain. In fact, a common complaint among managers
is that they simply do not have access to accurate costs. Two costing issues were explored:
the use of total cost analysis and the use of activity-based costing. Neither costing tool has
been widely used to facilitate collaboration (Groves and Valsamakis, 1998).
2.2.2.6. Process Change as a Bridge
Supply chains that fail to develop competitive processes can become irrelevant. This
possibility has led supply chain members to be more creative and flexible in defining who
does what in key value-added processes, especially in the areas of quality control, new
product development, vendor managed inventory, and co-manufacturing. For instance, in
the following examples, suppliers are more fully integrated into the buying organization’s
value-added processes (Pagh and Cooper, 1998):
• An emphasis on quality has led to supplier certification, shifting the responsibility
for quality to the supplier. Working together via the supplier certification process improves
quality at the source.
• A desire to shrink concept-to-market cycle times has led to the use of multi-
functional product development processes, which include managers from marketing,
research and development, manufacturing, purchasing, and logistics as well as
representatives from key suppliers.
• Some companies have placed the responsibility for managing inventory in the
supplier’s hands. Key suppliers locate their personnel at the buyer’s location to monitor

25
inventory levels, place orders, and handle all of the expediting and other issues involved in
assuring timely product arrival.
• Some companies are turning production responsibility over to the supplier, relying
on supplier personnel to assemble the buyer’s finished products.
The “implementation of cross-functional processes” is seen as an effective supply
chain enabler. As was the case with the use of cross-functional teams, integrated processes
bring the relevant players together to produce greater understanding and foster better
communication. More “touch time” helps mitigate the barriers that inhibit collaboration.
Also, it can be claimed that vendor-managed inventory (VMI) programs have a positive
impact on collaboration efforts. VMI programs can be used to effectively bridge the gaps
that separate members of the supply chain. However, they are far from universally
implemented. While not widespread in their use, process change initiatives are a relevant
and useful mechanism for achieving greater SCC (Pagh and Cooper, 1998).
Finally, the list of most effective bridges to supply chain collaboration is as follows:
• Frequent communication
• Open & honest information sharing
• Use of cross functional teams
• Shared expertise with suppliers
• Common goals
• Supply base reduction
• Senior management interaction
• Cross-experienced managers
• Cross-functional processes
• Shared expertise with customers
• Customer selectivity
• Use of supply chain measures
• Use of consistent measures
• EDI linkages

26
• Clear selection guidelines
• Vendor Managed Inventories (VMI)
• Use of total cost analysis
• Sharing risks & rewards
• Shared mission statement
• Clear alliance management guidelines
• Common operating procedures
• Use of ERP / SCM software
• Use of SC teams
• Supply chain education and training
2.2.3. A Framework for Supply Chain Collaboration
No comprehensive framework for designing and executing a supply chain strategy has
been discussed in the literature review. Managers rely either on narrowly targeted and
separated integration programs such as ERP, Collaborative Planning Forecasting and
Replenishment (CPFR), Vendor Managed Replenishment (VMR), supplier development,
etc. or on ad hoc approaches to achieving the conceptual ideal of creating seamless value-
added processes. Such approaches fail to provide the vision and the understanding that is
needed to really undertake the monumental task of building a collaborative supply chain
team. To help promote more systematic efforts to achieve competitive SCC, the six-stage
framework depicted in Figure 2.1 may be followed. This model has been developed by
International Trading Organization (ITO), which is an independent not-for-profit
organization, in 2001. ITO was established in 1998 by 11 voluntary companies and is open
to all companies interested in international trading applications and supply chain
management practices.
2.2.3.1. Stage 1: Develop an Overall Understanding of the Supply Chain
The first step in building a cohesive supply chain team is to create a visual image of a
company’s most important supply chain. This is done via supply chain mapping. Managers
need to know who the major players are in the supply chain and what role they play and

27
value they add. For relatively simple supply chains, every major organization that
participates in the chain can be shown in the map. For more complex supply chains, some
aggregation into types of players may be needed to make the mapping feasible. Once the
supply chain is mapped in some detail, several critical questions need to be asked:
• What is the overall value proposition of the supply chain? That is, what are the sets
of satisfactions delivered to the ultimate customer? Only when the overall value proposition
is clearly understood can managers effectively understand the vital value-added roles that
must be played for the supply chain to be successful. Further, if the day ever arrives when
supply chains truly compete against supply chains and company must choose which supply
chain team to belong to, it will be critical to be able to determine who best delivers on the
overall supply chain’s value proposition.
• What are the value propositions and critical success factors for each supply chain
level / player? As this knowledge is gained, managers begin to more clearly understand their
companies’ roles in the supply chain. They also begin to understand how they can better
meet customers’ needs as well as how they should evaluate and select important suppliers.
• Where are leverage and profitability located within the supply chain? To identify
key leverage points, at least three issues must be understood. First, what are the critical
technologies employed throughout the supply chain? Second, what do the most important
value-added processes look like up and down the supply chain? Third, what is each key
player’s linkage to the end customer? As these questions are answered, managers can
specifically define the “as- is” value-added roles of supply chain participants. They can also
begin to identify role-shifting opportunities and threats. At this point, managers can focus
on evaluating their company’s own competitive strategy.

28
Figure 2.1 SCC framework (International Trading Organization, 2001)
Develop Overall SC Understanding Map SC: Organizations, technologies, and capabilities Determine SC value proposition. Determine value proposition & success factors at each level. Determine where SC leverage & profitability are located. Identify critical value-added processes & technologies Evaluate linkage to end customer
Specifically define “As-is” value-added roles of SC members
Position Organization within SC Re-evaluate organization’s value proposition from SC perspective Identify the organization’s core competencies. Design & develop critical processes to support core competencies. Outsource non-critical activities Role-shift where appropriate; i.e., move to “To-be” roles
Build Customer Success InfrastructureClassify customers & measure profitability Establish appropriate customer relationships Implement SC partner development initiatives Build good relationships with important customers Establish mechanisms for transactional relationships
Build Supplier Success Infrastructure Classify suppliers - materials & service Establish appropriate supplier relationships Implement SC partner development initiatives Build good relationships wit h important suppliers Establish mechanisms for transactional relationships
Create & Communicate Common Vision Establish vision & mission statements, policies & procedures Promote internally & garner broad-based commitment Share externally with key SC partners Make available to entire SC Measure alignment among core “partners” Identify, communicate, and resolve critical gaps
Cultivate Integrative Mechanisms Consensus effort to identify internal & external barriers Prioritize specific initiatives to build key integrative mechanisms • Alignment mechanisms • Cross-functional processes • Cross-experienced managers • SC performance measurement • SC information sharing • Alliance management techniques
Constantly Re-evaluate - Scan & Plan Monitor market & competitive conditions Conduct periodic environmental & technology scans Periodically evaluate industry and SC structure Re-evaluate SC fit - beware of and be aware of role shifting Benchmark value-added: competitors, best in class & customers Establish continuous improvement programs

29
2.2.3.2. Stage 2: Position the Organization within the Supply Chain
Having mapped the supply chain, managers are prepared to re-evaluate their
organization’s value proposition from a supply chain perspective. Simply stated, is there a
good fit between the value the company promises to deliver and the value that is actually
required by the supply chain? If the fit is questionable, a serious evaluation of the
company’s participation in the supply cha in should be undertaken to answer the following
questions: Can the company really deliver on the required value proposition? Is the
company trying to participate in the wrong supply chain? Are there more appropriate supply
chains for the company to participate in? What does the company need to do to reposition
itself as a valued participant within the supply chain? Many of the dot-com companies that
have struggled to survive would have benefited from this type of self-evaluation. The
critical issue at this stage is to clearly identify and define the organization’s core
competencies that support the chosen value proposition. Likewise, the specific value-added
processes needed to support and expand the core competencies must be defined and
designed for maximum effectiveness. When this is done, outsourcing decision and role-
shifting strategies can be more accurately assessed.
2.2.3.3. Stage 3: Build the Supply Chain Infrastructure Needed for Success
Stage 3 really consists of two separate steps that should be considered together.
Building a customer success infrastructure is the first step. This is done by classifying
customers based on their relative importance to the company’s current and long-term
success. It is vital that managers recognize that their companies almost never have the
resources to be all things to all customers. Thus, the previous two stages are designed
specifically to help managers determine which customers it makes the most sense to serve
and satisfy, what products or services they require, and how much of the upstream
processing will be completed by the company and how much will be provided by suppliers
and service providers.
Aligning the company’s core competencies with its most important customers’ critical
success factors is vital to achieving meaningful supply chain collaboration. An important
warning arises from the experience of the past several years. In their quest to become

30
“suppliers of choice” and lock in customer loyalty, some companies have delivered
outstanding product / service packages at incredibly low prices only to find out later that
they were doing so at a loss. For this reason, it is important to measure customer
profitability. If a company has an outstanding value proposition and is operationally
excellent, it will be able to convince its customers to pay a fair and profitable price. Of
course, managers should consider the lifetime profit potential of customers as it performs
this analysis.
Appropriate relationships should then be established with specific customers. For the
most important customers, partnership development initiatives should be undertaken. CPFR,
VMI, co- located manufacturing, cooperative research and development, and joint problem
solving are all initiatives that should be considered. The goal is to leverage the knowledge
and resources of both companies to achieve higher levels of competitive success. For
important customers that do not merit such intensive attention and resource sharing, sound
and mutually beneficial relationships should be pursued. Managers should seek to establish
processes that enhance familiarity while delivering valued products and services. The goal is
to achieve high levels of satisfaction by meeting these companies’ most important needs.
Over time, some of these companies may emerge as leaders in their markets and become the
most sought-after and valued customers. Finally, most companies serve many customers
who are not viewed as terribly important. These are the infrequent customers whose
purchase volumes are too small to really even make the company’s radar screen.
Individually, these customers are often viewed as insignificant. As a group, however, they
can be quite profitable. Further, some of these so-called insignificant customers may at some
point in the future become important players in the industry. For these reasons, it is
important to establish the systems and policies needed to effectively and efficiently service
these transactional relationships. Delivering high levels of standardized service should be
the minimal target.
Building a supplier success infrastructure is the second step in establishing a
foundation for long-term supply chain success. The pattern is the same; classify suppliers
and establish appropriate relationships with them according to their importance. Critical
31
suppliers should be targeted for intensive relationships where resources are shared and true
synergies are sought. Important suppliers should be treated with respect and in a fair
manner. Managers need to avoid opportunistic behavior with valued suppliers, even if these
suppliers are not viewed as extremely important. New technologies or innovative processes
that radically change the power relationship may be developed. Good will and trust are key
ingredients in all but purely transactional buyer / supplier relationships. Finally, efficient
and fair systems and policies should be put in place to support the remaining transactional
buyer / supplier relationships. Learning to manage the range of relationships that must be
dealt with in any successful supply chain is a critical capability to develop.
2.2.3.4. Stage 4: Create and Communicate a Common Supply Chain Vision
If a supply chain is to compete as more than a loose coalition of companies, real
alignment must be established. Alignment begins with the creation of a common vision and
a shared mission. Most companies have vision or mission statements; unfortunately, many
of these statements consist of totally forgettable platitudes. Such vision and mission
statements do very little to guide or motivate collaborative behavior. Therefore, it is
important to make the company’s supply chain vision statement specific and unique to the
organization. To be effective, vision statements should directly influence the company’s
most important supply chain policies and procedures. A senior-level steering committee
should help develop the vision and promote it within the organization. Management and
employees at all levels should understand the supply chain vision and direction of the
company and understand what it means for them. Only then can they comfortably support
the supply chain strategy. After gathering internal support, the challenge is to share the
vision with key supply chain partners. Customer advisory boards and supplier councils can
be very helpful in this effort. Likewise, quarterly business reviews and special face-to-face
meetings can be used to share and promote the supply chain vision. Ultimately, the vision
should be widely publicized to the entire supply chain via the company’s web page or other
corporate communication. Once the vision is established and communicated, alignment
among supply chain partners must be measured. Partner scorecards offer a vehicle for
evaluating SCC. The final step in the process of getting all major supply chain partners on
the same page is to identify, communicate, discuss, and resolve alignment disparities.

32
2.2.3.5. Stage 5: Cultivate Integrative Mechanisms
The first four stages of the supply chain framework focus on the design of a
competitive supply chain. Stage five shifts the emphasis to managing for effective
collaboration. Stage five begins with an effort to identify internal and external barriers to
collaboration. Steering committees and advisory boards play a crucial and invaluable role in
this effort since a consensus is required. Once problem areas have been discovered and
opportunities for improvement defined, specific programs or initiatives must be prioritized.
Pilot projects can be carried out in any of the six collaborative areas; however, a balanced
approach should be pursued. The six core collaborative mechanisms are:
• Alignment mechanisms
• Cross-experienced managers
• SC information sharing
• Cross-functional processes
• SC performance measurement
• Alliance management techniques
Managers should take great care to select initiatives that can be successfully
implemented to create visibility, build momentum, and justify further investments. More
difficult initiatives can then be tackled.
2.2.3.6. Stage 6: Constantly Re-evaluate and Continuously Improve
To keep pace with a rapidly changing global marketplace where competition promises
to intensify from already fierce levels, supply chains must be dynamic and flexible. The
learning supply chain is the ideal and monitors market and competitive conditions
continually. To promote this attribute, it is vital to institutionalize periodic environmental,
technology, and industry scans. Benchmarking efforts should also be used to keep the
company at the cutting edge of supply chain practice. Serious benchmarking companies
compare themselves against leading competitors, best- in-class performers, and the needs of
demanding customers. Successful supply chain companies use the scanning and
benchmarking process to help managers (1) comprehend the constantly changing consumer

33
and supply environments, (2) recognize channe l alternatives, (3) assess a wide range of
tradeoffs, and (4) balance both the short-term and long-term requirements of the
organization. With the understanding that comes from these rigorous learning efforts,
companies can position themselves for success even as the supply chain in which they
compete evolves. They are also well positioned to avoid the threat of disintermediation
while leveraging opportunities to insinuate themselves more fully into the chain’s critical
value-added processes.
Equal in importance to the scanning / benchmarking effort is the need to put in place
continuous improvement initiatives. For any improvement effort to be effective, it must set
free the creativity and knowledge of the people involved in creating value. A clear theme is
that too many companies have essentially silenced one of their greatest sources of
competitive advantage: their people. That is, people at all levels no longer really believe that
they can make a difference in the way their companies operate (this desire to be creative and
have an impact has led many young managers to abandon their companies to join
entrepreneurial start ups in the past several years). Traditional suggestion boxes are not
adequate. More creativity, passion, and accountability are needed. Favorite project type
programs that allow managers to pursue their own special interests, enlisting their
colleagues for assistance and expertise are a step in the right direction. Ultimately, everyone
must be involved and accounted for in the quest for innovation. This effort must be done
through formalized (but not rigid) continuous improvement initiatives.
To summarize, the collaborative supply chain framework emphasizes supply-chain
level planning and constant scanning. Planning begins with mapping, continues with
positioning, and culminates with communicating the vision and the direction. Planning
creates understanding, gets everyone on the same page, and directs resource utilization in a
way that reduces threats and capitalizes on opportunities. Scanning identifies the barriers
and the opportunities for improved collaboration. Scanning likewise is vital for supply chain
managers to understand evolving competitive, industry, and market environments. In short,
companies must plan and scan in order to continuously select and build the right competitive
capabilities and establish the most creative and productive relationships. This endeavor is

34
the essence of strategy, and strategic SCM can help an organization survive and prosper in
an ever-changing world.
2.3. What Are The Challenges Encountered For The Implementation of Supply Chain Collaboration?
The potential benefits of SCM appear to be substantive and compelling. It is quite easy
to see why a company may want to pursue SCM to gain even a portion of these benefits.
However, because collaboration requires a new way of thinking accompanied by the
establishment of new practices and programs, realizing these benefits is not easy or without
cost. The goal many firms are striving for - satisfied customers through lean, efficient, and
responsive supply chains - could be accomplished only through overcoming the challenges
that hinder enhanced collaboration and more integrated decision-making (Ellinger, 2000).
2.3.1. Barriers to Effective Supply Chain Collaboration
According to the literature, the most important barriers can be listed as follows:
• Inadequate information systems
• Lack of clear alliance guidelines
• Inconsistent operating goals
• Lack of shared risks & rewards
• Poorly costed processes
• Non-aligned measures
• Lack of willingness to share information
• Organizational boundaries
• Poor alliance management practices
• Difficulty of measuring the contribution of SC members
• Lack of employee passion & empowerment
• Constrained resources for SCM

35
• Organizational culture & structure
• Lack of channel trust
• Lack of executive commitment
• Unwillingness to collaborate
• Resistance to change
Among these barriers, the literature has revealed mainly three types of barriers:
technology deficiencies, relationship challenges, and alignment barriers.
2.3.1.1. Technology Barriers
An important barrier to greater SCC and cooperation is the lack of adequate
information systems. Inadequate information systems support is a critical barrier since
collaboration is essentially information dependent. It is simply impossible to coordinate
value-added activities across functional and organizational boundaries without shared
information regarding product designs, order status, shipping notices, delivery schedules,
and inventory levels among other operating and transaction-oriented variables. Moreover,
the ability to communicate and the availability of accurate, timely, and relevant information
are vital to supply chain efforts to reduce inventory, improve asset productivity, and enhance
customer service (Ellinger, 2000).
Inadequate information systems present a double dilemma. First, the complexity of
managing complicated supply chain networks requires the collection and analysis of
tremendous amounts of data. Advances in computer technology have led to much greater
use of data warehouses that collect and store vast quantities of data touching on everything
from supplier performance to product flow through statistics in retail outlets. Unfortunately
collecting data is a much simpler task than analyzing it correctly and disseminating it to the
people who will use it to make decisions. Second, data only become valuable information
when it is in the hands of the people who need it and know how to use it. If all of
participants in a supply chain arrangement do not have ready access to vital information,
opportunities cannot be evaluated and tradeoffs cannot be analyzed. As a result, the full
benefits of SCC will not be realized (Lee and Whang, 1998).

36
Systems incompatibility is a major problem in this area. After decades of developing
in-house proprietary systems for a variety of functional areas, it is quite common for the
different systems to be unable to communicate with each other. The same challenge occurs
when information is shared across company boundaries. Disparate information systems
require the writing of complex translation code, complicating the task of providing access.
ERP software was supposed to overcome this challenge, but many ERP implementations
have been forced by the same problems they were supposed to solve - namely getting
separate information systems to share data. Supply chain information requirements dictate
that extensive databases must be combined with open-systems data exchange in order to link
planning systems from separate companies. When links in the “information chain” are
broken or missing, extra inventory or time must be built into the system to compensate for
the added variance. Information systems help bridge the gaps in collaborative supply chains,
creating the building blocks for collaboration and, ultimately, trust-based relationships
(Ellinger, 2000).
2.3.1.2. Relationship Barriers
Focusing on relational issues, it is evident that shifting from a transactional and often a
win- lose relationship is a significant challenge. Alliance relationships are not easy to
establish and require not only a change in philosophy but also a change in practice.
Guidelines are needed to determine (1) which relationships merit partnership status, (2) the
intensity of specific relationships, (3) how key resources like intellectual property are to be
developed, shared, and protected, and (4) when an alliance should be modified or even
terminated. Proven guidelines would take a lot of the guesswork out of alliance
management. It is difficult to establish relationships based on shared risks and rewards.
Most companies, especially those with market power, find it difficult to share the economic
benefits of alliance relationships. Despite this fact, dominant supply chain members
demonstrate a desire to spread the risks of uncertainty with alliance partners. Sharing risks
appears to be a much more attractive proposition than sharing rewards. Moreover, even
when the decision has been made to share risks and rewards equally, identifying and
quantifying them can be extremely difficult. Another important relationship barrier is the

37
lack of willingness to share information. Like sharing risks and rewards, the unwillingness
to share information is a barrier that arises from long-standing tensions that exist among
channel members. A lack of trust makes it difficult to share sensitive information. Many
managers simply do not feel that they can afford to share proprietary information.
Unfortunately, without open information sharing, strategic and tactical supply chain
decisions are certain to be sub-optimized and future collaboration efforts jeopardized
(Groves and Valsamakis, 1998).
2.3.1.3. Alignment Barriers
Returning to alignment issues, inconsistent goals and poor measurement practices
appear to be substantial barriers to successful SCC. Divergent goals lead managers to make
self- interested decisions that are frequently in opposition to those made by other supply
chain members. Collaboration is therefore impeded. Only when the various members of a
supply chain are “pulling in the same direction” or working toward common goals can
competitive product / service offerings be developed and managed for long-term success.
Closely related is the fact that as an organization pursues different projects based on its own
priorities, its supply chain partners are likely to become frustrated. In this scenario,
mismatched goals will lead one or more members of the supply chain team to view the other
members as only partially committed to the “team.” Simply stated, the different value
structures make collaboration difficult as each firm may struggle with valuing strategic
directions and goals that are different from their own (Salcedo and Grackin, 2000).
Measurement barriers create challenges both in the design and the day-to-day
management of supply chains. If a company cannot accurately cost a process, identifying the
best supply chain partners is a challenge. It is likewise difficult to define, and therefore to
share, cost savings. Further, without accurate costing, managers cannot effectively set
correct priorities for continuous improvement projects. A final related issue targets the idea
of functional shiftability, which involves the shifting of roles and responsibilities to the
supply chain member best positioned to perform them. Accurate costing is critical to making
these “role-shifting” decisions. For example, if an upstream firm is asked to carry more
inventories to facilitate faster chain-wide response times, how is the impact of this move to

38
be evaluated? How “valuable” is the move? Does it drive additional sales? How much extra
cost and risk is incurred? (Lee and Whang, 1998)
Without accurate costing, these questions cannot be answered and designing a
competitive supply chain is impossible. Non-aligned performance measures are also
substantial barriers for SCC. Poorly aligned measures have the same counter productive
impact as inconsistent goals, that is, managers modify their behavior in an effort to
maximize performance in the area that is being measured. Non-aligned measures thus lead
to conflicting decision making. Once again, different members of the supply chain team find
themselves pulling in divergent directions. Similarly, when a supplier is operating under one
set of measures while a customer is using another set of measures, it is almost guaranteed
that performance gaps will emerge. The typical result is channel conflict and perhaps even
the dissolution of the relationship. Poorly aligned measures can also lead to customer
dissatisfaction even when the supplier is dedicating tremendous resources to meeting the
customer’s needs. Unfortunately, the disparate measures lead the supplier to emphasize
performance that the customer really does not value. Under this scenario, a company can
invest every bit as much effort into achieving mediocrity as it would to become a supplier of
choice. The key is to know what is truly valued and then put the right measure in place (Lee
and Whang, 1998).
Lack of a systematic approach to measure customer requirements can also be seen as a
barrier to collaboration. If a company does not possess accurate customer information, it
cannot align its value-added processes to customer desires. Guessing at customer needs is a
very ineffective approach to becoming a supplier of choice and building a close long-term
relationship. Superior supply chain design decisions rely on knowing what customers truly
value. The final measurement issue is the difficulty in evaluating the contribution of each
supply chain member. A fundamental SCM proposition is that companies seek to work with
the best customers, suppliers, and service providers possible. This means that companies
must be able to evaluate the value-added contribution and capabilities of potential “team
members.” As supply chain practices mature, this issue will likely take on a greater role in
supply chain design and management (Lambert et al., 1998).

39
3. SUPPLY CHAIN COLLABORATION STRUCTURE IN TEXTILE INDUSTRY IN TURKEY: A CASE STUDY
This chapter introduces an industry-focused study involving both questionnaires and
interviews to investigate a collaborative approach in the textile dyeing and finishing industry
in Turkey. Considering that all textiles, fabrics, yarns, apparels, etc. are finished and/or
dyed, the role and importance of textile dyeing and finishing industry may be better
perceived for the textile industry in Turkey. Figure 3.1 shows the apparel manufacturing
supply chain and the position of dyeing and finishing in this chain. In this chain, 3T takes its
place as a for-profit company founded by 6 technology supplying and 10 dyeing & finishing
companies, each having 1/16 share of 3T. 3T develops and implements automation solutions
to its 10 partner dyers as well as other dyers in Turkey by utilizing the technology its 6
supplier partners as well as other suppliers, when needed.
3T supplies
automation infrastructure
Figure 3.1 Position of dyeing and finishing industry in textile chain (Tobler-Rohr, 2001)

40
In what follows is a brief overview of Turkish textile and apparel industry. Then,
information about 3T and the methodology of the research will follow. The findings and the
performance metrics of 3T and its partners (shareholders) will be presented in the following
chapters.
3.1. Turkish Textile and Apparel Industry
The textile and apparel sector has been the backbone of the Turkish economy with a
vital role to play in the industrialization process and market orientation of the economy in
the last two decades. In the 1980s, it was the leading sector related to the global economy
and the export revenues of this hard currency earning sector contributed substantially to the
overall economy. The textile sector continued to be one of the major contributors to the
Turkish economy, being one of the fastest growing sectors in the 1990s with an average
12.2% annual growth, while the Turkish economy had an average growth of 5.2% per year.
Total investment in the sector exceeded 150 billion USD, of which more than 50 billion
USD was invested in the last 5-10 years (Foreign Economic Relations Board, 2002).
Textile industry started out in the 1960s in small workshops, rapidly developed and
transformed Turkey into a global competitor. The total number of firms in the sector,
dominated (95%) by the private sector, number around 44,000 and 1/4 of them are active
exporters. The apparel industry is constituted mainly (80%) of small and medium sized
firms whereas the technology-intensive textile production has been undertaken by large-
scale companies. Today, around 1/5 of Turkey’s 500 largest companies are involved in the
textiles and apparel sector. Low labor costs, a qualified workforce, relatively cheap raw
materials as well as a liberalized economic environment and export- led policies in the last
two decades have played an important role in the significant growth of the sector.
The amount of textile production was 260,000 tons in 1998 and the production volume
of apparel was estimated as 223,000 tons in 1999. The production value of the sector is over

41
20 billion USD. Employment in the sector was estimated to be about 4 million people in
2002 - 2.5 million employed directly and a further 1.5 million indirectly through the sub-
sectors - however, the official statistics reveal around 500,000 employees in the sector due
to unregistered labor force.
The apparel sector exports approximately 60% of its production. Capacity utilization
rates are approximately 75% especially among exporting manufacturers. 80% of the exports
of the apparel industry are made of cotton. Turkey produces around 900,000 tons of cotton
yarn and 450,000 tons of cotton fabric per year.
Turkey ranks also among the top ten global producers of wool cloth, carpets, synthetic
filament and fiber, polyester and polyamide filament. Recently manufacturers have invested
for increasing production capacity especially in polyester production. While Europe’s 3rd
largest polyester producer is a Turkish-US joint venture, Turkey’s synthetics production
mounts to 15% of Western Europe’s capacity.
The sector has great significance in terms of economic development with a share of:
• GNP above 10%
• Industrial production around 40%
• Manufacturing labor force around 30%
• Exports around 35%
The textile and apparel sector contributes over 20 billion USD to the Gross National
Product. The sector is mostly important for its export earnings; its share in the country’s
total exports has been between 33-39% since 1990.
Turkey is the 6th biggest raw cotton supplier, the 14th biggest textile supplier, and the
7th biggest apparel supplier of the global textile and apparel market. The major export
market for Turkish textile and apparel goods is the EU countries, which account for about
65% of total textile and apparel exports. Turkey ranks 2nd in apparel imports and 5th in

42
textile imports for the EU having an 11.6% and 8% share in the EU’s total textile and
apparel imports respectively as of 2000. After the EU, the USA is a big and impending
market. Turkey is the 19th apparel supplier and 10th textile supplier of USA with a 1.8% and
2.9% share, respectively.
Beside the EU and the US market, new markets are North African countries, namely,
Tunisia, Egypt, and Algeria; Middle East countries, namely, Syria, Israel, and Saudi Arabia;
Eastern European countries, namely, Romania, Bulgaria, Poland, and Hungary; and CIS
countries. The sector faces quotas only in the USA and Canada. The Russian Federation has
also been a big market for the Turkish textile and apparel sector until the financial crisis of
August 1998. It was the 3rd biggest market for apparel and 9th for textile products in 1997.
The sector’s exports to the country fell by 43% in 1998 and by 61% in 1999. Russia is still a
promising market for textile and apparel sectors with its high consumption potential that will
come out in the following years especially after developments towards better integration to
the world economy and World Trade Organization (WTO) membership prospects.
Textile and apparel exports increased by 14.6% on average per year during 1980-
2000. Especially until the second half of 1990s, the sector’s exports increased at a rate above
the increase in total exports of Turkey as well as the increase in global textile and apparel
exports. In 2001, the sector’s exports totaled 10.4 billion USD, having a share of 33.3% of
the total exports. Exports raised 10.7% in quantity in 2001, though rise in terms of value
leveled at around 2.9% compared to 2000. The increasing share of apparels in exports since
1986 signifies the efforts to produce more value-added products.
The sector imports some raw materials, semi-processed goods, and finished products
mainly from Italy, Germany, USA, South Korea, and China. In the year 2001, imports of
textiles decreased 17.2% in terms of quantity and the fall in the total value of imports
leveled at around 14.5% to 2.95 billion USD when compared to 2000.
The industry is also attractive for foreign investors who have already invested in 265
firms, 61 of which are in the textile and 204 in the apparel industry as of end of April 2002.

43
17 of the 61 foreign partnerships in the textile sector are with German firms, 5 are with
British firms and 5 are with American firms. 52 of the 204 foreign partnerships in the
apparel sector are with German firms, 23 are with British firms, 22 are with Dutch firms, 17
are with Italian firms, and 14 are with Swiss firms.
55 foreign direct investment allowances were issued in the year 2001, which entailed a
total of 37.3 million USD of foreign capital entry into the textile and apparel industry. Joint
ventures are increasing due to local manufacturers’ interest in establishing licensing and
technology agreements with global competitors in order to enhance their competitiveness in
the international market.
World textile trade will be subject to WTO rules and regulations as a whole after the
removal of quotas at the beginning of 2005. Turkey has the prospects of being a global
production and export hub due to following factors:
• Relative self-sufficiency in raw material output
• Powerful textile infrastructure
• Diversified product range
• High value-added products
• Just- in-time delivery
• Relatively low cost, flexible, and skilled blue-collar workforce
• Well-trained, qualified white-collar human resource
• Entrepreneur and easy-adopting nature of Turkish people
• Unique geographic location
• Neighboring markets with a 600 million population
• Customs Union with the EU
• A reliable trade partner of the EU
• Experience in crisis management
These factors, supported with modern infrastructure and liberal foreign exchange
regulations, have built a strong textile and apparel sector in Turkey. The products of the

44
Turkish textile and apparel sector have a good reputation in foreign markets as a result of
the availability of high quality cotton in Turkey, wide usage of CAD (Computer Aided
Design) and CAM (Computer Aided Manufacturing), and the increase in the number of
qualified personnel.
The sector is aware of the trend in international markets towards increasing demand
for healthier and more environmentally friendly products and tries to adapt itself to these
developments by legal and technical regulations. Nevertheless, it is hard to keep its
competitive position in the world market full of emerging players. Thus, manufacturers have
shifted their operations to value-added products and creation of brand names. Currently,
30% of Turkish manufacturers have their own designs and brands in international markets.
As current studies reveal, developed countries will have a decreasing share in global textile
production while the developing countries will increase their manufacturing capacity to
meet the increasing demands. It is also estimated that by 2005, the developing countries will
increase their self-sufficiency in textile production. The US with an estimate of 200%
increase in textile consumption is also estimated to have a 32% decrease in self-sufficiency
by the year 2005. These numbers are consequential for the manufacturers who will be
competing to acquire greater shares in the 75 billion USD worth US imports of textile and
apparel by 2001.
At this point, in order to produce high value-added products and to take a share from
this delicious pie, collaborative networks of enterprises in Turkey, such as 3T, have a crucial
role to enable those enterprises to respond to consumer demand more quickly, adapt to
market variations more efficiently, and evolve product designs with manufacturing practices
more seamlessly.
Turkey, with its adaptability to European standards and regulations related to
environment, health, quality, and safety is aiming to move into the production of more and
more value-added products, into an era in which the Turkish textile industry will be known
for its quality trade marks and will be pricing a product for the "Made in Turkey" sign.

45
3.2. Tekstil Terbiye Teknolojileri A.S. (3T)
Between 2000 and 2005, Turkish textile and apparel industry have to continue to rear
up in sales amount, but the increase in sales volume should slow down in the industry.
Turkish textile and apparel sector must produce and export high value-added, innovative and
original products instead of cheap products to save its competitive position especially after
the removal of quotas at the beginning of 2005.
The advantages of Turkish textile industry like its geographic position, low labor
costs, growth of high quality cotton, etc. may be annihilated in a short time, if immediate
and effective precautions are not taken. But those advantages are not sufficient in this high
competitive environment. In addition to these advantages, Turkey must also acquire the
competitive strengths like high quality, high technology, quick service, dynamic structure,
production flexibility, high productivity, high R&D accumulation, and innovative product
development talents.
It is very obvious that this industry cannot be pushed up by individual efforts. The
whole industry either will rise toge ther or will have troubles; hence there will be no
individual comforts. Since country image is as important as brand image in today’s business
world, four Turkish companies - Pisa Tekstil A.S., Ekoten Boya A.S., Eliar Elektronik A.S.
and Vega Makina A.S. - have felt responsible to undertake the mission of improving
Turkish dyeing and finishing industry. For this purpose, they have decided to take a
proactive position and make an industry-wide collaboration and they have founded 3T by
the end of 2000 with an interesting collaboration model that has never been applied at any
industry before.
3T has been trading in textile dyeing and finishing industry. The first aim of 3T is to
help the enterprises to increase the productivity and efficiency. 3T supplies integrated
automation systems to the textile dyers, in a perspective from feasibility studies to after sales
services. Among the most important problems of textile dyeing and finishing industry, the
investment problems take the first place. The long project lead times, insufficient trainings,

46
and unsatisfactory after sales services are the main problems that dyer companies always
complain about their investment projects. Removal of all these problems will let the
investments to be more effective, productive, and satisfying. Another problem that this
sector encounters during the investment projects is the communication incapability of the
automation system components of different suppliers. Unfortunately, an automation system
of a supplier generally cannot communicate with the automation systems of the other
suppliers. 3T has also been working to overcome this problem and offers complete
automation systems with its both hardware and software solutions. Thus, the integration of
the whole system is achieved even at the project phase.
Starting out from the idea that the textile dyers and finishers have to produce
innovative and high-tech products, it is concluded that the systems, which can allow
production flexibility, high productivity and efficiency, high technology and dynamic
structure must be implemented at dyeing and finishing facilities in Turkey. So, the mission
of 3T is to help the dyers, which possess this vision, with all its efforts and opportunities.
Moreover, when it is needed, 3T collaborates with other domestic or foreign suppliers other
than its partner suppliers to supply complete solutions and automation systems to its
customers (dyers).
In the projects, 3T firstly uses the products of its partner suppliers. However, for the
exact integration of the system, it also uses additional foreign and domestic resources for the
products that it cannot supply from its partner suppliers. In those additional resource usages,
3T always searches for the suppliers, which are cheap and also technically the best.
By the help of this new formation, 3T partner suppliers also force themselves to
produce better, more innovative products and enhance their R&D studies. Furthermore with
this synergy, the partner suppliers acquire the capability of improving new solutions for both
hardware and software requirements of the dyers and gain the capability of developing new
processes and methods for the productivity of dyeing and finishing companies.

47
The main operational goals of 3T were mentioned above. But, the fundamental aims of
3T are beyond these operational goals. 3T was actually founded:
• to promote the development of the Turkish textile dyeing and finishing industry, to
create an atmosphere of solidarity and collaboration among the members of the industry,
and to articulate the voice of the industry in the issues concerned;
• to push up textile dyeing and finishing industry in Turkey in order to compete with
foreign dyeing industries;
• to extend collaboration concept all over the textile dyeing and finishing industry in
Turkey;
• to give opinions, to make proposals and prompt responses to decisions, plans and
implementations concerning the industry;
• to follow the domestic and international developments of the industry, to organize
meetings among the partners, to promote the R&D and educational activities within the
sector;
• to arouse consciousness on the environmental issues concerning the industry and
be aware of the developments and take precautions;
• to produce high value-added, innovative, and high- tech products.
3T thinks that the road that goes to these purposes passes through the information and
technology sharing. Because of this, 3T exposes a collaboration model that is built on
technology development, technology intelligence, and technology diffusion basis. In order
to realize this sharing and diffusion, 3T meets with its partners regularly. In these meetings,
partner dyers share customer needs and fashion trends they have determined with other
partners and partner suppliers share their technological innovations and capabilities. Then,
3T matches these customer needs and fashion trends with the supplier capabilities and
develops new products / solutions by the help of suppliers to respond to these customer
needs.
3T has completed 17 projects since 2001 and has developed 6 new high-tech products
in those 17 projects. During the projects, 3T first makes the efficiency analysis of the
customer’s dyeing and finishing plant. Beginning with the raw material consumption

48
efficiency, 3T also investigates the hardware usage efficiency and process efficiency of the
customer. And finally, labor expenses and bottlenecks that hinder the efficiency of the
system are determined. Then with this information, 3T combines the necessary and
convenient system units according to the requirements of the customer. After the
investigation of the existing system, project proposal that includes the most economic
automation units of domestic and foreign suppliers is prepared. If the customer approves the
proposal, 3T starts the project execution. It inspects the related suppliers and manages the
project. Finding the best combination of automation elements is not the unique goal of 3T,
since it also aims to give support at the implementation and after sales phases. After the
implementation of the system, 3T presents a report to its customer that includes information
about savings and earnings of the new integrated system. The flow chart of the processes in
a typical project is given in Appendix A.
Currently, 3T has 16 partners (shareholders). The 6 partner suppliers for automation
systems with their locations and business areas are as follows:
• Eliar Elektronik A.S. (Istanbul) - Industrial automation (founder),
• Protek Tekstil A.S. (Istanbul) - Hardware / installation,
• Vega Makina Sanayi A.S. (Izmir) - Dyeing machines (founder),
• Ada Elektrik Sanayi Ltd. Sti. (Istanbul) - Electric panels,
• Iletisim Bilgisayar Yazilim A.S. (Bursa) - Software,
• Erka Mühendislik Ltd. Sti (Adana) - Heat isolation;
The remaining 10 partners (shareholders), which are dyeing and finishing companies,
are given below with their locations:
• Pisa Tekstil ve Boya A.S. (Istanbul) (founder),
• Yeni Tekstil A.S. (Istanbul),
• Tübas Tekstil A.S. (Çerkezköy),
• Temtas Tekstil A.S. (Çerkezköy),
• Ha-Teks Entegre Tekstil A.S. (Çerkezköy),
• Ekoten Boya A.S. (Izmir) (founder),
49
• May Tekstil A.S. (Manisa),
• Küçüker Tekstil A.S. (Denizli),
• Tan Tekstil A.S. (Denizli),
• Funibo Tekstil A.S. (Denizli).
As a trading company, 3T requests from its suppliers the minimum price they can
supply their products to any company in Turkey. However, 3T buys the products at a price,
which is 0.9 times of the minimum price that the suppliers declared. Then, 3T sells those
products to its partner dyers at the price that is 1.15 times of its purchasing price and sells to
other dyers at the price that is between 1.20 and 1.50 times of its purchasing price according
to the competitive strength of the dyers.
3.3. Research Methodology
A questionnaire is the most cost-effective methodology for gathering substantial
quantities of data from a large number of companies. A questionnaire also provides an
opportunity to obtain broad-based, generalizable findings. So, two questionnaires were
prepared and conducted for this study. One of them was for textile dyers including both the
partner dyers of 3T and the other dyers; the other one was for the partner suppliers of 3T.
3.3.1. Questionnaire for Dyers
A six-page instrument consisting of 26 questions with 191 data items was developed
for the textile dyers in Turkey (see Appendix B). In this questionnaire there are 22 questions
for 3T partner dyers and 15 questions for other dyers. 11 of the questions are common for all
dyers. The questionnaires were conducted to 70 dyers and they were sent and received via
fax and e-mail. All questionnaires were originally addressed to the general manager of the
company or to the director of manufacturing and were mostly completed and returned by a
contact person holding a managerial position in the manufacturing area. To increase the

50
response rate, follow-up phone calls were also made. Totally 30 responses were received
from the dyers with the response rate of 42.8 %.
3.3.2. Questionnaire for Suppliers
A five-page questionnaire was prepared for 6 partner suppliers of 3T (see Appendix
C). These questionnaires were also sent and received via fax and e-mail. There are 18
questions with 131 data points in the questionnaire. The response rate of this questionnaire
is 100%.
51
4. QUESTIONNAIRE RESULTS
The results of the questionnaires conducted to the partner dyers and partner suppliers
of 3T were evaluated together, since it is important to understand the common insight of the
partners of 3T about the collaboration concept and its implementation. This will also be
convenient since the questions of supplier questionnaire are same with the questions of dyer
questionnaire and the number of partner suppliers is not sufficient for a statistical analysis.
In this chapter, information about the company profiles and general statistics about data will
be given. Then, the correlations between the questions will be interpreted and the
differences of partner and non-partner dyers will be given when they had significant
differences, otherwise no comment will be added to the discussion. Finally, the framework
proposed in Chapter 2 will be compared to 3T collaboration model.
4.1. Company Profiles
We analyzed company profiles on the basis of the number of employees and engineers
working in the company, total sales value, and R&D budget of the company in year 2002.
Figure 4.1 represents a group ing of the companies in the sample according to the
number of employees they employed. Almost half of the companies, 54%, have less than
300 full-time employees and the percentage of the companies with more than 1000
employees is 9.

52
14%
22%
18%23%
14%9%
Less than 150
Between 150 and 200
Between 201 and 300
Between 301 and 450
Between 451 and 1000More than 1000
Figure 4.1 Grouping of companies according to the number of employees
A grouping of the companies according to their total sales values in year 2002 is given
in Figure 4.2. It gives an idea about the size of the companies operating in this sector.
Nearly half of the companies have sales value less than 20 million USD while 16% of the
companies have total sales values more than 35 million USD in 2002.
26%
16%
37%
21% Less than 5 million USD
Between 5 and 20 million USD
Between 21 and 35 million USD
More than 35 million USD
Figure 4.2 Grouping of companies according to their total sales in 2002
Figure 4.3 shows another grouping of the companies according to R&D budgets of the
companies in year 2002. While 29% of the companies have R&D budget less than 50,000
USD and more than 100,000 USD, the percentage of the companies with R&D budgets
between 50,000 and 100,000 USD is 42.

53
29%
42%
29% Less than 50,000 USD
Between 50,000 and 100,000 USD
More than 100,000 USD
Figure 4.3 Grouping of companies according to R&D budgets in 2002
Table 4.1 represents the averages, maximum and minimum values of R&D budgets of
both the partner and other companies as a percentage of total sales values of the companies.
Table also shows the number of white-collar employees as a percentage of total employee
number and the number of engineers as a percentage of white-collar employees. As seen
from the table, while the average of the “R&D budget / sales” ratios is 1.59% for partners, it
is 3.65% for other companies. Since the maximum “R&D budget / sales” ratio among the
partner companies, 3.55%, is already less than the average of the same ratios of other
companies, it may be claimed that the partner companies have outsourced their R&D works
to 3T and its suppliers.
Table 4.1 Proportions about R&D budgets and number of employees
R&D Budget /
Total Sales White-collar /
Total employees Engineer /
White-collar
PARTNERS Average
Max Min
1.59% 3.55% 0.09%
20.9% 37.9% 5.9%
21.1% 25.9% 9.1%
OTHERS Average
Max Min
3.65% 6.67% 0.06%
19.9% 37.9% 4.5%
22.9% 65.7% 3.7%

54
4.2. General Statistics About Data
In this chapter, general statistics about the questions on the questionnaires will be
given. It will be convenient to give the statistical results of some questions for both the
partner and other companies separately in order to see the differences between their attitudes
towards collaboration, while the results of some other questions are given considering all
companies. Through this statistical analysis of the data, the entire lists about the results of
the questions will not be given, only the items that the participants see relatively more
important will be emphasized and presented.
4.2.1. Production Performance Targets
To interpret the relative importance of the production performance targets in the
industry, the questionnaires include a question consisting of 16 performance targets. The
answers of 30 dyeing companies were given using a 6-point Likert scale, where “1” means
“unimportant” and “5” means “extremely important.” “0” indicates that this performance
target was not applicable for that company.
Table 4.2 summarizes the percentage of “4 = very important” or “5 = extremely
important” answers as an indicator of the given importance to that performance target.
Entire list of production performance targets can be seen in Appendix B (Question 5).
Table 4.2 Percentage of “4” or “5” responses regarding given production targets
Production Performance Targets Percentage of “4” or “5”
Answers Decreasing the unit cost 96.8% Increasing the conformance to quality standards 96.7% Producing high value-added products 93.5% Decreasing the production time 93.5%

55
Almost all of the companies see the targets “decreasing the unit cost” and “increasing
the conformance to quality standards” as very important or extremely important. Another
important production performance target is “producing high value-added products” which is
also one of the most important targets of 3T. The answers reflect the current status of
Turkish dyeing and finishing industry perfectly. It shows that companies are somewhat
aware of their defective sides and it is this awareness, which might lead to the initiation of
industry wide improvement programs.
It is also requested from the companies to state three most important production
performance targets. Table 4.3 shows the number of firms that see the given production
performance targets among the most important 3 targets.
Table 4.3 Number of firms claiming a performance target among first 3
Production Performance Targets Number of Firms
Increasing the conformance to quality standards 18 Producing high value-added products 17 Decreasing the unit cost 12 Increasing the delivery reliability 9
4.2.2. Number of Companies Collaborated With
Another question in the questionnaire is about the number of partners that the
participant companies collaborate with. This question is addressed to 30 dyeing companies
in order to understand the level of tendency of the companies to collaboration. Figure 4.4
provides information about the number of partners of the participants. As seen, more than
half of them do not collaborate with any other company. Starting from this fact, it may be
claimed that collaboration is a very new concept for dyeing industry in Turkey.

56
56% 12%
32%Companies collaborating withmore than 5 companies
Companies collaborating with1-5 companies
Companies that do notcollaborate with any othercompany
Figure 4.4 Percentage of companies collaborating with the given numbers of companies
4.2.3. Benefits of Supply Chain Collaboration
In the questionnaire, one question attempts to capture how companies perceive the
benefits of supply chain collaboration. A given list of 15 benefits is evaluated by 30 dyeing
companies using a 5-point Likert scale, where “1 = unimportant” and “5 = extremely
important.” The ranking of the benefits according to the resulting percentages of “4” or “5”
answers can be seen in Table 4.4. The complete list of benefits can be seen in Appendix B
(Question 8).
Table 4.4 Percentage of “4” or “5” responses regarding given benefits
Benefits of SC Collaboration Percentage of “4” or “5”
Answers Increases the customer satisfaction 93.5% Increases the product quality 87.1% Increases the productivity 87.1%
As it can be observed, the most important benefits are “increasing customer
satisfaction,” “increasing product quality,” and “increasing productivity.” These expected
benefits exactly overlap with the targets of 3T collaboration architecture, since the most
important part of trading is the customer from now on. Quality and productivity also support

57
this claim, as they are also customer centric issues. This ranking does not change when we
only consider the answers of 3T partners.
4.2.4. Bridges to Supply Chain Collaboration
The questionnaires include a question about bridges to supply chain collaboration. The
evaluation of given the 12 bridges is made by 30 dyeing companies using 5-point Likert
scale, where again “1” means “unimportant” and “5” indicates extreme importance. Table
4.5 summarizes the most important bridges according to the percentage of given answers.
All of the bridges asked to the participants can be seen in Appendix B (Question 9).
As we observe, the most important bridges are “trust on the partners,” “willingness to
share information,” and “belief in the benefits of collaboration.”
Table 4.5 Percentage of “4” or “5” responses of all participants regarding given bridges
Bridges to SC Collaboration Percentage of “4” or “5”
Answers Trust on the partners 96.8% Willingness of partners to share information 93.5% Belief in the benefits of collaboration 93.5%
However, when the results are analyzed considering only 3T partners, the resulting
percentages of “4 = very important” and “5 = extremely important” answers are as shown in
Table 4.6. 89.5% of the partners see the “performance measurement system” as a very or
extremely important bridge for the achievement of supply chain collaboration. As this thesis
study aims to measure the performance of 3T collaboration system to determine the
improvement areas of the system, its findings will be an important asset for 3T and its
partners.

58
Table 4.6 Percentage of “4” or “5” responses of 3T partner dyers regarding given bridges
Bridges to SC Collaboration Percentage of “4” or “5”
Answers Trust on the partners 100.0% Willingness of partners to share information 94.7% Existence of performance measurement system to measure the partners 89.5%
4.2.5. Barriers to Supply Chain Collaboration
In order to understand the relative importance of the barriers that hinder effective
supply chain collaboration according to the participant companies, a question consisting of 9
barriers is included in the questionnaire. The answers were given by 30 dyeing companies
using a 5-point Likert scale, where “1 = unimportant” and “5 = extremely important.” Table
4.7 gives the ranking of the given barriers according to the percentage of given “4” or “5”
answers. Complete list of barriers to SCC can be found on Appendix B (Question 10).
As seen from the table, “reluctance to share information” and “lack of trust” appear as
the most important barriers on the road to collaboration. These answers are consistent with
the answers of the previous question, which is about the bridges to collaboration. However,
the following barriers in the average ranking, “lack of consistent collaboration performance
metrics” and “difficulty of calculation of the partner’s contribution to collaboration”, are not
the counterparts of the bridges in the average ranking of the previous question.
Table 4.7 Percentage of “4” or “5” responses regarding given barriers
Barriers to SC Collaboration Percentage of “4” or “5”
Answers Lack of confidence to the partners 96.8% Unwillingness to share information 96.8% Lack of consistent collaboration performance metrics 93.5% Difficulty of calculation of each partner’s contribution to the collaboration 90.3%

59
4.2.6. Reasons for Collaboration with 3T
In the questionnaires, a question about the reasons for collaboration with 3T is asked
to only 16 partners of 3T. The evaluation of given 7 reasons is made using a 5-point Likert
scale, where again “1” means “unimportant” and “5” indicates the extreme importance.
Table 4.8 shows the results of the 3T partner companies’ “4” or “5” responses regarding the
reasons of collaboration. All of the reasons presented to the participants can be seen in
Appendix B (Question 13).
“Necessity to compete with the foreign textile industries” is seen as the most
important reason for collaboration. This is actually very important for Turkish textile
industry since exporting quotas will be lifted at the beginning of 2005. Thus, Turkish dyeing
and finishing industry has to reach to the level at which it can compete with the foreign
textile industries. The road to this level certainly passes through the collaboration that leads
the companies to high productivity, high quality, high innovation, and responsiveness. Thus,
collaborative networks such as 3T are very crucial and necessary for Turkish textile industry
as well as for other industries.
Table 4.8 Percentage of “4” or “5” responses regarding given reasons
Reasons for SC Collaboration Percentage of “4” or “5”
Answers Necessity to compete with the foreign textile industries 83.3% Existence of a beneficial collaboration opportunity 75.0% Reception of a collaboration offer from the potential partners 75.0%
4.2.7. Performance Contribution of 3T to the Partners
Another question evaluates the performance contribution of 3T to its partners. The
answers were given by 16 partners using a 6-point Likert scale, where “1 = no contribution,”
“5 = very big contribution” and “0” means that participant has no idea about the concerned
contribution area. The percentages of the partners that gave “4” or “5” answers to this

60
question are presented in the Table 4.9. Complete list of the contribution areas can be seen
in Appendix B (Question 14).
Table 4.9 Percentage of “4” or “5” responses regarding performance contribution of 3T
Contribution Areas Percentage of “4” or “5”
Answers Launch of high quality products and services 66.7% Increase in productivity 58.3%
“Launch of high quality products and services” and “increase in productivity” appear
as the issues that 3T has the most contribution to its partners. This is an expected result due
to the establishment objectives of 3T, since it aims to let its partners to produce high quality
and value-added products by technology sharing and to increase the productivity of its
partners. But the percentages of the answers of this question are relatively lower with
respect to the percentages of previous questions. Percentage of 66.7% means that 3T has big
or very big contribution only 66.7% of its partners in producing high quality products and
services. The reason may be related to the small number of projects completed by 3T so far.
Figure 4.5 shows the percentage of “1 = no contribution” answers of the partners
regarding 4 contribution areas. These areas are “decrease in labor costs,” “increase in market
share,” “increase in sales,” and “decrease in material costs.” These are in the first four places
in the ranking of the percentage of “1” answers. Exactly half of the partners stated that 3T
has no contribution on decreasing labor costs and increasing the market share and sales of
the partners. Even according to more than half of the partners, 58.3%, there is no
contribution of 3T on decreasing the material costs.

61
58.3%
50.0%
50.0%
50.0%
0% 20% 40% 60% 80% 100%
Percentages of the partners
Decrease in materialcosts
Increase in sales
Increase in market share
Decrease in labor costs
Co
ntr
ibu
tio
n a
reas
Figure 4.5 Percentage of “1” responses regarding given performance contribution areas
4.2.8. Agreement Levels of Partners to the Statements Related with 3T
In the questionnaires, 16 3T partners were requested to indicate the extent to which
they agree with each of the statements related with their companies and 3T. The evaluation
of given 14 statements is made using a 5-point Likert scale, where “1” means “strongly
disagree,” “5” means “strongly agree” and “3” means “undecided.” Table 4.10 summarizes
the percentage of “4 = agree” or “5 = strongly agree” answers of the partners to the given 14
statements. All of the statements can be seen in Appendix B (Question 15).
Table 4.10 Percentage of “4” or “5” responses about statements about partners and 3T
Statements Percentage of “4” or “5”
Answers We struggle to determine the current and future needs of customers 91.7% We follow new technological developments 91.7% We share the requirements of the customers with our partners 83.3%
Since 3T was built on “technology and information sharing,” it is not surprising to see
these statements in top places in the ranking. It is also necessary to look at the percentages
of “1 = strongly disagree” and “2 = disagree” in order to see the statement that are not

62
agreed on. Table 4.11 shows the four highest percentages of “1” or “2” answers given to this
question. As it is seen from the table, the most disagreed statement is “the measurement of
customer satisfaction,” half of the partners indicated that they do not measure customer
satisfaction regularly and systematically. 33.3% of the partners stated that there are no
“consistent performance metrics” to measure the collaboration level of 3T.
Table 4.11 Percentage of “1=strongly disagree” and “2=disagree” answers of partners
Statements Percentage of “1” or “2”
Answers We measure customer satisfaction regularly and systematically 50.0% Adequate information exchange systems exist between partners 33.3% Consistent performance metrics are used to measure the collaboration level 33.3%
4.2.9. Participation Frequency of 3T Partners to 3T Meetings
3T partners were asked about how frequent they participate to the regular meetings of
3T that occur six times a year (see 16th question in Appendix B). 3T sees these meeting very
important for the success of the collaboration since partner dyers give information about
customer requirements while partner suppliers share their technological innovations in these
meetings. Technology and information sharing is the main infrastructure of this
collaboration model.
Figure 4.6 shows the percentages of 16 partners that participate to the meetings at
various frequencies. As seen from the figure, only a quarter of the partners attend all
meetings. Actually, the geographic locations of the partners have significant effect on this
fact, since the distances between some of the partners and 3T are relatively high in respect to
the distances of other partners. It is also observed that there is no partner that has never
participated to the meetings.

63
25.0%25.0%
33.3%
8.3%8.3%
0.0%0%
5%
10%
15%
20%
25%
30%
35%
Neverparticipate
Do notparticipate
most of them
Participaterarely
Participatefrequently
Participatemost of them
Participate all
Fre
qu
ency
Figure 4.6 Participation frequencies of the partners to 3T meetings
4.2.10. Discussion Levels of Partners About Executive, Commercial, and Technical Issues in 3T Meetings
The questionnaires also include a question about the issues that the partners speak out
their ideas and requests during the meeting of 3T. Participants were given three main issues,
executive, commercial, and technical issues, and were requested to indicate in which issues
they express their opinions and requests in the meetings (see Question 17 in Appendix B).
Figure 4.7 gives the results.
58.3%66.7% 66.7%
0%
20%
40%
60%
80%
100%
Percentage of partners
Executive issues Commercial issues Technical issues
Figure 4.7 Percentage of the partners that express ideas about three main issues

64
As seen from Figure 4.7, more than half of the partners state their ideas and requests
about all three issues. The percentages about the issues are close to each other. This is a
good situation for the effectiveness of the meetings since the majority of the partners discuss
these three main issues during the meetings.
4.2.11. Supplier Selection Strategies of the Partners
Another question in the questionnaires is about the relations between 3T partners and
their suppliers, about the process of supplier selection. The respondents were given four
supplier selection strategies and asked to choose the strategies that they have followed in
last 2 years and plan to follow in the next 2 years (see Question 20, in Appendix B). “Bid
evaluation” is the strategy for supplier selection in which the bids are evaluated only for that
single purchasing. “Technological capability” is another strategy in which the supplier
selection is done by considering only the technological capabilities of suppliers. “Common
value creation” is the establishment of a short-term relation with the supplier, which is built
on mutual benefits of the customer and the supplier. The last strategy, “strategic
collaboration,” is the establishment of a long-term relation with the supplier in a wide
context, which is based on common targets of the customer and the supplier.
Table 4.12 Percentage of the partners that choose four supplier selection strategies
Supplier Selection Strategy In Last 2 Years
In Next 2 Years
Bid evaluation 45% 20% Technological capability 27% 60% Common value creation 18% 20% Strategic collaboration 36% 90%
When the results given in Table 4.12 are examined, it can be easily seen that the bid
evaluation is the most widely used strategy in last two years among the partners. However,
the application of bid evaluation strategy seems to decrease in next two years. Supplier
selection according to technology capabilities of the suppliers is expected to be used more in

65
next two years. It seems that the importance of “collaboration” is well understood by the
partners of 3T. 90% percent of the partners stated that they would follow “strategic
collaboration” strategy in supplier selection process in next two years.
4.2.12. Comparison of 3T and Other Suppliers
In order to evaluate 3T’s performance in terms of technical experience, price, quality,
service, and financial support (credit terms, advance payment amount, etc.), the dyer
partners were asked to compare 3T with other suppliers with respect to these five criteria.
The answers were given using a 6-point Likert scale, where “1 = 3T is much better,” “3 =
equivalent” and “5 = other suppliers are much better.” “0” means that participant has no idea
about the concerned criterion (see question 22 in Appendix B). The average superiority
scores of the given criteria are presented in Table 4.13.
Table 4.13 Comparison of 3T and other suppliers: average superiority level
Criteria Average Superiority
Financial support 4.14
Price 2.38 Quality 2.25 Technical experience 2.00 Service 1.75
As it is seen from the table, the only criterion that the other suppliers are better than
3T is “financial support” with the average of 4.14. However, when we consider the criteria
below the double line on the table, 3T is better than the other suppliers. As we go down
through the table, superiority level of 3T increases in terms of the concerned criterion, since
“1” indicates that 3T is much better. Consequently, 3T is better than the other suppliers in 4
of 5 criteria.

66
4.2.13. Companies that Have or Do Not Have Information About 3T
In the questionnaires, 21 dyeing companies that are not the partner of 3T were asked
whether they had information about the activities and collaboration structure of 3T or not.
(Question 23 in Appendix B). As seen in the Figure 4.8, 62.5% of the companies stated that
they had information about 3T.
62%
38%Companies that do not have anyinformation about the activitiesof 3T
Companies that haveinformation about the activitiesof 3T
Figure 4.8 Percentage of companies that have or do not have information about 3T
4.2.14. Potential Performance Improvement Areas
The questionnaire includes a question to find out the thoughts of 21 dyeing companies
that are not a 3T partner about the potential performance improvement areas of 3T. This
question was only asked to 13 dyeing companies that gave “yes” answer in the previous
question, those that are aware of the activities of 3T. A 6-point Likert scale was used for the
answers, where “1 = no improvement,” “5 = very big improvement” and “0” means that
participant has no idea about the concerned improvement area. Table 4.14 shows the
potential improvement areas that has the highest percentages of “4” or “5” answers.
According to the table, “launching of high quality products and services” appears as
the area that 3T may provide the most improvement to the companies. Then come the areas
“decrease in process/product development time” and “decrease in process/product
development costs.” As seen, all these three issues are related with process and product

67
improvement, so these results are not surprising since 3T aims to install the innovation and
improvement vision to its partners and to enable its partners to produce high quality and
high value-added products.
Table 4.14 Percentage of “4” or “5” responses regarding given potential performance improvement areas
Improvement Areas Percentage of “4” or “5”
Answers Launch of high quality products and services 89.5% Decrease in process / product development time 84.2% Decrease in process / product development costs 78.9%
4.3. Correlations Between the Questions
Results of questionnaires yield data that are dependent on each other. The statistical
concept correlation is used to evaluate the relationship between numerical variables and to
measure the strength of association between them. Specifically, correlation analysis
determines if the two sets of values move in the same direction by the similar amounts.
In the correlation analysis, we have used SPSS software, which is a very useful and
extensive tool for statistical analysis. We have selected Pearson correlation coefficient (cc)
that takes on values between -1 and +1, ranging from being negatively correlated (-1) to
uncorrelated (0) to positively correlated (+1). The sign of the correlation coefficient (i.e.,
positive or negative) defines the direction of the relationship. The absolute value indicates
the strength of the correlation. In the analysis, 101 variables were considered. Table 4.15
gives information about the interpretation of correlation coefficients.

68
Table 4.15 Interpretation of correlation coefficients
Correlation Coefficient Value
Direction and Strength of Correlation
-1.0 Perfectly negative -0.8 Strongly negative -0.5 Moderately negative -0.2 Weakly negative 0.0 No association +0.2 Weakly positive +0.5 Moderately positive +0.8 Strongly positive +1.0 Perfectly positive
Table 4.16 shows the highly correlated pairs of the variables. The first highly
correlated pair is the number of the engineers working in the company and R&D budget of
the company with the correlation coefficient of 0.921. Since R&D works are mostly
undertaken by the engineers, there is a high correlation between these two variables. Also,
the companies that have relatively more engineers see “decreasing the product / process
development time” and “producing high value-added products” as important production
performance targets. Correlation coefficients of these two pairs are 0.889 and 0.903,
respectively. Since, short product / process development times and production of high value-
added products can be achieved by significant engineering efforts it is suitable for the
companies to have high number of engineers in order to reach these production performance
targets.
Companies that have high sales values desire to decrease the unit cost as a production
target. The correlation coefficient of this relation is 0.930. Since high sales value means high
production numbers, companies try to reduce unit production costs to achieve high profits
from the sales. They also give high importance to “decreasing the break-even point of the
products” and to “decreasing the unit production time.” Correlation coefficients between
these variables and the sales value are 0.915 and 0.903, respectively.

69
Table 4.16 Pairs of variables having a correlation coefficient greater than 0.8
Variable pairs cc # of engineers & R&D budget 0.921
# of engineers & Decreasing the product / process
development time (production target)
0.889
# of engineers & Producing high value-added products (production target) 0.903
Sales amount & Decreasing the unit cost (production target) 0.930
Sales amount & Decreasing the break-even point of the products (production target) 0.915
Sales amount & Decreasing the unit production time (production target) 0.903
Increasing the conformance to quality standards (production target) &
Launching of high quality products and services
(performance improvement area) 0.813
# of companies collaborated with & Trust on the partners (bridge) 0.975
# of companies collaborated with & Lack of confidence to partners (barrier) 0.982
# of companies collaborated with & Existence of performance
measurement systems to measure the partners (bridge)
0.822
Trust on the partners (bridge) & Lack of confidence to partners (barrier) 1.000
Existence of performance measurement systems to measure the partners (bridge) &
Consistent performance measures are used to measure the
collaboration level -0.809
Willingness to share information (bridge) & Participation frequency to the meetings of 3T 0.890
Willingness to share technical expertise with partners (bridge) & Participation frequency to the
meetings of 3T 0.856
Launching of high quality products and services (performance improvement area) & Quality (superiority of 3T) -0.925
Launching of high quality products and services (performance improvement area) & Technical experience
(superiority of 3T) -0.949
Participation frequency to 3T meetings & There exist an high level trust between the partners 0.982
Participation frequency to 3T meetings & We share the requirement
information of the customers with our partners
0.945
Level of trust between the partners & Average contribution of 3T to its partners 0.810
Level of information sharing between the partners & Average contribution of 3T to its
partners 0.989
Participation frequency to 3T meetings & Average contribution of 3T to its partners 0.887

70
Between the performance target “increasing the conformance to quality standards” and
3T’s performance improvement area “launching of high quality products and services,”
there is a strong correlation with a coefficient of 0.813. This shows that the companies that
desire to increase the quality level reach their targets by being a partner of 3T.
There are also interesting findings about the number of companies that the participants
collaborate with. According to the correlation analysis, companies that have relatively more
partners see “trust on the partners” as a significant bridge and “lack of confidence to
partners” as an important barrier to SCC. Correlation coefficients of these associations are
0.975 and 0.982, respectively. As it may be expected there is also a perfect correlation
between “trust on partners” and “lack of confidence to partners” with the coefficient of 1.0.
The other counter pair of bridges and barriers, “willingness of partners to share information”
and “unwillingness to share information” also have very strong correlations. Another fact
about the number of partners is that the companies with relatively more partners attach a
high importance to “existence of performance measurement system to measure partners” as
a bridge of collaboration which is one of the main aims of this study as mentioned before.
The correlation coefficient of this relation is 0.822. Those companies that see performance
measurement system as an important bridge for collaboration mostly state that there are not
consistent performance measures to measure the collaboration level of 3T. So, there is a
negative correlation between these two variables (–0.809).
Participants that give high importance to “willingness to share information with
partners” as a bridge to effective SCC also participate to the most of the regular meetings of
3T. These companies are able to comprehend the importance of the meetings for
information sharing and building trust among the partners. This fact is also valid for the
bridge of “willingness to share technical expertise with partners.” The correlation
coefficients between these two pairs are 0.890 and 0.856, respectively.
According to the results of the correlation analysis, as the performance contribution of
3T to its partners about “launching high quality products and services” increases, the

71
perceptions of the partners about the superiority level of 3T with respect to other suppliers in
terms of the quality and technical experience criteria increase. The correlation coefficients
between these variables are –0.925 and –0.949, respectively. The coefficients are negative
since “1” means “3T is much better” for concerned criteria while “5” means “very big
improvement” about concerned improvement area for the question of 3T’s performance
contribution.
The correlation analysis results also show that, as the frequency of the participation to
the meetings increases, the level of the trust and information sharing between companies
increase. While the coefficient of correlation between participation frequency to the
meetings and trust level among partners is 0.982, it is 0.945 between participation frequency
to the meetings and information sharing level.
Finally, in order to understand the effect of trust, information sharing and
communication on the performance of collaboration, an additional variable is used to keep
track of the average of the answers of each participant to the question about performance
contribution of 3T. Then, the correlation analysis was executed between this variable and
variables about level of trust, information sharing and communication. The coefficient of
correlation between the statement “there exist a high level of trust between the partners” and
average performance contribution of 3T is 0.810. This shows that as trust between partners
increases, performance of the collaboration also increases. The correlation between the
statement “we share the requirement information of the customers with our partners” and the
same additional variable is also very strong with a coefficient of 0.989. Lastly, according to
the analysis, the correlation coefficient is 0.887 for the average performance contribution of
3T and the participation frequency of the partners to the regular meetings. Consequently, all
these results show that as the trust, information sharing, and the communication between the
partners increase, the performance contribution of the collaborations to the partners also
increases.

72
4.4. Crosstab Analysis: Dissimilarities Between Partners of 3T and Other Companies
In order to explore the differences between the answers of the partners of 3T and other
participants, we have performed crosstab analysis using SPSS software. The crosstab
procedure produces several statistics that can be used to assess the existence of a
relationship between two variables. The most commonly used statistic is the chi-square test
of independence. In this study, for chi-square test, a new variable named “Partners/Others”
is defined that indicates whether the participant is a partner of 3T or not. This variable is
referred to as the control variable. Then, chi-square tests were performed between this
variable and all other variables to understand if the partners and the other companies differ
regarding the responses to the questions in the questionnaires. In the analysis, the safety
level α was taken as 0.05. Followings are the results of crosstab analysis that show the
dissimilarities of the partners and other companies.
One of the differences between the partners of 3T and other participants is the ratio of
the R&D budget to total sales in year 2002. As seen from the Table 4.17, the two-sided
asymptotic significance of the chi-square test for this pair is 0.018. Since it is less than 0.05;
it is safe to say that there is a significant difference between partners and other companies
about their “R&D budgets / total sales” ratio. From now on, we will not give these tables to
save space.
Table 4.17 Chi-square test output for “R&D budget / total sales”
This fact is also shown by the data in Table 4.18. As seen from the table, this ratio is
relatively high for other companies. We may conclude that while other companies allocate
more budget to R&D, the partner companies have transferred their R&D works to 3T and its
suppliers.

73
10.5% 5.3% 57.9% 26.3% 100.0%
8.3% 16.7% 41.7% 25.0% 8.3% 100.0%
9.7% 9.7% 16.1% 45.2% 19.4% 100.0%
% withinPartners / Others
% withinPartners / Others
% withinPartners / Others
Others
Partners
Total
0 - 0.5 R&D budget / Total sales (%)
Total
Table 4.18 Crosstab output for “R&D budget / total sales”
0.5 - 1 1 - 2 2 - 3.5 3.5 <
Table 4.18 Crosstab output for “R&D budget / total sales”
Since the competition in textile industry will increase in the world after the removal of
the quotas in year 2005, companies have to increase their productivity and produce high
value-added products to survive. In Table 4.19, “1” means that the participants see
“producing high value-added products” as an unimportant performance target, while “5”
means that they see that performance target “extremely important.” As seen from the table,
the partners of 3T seem to be aware of this fact, since 75.0% of them see “producing high
value-added products” as an extremely important production target. However, other
companies do not see this target as important as the partners do.
Table 4.19 Crosstab output for “producing high value-added products”
Another issue that the partners and other companies differ from each other is the
number of companies they collaborate with. Collaboration is a very new concept for textile
industry as it also is for other industries in Turkey. Collaboration requires high level of trust
and information sharing, but it is not very easy to build such a trustworthy atmosphere in

74
this business environment. So, companies reluctant to collaborate. Since 3T has 16 partners,
it is not very surprising that there is a significant difference about this variable between the
partners and other companies.
As seen from Table 4.20, 68.4% of the other companies do not collaborate with any
company, however 83.3% of the partners collaborate with more than 5 partners. This may
certainly be due to their partnership to 3T, but the most interesting fact is that 16.7% of the
partners stated that they collaborate with between 1 and 5 companies, although 3T has 16
partners. This means that they do not see all of the partners of 3T as their partners and it
may be a significant problem for the future of this collaboration model.
Table 4.20 Crosstab output for “number of companies collaborated with”
The other significant difference between the partners and the other companies is about
their manner about the performance measurement of the collaboration. As mentioned before,
the answers of the related question were given using a 5-point Likert scale, where again “1”
means “unimportant” and “5” indicates the extreme importance. Table 4.21 shows that
89.5% of the partners see the “performance measurement system” as a very important or
extremely important bridge for effective of SCC. Since the other companies do not have so
many partners to collaborate with, they do not attach so much importance to this bridge.
When it is considered that the partners of 3T have experience on collaboration, the
importance of the performance measurement system can be better perceived. Since one of
the major goals of this study is to measure the performance of 3T collaboration to determine

75
the improvement areas of the system, this study has a crucial role for the improvement of 3T
collaboration structure.
Table 4.21 Crosstab output for “existence of performance measurement system”
In parallel with this result, 84.2% of the partners see the “difficulty of calculation of
each partner’s contribution to the collaboration” as a very important or extremely important
barrier to SCC (see Table 4.22). So, it can be said that, it is very important to measure the
collaboration level of the system and the contribution level of the partners for the survival
and improvement of the collaboration.
Table 4.22 Crosstab output for “difficulty of calculation of each partner’s contribution to the collaboration”

76
4.5. Comparison of 3T Model and The Collaboration Framework Proposed by International Trading Organization
It will be convenient to look at the collaboration model of 3T regarding the
collaboration framework of ITO presented in Chapter 2 and compare them. We will first
examine them in general terms and then look through the stages of framework in detail. In
3T model, overall SC understanding seems to be developed and spread among the partners,
but self-evaluation of the system has not settled yet. Building of customer and supplier
success infrastructures could be achieved better, when the trust and information sharing
level increase among the partners. It is obvious that this will take time. As the development
of overall SC understanding, 3T has a common vision understood by its partners. However,
alignment mechanisms for the collaboration and the evaluation of the systems have not
fitted exactly yet. Consequently, it seems that 3T model fits with this framework except last
two stages. It will be convenient to make a more detailed comparison through the stages of
the framework.
When the first stage of the collaboration framework (developing an overall
understanding of the supply chain) is considered, it can be easily said that 3T collaboration
structure meets this stage, since what role the major players in the supply chain play and
what value they add are definite. Based on our questionnaire, we conclude that the partners
see the production of high value-added products as the most critical success factor for 3T
and second factor being the decreasing of unit costs.
The second stage of the framework is “positioning the organization within the supply
chain.” At this stage, companies must evaluate themselves and examine if there is a good fit
between the value they promise to create and the value that is actually required by the
supply chain. 4 companies have already decided to found 3T and make an industry-wide
collaboration in order to create and gain more value. But, evaluating the performance
contribution of all companies to the SCC is crucial, since performance evaluation improves
the systems. 3T has not done this evaluation until the time this study was being conducted.
That is why performance metrics are generated for the partners of 3T and measurement of

77
these metrics are done in this study. By this measurement, companies may observe and find
out what they need to do to reposition themselves as valued participants within the
collaboration.
Stage 3 is “building the supply chain infrastructure needed for success.” This stage
consists of two separate steps that should be considered together: Building both customer
and supplier success infrastructure. In building customer success infrastructure, companies
have to determine for which customers it makes the most sense to serve and satisfy, what
products or services they require, and how much of the upstream processing will be
completed by the company and how much will be provided by suppliers and service
providers. In the 3T model, these issues are shared among the partners in the meetings and
enforced by 3T itself as the leading company of this collaboration structure. At this step it is
also vital to align the partner’s core competencies with their most important customers’
critical success factors to achieve meaningful SCC. This is also done by 3T with the
concerned partner. In building supplier success infrastructure, companies must be in
collaboration with their suppliers to create new technologies and improve their innovative
processes. This is already one of the main objectives of 3T and this is tried to be provided by
various projects of 3T that are done with the partners. Furthermore, for a successful
collaboration with the suppliers, good will and trust are key ingredients in the relationships.
The questionnaire results indicate that these factors are also seen as important factors among
the partners of 3T.
The fourth stage of the SCC framework is “creating and communicating a common
supply chain vision.” Vision and mission statements consisting of forgettable platitudes are
not effective to guide and motivate companies for collaboration. Therefore, vision
statements should directly influence the company’s most important supply chain policies
and procedures and should be shared with supply chain partners. This may be done by face-
to-face meetings or via the company’s web page or other corporate communication. 3T
actually has well defined and clear mission and vision statements. These statements are
discussed by the partners at the regular meetings of 3T and published on the web page of
3T. In the questionnaires, partners are asked to indicate the extent to which they agree with

78
some statements including “there are shared mission and vision statements of 3T” and “clear
guidelines and procedures are used for collaboration” statements. As mentioned before, the
answers are given using a 5-point Likert scale, where “1” means “strongly disagree,” “5”
means “strongly agree” and “3” means “undecided” and the averages of the answers given
to these two statements are 3.92 and 3.83, respectively. This means partners also agree that
3T has shared mission and vision statements of 3T and there are clear guidelines and
procedures for collaboration.
The first four stages of the supply chain framework were about the design of a
competitive supply chain. The fifth stage, “cultivating integrative mechanisms,” is directly
about the management of effective SCC. This stage begins with the identification of internal
and external barriers to collaboration. Based on the questionnaire results, it can be
concluded that unwillingness to share information and lack of confidence among the
partners are the most important barriers to effective collaboration for the partners. At this
stage, companies should carry out projects in the following collaborative areas: Alignment
mechanisms, cross-experienced managers, SC information sharing, cross-functional
processes, SC performance measurement, and alliance management techniques. Even
though this study is about performance measurement, it cannot be said that 3T has an exact
project about any of other collaboration mechanisms.
The last stage of the framework is “constantly re-evaluation and continuously
improvement” stage. Companies should evaluate and improve their supply chain by
constantly benchmarking their performance. They should compare themselves against
leading competitors, best- in-class performers, and customer needs. At this point, 3T did not
have much chance to pursue benchmarking efforts since the collaboration is a new and
improving concept and there are not so many examples similar to the collaboration model of
3T. But as every system, 3T collaboration structure needs to be improved continuously. For
any improvement effort to be effective, every player of the supply chain must be involved in
and accounted for improvement. Thus, 3T should try to motivate its partners to join into
evaluation process that is lacking at the moment.

79
5. PERFORMANCE EVALUATION
To answer the question “How are we doing?” most companies look inward and apply
any number of functionally oriented measures. But excellent supply chain managers take a
broader view, adopting measures that apply to every link in the supply chain and include
both service and financial metrics. Performance measurement is very important for the
success of partnerships since it keeps partners working toward the same goals by building
deep understanding of what each company brings to the partnership and showing how to
leverage their complementary assets and skills to the alliance’s greatest advantage. Thus,
during this study, in order to measure the performance of 3T collaboration structure, some
performance metrics are identified for 3T itself, its partner suppliers, and its partner dyers.
Then to make the measurements of these metrics, relevant data are collected from 3T, its
partner suppliers, its partner dyers, and the other dyers that worked with 3T.
5.1. Performance Metrics for 3T
In order to evaluate the performance of 3T collaboration structure, some performance
metrics are determined. These metrics can be grouped in three groups as the ones related
with the performance of the projects of 3T, the ones related with the communication, and the
ones related with the performance contribution of 3T to its partners and customers.
Performance metrics determined for 3T are as follows:
Project Related Metrics:
• Average project time
• Percentage of projects that are completed on time
• Percentage of dyer project proposals that are accepted by 3T

80
• Average time to respond to dyers’ project proposal
• Frequency of project offers of 3T to the dyers
• Percentage of 3T projects proposals that are approved by the dyers
• Percentage of projects that are done for partner dyers
• Percentage of projects on which the price proposal has been revised
• Average cost reduction percentage of 3T projects that is suggested by 3T (labor /
raw material / energy costs)
• Average suggested payback time of the projects
• Response time of 3T compared to other suppliers in the cases of breakdowns
Metrics Related to Communication:
• Frequency of regular meetings
• Average participation percentage to the meetings
• Contribution of 3T about the communication capability between the suppliers and
dyers
Metrics Related to Contribution of 3T:
• Contribution of 3T about the product quality of the partners
• Contribution of 3T about the defect rates of the products that the suppliers and
dyers supply to the market
• Contribution of 3T about the unplanned breakdowns of the machines of the dyers
• Contribution of 3T about the production capacity of the dyers
• Realization level of the cost reduction that 3T estimates about labor, raw material,
and energy costsPerformance Metrics for Suppliers
The followings are the performance metrics that were developed for partner suppliers.
These metrics were grouped into two groups: Project related metrics and communication
metrics.
Project Related Metrics:

81
• Participation percentage to 3T projects
• Percentage of projects that are completed on time
• Percentage of 3T project proposals that are accepted by the supplier
• Average number of part/full- time employees worked for the projects
• Percentage of price advantage that the supplier gives to 3T
• Percentage of the sales to partner dyers in total sales
Metrics Related with Communication:
• Participation percentage to the meetings
5.3. Performance Metrics for Dyers
Finally, for the measurement of contribution of dyers to the collaboration, following
performance metrics are developed.
Project Related Metrics:
• Percentage of projects purchasing from partner suppliers in total purchasing
• Average number of part/full- time employees worked for the projects
Metrics Related with Communication:
• Participation percentage to the meetings
• Level of willingness to open their plants to 3T visits (average number of 3T visits
to their plants)
5.4. Performance Results
As mentioned before, since 2001, 3T has completed 17 projects and developed 6 new
high-tech products in those projects. It has offered 158 project proposals to 70 customers
and only 17 of these proposals were approved by 15 customers, which means 89% of the

82
project proposals was rejected. This situation may be due to the economic crisis that has
occurred in 2001 in Turkey. Totally, 3T has sold automation systems to these 15 customers
in the value of 1,452,910 USD, but only 43% of these sales were done to its partner dyers,
which correspond to 624,758 USD. In any of these 17 projects, the price of the project has
never been revised by 3T, although there were some changes in the cost of projects in some
cases.
Average project completion time of these projects is 6 months. In 75% of the projects,
3T could not complete the projects on time and the delay of the projects is 20% of initial
project duration on the average. 3T has never rejected any project proposal coming from the
dyers due to technological incapability. When a project proposal comes from a customer, 3T
first evaluates the proposal by making pre-analysis of the project with the related suppliers
considering the technological possibilities and then, responds to dyers in 2 weeks on the
average. Since innovation, technology sharing and diffusion are the main building stones of
this collaboration, it can be said that 3T has a satisfying performance.
The projects completed by 3T result in average percentages of cost reduction in labor,
raw material, and energy consumption in the order of 30%, 10%, and 20%, respectively. The
average suggested payback time of the projects is 12 months. In the cases of the breakdowns
of the automation systems, all of the dyers stated that the response time of 3T is equal to the
other suppliers.
3T organizes meetings with its supplier and dyer partners once a month regularly.
These meetings are very important for the collaboration structure of 3T, since the partners
share information about customer needs and technological innovations in the industry in
these meetings. So, these meetings let the partners trust on each other and increase their
understandings about the collaboration concept. However, on the average, 45% of the
partners participate to these meetings and this fact seems to be a barrier for the building of
high- level trust and information sharing among the partners. Figure 5.1 shows the role of 3T
in the communication of the partners with each other. 8 out of 15 respondent partners stated
that 3T has no contribution to them about their communication capability.

83
3
8
4
0
1
2
3
4
5
6
7
8
9
Big contribution Little contribution No contribution
Nu
mb
er o
f p
artn
ers
Figure 5.1 Performance contribution of 3T to its partners about communication
In order to measure the performance contribution of 3T to its partners about the
quality levels of the products that they produce, we have gathered data from the partner
suppliers and dyers. As seen from Figure 5.2, 13 of the partners stated that the quality level
of their products has increased after initiating collaboration with 3T. This is a significant
result when the aims of 3T are considered.
8
5
2
0
1
2
3
4
5
6
7
8
9
Big contribution Little contribution No contribution
Nu
mb
er o
f p
artn
ers
Figure 5.2 Performance contribution of 3T to its partners about product quality

84
For the evaluation of the performance contribution of 3T to its partners about defect
rate, relevant data were collected from the partner and other dyers that have worked with 3T.
The number of the dyers that evaluate 3T with respect to its performance contribution about
defect rates can be seen on Figure 5.3. As seen from the figure, 5 of 11 dyers stated that
defect rate of their products has been decreased up to 5% thanks to 3T projects. Remaining 6
did not see any contribution of 3T projects about the defect rates. This may be due to the
different scopes of different projects, since the goals of implementing automation systems
may differ from one dyer to another.
0
5
6
0
1
2
3
4
5
6
7
More than 5% contribution 0-5% contribution No contribution
Nu
mb
er o
f d
yers
wo
rked
wit
h 3
T
Figure 5.3 Performance contribution of 3T projects to the dyers about defect rate
The contribution of 3T projects in the area of unplanned breakdowns of the machines
and automation systems of the dyers is shown in Figure 5.4. More than half of the dyers
stated that the percentage of breakdown duration of the machines in total production time
reduced after the implementation of automation system supplied by 3T. 3 of 11 projects
decreased the breakdown percentages more than 5%. This result is not very surprising since
3T supplies automation systems to the dyers.

85
3 3
5
0
1
2
3
4
5
More than 5% contribution 0-5% contribution No contribution
Nu
mb
er o
f d
yers
wo
rked
wit
h 3
T
Figure 5.4 Performance contribution of 3T projects to dyers about breakdowns
We have also analyzed the contribution of 3T to the production capacities of the dyers.
As seen on the Figure 5.5, 3T has increased the capacity of 4 of the dyers more than 10%
and 2 of the dyers stated that their production capacity has increased up to 10% after 3T
projects.
4
2
5
0
1
2
3
4
5
More than 10% contribution 0-10% contribution No contribution
Num
ber
of d
yers
wor
ked
with
3T
Figure 5.5 Performance contribution of 3T projects to dyers about production capacity
Before the project proposals of 3T are approved by the customers, 3T makes a
cost/benefit and payback analysis for the project and presents it to the potential customers.
We have examined the realization levels of the cost reduction in labor, raw material, and

86
energy costs of the dyers compared to the estimations of these costs by 3T itself. Figure 5.6
shows the number of the customers according to the realization level of the cost reductions
in labor, raw material and energy costs. As seen from the figure, in 7 out of 11 projects, the
estimated reduction in the labor cost is equal to the actual reduction and it is higher than the
actual in 2 of the projects. For the remaining 2 projects, 3T overestimated the cost reduction
for labor costs. For the raw material and energy costs, there is not a case in that the actual
reduction is more than the estimated. However, in 7 projects, reduction in raw material costs
was overestimated. This is also observed in 4 of the projects for the reduction in energy
costs. Reductions in raw material costs seem to be overestimated by 3T and this might not
be a good performance result for the reliability of 3T for future projects.
00
2
7
4
7
4
7
2
0
1
2
3
4
5
6
7
8
9
10
11
Labor cost Raw material cost Energy cost
Nu
mb
er o
f d
yers
th
at w
ork
ed w
ith
3T
Estimated reduction >Actual reduction
Estimated reduction =Actual reduction
Estimated reduction <Actual reduction
Figure 5.6 Realization level of the cost reductions in labor, raw material and energy costs
Partner suppliers of 3T seem to have more significant role than the partner dyers for
the collaboration, since 3T works as a supplier of automation systems for the dyers. During
the projects, 3T works with its suppliers to produce automation systems for dyers and it
integrates the products/software of different suppliers to build a complete system.

87
Participation percentages of the partner suppliers; Iletisim, Eliar, Vega, Erka, Ada, and
Protek, to 3T projects are 5.8%, 76.4%, 0.0%, 11.7%, 0.0%, and 76.4%, respectively.
Clearly, the contributions of the suppliers to the collaboration vary greatly. While two of the
suppliers were in 76.4% of the projects (13 projects), other two of them have not
participated in any of 3T projects. This unbalanced dispersion may cause problems about the
contribution of the suppliers to the collaboration.
On the average, partner suppliers have completed 80% of the projects on time and they
have accepted 85% of the project proposals of 3T. In these projects, suppliers give
approximately 10% price advantage to 3T for their products, equipments, and software
compared to their market prices and they assign 7-8 full- time employees for the projects on
the average. 25.8% of the sales of the partner suppliers were done to the dyer partners of 3T.
Average participation percentage of the suppliers to the meetings of 3T is 63.3% and
these participation percentages vary greatly. While three of the suppliers, namely Eliar,
Protek, and Iletisim participate in more than %90 of the meetings, Erka, Ada, and Vega
participate in less than %25 of the meetings.
In the collaboration structure of 3T, dyer partners also have the customer role besides
their partner role. On the average, 23.4% of the automation system purchased by the partner
dyers come from 3T suppliers. Approximately, 4-5 full-time and 1-2 part-time employees of
the dyers worked in these projects. Partner dyers participate in 46.9% of the meetings of 3T
on the average and there are various participation percentages varying from 5% to 100%.
One of the reasons of this fact may be the far distances between the dyers and 3T. It is
obviously seen from the data that, as the distance between the dyer and 3T increases,
participation percentage to the meetings decreases. Since the communication is very
important for such a collaboration model, 3T has to overcome this problem. 3T may
increase the number of visits to partner dyers since the average number of 3T visits to the
plants of partner dyers is 3 in two years.
88
6. CONCLUSION AND FURTHER RESEARCH
The literature survey shows that collaboration is a relatively new term for the
academic domain. There are numerous studies on various specific topics that involve more
than one party, which is regarded as collaboration. But in the literature, special attention is
given to the requirements of establishing collaborative partnerships that is mostly analyzed
at theoretical level. This study investigates an original application of SCC. After discussing
the benefits of SCC, the problems in its implementation are introduced. To do so, a model
developed for SCC by International Trading Organization is used to analyze the empirical
case of 3T collaboration. Furthermore, for the performance evaluation of this original
collaboration structure, performance metrics are generated and the measurement of those
metrics are done.
Supply chain collaboration has become recognized as a core competitive strategy. As
organizations continuously seek to provide their products and services to customers faster,
cheaper, and better than the competition, managers have come to realize that they cannot do
it alone; rather, they must work on a collaborative basis with the best organizations in their
supply chains in order to succeed. Members of a supply chain network should use
technology and management collaboratively to improve business operations in terms of
speed, agility, real-time control, and customer response. Moving from traditional supply
chains to collaborative networks requires partners to focus on communications,
relationships, and knowledge. Since the business is about an integrated set of relationships,
information sharing, technological innovation, and collaborative business practices are very
important for each business partner in the supply chain network today. So, once partners
enter into a business relationship, mutual success will depend on trust, information,
knowledge, and technology sharing, communication, and co-owned product service design
and performance measures.
89
Today, supply chain collaboration and management has been used in many industries
to gain competitive advantage. From the retail industry to the automotive and textile
industries, the philosophy has examples of successful applications. Japanese car
manufacturers have enjoyed the benefits of a close relationship with suppliers, enabling a
close two-way flow of information and benefits. The collaboration structure of 3T that we
have investigated in this study is also a very interesting example of collaboration that has
many unique characteristics that has not been seen not only in Turkey but also around the
world.
Textile industry, which is one of the most important industries of Turkey, should
create its self-brands to take a significant place and save its competitive position in the
world textile market, especially after the removal of quotas in year 2005. In order to achieve
this, Turkish textile industry should produce high value-added and innovative products
instead of low quality and cheap products and export them to the world. It is hopeful to see
that the participants of our study see “producing high value-added and high quality
products” as the most important production target. On the road to success, the efforts such as
establishment of collaborative networks should be supported by the whole industry. At this
point, 3T is the pioneer of these efforts and should be appreciated. Examples of such
collaborations and the participations to these collaborations must increase immediately,
since it is very difficult to struggle alone in order to survive in this fierce environment.
However, it is not very easy to build such collaborative networks and manage them
well. There are some barriers to collaboration, such as lack of confidence to the partners and
unwillingness to share information with the partners. The results of our study identify these
barriers. This study also reveals that as the level of trust between the partners increases, the
performance of the collaboration and the benefits that the partners gain from the
collaboration increase. This is also observed for the level of information sharing and
communication between the partners. It is seen from the results of the correlation analysis
that, as the level of information sharing and communication between the partners increase,
the performance and the benefits of the collaboration increase. So, 3T has to increase the

90
communication and information sharing level between its partners, since the participation
levels of the partners to the meetings are not so high. The reason of this problem seems to be
the longer distances of some partners to 3T and this problem may be overcome when 3T
organizes its regular meetings at different locations every month.
3T is successful in the preparation of the projects in terms of technological capability,
since it has not rejected any project proposal of the customers. Considering that 3T has
developed and produced 6 new products in 17 projects, 3T is creating technology and
producing high value-added products for the industry. But it should improve either its
project completion times or duration estimation, since it could not complete 75% of the
projects on time.
According to data collected from the partners, 3T has important contribution to its
partners regarding the quality of the products they produce. But, approximately half of the
partners stated that 3T has no contribution to their companies about the communication
levels, defect rates, unplanned breakdown durations, and production capacities. This
situation may occur because of different goals of the projects. Some may aim to reduce
defect rate, while some others aim to decrease breakdown durations of the machines and
automation systems.
3T prepares a cost/benefit and payback analysis for the project and presents it to its
customer. If the customer accepts the proposal, 3T combines the necessary and convenient
system units with the help of relevant suppliers. At this point, it seems that 3T overestimates
the reductions in labor costs, energy costs, and especially raw material costs. In 7 out of 11
projects, the reduction in raw material cost has realized below the estimation of 3T. 3T
should make these cost/benefit analyses more realistic to keep its reliability.
There is an unbalanced participation of the suppliers to projects. Suppliers that join in
the projects relatively less than the others may be included to future projects by extending
the scope of projects. More participation will help 3T to build more integrated and value-
added systems for its customers. On the other hand, performance evaluation of partner dyers

91
should also be done in order to identify which dyers have more contribution to the
collaboration because, as the size of a system increases, management and improvement of
that system gets more difficult and the agility of that system decreases.
It is not very easy for 3T to measure its performance and evaluate its partners’
performance because, it has not had much chance to perform a benchmarking study since
the examples of such collaboration models are very rare. However, in order to improve the
collaboration structure and to be successful in today’s business environment, the
performance of 3T and its partners should be evaluated continuously. In this study, we have
tried to develop necessary performance metrics to measure the collaboration level among
the partners of 3T and to evaluate the contributions of the partners to the collaboration.
Although the performance metrics developed in this study cover many aspects of the
collaboration, new performance metrics especially in the area of resource sharing may be
developed, when 3T extends its collaboration model to the area of resource sharing in the
future.
From the performance measurement, we have concluded that the efforts of the
partners for the improvement of the collaboration and the contributions of them to the
collaboration are not at the same level. 3T should motivate its partners to improve the
collaboration structure of 3T. An appropriate information infrastructure on which partners
can share their demand forecasts, sales information, customer needs, etc. may be built to
motivate the partners to share more information.
In the future, as the number of examples of such collaborative networks increases,
benchmarking studies may be performed to compare the collaboration levels of different
collaboration structures. Besides, since 3T is a very new collaboration model, as the time
passes, the performance of 3T and its partners may be compared with their previous
performances using historical data about the collaboration. To do this, a systematic and
consistent performance evaluation should be conducted for all partners and 3T itself. 3T has
started to keep its performance data with this study, so it is important for 3T to continue
with it so that 3T’s collaboration can be improved further.

92
REFERENCES
1. Akkermans H., P. Bogerd, B. Vos, “Virtuous and Vicious Cycles on the Road Towards International Supply Chain Management,” International Journal of Operations & Production Management, Vol. 19, No. 5/6, pp. 565-581, 1999
2. Alber K.L., W.T. Walker, “Supply Chain Management: Principles and Techniques for the Practitioner,” Research Paper Series, APICS Educationa l & Research Foundation, Falls Church, VA., 1998
3. Anderson M.G., P.B. Katz, “Strategic Sourcing,” International Journal of Logistics Management, Vol. 9, No. 1, pp. 1-13, 1998
4. Ballou R.H., S.M. Gilbert, A. Mukherjee, “New Managerial Challenges from Supply Chain Opportunities,” Industrial Marketing Management, Vol. 29, No. 1, pp. 7-18, 2000
5. Beamon B.M., “Measuring Supply Chain Performance,” International Journal of
Operations & Production Management, Vol. 19 No. 3 pp.7-12, 1999 6. Beamon B.M., “Supply Chain Design and Analysis: Models and Methods,”
International Journal of Production Economics, Vol. 55, No.3, pp.281-294, 1998
7. Bowersox D.J., T.P. Stank, P.J. Daugherty, “Lean Launch: Managing Product Introduction Risk Through Response-based Logistics,” Journal of Product Innovation Management, Vol. 16, No. 6, 1999
8. Cahill C., M. Charles, H. Fraser-Kraus, D. Boddy, D. Macbeth, “Success and Failure in Implementing Supply Chain Partnering: An Empirical Study,” European Journal of Purchasing and Supply Management, Vol. 4, pp. 143-151, 1998
9. Christopher M., Logistics and Supply Chain Management: Strategies for Reducing Costs and Improving Service, Pitman, London, 1992
10. Cooke J.A., “In This Issue,” Supply Chain Management Review, Vol. 1, No. 1, p. 3., 1997
11. Cox A., “Power, Value and Supply Chain Management,” Supply Chain Management: An International Journal, Vol. 4, No. 4, pp. 167-175, 1999

93
12. Davis T., “Effective Supply Chain Management,” Sloan Management Review, Summer, pp. 35-46, 1993
13. Elliff S.A., “Supply Chain Management: New Frontier,” Traffic World, October 21, pp. 55, 1996
14. Ellinger A.E., “Improving Marketing / Logistics Cross-Functional Collaboration in the Supply Chain,” Industrial Marketing Management, Vol. 29, No. 1, pp. 85-96, 2000
15. Fitzgerald E., G. McIntosh, A. Akintoye, “A Survey of Supply Chain Collaboration and Management in the UK Construction Industry,” European Journal of Purchasing and Supply Management, Vol. 6, pp. 159-168, 2000
16. Foreign Economic Relations Board, “Turkish Textile and Apparel Sector,” July 2002
17. Groves G., V. Valsamakis, “Supplier-Customer Relationships and Company Performance,” International Journal of Logistics Management, Vol. 9, No. 2, pp. 51-64, 1998
18. Ito T., M.R. Salleh, “A Blackboard-based Negotiation for a Collaborative Supply Chain System,” Journal of Materials Processing Technology, Vol. 107, pp. 398-403, 2000
19. LaLonde B.J., J.M. Masters, “Emerging Logistics Strategies: Blueprints for the Next Century,” International Journal of Physical Distribution and Logistics Management, Vol. 24, No. 7, pp. 35-47, 1994
20. Lambert D.M., M.C. Cooper, J.D. Pagh, “Supply Chain Management: Implementation Issues and Research Opportunities,” International Journal of Logistics Management, Vol. 9, No. 2, pp. 1-19, 1998
21. Lambert D., M. Cooper, “Issues in Supply Chain Management,” Industrial Marketing Management, Vol. 29, No. 1, pp. 65-83, 2000
22. Lapide L., “What About Measuring Supply Chain Performance,” Advanced
Manufacturing Research, 1998
23. Lee H.L., S. Whang, “Information Sharing in a Supply Chain,” Research Paper No. 1549, Stanford University, 1998
24. Marien E.J., “The Four Supply Chain Enablers,” Supply Chain Management Review, Vol. 4, No. 1, pp. 60-68, 2000
25. Pagh J., M.C. Cooper, “Supply Chain Postponement and Speculation Strategies: How to Choose the Right Strategy,” Journal of Business Logistics, Vol. 19, No. 2, pp. 13-33, 1998
26. Porter A.M., “One Focus, One Supply Base,” Purchasing, June 5, pp. 50-59, 1997

94
27. Quinn F.J., “Team up for Supply Chain Success,” Logistics Management & Distribution
Report, October 1., 1997
28. Quinn F.J., “The Clockspeed Chronicles,” Supply Chain Management Review, Vol. 3, No. 4, pp. 60-64, 2000
29. Rich N., P. Hines, “Supply-Chain Management and Time-based Competition: The Role of the Supplier Association,” International Journal of Physical Distribution and Logistics Management, Vol. 27, No. 3/4, pp. 210-225, 1997
30. Salcedo S., A. Grackin, “The e-Value Chain,” Supply Chain Management Review, Winter, pp. 63-70, 2000
31. Simchi-Levi D., P. Kaminsky, E. Simchi-Levi, Designing and Managing the Supply Chain, Irwin McGraw-Hill, Boston, MA., 2000
32. SPSS, SPSS Base 10.0 Applications Guide, SPSS Inc., Chicago, 1999.
33. SPSS, SPSS Base 11.0 User’s Guide, SPSS Inc., Chicago, 2001.
34. Tobler-Rohr M.I., “Modelling of The Textile Chain For LCA,” Textiltechnologie und Ökologie, Seminar Klippeneck, 2001
35. Tolone W.J., “Virtual Situation Rooms: Connecting People Across Enterprises for Supply Chain Agility,” Computer-Aided Design, Vol. 32, pp 109-117, 2000
36. Tyndall G., C. Gopal, W. Partsch, J. Kamauff, Supercharging Supply Chains, John Wiley & Sons, Inc., New York, 1998
37. Van Hoek R.I., “Measuring the Unmeasurable: Measuring and Improving Performance in the Supply Chain,” Supply Chain Management, Vol. 3, No. 4, pp. 187-192, 1998
38. Webster J., “Networks of Collaboration or Conflict? Electronic Data Interchange and Power in the Supply Chain,” Journal of Strategic Information Systems, Vol. 4(1), pp 31-12, 1995
39. Istanbul Textile and Apparel Exporters’ Union (ITKIB), www.itkib.org.tr, June 2003
40. Supply Chain Council (SCC), www.supply-chain.org, May 2003
41. International Trading Organization, www.i-trade.org, March 2003

95
APPENDIX A: Process Flow Chart of a Typical 3T Project
Meeting with thecustomer
Introduct ion of 3T
Introduction of theproducts / appl icat ions
o f 3 T
Demonstrat ion of otherproducts / appl icat ions
if necessary
Determine pre-requirements of the
customer
Receive technicalsupport from relatedsuppl iers regarding
feasibility
Investigation of thecustomer’s plant withcustomer’s technical
team
Prepare and updateproject proposal
Examine techn ica lconvenience of theproject with related
suppliers
Convenient?N o
Y e s
Prepare cost / benefitand payback analys is
of the project in theproposal
Need to update theproposal?
No
Y e s
A

96
A
Bargain on the pr iceand payment p lan
Fina l ize the pr ice andpayment p lan
Agreed? N o
Y e s
END
Rece ive advancepaymen t f r om
customer as pro jectapprova l
Order ing the productsto related suppl iers
Receive a l l re la tedproducts / mater ia ls /
so f tware / equ ipments /support f rom re lated
suppl iers
Implement the producta t cus tomer ’s p lan t
Pr i ce andpayment p lan
O r d e r
Af ter sa les suppor tupon the terms in
con t rac t
Integrate al l relatedproducts / mater ia ls /
so f tware / equ ipments
E N D
Sign contract wi th thecus tomer
Fina l ize the pro jectp roposa l
ProjectP roposa l
Contract

97
APPENDIX B: Collaboration Questionnaire For Dyers

98
COLLABORATION QUESTIONNAIRE FOR DYERS
(3T / SABANCI UNIVERSITY)
COMPANY NAME : DATE :
NAME – SURNAME / TITLE :
PHONE NUMBER :
1. Please state the number of full-time employees working in your company.
Blue-collar employees White-collar employees
2. Please state the number of engineers working in your company? ........................... 3. What is the total sales value of your company in 2002? ...........................(TL / USD)
4. What is the R&D budget of your company in 2002? ...........................(TL / USD)
5. Please state the importance level of the following production performance targets for
your company.
1: Unimportant 2: Somewhat important 3: Important 4: Very important 5: Extremely important 0: Not applicable
Production Performance Targets Importance level Decreasing the unit cost 0 1 2 3 4 5 Increasing the conformance to quality standards 0 1 2 3 4 5 Increasing the direct labor productivity. 0 1 2 3 4 5 Decreasing the break-even point of the product 0 1 2 3 4 5 Decreasing the production time1 0 1 2 3 4 5 Increasing the production quantity in a unit time 0 1 2 3 4 5 Decreasing the product / process development time 0 1 2 3 4 5 Decreasing the product / process implementation time 0 1 2 3 4 5 Increasing the delivery reliability 0 1 2 3 4 5 Decreasing the order response time 0 1 2 3 4 5 Decreasing the machine setup time 0 1 2 3 4 5 Producing high value-added products 0 1 2 3 4 5 Decreasing the finished good inventory cycle time 0 1 2 3 4 5 Decreasing the raw material inventory cycle time 0 1 2 3 4 5 Increasing the market share 0 1 2 3 4 5 Decreasing the maintenance and repair time 0 1 2 3 4 5 Other (state please): …............……………………………. 0 1 2 3 4 5
1 Production time is the time between receiving the work order and delivery of the product to the finished goods warehouse.

99
Please state three most important production performance targets for your company. 1. ………………………………………………………………………… 2. ………………………………………………………………………… 3. …………………………………………………………………………
6. Are there any other companies that your company collaborates with? Yes � No �
7. If yes, which companies do you collaborate with and for how long? ..................................../...............years ...................................../............... years ..................................../...............years ...................................../............... years ..................................../...............years ...................................../............... years What are the reasons that lead or hinder you to collaborate? ............................................................................................................................................. ............................................................................................................................................. ............................................................................................................................................. .............................................................................................................................................
8. Please state the importance level of the following benefits of supply chain collaboration.
1: Unimportant 2: Somewhat important 3: Important 4: Very important 5: Extremely important Benefits Importance level Enables to respond customer needs 1 2 3 4 5 Enables to deliver the product to customer on time 1 2 3 4 5 Decreases the lead time 1 2 3 4 5 Increases the customer satisfaction 1 2 3 4 5 Increases the employee satisfaction 1 2 3 4 5 Increases the productivity 1 2 3 4 5 Enables to solve unexpected problems 1 2 3 4 5 Increases the product quality 1 2 3 4 5 Increases the market share 1 2 3 4 5 Decreases the product / process development time 1 2 3 4 5 Decreases the product / process development cost 1 2 3 4 5 Decreases the labor cost 1 2 3 4 5 Decreases the material cost 1 2 3 4 5 Decreases the energy consumption 1 2 3 4 5 Enables to implement new production processes 1 2 3 4 5 Other (state please): ….......................................…………. 1 2 3 4 5
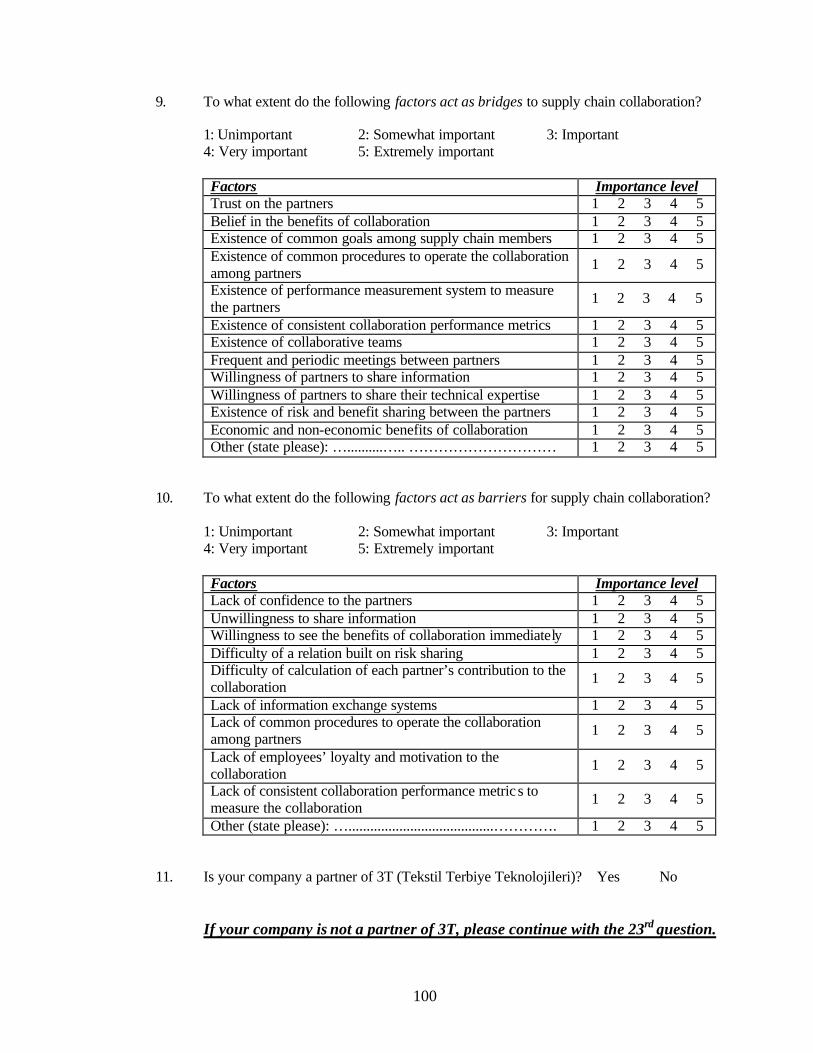
100
9. To what extent do the following factors act as bridges to supply chain collaboration?
1: Unimportant 2: Somewhat important 3: Important 4: Very important 5: Extremely important
Factors Importance level Trust on the partners 1 2 3 4 5 Belief in the benefits of collaboration 1 2 3 4 5 Existence of common goals among supply chain members 1 2 3 4 5 Existence of common procedures to operate the collaboration among partners 1 2 3 4 5
Existence of performance measurement system to measure the partners 1 2 3 4 5
Existence of consistent collaboration performance metrics 1 2 3 4 5 Existence of collaborative teams 1 2 3 4 5 Frequent and periodic meetings between partners 1 2 3 4 5 Willingness of partners to share information 1 2 3 4 5 Willingness of partners to share their technical expertise 1 2 3 4 5 Existence of risk and benefit sharing between the partners 1 2 3 4 5 Economic and non-economic benefits of collaboration 1 2 3 4 5 Other (state please): …..........….. ………………………… 1 2 3 4 5
10. To what extent do the following factors act as barriers for supply chain collaboration?
1: Unimportant 2: Somewhat important 3: Important 4: Very important 5: Extremely important
Factors Importance level Lack of confidence to the partners 1 2 3 4 5 Unwillingness to share information 1 2 3 4 5 Willingness to see the benefits of collaboration immediately 1 2 3 4 5 Difficulty of a relation built on risk sharing 1 2 3 4 5 Difficulty of calculation of each partner’s contribution to the collaboration 1 2 3 4 5
Lack of information exchange systems 1 2 3 4 5 Lack of common procedures to operate the collaboration among partners 1 2 3 4 5
Lack of employees’ loyalty and motivation to the collaboration 1 2 3 4 5
Lack of consistent collaboration performance metric s to measure the collaboration 1 2 3 4 5
Other (state please): …........................................…………. 1 2 3 4 5 11. Is your company a partner of 3T (Tekstil Terbiye Teknolojileri)? Yes � No �
If your company is not a partner of 3T, please continue with the 23rd question.

101
12. For how long is your company a 3T partner? For ................ months / years.
13. To what extent do the following reasons lead your company to collaborate?
1: Unimportant 2: Somewhat important 3: Important 4: Very important 5: Extremely important
Reasons Importance level Economic globalization / willingness to launch foreign markets 1 2 3 4 5
Necessity to compete with the foreign textile industries 1 2 3 4 5 Willingness to increase customer satisfaction 1 2 3 4 5 Willingness to increase supply chain and company productivity 1 2 3 4 5
Tendency to development and collaboration 1 2 3 4 5 Existence of a beneficial collaboration opportunity 1 2 3 4 5 Reception of a collaboration offer from the potential partners 1 2 3 4 5 Other (state please): …...........................................………… 1 2 3 4 5
14. To what extent has 3T collaboration structure improved your firm’s performance in the
following issues? 1: No improvement 2: Little improvement 3: Medium improvement 4: Big improvement 5: Very big improvement 0: No idea
Issue Improvement level Increase in sales 0 1 2 3 4 5 Increase in market share 0 1 2 3 4 5 Increase in productivity 0 1 2 3 4 5 Increase in profitability 0 1 2 3 4 5 Decrease in labor costs 0 1 2 3 4 5 Decrease in material costs 0 1 2 3 4 5 Decrease in energy costs 0 1 2 3 4 5 Response to customer needs flexible and rapidly 0 1 2 3 4 5 Launch of high quality products and services 0 1 2 3 4 5 Delivery of products to customers in a short time and on time 0 1 2 3 4 5 Increase in customer satisfaction 0 1 2 3 4 5 Increase in employee satisfaction 0 1 2 3 4 5 Launch of cheap products to the market 0 1 2 3 4 5 Decrease in process / product development costs 0 1 2 3 4 5 Decrease in process / product development time 0 1 2 3 4 5 Other (state please): …...........................................………….. 0 1 2 3 4 5

102
15. Indicate the extent to which you agree with each of the following statements as they relate to your company and 3T.
1: Strongly disagree 2: Disagree 3: Undecided 4: Agree 5: Strongly agree
Statement Agreement level There are shared mission and vision statements of 3T 1 2 3 4 5 Clear guidelines and procedures are used for collaboration 1 2 3 4 5 Adequate information exchange systems exist between partners 1 2 3 4 5
Consistent performance measures are used to measure the collaboration level 1 2 3 4 5
There exist a high level trust between the partners 1 2 3 4 5 We struggle to determine the current and future requirements of the customers 1 2 3 4 5
We follow new technological developments 1 2 3 4 5 We share the requirement information of the customers with our partners 1 2 3 4 5
We have a flexible structure in order to respond customer needs 1 2 3 4 5
We have an effective process to solve the customer complaints 1 2 3 4 5
We measure customer satisfaction regularly and systematically 1 2 3 4 5
We struggle to improve the working environment of our employees 1 2 3 4 5
We contribute in the process of product/process development with our partners 1 2 3 4 5
We assist our partners to improve their performance 1 2 3 4 5 16. At what frequency do you participate to the meetings of 3T?
Participate all � Participate most of them � Participate frequently � Participate rarely � Do not participate most of them � Never participate �
17. About which issues do you tell your ideas or requests in 3T meetings that you participate?
Issue Explanation Executive issues � Commercial issues � Technical issues �

103
18. At what extent does your company contribute to process / product development with 3T and partner suppliers?
............................................................................................................................................. .............................................................................................................................................
19. Does your company trade with the suppliers other than partner suppliers for the
products that are supplied by 3T? Yes � No �
20. About the relations with 3T partner suppliers and about the process of supplier
selection, choose the strategies that you have followed in last 2 years and that you plan to follow for the next 2 years.
Strategy In last 2 years In the next 2 years Bid evaluation2 � � Technological capability3 � � Common value creation4 � � Strategic collaboration5 � �
21. Do you plan to follow another strategy for your business with 3T partner suppliers?
Why? ............................................................................................................................................. .............................................................................................................................................
22. Please compare 3T partner suppliers with the other suppliers with respect to the following criteria.
1: 3T is much better 2: 3T is better 3: Equivalent 4: The others are better 5: The others are much better 0: No idea Criterion Superiority level Technical experience 0 1 2 3 4 5 Price 0 1 2 3 4 5 Quality 0 1 2 3 4 5 Service 0 1 2 3 4 5 Financial support 0 1 2 3 4 5
2 Bid evaluation is the strategy for supplier selection, in which the bids are evaluated only for that single purchasing. 3 Technological capability is the strategy in which the supplier selection is done by considering only the technological capabilities of suppliers. 4 Common value creation is the establishment of a short-term relation with the supplier, which is built on mutual benefits of the customer and the supplier. 5 Strategic collaboration is the establishment of a long-term relation with the supplier in a wide context, which is based on common targets of the customer and the supplier.

104
If your company is not a partner of 3T ;
23. Do you have information about the activities and collaboration structure of 3T? Yes � No �
24. If you have information about 3T, what are the reasons of not being a partner of 3T? ............................................................................................................................................. ............................................................................................................................................. ............................................................................................................................................. .............................................................................................................................................
25. To what extent may 3T collaboration structure improve your company’s performance in the following areas?
1: No improvement 2: Little improvement 3: Medium improvement 4: Big improvement 5: Very big improvement 0: No idea
Issue Improvement level Increase in sales 0 1 2 3 4 5 Increase in market share 0 1 2 3 4 5 Increase in productivity 0 1 2 3 4 5 Increase in profitability 0 1 2 3 4 5 Decrease in labor costs 0 1 2 3 4 5 Decrease in material costs 0 1 2 3 4 5 Decrease in energy costs 0 1 2 3 4 5 Response to customer needs flexible and rapidly 0 1 2 3 4 5 Launch of high quality products and services 0 1 2 3 4 5 Delivery of products to customers in a short time and on time 0 1 2 3 4 5 Increase in customer satisfaction 0 1 2 3 4 5 Increase in employee satisfaction 0 1 2 3 4 5 Launch of cheap products to the market 0 1 2 3 4 5 Decrease in process / product development costs 0 1 2 3 4 5 Decrease in process / product development time 0 1 2 3 4 5 Other (state please): …...........................................………… 0 1 2 3 4 5
26. Do you plan to be a partner of 3T? Yes � No �

105
APPENDIX C : Collaboration Questionnaire For Suppliers

106
COLLABORATION QUESTIONNAIRE FOR SUPPLIERS
(3T / SABANCI UNIVERSITY)
COMPANY NAME : DATE :
NAME - SURNAME / TITLE :
PHONE NUMBER :
1. Please state the number of full-time employees working in your company.
Blue-collar employees White-collar employees
2. Please state the number of engineers working in your company? ........................... 3. What is the total sales value of your company in 2002? ...........................(TL / USD)
4. What is the R&D budget of your company in 2002? ...........................(TL / USD)
5. Please state the importance level of the following production performance targets for
your company.
1: Unimportant 2: Somewhat important 3: Important 4: Very important 5: Extremely important 0: Not applicable
Production Performance Targets Importance level Decreasing the unit cost 0 1 2 3 4 5 Increasing the conformance to quality standards 0 1 2 3 4 5 Increasing the direct labor productivity 0 1 2 3 4 5 Decreasing the break-even point of the product 0 1 2 3 4 5 Decreasing the production time1 0 1 2 3 4 5 Increasing the production quantity in a unit time 0 1 2 3 4 5 Decreasing the product / process development time 0 1 2 3 4 5 Decreasing the product / process implementation time 0 1 2 3 4 5 Increasing the delivery reliability 0 1 2 3 4 5 Decreasing the order response time 0 1 2 3 4 5 Decreasing the machine setup time 0 1 2 3 4 5 Producing high value-added products 0 1 2 3 4 5 Decreasing the finished good inventory cycle time 0 1 2 3 4 5 Decreasing the raw material inventory cycle time 0 1 2 3 4 5 Increasing the market share 0 1 2 3 4 5 Decreasing the maintenance and repair time 0 1 2 3 4 5 Other (state please): ..............................................…………… 0 1 2 3 4 5
1 Production time is the time between receiving the work order and delivery of the product to the finished goods warehouse.

107
Please state three most important production performance targets for your company. 1. ………………………………………………………………………… 2. ………………………………………………………………………… 3. …………………………………………………………………………
6. Are there any other companies that your company collaborates with? Yes � No �
7. If yes, which companies do you collaborate with and for how long? ..................................../...............years ...................................../............... years ..................................../...............years ...................................../............... years ..................................../...............years ...................................../............... years What are the reasons that lead or hinder you to collaborate? ............................................................................................................................................. ............................................................................................................................................. ............................................................................................................................................. .............................................................................................................................................
8. Please state the importance level of the following benefits of supply chain collaboration.
1: Unimportant 2: Somewhat important 3: Important 4: Very important 5: Extremely important Benefits Importance level Enables to respond customer needs 1 2 3 4 5 Enables to deliver the product to customer on time 1 2 3 4 5 Decreases the lead time 1 2 3 4 5 Increases the customer satisfaction 1 2 3 4 5 Increases the employee satisfaction 1 2 3 4 5 Increases the productivity 1 2 3 4 5 Enables to solve unexpected problems 1 2 3 4 5 Increases the product quality 1 2 3 4 5 Increases the market share 1 2 3 4 5 Decreases the product / process development time 1 2 3 4 5 Decreases the product / process development cost 1 2 3 4 5 Decreases the labor cost 1 2 3 4 5 Decreases the material cost 1 2 3 4 5 Decreases the energy consumption 1 2 3 4 5 Enables to implement new production processes 1 2 3 4 5 Other (state please): ..............................................…………. 1 2 3 4 5

108
9. To what extent do the following factors act as bridges to supply chain collaboration?
1: Unimportant 2: Somewhat important 3: Important 4: Very important 5: Extremely important
Factors Importance level Trust on the partners 1 2 3 4 5 Belief in the benefits of collaboration 1 2 3 4 5 Existence of common goals among supply chain members 1 2 3 4 5 Existence of common procedures to operate the collaboration among partners 1 2 3 4 5
Existence of performance measurement system to measure the partners 1 2 3 4 5
Existence of consistent collaboration performance metrics 1 2 3 4 5 Existence of collaborative teams 1 2 3 4 5 Frequent and periodic meetings between partners 1 2 3 4 5 Willingness of partners to share information 1 2 3 4 5 Willingness of partners to share their technical expertise 1 2 3 4 5 Existence of risk and benefit sharing between the partners 1 2 3 4 5 Economic and non-economic benefits of collaboration 1 2 3 4 5 Geographic closeness to the partners 1 2 3 4 5 Other (state please): ..............................................………….. 1 2 3 4 5
10. To what extent do the following factors act as barriers for supply chain collaboration?
1: Unimportant 2: Somewhat important 3: Important 4: Very important 5: Extremely important
Factors Importance level Lack of confidence to the partners 1 2 3 4 5 Unwillingness to share information 1 2 3 4 5 Willingness to see the benefits of collaboration immediately 1 2 3 4 5 Difficulty of a relation built on risk sharing 1 2 3 4 5 Difficulty of calculation of each partner’s contribution to the collaboration 1 2 3 4 5
Lack of information exchange systems 1 2 3 4 5 Lack of common procedures to operate the collaboration among partners 1 2 3 4 5
Lack of employees’ loyalty and motivation to the collaboration 1 2 3 4 5
Lack of consistent collaboration performance metrics to measure the collaboration 1 2 3 4 5
High geographic distance to the partners 1 2 3 4 5 Other (state please): ..............................................………… 1 2 3 4 5
11. For how long is your company a 3T partner? For ................ months / years.

109
12. To what extent do the following reasons lead your company to collaborate?
1: Unimportant 2: Somewhat important 3: Important 4: Very important 5: Extremely important
Reasons Importance level Economic globalization / willingness to launch foreign markets 1 2 3 4 5
Necessity to compete with the foreign textile industries 1 2 3 4 5 Willingness to increase customer satisfaction 1 2 3 4 5 Willingness to increase supply chain and company productivity 1 2 3 4 5
Tendency to development and collaboration 1 2 3 4 5 Existence of a beneficial collaboration opportunity 1 2 3 4 5 Reception of a collaboration offer from the potential partners 1 2 3 4 5 Other (state please): ..............................................………….. 1 2 3 4 5
13. To what extent has 3T collaboration structure improved your firm’s performance in the
following issues? 1: No improvement 2: Little improvement 3: Medium improvement 4: Big improvement 5: Very big improvement 0: No idea
Issue Improvement level Increase in sales 0 1 2 3 4 5 Increase in market share 0 1 2 3 4 5 Increase in productivity 0 1 2 3 4 5 Increase in profitability 0 1 2 3 4 5 Decrease in labor costs 0 1 2 3 4 5 Decrease in material costs 0 1 2 3 4 5 Decrease in energy costs 0 1 2 3 4 5 Response to customer needs flexible and rapidly 0 1 2 3 4 5 Launch of high quality products and services 0 1 2 3 4 5 Delivery of products to customers in a short time and on time 0 1 2 3 4 5 Increase in customer satisfaction 0 1 2 3 4 5 Increase in employee satisfaction 0 1 2 3 4 5 Launch of cheap products to the market 0 1 2 3 4 5 Decrease in process / product development costs 0 1 2 3 4 5 Decrease in process / product development time 0 1 2 3 4 5 Other (state please): ..............................................………….. 0 1 2 3 4 5

110
14. Indicate the extent to which you agree with each of the following statements as they relate to your company and 3T.
1: Strongly disagree 2: Disagree 3: Undecided 4: Agree 5: Strongly agree
Statement Agreement level There are shared mission and vision statements of 3T 1 2 3 4 5 Clear guidelines and procedures are used for collaboration 1 2 3 4 5 Adequate information exchange systems exist between partners 1 2 3 4 5
Consistent performance measures are used to measure the collaboration level 1 2 3 4 5
There exist a high level trust between the partners 1 2 3 4 5 We struggle to determine the current and future requirements of the customers 1 2 3 4 5
We follow new technological developments 1 2 3 4 5 We share the requirement information of the customers with our partners 1 2 3 4 5
We have a flexible structure in order to respond customer needs 1 2 3 4 5
We have an effective process to solve the customer complaints 1 2 3 4 5
We measure customer satisfaction regularly and systematically 1 2 3 4 5
We struggle to improve the working environment of our employees 1 2 3 4 5
We contribute in the process of product/process development with our partners 1 2 3 4 5
We assist our partners to improve their performance 1 2 3 4 5 15. At what frequency do you participate to the meetings of 3T?
Participate all � Participate most of them � Participate frequently � Participate rarely � Do not participate most of them � Never participate �
16. About which issues do you tell your ideas or requests in 3T meetings that you participate?
Issue Explanation
Executive issues � Commercial issues � Technical issues �

111
17. At what extent does your company contribute to process / product development with 3T
and partner suppliers?
.............................................................................................................................................
.............................................................................................................................................
.............................................................................................................................................
.............................................................................................................................................
18. Does your company trade with the suppliers other than partner suppliers for the products that you supply to 3T? Yes � No�
If yes; About the relations with 3T partner suppliers and about the process of supplier selection, choose the strategies that you have followed in last 2 years and that you plan to follow for the next 2 years.
Strategy In last 2 years In the next 2 years Bid evaluation2 � � Technological capability3 � � Common value creation4 � � Strategic collaboration5 � �
2 Bid evaluation is the strategy for supplier selection, in which the bids are evaluated only for that single purchasing. 3 Technological capability is the strategy in which the supplier selection is done by considering only the technological capabilities of suppliers. 4 Common value creation is the establishment of a short-term relation with the supplier, which is built on mutual benefits of the customer and the supplier. 5 Strategic collaboration is the establishment of a long-term relation with the supplier in a wide context, which is based on common targets of the customer and the supplier.

92
REFERENCES
1. Akkermans H., P. Bogerd, B. Vos, “Virtuous and Vicious Cycles on the Road Towards International Supply Chain Management,” International Journal of Operations & Production Management, Vol. 19, No. 5/6, pp. 565-581, 1999
2. Alber K.L., W.T. Walker, “Supply Chain Management: Principles and Techniques for the Practitioner,” Research Paper Series, APICS Educationa l & Research Foundation, Falls Church, VA., 1998
3. Anderson M.G., P.B. Katz, “Strategic Sourcing,” International Journal of Logistics Management, Vol. 9, No. 1, pp. 1-13, 1998
4. Ballou R.H., S.M. Gilbert, A. Mukherjee, “New Managerial Challenges from Supply Chain Opportunities,” Industrial Marketing Management, Vol. 29, No. 1, pp. 7-18, 2000
5. Beamon B.M., “Measuring Supply Chain Performance,” International Journal of
Operations & Production Management, Vol. 19 No. 3 pp.7-12, 1999 6. Beamon B.M., “Supply Chain Design and Analysis: Models and Methods,”
International Journal of Production Economics, Vol. 55, No.3, pp.281-294, 1998
7. Bowersox D.J., T.P. Stank, P.J. Daugherty, “Lean Launch: Managing Product Introduction Risk Through Response-based Logistics,” Journal of Product Innovation Management, Vol. 16, No. 6, 1999
8. Cahill C., M. Charles, H. Fraser-Kraus, D. Boddy, D. Macbeth, “Success and Failure in Implementing Supply Chain Partnering: An Empirical Study,” European Journal of Purchasing and Supply Management, Vol. 4, pp. 143-151, 1998
9. Christopher M., Logistics and Supply Chain Management: Strategies for Reducing Costs and Improving Service, Pitman, London, 1992
10. Cooke J.A., “In This Issue,” Supply Chain Management Review, Vol. 1, No. 1, p. 3., 1997
11. Cox A., “Power, Value and Supply Chain Management,” Supply Chain Management: An International Journal, Vol. 4, No. 4, pp. 167-175, 1999

93
12. Davis T., “Effective Supply Chain Management,” Sloan Management Review, Summer, pp. 35-46, 1993
13. Elliff S.A., “Supply Chain Management: New Frontier,” Traffic World, October 21, pp. 55, 1996
14. Ellinger A.E., “Improving Marketing / Logistics Cross-Functional Collaboration in the Supply Chain,” Industrial Marketing Management, Vol. 29, No. 1, pp. 85-96, 2000
15. Fitzgerald E., G. McIntosh, A. Akintoye, “A Survey of Supply Chain Collaboration and Management in the UK Construction Industry,” European Journal of Purchasing and Supply Management, Vol. 6, pp. 159-168, 2000
16. Foreign Economic Relations Board, “Turkish Textile and Apparel Sector,” July 2002
17. Groves G., V. Valsamakis, “Supplier-Customer Relationships and Company Performance,” International Journal of Logistics Management, Vol. 9, No. 2, pp. 51-64, 1998
18. Ito T., M.R. Salleh, “A Blackboard-based Negotiation for a Collaborative Supply Chain System,” Journal of Materials Processing Technology, Vol. 107, pp. 398-403, 2000
19. LaLonde B.J., J.M. Masters, “Emerging Logistics Strategies: Blueprints for the Next Century,” International Journal of Physical Distribution and Logistics Management, Vol. 24, No. 7, pp. 35-47, 1994
20. Lambert D.M., M.C. Cooper, J.D. Pagh, “Supply Chain Management: Implementation Issues and Research Opportunities,” International Journal of Logistics Management, Vol. 9, No. 2, pp. 1-19, 1998
21. Lambert D., M. Cooper, “Issues in Supply Chain Management,” Industrial Marketing Management, Vol. 29, No. 1, pp. 65-83, 2000
22. Lapide L., “What About Measuring Supply Chain Performance,” Advanced
Manufacturing Research, 1998
23. Lee H.L., S. Whang, “Information Sharing in a Supply Chain,” Research Paper No. 1549, Stanford University, 1998
24. Marien E.J., “The Four Supply Chain Enablers,” Supply Chain Management Review, Vol. 4, No. 1, pp. 60-68, 2000
25. Pagh J., M.C. Cooper, “Supply Chain Postponement and Speculation Strategies: How to Choose the Right Strategy,” Journal of Business Logistics, Vol. 19, No. 2, pp. 13-33, 1998
26. Porter A.M., “One Focus, One Supply Base,” Purchasing, June 5, pp. 50-59, 1997
94
27. Quinn F.J., “Team up for Supply Chain Success,” Logistics Management & Distribution
Report, October 1., 1997
28. Quinn F.J., “The Clockspeed Chronicles,” Supply Chain Management Review, Vol. 3, No. 4, pp. 60-64, 2000
29. Rich N., P. Hines, “Supply-Chain Management and Time-based Competition: The Role of the Supplier Association,” International Journal of Physical Distribution and Logistics Management, Vol. 27, No. 3/4, pp. 210-225, 1997
30. Salcedo S., A. Grackin, “The e-Value Chain,” Supply Chain Management Review, Winter, pp. 63-70, 2000
31. Simchi-Levi D., P. Kaminsky, E. Simchi-Levi, Designing and Managing the Supply Chain, Irwin McGraw-Hill, Boston, MA., 2000
32. SPSS, SPSS Base 10.0 Applications Guide, SPSS Inc., Chicago, 1999.
33. SPSS, SPSS Base 11.0 User’s Guide, SPSS Inc., Chicago, 2001.
34. Tobler-Rohr M.I., “Modelling of The Textile Chain For LCA,” Textiltechnologie und Ökologie, Seminar Klippeneck, 2001
35. Tolone W.J., “Virtual Situation Rooms: Connecting People Across Enterprises for Supply Chain Agility,” Computer-Aided Design, Vol. 32, pp 109-117, 2000
36. Tyndall G., C. Gopal, W. Partsch, J. Kamauff, Supercharging Supply Chains, John Wiley & Sons, Inc., New York, 1998
37. Van Hoek R.I., “Measuring the Unmeasurable: Measuring and Improving Performance in the Supply Chain,” Supply Chain Management, Vol. 3, No. 4, pp. 187-192, 1998
38. Webster J., “Networks of Collaboration or Conflict? Electronic Data Interchange and Power in the Supply Chain,” Journal of Strategic Information Systems, Vol. 4(1), pp 31-12, 1995
39. Istanbul Textile and Apparel Exporters’ Union (ITKIB), www.itkib.org.tr, June 2003
40. Supply Chain Council (SCC), www.supply-chain.org, May 2003
41. International Trading Organization, www.i-trade.org, March 2003