Supplier-Induced Demand in Japan ’ LTC Market Satoshi Shimizutani (coauthored with Haruko Noguchi)
25
Supplier-Induced Demand in Japan’ LTC Market Satoshi Shimizutani (coauthored with Haruko N oguchi)
-
Upload
heather-allison -
Category
Documents
-
view
218 -
download
1
Transcript of Supplier-Induced Demand in Japan ’ LTC Market Satoshi Shimizutani (coauthored with Haruko Noguchi)

Supplier-Induced Demand in Japan’ LTC Market
Satoshi Shimizutani(coauthored with Haruko Noguchi)

Motivation (1)
Rapid speed of aging (65+ exceeds 20%) and expansion of LTC costs
LTC expenses: 6.18 trillion yen in FY2004 (75.4 %percent increase from FY 2000, 150% increase for at-home care)
How to operate the LTC market efficiently? How to motivate market participants behave properly?

LTC insurance useFigure 1 Care Costs through the Long-Term Care Insurance in Japan
0
100
200
300
400
500
600
2000
.4
2000
.6
2000
.8
2000
.10
2000
.12
2001
.2
2001
.4
2001
.6
2001
.8
2001
.10
2001
.12
2002
.2
2002
.4
2002
.6
2002
.8
2002
.10
2002
.12
2003
.2
2003
.4
2003
.6
2003
.8
2003
.10
2003
.12
2004
.2
2004
.4
2004
.6
2004
.8
2004
.10
2004
.12
2005
.2
2005
.4
Institutional services
At-home services
(Billion Yen)

Motivation (2)
Popular hypothesis: realization of potential demand suppressed before 2000, moral hazard……
Only lower-income households were eligible to receive LTC provided by the local government under social welfare

Motivation (3)
Focus on prevention of moral hazard in LTC providers
Asymmetry of information between suppliers and demanders
Fixed service prices under public insurance program

LTC program in Japan
Under the program, once certified, a insured person are free to choose care services (at-home care and institutional care) at a 10 percent co-payment.
More market-oriented policy: allowed for-profit providers to enter the at-home care market for the first time

SID-previous research (1)
SID hypothesis: enormous literature Feldstein (1970): positive correlation bet.
physician incomes & physician density Fuchs (1974), Evans (1974),Reinhardt
(1978) Several models: Physician takes advantage
of information asymmetry bet. suppliers & demand (due to skilled knowledge etc.)

SID-previous research (2) Physician-induced demand exists when
the physician influences a patient’s demand for care against the physician’s interpretation of the best interest of the patient (McGuire (2000)).
Empirical findings are inconclusive. Identification problem (supplier or
demander-induced): Childbirth & Physician density

SID-previous research (3) Two phase model (Rossiter & Wilensky (198
4) etc). 1st phase=probability to use medical service: Effect of higher accessibility 2nd phase=medical expenditure per patient : Effect of physician-induced demand Escarce (1992) finds the intensity of physician
s affects 1st phase but not 2nd phase.

SID-previous research (4) Previous studies in Japan Nishimura (1987): positive correlation bet. m
edical expenditure and MD density. Several studies after the 1990s SID observed in Yamada (2002) but not in S
uzuki (1998), Kishida (2001) LTC Case (prefecture data): observed in Yama
uchi (2003) but not in Yuda (2004)

Data Data: Micro-level data from the “Survey
on Long-term Care Users” in 2002 and 2003, compiled by ESRI, Gov. of Japan.
Randomly chosen (response rate: 80%). HH with one un-institutionalized needy
elderly inc. uncertified. Sample size : around 1,000 in each year. Matched with density of providers
(prefecture level).
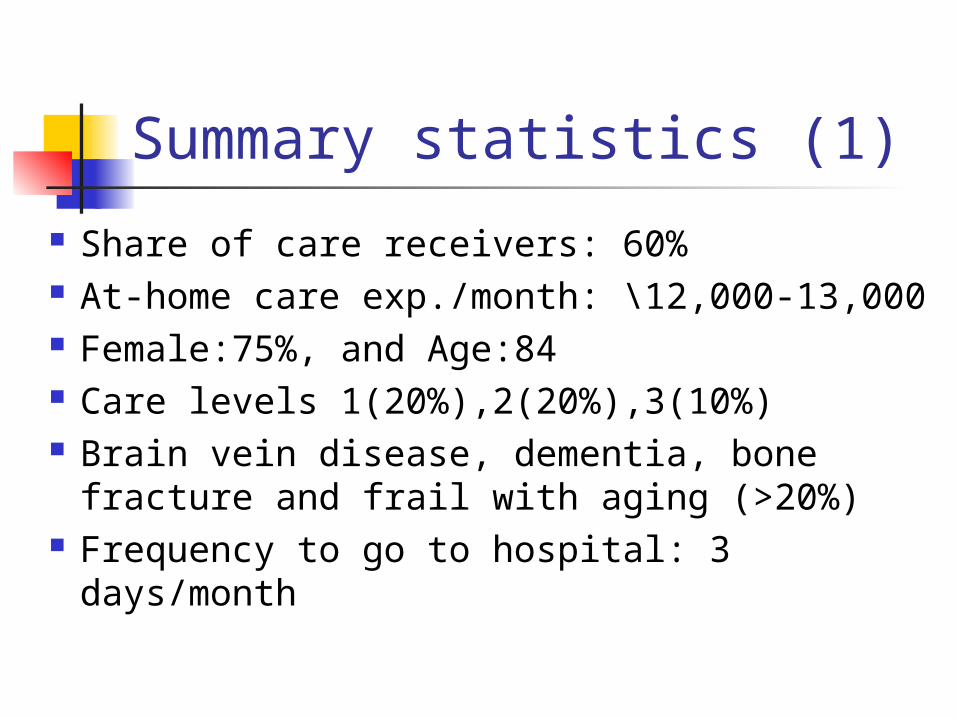
Summary statistics (1)
Share of care receivers: 60% At-home care exp./month: \12,000-13,000 Female:75%, and Age:84 Care levels 1(20%),2(20%),3(10%) Brain vein disease, dementia, bone fracture
and frail with aging (>20%) Frequency to go to hospital: 3 days/month

Summary statistics (2)
HH income (4-6 bill. yen) and HH assets (30-50 bill. Yen)
# family members: 4.0 Number of establishments per certified
persons in a prefecture: 0.01 (1 establishments for 100 certified)
Share of for-profits: 25-33 %

Specification
Dependent: logarithmic value of i th user’s expenditure for LTC
Dependent:dummy variable of i th user’s choice to use LTC service
iiii IntensityXY 210*
iiii IntensityXExp 210)ln(
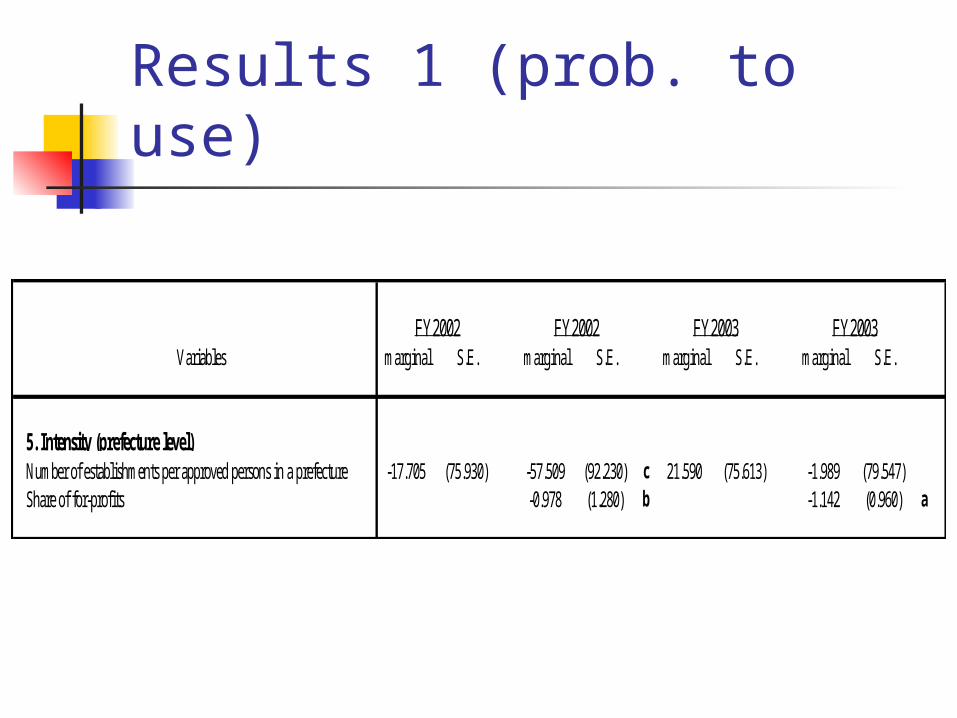
Results 1 (prob. to use)
Variables marginal S.E. marginal S.E. marginal S.E. marginal S.E.
5. Intensity (prefecture level)Number of establishments per approved persons in a prefecture -17.705 (75.930) -57.509 (92.230) c 21.590 (75.613) -1.989 (79.547) Share of for-profits -0.978 (1.280) b -1.142 (0.960) a
FY2002 FY2002 FY2003 FY2003

Results 2 (Care expenditure)
Variables coefficient S.E. coefficient S.E. coefficient S.E. coefficient S.E.5. Intensity (prefecture level)Number of establishments per approved persons in a prefecture -63.902 (233.640) -248.605 (286.282) 387.157 (242.662) 229.675 (249.287) Share of for-profits -4.170 (3.734) -6.947 (2.905) b
FY2002 FY2002 FY2003 FY2003

Findings
Little evidence on the SID in Japan’s LTC market. A higher portion of for-profits does not induce demand.
Consistent with Yuda (2004) at prefectural data.

SID in AMI treatment AMI (Acute Myocardinal Infarction)High-tech treatment: cardiac catheterization (CA
TH) and revascularization procedure PTCA (Percutaneous Transluminal Coronary Angioplasty)
CABG (Coronary-Artery Bypass Graft Surgery) Low-tech treatment: Acute drug treatments (aspi
rin, thrombolytic drugs, beta blocker, calcium channel blocker etc.)

AMI treatment in Japan1993 1996
PTCA Fee schedule for reimbursement 13,800 15,500 Number of PTCA hospitals 381 609 Number of PTCA performed 3,648 5,818CABG Fee schedule for reimbursement 1 37,100 37,100 2 or more 60,500 60,500 Number of CABG hospitals 397 453 Number of CABG performed 2,699 2,814Number of General Hospitals 8,752 8,421

SID in AMI treatment: Data Data: chart-based microdata from Tokai Acute
Myocardial Infarction Study (called TAMIS), comparable with Cooperative Cardiovascular Project (CCP)
2,020 heart attack patients in 14 high-tech and high-volume medical facilities in the Tokai area in 1995-1997.
1,047 patients living in 116 municipal areas matched with regional data.

SID in AMI treatment: Spec.
k l
sisillsikksi xDensT ,,,2,,10,
k l
sisillsikksi xDensy ,,,2,,10,
Dependent: logarithmic value of i th patient’s expenditure for s th treatment, CATH, PTCA, or low-tech acute drug treatments.
Dependent:dummy variable of i th patient’s choice of s th treatment, CATH, PTCA, or low-tech acute drug treatments.

Results on High-techs
Explanatory variablesCATH PTCA CATH OTCA
Marginal effect Marginal effect Marginal effect Marginal effect
-0.0001 b -0.0002 b -0.002 c -0.003 c
0.081 a 0.072 a 1.256 a 1.089 a
-0.014 a -0.010 c -0.199 a -0.159 b
0.055 b 0.082 b 0.716 c 0.864 c
# physicians per 100,000 0.002 a 0.004 a 0.026 a 0.039 a
# high volume hospitals with more than 100beds per 100,000
# beds/100,000
# high-tech hospitals (PTCA available) per100,000
# low-tech hospitals (no PTCA available)per 100,000
Medical expenditure perpersonProb to go to hospitals

Results on Low-techs
Explanatory variablesMarginal effect Marginal effect
0.0001 b 0.001 b
-0.081 a -0.505 a
0.014 a 0.088 a
-0.055 b -0.381 b
# physicians per 100,000 -0.002 a -0.013 a
Prob. To go tohospital
# beds/100,000
# high-tech hospitals (PTCA available) per100,000
# low-tech hospitals (no PTCA available)per 100,000
# high volume hospitals with more than 100beds per 100,000
Medicalexpenditure per
person

SID in AMI treatment
# of high-tech or high-volumn hospitals and MDs per person are positively correlated with medical expenditure in both phases in PTCA or CABG.
# of low-tech hospitals per persons is positively correlated with medical expenditure in both phases in low-tech treatment.

Conclusions and Discussions
Our findings report SID is not observed in LTC but in a high-tech treatment.
One explanation is the degree of information asymmetry
Implications: Maintaining care manager’s skill, further disclose etc.