Supplementary Tables S1 to S12 Supplementary Figure S1 ...10.1038/s41598-017... · Futile Cycle Suc...
19
Supplementary Information of the research article: Resolving the central metabolism of Arabidopsis guard cells Semidán Robaina-Estévez 1* , Danilo de Menezes Daloso 2,3* , Youjun Zhang 2 , Alisdair R. Fernie 2 , Zoran Nikoloski 1** 1 Systems Biology and Mathematical Modeling Group, Max Planck Institute of Molecular Plant Physiology, Potsdam-Golm, Germany, 2 Bioinformatics Group, Institute of Biochemistry and Biology, University of Potsdam, Potsdam-Golm, Germany, 3 Central Metabolism Group, Max Planck Institute of Molecular Plant Physiology, Potsdam-Golm, Germany, 4 Departamento de Bioquímica e Biologia Molecular, Universidade Federal do Ceará, Fortaleza-CE, Brasil *these authors contributed equally **corresponding author: [email protected] Contents Supplementary Tables S1 to S12 Supplementary Figure S1 Supplementary Appendix S1
-
Upload
nguyenhuong -
Category
Documents
-
view
225 -
download
0
Transcript of Supplementary Tables S1 to S12 Supplementary Figure S1 ...10.1038/s41598-017... · Futile Cycle Suc...

Supplementary Information of the research article:
Resolving the central metabolism of Arabidopsis guard cells
Semidán Robaina-Estévez1*
, Danilo de Menezes Daloso2,3*
, Youjun Zhang2, Alisdair R.
Fernie2, Zoran Nikoloski
1**
1Systems Biology and Mathematical Modeling Group, Max Planck Institute of Molecular
Plant Physiology, Potsdam-Golm, Germany, 2Bioinformatics Group, Institute of
Biochemistry and Biology, University of Potsdam, Potsdam-Golm, Germany, 3Central
Metabolism Group, Max Planck Institute of Molecular Plant Physiology, Potsdam-Golm,
Germany, 4Departamento de Bioquímica e Biologia Molecular, Universidade Federal do
Ceará, Fortaleza-CE, Brasil
*these authors contributed equally
**corresponding author: [email protected]
Contents
Supplementary Tables S1 to S12
Supplementary Figure S1
Supplementary Appendix S1

Table S1. A comparison of the predicted metabolic state of GC and M. The predicted mean flux values
corresponding to the reactions depicted in Figure 1 are shown for G and M cells. The p-values shown in this
table correspond to a Mann-Whitney test comparing the distributions of flux values of G and M cells (𝑉𝐺 and
𝑉𝑀, respectively). Three different tests were considered for each comparison: (i) we evaluated whether the two
distributions differ (null hypothesis Ho: 𝑉𝐺 = 𝑉𝑀, (ii) if G had increased flux values in comparison to M cells
(Ho: 𝑉𝑀 > 𝑉𝐺), and (iii) if M had increased flux values in comparison to G cells (Ho: 𝑉𝐺 > 𝑉𝑀). In all three
cases, a horizontal bar indicates a failure of the test due to distributions consisting of a fixed value. Reaction
names and index numbers in accord with AraCOREred.
Idx. in
Fig.1
Reaction Name (Idx in AraCOREred) Mean Flux G
Mean Flux M
Mean ratio (G/M)
Ho: 𝑽𝑮 = 𝑽𝑴
Ho: 𝑽𝑴 > 𝑽𝑮
Ho: 𝑽𝑮 > 𝑽𝑴
SubSystem
PSII photosystem II (1) 0.125 0.125 1.000 0.317 0.159 0.841 light reactions
Cb6f cytochrom b6f complex (2) 0.250 0.250 1.000 0.317 0.159 0.841 light reactions
PSI photosystem I (3) 0.500 0.500 1.000 0.317 0.159 0.841 light reactions
ATPase
ATPase (5) 0.107 0.107 1.000 0.317 0.159 0.841 light reactions
1 PEP carboxylase (54) 0.420 0.034 12.486 0 0 1.000 gluconeogenesis
2 Cytosolic NADP-MDH (115) 0.161 0.084 1.917 0 0 1.000 pyruvate metabolism
3 Dicarboxylate transporter (339) 0.251 0.033 7.554 0 0 1.000 transport
4 Plastidial NADP-Malic Enzyme (113) 0.249 0.032 7.848 0 0 1.000 pyruvate metabolism
5 CO2 diffusion [Forward] (374) 0 0.001 0 0 1.000 0 transport
5 CO2 diffusion [Backward] (374) 0.230 0.013 17.342 0 0 1.000 transport
6 Import CO2 (413) 0.021 0.021 1.000 0.013 0.994 0.006 import
7 Carbonic anhydrase (152) 0.420 0.034 12.486 0 0 1.000 carbon fixation
8 Glu tamate synthase (FeS-Fd) (179) 0.124 3.671e-05 3.391e+03 0 0 1.000 glutamate synthesis
9 Ferredoxin-NADP reductase (4) 0.126 0.250 0.502 0 1.000 0 light reactions
10 Export O2 (420) 0.020 0.020 1.000 0.847 0.424 0.576 export
11 TP isomerase [Forward] (9) 0.854 0.855 0.999 0 1.000 0 Calvin-Benson cycle, glycolysis
12 TP/Pi translocator [Forward] (328) 0.857 1.000 0.858 0 1.000 0 transport
13 Di-/ri-carboxylate carrier [Forward] (346)
0.348 0.327 1.065 0 0 1.000 transport
13 Di-/ri-carboxylate carrier [Forward] (347)
0.345 0.324 1.065 0 0 1.000 transport
13 Di-/ri-carboxylate carrier [Forward] (348)
0.349 0.324 1.077 0 0 1.000 transport
14 Di-/ri-carboxylate carrier [Backward] (343)
0.311 0.294 1.059 0 0 1.000 transport
14 Di-/ri-carboxylate carrier [Backward] (344)
0.314 0.289 1.088 0 0 1.000 transport
14 Di-/ri-carboxylate carrier [Backward] (345)
0.309 0.292 1.057 2.395e-06 1.198e-06 1.000 transport
15 Mitochondrlial NAD-MDH [Backward] (80)
0.271 0.226 1.201 0 0 1.000 tricarboxylic acid cycle, glyoxylate cycle
15 Mitochondrial NADP-MDH (117) 0.753 0.724 1.041 0 0 1.000 pyruvate metabolism
16 FBP aldolase [Forward] (35) 0.018 0.160 0.112 0 1.000 0 sucrose synthesis, gluconeogenesis, glycolysis
17 FBPase (36) 0.073 0 Inf 0 0 1.000 sucrose synthesis, gluconeogenesis, glycolysis
17 PPi-dep. Phosphofructokinase [Backward] (136)
0 0.693 0 0 1.000 0 pyrophosphate recycling
18 G6P isomerase [Forward] (39) 0.018 0.160 0.112 0 1.000 0 sucrose synthesis, sucrose degradation, gluconeogenesis
19 Phosphoglucomutase [Forward] (40) 0.055 7.590e-04 72.503 0 0 1.000 sucrose synthesis, sucrose degradation
20 TP/Pi translocator [Forward] (327) 0 0 0 - - - transport
20 TP/Pi translocator [Backward] (327) 0.362 0.439 0.825 0 1.000 0 transport

Table S2. Predicted Flux-Sums of selected metabolites in the AraCOREred model. The predicted mean
flux-sum values for several metabolites are displayed. In each of the metabolites, the flux-sum values are split
into each cellular compartment: cytosol (c), mitochondrion (m), peroxisome (p) and chloroplast (h). In addition,
the total flux-sum values (i.e., taking into account all the compartments) are provided. The interpretation of the
p-values is similar to that of Table S1. A horizontal bar indicates a failure of the test due to distributions
consisting of a fixed value.
Metabolite (compartment) Mean FluxSum G Mean FluxSum M Ratio (G/M) Ho: 𝑽𝑮 = 𝑽𝑴 Ho: 𝑽𝑴 > 𝑽𝑮 Ho: 𝑽𝑮 > 𝑽𝑴
Total Mal 5.434 4.581 1.186 0 0 1.000
Mal(c) 2.451 2.172 1.128 0 0 1.000
Mal(m) 2.129 2.004 1.062 0 0 1.000
Mal(p) 0 0 - - - 1.000
Mal(h) 2.211 1.493 1.481 0 0 1.000
Total Suc 0.109 5.574e-05 1.948e+03 0 0 1.000
Futile Cycle Suc 0.109 1.203e-05 9.019e+03 0 1.000 0
Total OAA 7.460 6.729 1.109 0 0 1.000
OAA(c) 4.063 3.606 1.127 0 0 1.000
OAA(m) 2.083 1.950 1.069 0 0 1.000
OAA(p) 1.320 1.488 0.887 0 1.000 0
OAA(h) 1.713 1.430 1.198 0 0 1.000
Total Pyr 3.571 3.085 1.158 0 0 1.000
Pyr(c) 1.418 1.344 1.055 0 0 1.000
Pyr(h) 0.498 0.139 3.574 0 0 1.000
Pyr(m) 1.656 1.639 1.010 0 0 1.000
Pyr(p) 1.418 1.268 1.118 0 0 1.000
Total PEP 2.896 2.583 1.121 0 0 1.000
PEP(c) 1.880 1.679 1.120 0 0 1.000
PEP(h) 1.536 1.672 0.919 0 1.000 0
G3P(h) 3.626 2.832 1.280 0 0 1.000
G3P(c) 1.837 0.966 1.901 0 0 1.000
Total ATP 1.967 1.609 1.223 0 0 1.000
ATP(h) 1.050 1.050 1.000 0 0 1.000
ATP(c) 6.691 6.234 1.073 0 0 1.000
ATP(m) 3.445 3.349 1.028 0 0 1.000
Total NADP 1.740 1.437 1.211 0 0 1.000
NADP(h) 1.506 1.447 1.041 0 0 1.000
NADP(c) 6.691 6.234 1.073 0 0 1.000
NADP(m) 3.445 3.349 1.028 0 0 1.000
Total NADPH 1.740 1.437 1.211 0 0 1.000
NADPH(h) 1.506 1.447 1.041 0 0 1.000
NADPH(c) 2.781 1.659 1.677 0 0 1.000
NADPH(m) 2.171 1.602 1.355 0 0 1.000
Total CO2 0.839 0.070 11.998 0 0 1.000
CO2(h) 0.001 0.002 0.788 0 1.000 0
CO2(c) 5.434 4.581 1.186 0 0 1.000
CO2(m) 2.451 2.172 1.128 0 0 1.000

Table S3. Activity of the CBC and starch metabolism in GC and M. The predicted mean flux values of
reactions in the CBC cycle and starch metabolism are shown for G and M cells. The interpretation of the p-
values is similar to that of Table S1. A horizontal bar indicates a failure of the test due to distributions consisting
of a fixed value. Reaction names and index numbers in accord with AraCOREred.
Reaction [direction](Idx in AraCOREred)
Mean Flux G Mean Flux M Mean ratio (G/M)
Ho: 𝑽𝑮 = 𝑽𝑴
Ho: 𝑽𝑴 > 𝑽𝑮
Ho: 𝑽𝑮 > 𝑽𝑴
CBC
RuBisCO Carboxylation (6) 0.019 0.020 0.974 0 1.000 0
RuBisCO Oxygenation( 85) 2.043e-06 2.043e-06 1.000 0 0 1.000
PGA kinase [Forward] (7) 0.495 0.278 1.779 0 0 1.000
GAP dehydrogenase (8) 0.864 0.959 0.901 0 1.000 0
TP isomerase [Forward] (9)
0.854 0.855 0.999 0 1.000 0
FBP aldolase [Forward] (10)
0 0 0 - - -
FBPase (11) 0 0 0 - - -
F6P transketolase (12) 0.007 0.007 0.974 0 1.000 0
SBP aldolase (13) 0 0 0 - - -
SBPase (14) 0 0 0 - - -
S7P transketolase (15) 0.006 0.007 0.974 0 1.000 0
Ru5P epimerase (16) 0.013 0.013 0.974 0 1.000 0
R5P isomerase (17) 0.006 0.007 0.973 0 1.000 0
Ru5P kinase (18) 0.019 0.020 0.974 0 1.000 0
PGA kinase [Backward] (7) 0 0 0 - - -
TP isomerase [Backward] (9)
0 0 0 - - -
FBP aldolase [Backward] (10)
0.004 0.145 0.025 0 1.000 0
Starch metabolism
starch synthase (22) 2.949e-04 2.949e-04 1.000 0 0 1.000
starch synthase (23) 2.975e-04 3.068e-04 0.970 0 1.000 0
starch synthase (24) 2.610e-06 1.177e-05 0.222 0 1.000 0
amylase (26) 2.610e-06 2.107e-05 0.124 0 1.000 0
disproportionating enzyme (28)
0 9.165e-06 0 0 1.000 0
disproportionating enzyme (29)
0 9.298e-06 0 0 1.000 0
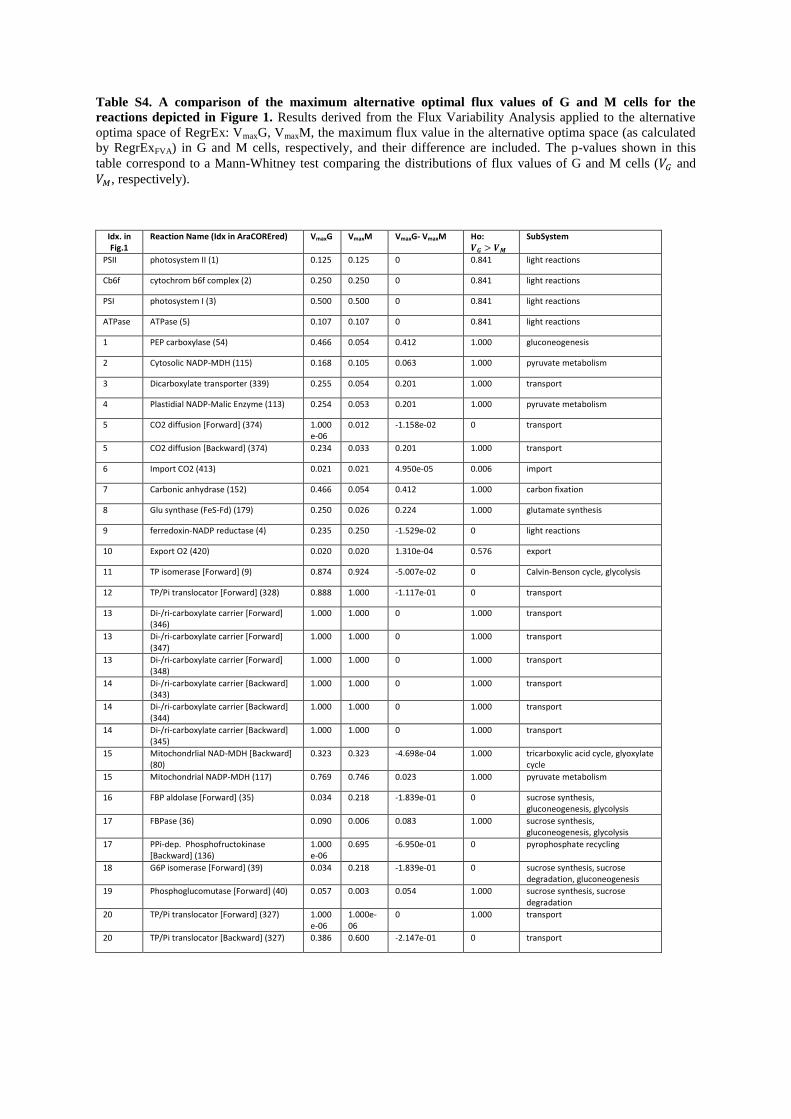
Table S4. A comparison of the maximum alternative optimal flux values of G and M cells for the
reactions depicted in Figure 1. Results derived from the Flux Variability Analysis applied to the alternative
optima space of RegrEx: VmaxG, VmaxM, the maximum flux value in the alternative optima space (as calculated
by RegrExFVA) in G and M cells, respectively, and their difference are included. The p-values shown in this
table correspond to a Mann-Whitney test comparing the distributions of flux values of G and M cells (𝑉𝐺 and
𝑉𝑀, respectively).
Idx. in Fig.1
Reaction Name (Idx in AraCOREred) VmaxG VmaxM VmaxG- VmaxM Ho: 𝑽𝑮 > 𝑽𝑴
SubSystem
PSII photosystem II (1) 0.125 0.125 0 0.841 light reactions
Cb6f cytochrom b6f complex (2) 0.250 0.250 0 0.841 light reactions
PSI photosystem I (3) 0.500 0.500 0 0.841 light reactions
ATPase ATPase (5) 0.107 0.107 0 0.841 light reactions
1 PEP carboxylase (54) 0.466 0.054 0.412 1.000 gluconeogenesis
2 Cytosolic NADP-MDH (115) 0.168 0.105 0.063 1.000 pyruvate metabolism
3 Dicarboxylate transporter (339) 0.255 0.054 0.201 1.000 transport
4 Plastidial NADP-Malic Enzyme (113) 0.254 0.053 0.201 1.000 pyruvate metabolism
5 CO2 diffusion [Forward] (374) 1.000e-06
0.012 -1.158e-02 0 transport
5 CO2 diffusion [Backward] (374) 0.234 0.033 0.201 1.000 transport
6 Import CO2 (413) 0.021 0.021 4.950e-05 0.006 import
7 Carbonic anhydrase (152) 0.466 0.054 0.412 1.000 carbon fixation
8 Glu synthase (FeS-Fd) (179) 0.250 0.026 0.224 1.000 glutamate synthesis
9 ferredoxin-NADP reductase (4) 0.235 0.250 -1.529e-02 0 light reactions
10 Export O2 (420) 0.020 0.020 1.310e-04 0.576 export
11 TP isomerase [Forward] (9) 0.874 0.924 -5.007e-02 0 Calvin-Benson cycle, glycolysis
12 TP/Pi translocator [Forward] (328) 0.888 1.000 -1.117e-01 0 transport
13 Di-/ri-carboxylate carrier [Forward] (346)
1.000 1.000 0 1.000 transport
13 Di-/ri-carboxylate carrier [Forward] (347)
1.000 1.000 0 1.000 transport
13 Di-/ri-carboxylate carrier [Forward] (348)
1.000 1.000 0 1.000 transport
14 Di-/ri-carboxylate carrier [Backward] (343)
1.000 1.000 0 1.000 transport
14 Di-/ri-carboxylate carrier [Backward] (344)
1.000 1.000 0 1.000 transport
14 Di-/ri-carboxylate carrier [Backward] (345)
1.000 1.000 0 1.000 transport
15 Mitochondrlial NAD-MDH [Backward] (80)
0.323 0.323 -4.698e-04 1.000 tricarboxylic acid cycle, glyoxylate cycle
15 Mitochondrial NADP-MDH (117) 0.769 0.746 0.023 1.000 pyruvate metabolism
16 FBP aldolase [Forward] (35) 0.034 0.218 -1.839e-01 0 sucrose synthesis, gluconeogenesis, glycolysis
17 FBPase (36) 0.090 0.006 0.083 1.000 sucrose synthesis, gluconeogenesis, glycolysis
17 PPi-dep. Phosphofructokinase [Backward] (136)
1.000e-06
0.695 -6.950e-01 0 pyrophosphate recycling
18 G6P isomerase [Forward] (39) 0.034 0.218 -1.839e-01 0 sucrose synthesis, sucrose degradation, gluconeogenesis
19 Phosphoglucomutase [Forward] (40) 0.057 0.003 0.054 1.000 sucrose synthesis, sucrose degradation
20 TP/Pi translocator [Forward] (327) 1.000e-06
1.000e-06
0 1.000 transport
20 TP/Pi translocator [Backward] (327) 0.386 0.600 -2.147e-01 0 transport

Table S5. A comparison of the maximum alternative optimal flux values of G and M cells for the
reactions in the CBC and starch metabolism. Results derived from the Flux Variability Analysis applied to
the alternative optima space of RegrEx: VmaxG, VmaxM, the maximum flux value in the alternative optima space
(as calculated by RegrExFVA) in G and M cells, respectively, and their difference are included. The p-values
shown in this table correspond to a Mann-Whitney test comparing the distributions of flux values of G and M
cells (𝑉𝐺 and 𝑉𝑀, respectively).
Reaction [direction](Idx in GEM)
VmaxG VmaxM VmaxG- VmaxM Ho: 𝑽𝑮 > 𝑽𝑴
CBC
RuBisCO Carboxylation (6) 0.021 0.023 -1.784e-03 0
RuBisCO Oxygenation( 85) 2.514e-04
2.661e-04 -1.467e-05 -
PGA kinase [Forward] (7) 0.500 0.299 0.201 1.000
GAP dehydrogenase (8) 0.911 0.963 -5.196e-02 0
TP isomerase [Forward] (9)
0.874 0.924 -5.007e-02 0
FBP aldolase [Forward] (10)
0.005 1.000e-06 0.005 1.000
FBPase (11) 0.005 0.005 1.373e-04 1.96E-01
F6P transketolase (12) 0.007 0.008 -5.059e-04 0
SBP aldolase (13) 0.005 0.006 -8.402e-04 0
SBPase (14) 0.005 0.006 -8.402e-04 0
S7P transketolase (15) 0.007 0.008 -5.058e-04 0
Ru5P epimerase (16) 0.014 0.015 -1.012e-03 0
R5P isomerase (17) 0.007 0.007 -5.058e-04 0
Ru5P kinase (18) 0.021 0.023 -1.784e-03 0
PGA kinase [Backward] (7) 1.000e-06
1.000e-06 0 -
TP isomerase [Backward] (9)
1.000e-06
1.000e-06 0 0
FBP aldolase [Backward] (10)
0.020 0.204 -1.838e-01 0
Starch metabolism
starch synthase (22) 0.020 0.204 -1.838e-01 1.000
starch synthase (23) 0.002 0.002 6.434e-04 0
starch synthase (24) 0.005 0.006 -7.696e-04 0
amylase (26) 0.004 0.003 0.001 0
disproportionating enzyme (28)
0.004 0.003 0.001 0
disproportionating enzyme (29)
0.004 0.003 0.001 0
disproportionating enzyme (30)
0.004 0.003 0.001 1.76E-05
(starch) phosphorylase (32)
0.002 0.002 1.543e-04 1.000

Table S6. A comparison of the predicted metabolic state of G and M cells after imposing additional
experimental constraints. This table shows the analogous results, presented inTable S1, when additional
constraints are taken in consideration. Concretely, the carboxylation to oxygenation ratio of RubisCO is
constrained to stay within 1.5 and 4. Additionally, the flux through the reactions in the CBC: the sedoheptulose
1,7-bisphosphate aldolase and the sedoheptulose-1,7-bisphosphatase is constrained to carry a positive flux
(Details in Materials & Methods). A horizontal bar indicates a failure of the test due to distributions consisting
of a fixed value. Reaction names and index numbers in accord with AraCOREred.
Idx in Fig 1
Reaction Name (Idx in AraCOREred) Mean Flux G
Mean Flux M
Mean ratio (G/M)
Ho: 𝑽𝑮 = 𝑽𝑴
Ho: 𝑽𝑴 > 𝑽𝑮
Ho: 𝑽𝑮 > 𝑽𝑴
SubSystem
PSII photosystem II (1) 0.125 0.125 1.000 - - - light reactions
Cb6f cytochrom b6f complex (2) 0.250 0.250 1.000 - - - light reactions
PSI photosystem I (3) 0.500 0.500 1.000 - - - light reactions
ATPase
ATPase (5) 0.107 0.107 1.000 - - - light reactions
1 PEP carboxylase (54) 0.420 0.011 37.190 0 0 1.000 gluconeogenesis
2 Mal dehydrogenase (115) 0.161 0.086 1.866 0 0 1.000 pyruvate metabolism
3 Dicarboxylate transporter (339) 0.223 0.011 19.971 0 0 1.000 transport
4 Mal dehydrogenase (113) 0.221 0.009 24.697 0 0 1.000 pyruvate metabolism
5 CO2 diffusion [Forward] (374) 0 0.013 0 0 1.000 0 transport
5 CO2 diffusion [Backward] (374) 0.199 7.085e-08 2.812e+06 0 0 1.000 transport
6 Import CO2 (413) 0.021 0.021 1.000 0 1.000 0 import
7 HCO3 dehydratase (152) 0.420 0.011 37.190 0 0 1.000 carbon fixation
8 Glu synthase (FeS-Fd) (179) 0.120 1.670e-04 719.020 0 0 1.000 glutamate synthesis
9 ferredoxin-NADP reductase (4) 0.130 0.250 0.520 0 1.000 0 light reactions
10 Export O2 (420) 0.020 0.020 1.000 0 1.000 0 export
11 TP isomerase [Forward] (9) 0.854 0.825 1.035 0 0 1.000 Calvin-Benson cycle, glycolysis
12 TP/Pi translocator [Forward] (328) 0.856 1.000 0.856 0 1.000 0 transport
13 Di-/ri-carboxylate carrier [Forward] (346)
0.362 0.335 1.079 0 0 1.000 transport
13 Di-/ri-carboxylate carrier [Backward] (346)
0.355 0.335 1.060 0 0 1.000 transport
13 Di-/ri-carboxylate carrier [Forward] (347)
0.362 0.338 1.069 0 0 1.000 transport
13 Di-/ri-carboxylate carrier [Backward] (347)
0.332 0.309 1.076 0 0 1.000 transport
13 Di-/ri-carboxylate carrier [Forward] (348)
0.327 0.310 1.056 1.455e-05 7.273e-06 1.000 transport
13 Di-/ri-carboxylate carrier [Backward] (348)
0.332 0.305 1.089 0 0 1.000 transport
14 Di-/ri-carboxylate carrier [Forward] (343)
0.249 0.208 1.199 0 0 1.000 transport
14 Di-/ri-carboxylate carrier [Backward] (343)
0.753 0.720 1.046 0 0 1.000 transport
14 Di-/ri-carboxylate carrier [Forward] (344)
0.022 0.194 0.113 0 1.000 0 transport
14 Di-/ri-carboxylate carrier [Backward] (344)
0.058 0 Inf 0 0 1.000 transport
14 Di-/ri-carboxylate carrier [Forward] (345)
0 0.693 0 0 1.000 0 transport
14 Di-/ri-carboxylate carrier [Backward] (345)
0.022 0.194 0.113 0 1.000 0 transport
15 Mal dehydrogenase [Backward] (80) 0.036 7.590e-04 47.157 0 0 1.000 tricarboxylic acid cycle, glyoxylate cycle
15 Mal dehydrogenase (117) 0 0 0 - - - pyruvate metabolism
16 FBP aldolase [Forward] (35) 0.394 0.405 0.973 0 1.000 0 sucrose synthesis, gluconeogenesis, glycolysis
17 FBPase (36) 0.125 0.125 1.000 - - - sucrose synthesis, gluconeogenesis, glycolysis
17 PPi-dep. Phosphofructokinase [Backward] (136)
0.250 0.250 1.000 - - - pyrophosphate recycling
18 G6P isomerase [Forward] (39) 0.500 0.500 1.000 - - - sucrose synthesis, sucrose degradation, gluconeogenesis
19 Phosphoglucomutase [Forward] (40) 0.107 0.107 1.000 - - - sucrose synthesis, sucrose degradation
20 TP/Pi translocator [Forward] (327) 0.420 0.011 37.190 0 0 1.000 transport
20 TP/Pi translocator [Backward] (327) 0.161 0.086 1.866 0 0 1.000 transport

Table S7. Activity of the CBC and starch metabolism in G and M cells after imposing additional
experimental constraints. This table shows the analogous results to that of Table S3, when additional
constraints are taken in consideration. Concretely, the carboxylation to oxygenation ratio of RubisCO is
constrained to stay within 1.5 and 4. Additionally, the flux through the reactions in the CBC: the sedoheptulose
1,7-bisphosphate aldolase and the sedoheptulose-1,7-bisphosphatase is constrained to carry a positive flux
(Details in Materials & Methods). A horizontal bar indicates a failure of the test due to distributions consisting
of a fixed value. Reaction names and index numbers in accord with AraCOREred.
Reaction [direction](Idx in GEM)
Mean Flux G Mean Flux M Mean ratio (G/M)
Ho: 𝑽𝑮 = 𝑽𝑴
Ho: 𝑽𝑴 > 𝑽𝑮
Ho: 𝑽𝑮 > 𝑽𝑴
CBC
RuBisCO Carboxylation (6) 0.022 0.022 1.000 0 1.000 0
RuBisCO Oxygenation( 85) 0.005 0.005 1.000 0 1.000 0
PGA kinase [Forward] (7) 0.467 0.255 1.832 0 0 1.000
GAP dehydrogenase (8) 0.864 0.959 0.901 0 1.000 0
TP isomerase [Forward] (9)
0.854 0.825 1.035 0 0 1.000
FBP aldolase [Forward] (10)
5.544e-04 0 Inf 0 0 1.000
FBPase (11) 0.001 0.001 1.000 - - -
F6P transketolase (12) 0.009 0.009 1.000 0 1.000 0
SBP aldolase (13) 0.001 0.001 1.000 - - -
SBPase (14) 0.001 0.001 1.000 - - -
S7P transketolase (15) 0.009 0.009 1.000 0 1.000 0
Ru5P epimerase (16) 0.018 0.018 1.000 0 1.000 0
R5P isomerase (17) 0.009 0.009 1.000 0 1.000 0
Ru5P kinase (18) 0.027 0.027 1.000 0 1.000 0
PGA kinase [Backward] (7) 0 0 0 - - -
TP isomerase [Backward] (9)
0 0 0 - - -
FBP aldolase [Backward] (10)
0.004 0.176 0.021 0 1.000 0
Starch metabolism
starch synthase (22) 2.949e-04 2.949e-04 1.000 0 0 1.000
starch synthase (23) 2.975e-04 3.065e-04 0.971 0 1.000 0
starch synthase (24) 2.632e-06 1.203e-05 0.219 0 1.000 0
amylase (26) 2.632e-06 2.106e-05 0.125 0 1.000 0
disproportionating enzyme (28)
2.239e-08 9.423e-06 0.002 0 1.000 0
disproportionating enzyme (29)
0 9.031e-06 0 0 1.000 0
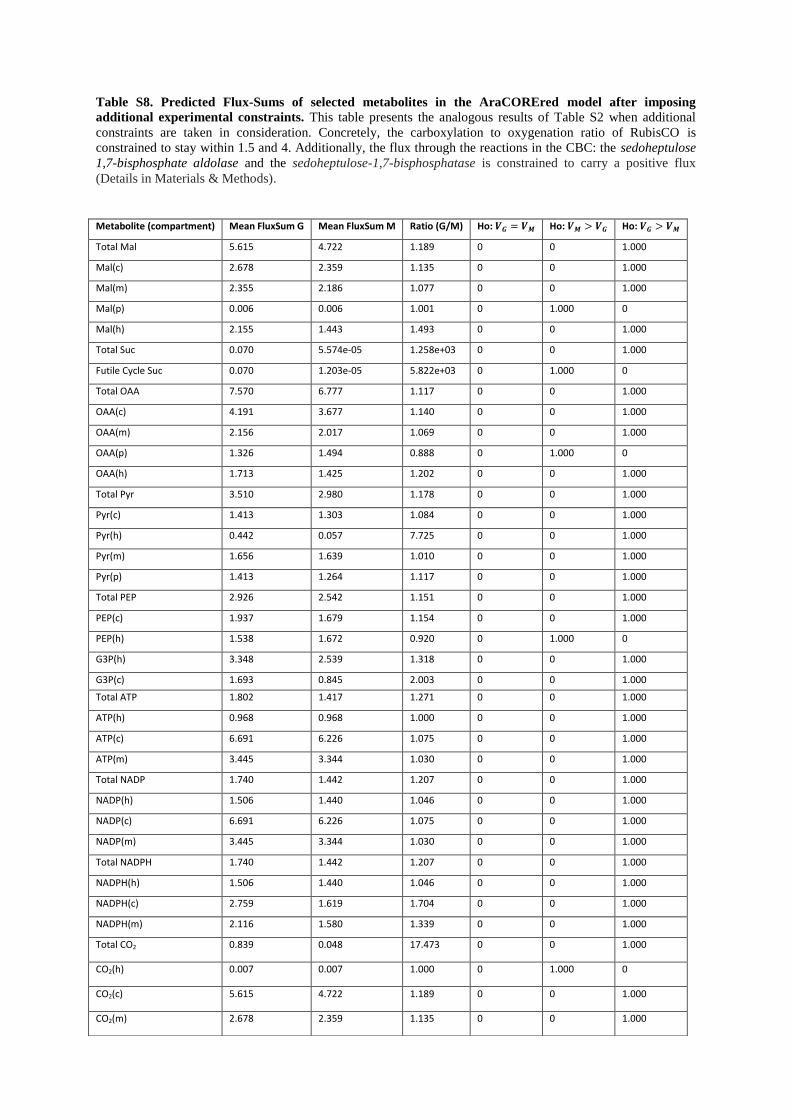
Table S8. Predicted Flux-Sums of selected metabolites in the AraCOREred model after imposing
additional experimental constraints. This table presents the analogous results of Table S2 when additional
constraints are taken in consideration. Concretely, the carboxylation to oxygenation ratio of RubisCO is
constrained to stay within 1.5 and 4. Additionally, the flux through the reactions in the CBC: the sedoheptulose
1,7-bisphosphate aldolase and the sedoheptulose-1,7-bisphosphatase is constrained to carry a positive flux
(Details in Materials & Methods).
Metabolite (compartment) Mean FluxSum G Mean FluxSum M Ratio (G/M) Ho: 𝑽𝑮 = 𝑽𝑴 Ho: 𝑽𝑴 > 𝑽𝑮 Ho: 𝑽𝑮 > 𝑽𝑴
Total Mal 5.615 4.722 1.189 0 0 1.000
Mal(c) 2.678 2.359 1.135 0 0 1.000
Mal(m) 2.355 2.186 1.077 0 0 1.000
Mal(p) 0.006 0.006 1.001 0 1.000 0
Mal(h) 2.155 1.443 1.493 0 0 1.000
Total Suc 0.070 5.574e-05 1.258e+03 0 0 1.000
Futile Cycle Suc 0.070 1.203e-05 5.822e+03 0 1.000 0
Total OAA 7.570 6.777 1.117 0 0 1.000
OAA(c) 4.191 3.677 1.140 0 0 1.000
OAA(m) 2.156 2.017 1.069 0 0 1.000
OAA(p) 1.326 1.494 0.888 0 1.000 0
OAA(h) 1.713 1.425 1.202 0 0 1.000
Total Pyr 3.510 2.980 1.178 0 0 1.000
Pyr(c) 1.413 1.303 1.084 0 0 1.000
Pyr(h) 0.442 0.057 7.725 0 0 1.000
Pyr(m) 1.656 1.639 1.010 0 0 1.000
Pyr(p) 1.413 1.264 1.117 0 0 1.000
Total PEP 2.926 2.542 1.151 0 0 1.000
PEP(c) 1.937 1.679 1.154 0 0 1.000
PEP(h) 1.538 1.672 0.920 0 1.000 0
G3P(h) 3.348 2.539 1.318 0 0 1.000
G3P(c) 1.693 0.845 2.003 0 0 1.000
Total ATP 1.802 1.417 1.271 0 0 1.000
ATP(h) 0.968 0.968 1.000 0 0 1.000
ATP(c) 6.691 6.226 1.075 0 0 1.000
ATP(m) 3.445 3.344 1.030 0 0 1.000
Total NADP 1.740 1.442 1.207 0 0 1.000
NADP(h) 1.506 1.440 1.046 0 0 1.000
NADP(c) 6.691 6.226 1.075 0 0 1.000
NADP(m) 3.445 3.344 1.030 0 0 1.000
Total NADPH 1.740 1.442 1.207 0 0 1.000
NADPH(h) 1.506 1.440 1.046 0 0 1.000
NADPH(c) 2.759 1.619 1.704 0 0 1.000
NADPH(m) 2.116 1.580 1.339 0 0 1.000
Total CO2 0.839 0.048 17.473 0 0 1.000
CO2(h) 0.007 0.007 1.000 0 1.000 0
CO2(c) 5.615 4.722 1.189 0 0 1.000
CO2(m) 2.678 2.359 1.135 0 0 1.000

Table S9. Redistribution of the percentage of 13
C label enrichment in primary metabolites. M and G cells
were fed with 13
-NaHCO3 and harvested after 30 min and 60 min in the light. Values in bold and underline type
are significantly different between M and G cells according to Students t-test (P <0.05) in the same time point.
Data presented are mean ± SE (n = 3).
% of 13C enrichment
Metabolite m/z M30 SE M60 SE GC30 SE GC60 SE
Gly 102 0.010 0.004 0.005 0.001 0.015 0.003 0.006 0.002
Ser 306 0.016 0.014 0.009 0.005 0.007 0.004 0.036 0.004
Ser 204 0.101 0.052 0.060 0.020 0.111 0.036 0.097 0.007
Homoserine 128 0.449 0.272 0.380 0.028 0.282 0.124 0.332 0.237
Glycolate 205 0.008 0.008 0.007 0.007 0.015 0.008 0.017 0.008
Val 218 0.240 0.180 0.095 0.091 0.051 0.027 0.162 0.035
Ala 188 0.416 0.198 0.361 0.141 1.476 1.260 0.459 0.355
Thr 219 0.458 0.238 0.342 0.132 0.795 0.330 0.634 0.067
Thr 291 0.927 0.438 0.748 0.260 1.489 0.447 1.361 0.118
Pro 142 0.197 0.100 0.164 0.021 0.321 0.151 0.367 0.012
Asp 218 0.018 0.018 0.012 0.012 1.638 0.947 0.786 0.622
Asp 232 0.045 0.004 0.037 0.002 0.078 0.005 0.038 0.001
Leu 158 0.034 0.000 0.033 0.000 0.031 0.002 0.034 0.002
Ile 218 0.038 0.038 0.091 0.091 0.068 0.049 0.203 0.101
Glu 156 0.010 0.001 0.014 0.004 0.020 0.009 0.022 0.007
Glycerate 292 1.676 0.636 1.922 0.653 3.521 0.069 3.609 0.746
Lactate 117 0.111 0.075 0.421 0.033 0.344 0.172 0.268 0.163
Glycerol 293 0.072 0.041 0.081 0.043 0.075 0.055 0.114 0.018
Succ 172 0.176 0.080 0.283 0.100 0.752 0.154 0.506 0.044
Succ 247 0.219 0.071 0.266 0.102 0.954 0.071 0.607 0.039
Mal 233 0.040 0.001 0.053 0.010 0.100 0.001 0.041 0.002
Fum 245 0.098 0.026 0.084 0.014 0.094 0.033 0.128 0.019
GABA 174 0.015 0.003 0.024 0.008 nd nd nd nd
Erythritol 217 0.425 0.130 0.438 0.149 2.212 1.808 1.207 0.871
Sucrose 437 0.000015 0.000007 0.000018 0.000009 0.000104 0.000068 0.000036 0.000010

Table S10. Total 13
C-enrichment in primary metabolites. Experimental and statistical analysis as described
in the Table S9.
Total 13C enrichment
Metabolite m/z M30 SE M60 SE GC30 SE GC60 SE
Gly 102 3257 1665 4837 624 1083 496 4738 997
Ser 306 71.7 22.1 194.9 40.0 135.6 90.9 303.9 23.4
Ser 204 1642 976 1786 579 921 332 836 103
Homoserine 128 1524 976 628 44 1331 526 2202 1073
Glycolate 205 658 658 646 646 1212 609 1370 595
Val 218 30.3 7.2 20.9 13.7 7.3 4.7 13.2 0.9
Ala 188 694 513 715 335 479 228 69 36
Thr 219 276 105 270 75 136 38 128 13
Thr 291 735 253 740 201 400 104 377 49
Pro 142 251 92 186 24 133 50 52 15
Asp 218 12.0 12.0 12.5 12.5 14.8 1.7 8.9 4.7
Asp 232 1533 76 1303 37 2352 133 1154 6
Leu 158 499 23 514 29 386 31 437 33
Ile 218 1.84 1.84 8.88 8.88 2.72 1.36 17.59 7.21
Glu 156 6938 109 6594 2023 2249 566 2423 313
Glycerate 292 92.6 37.0 78.0 15.7 39.9 0.3 47.9 8.9
Lactate 117 356 251 148 13 349 130 500 230
Glycerol 293 3363 1273 2824 992 5972 2954 1522 283
Succ 172 5380 3759 1361 336 779 246 905 165
Succ 247 303 88 226 64 87 12 134 22
Mal 233 1341 31 1790 330 3242 41 1289 53
Fum 245 713 241 651 113 548 179 529 19
GABA 174 14330 2650 9640 3556 nd nd nd nd
Erythritol 217 206 53 186 43 133 64 60 15
Sucrose 437 477177 82661 607521 270298 427991 174100 486175 190880

Table S11. 13
C-enrichment in primary metabolites. Experimental and statistical analysis as described in
Table S9.
13C enrichment
Metabolite m/z M30 SE M60 SE GC30 SE GC60 SE
Gly 2TMS 102 4.7 0.2 5.1 0.1 3.6 0.7 5.0 0.2
Ser 306 0.8 0.5 1.1 0.2 1.0 0.6 3.3 0.1
Ser 204 8.9 0.6 9.2 0.4 8.9 0.5 8.9 0.2
Homoserine 128 16.1 0.3 15.4 0.1 15.9 0.5 16.5 0.0
Glycolate 205 2.3 2.3 2.1 2.1 4.3 2.1 4.8 2.1
Val 218 2.5 1.3 1.3 1.1 0.6 0.3 1.5 0.2
Ala 188 9.4 1.5 12.1 4.2 12.8 1.4 5.1 2.9
Thr 219 8.9 0.2 8.5 0.1 9.1 0.4 8.9 0.0
Thr 291 21.6 0.5 21.2 0.3 22.5 0.1 22.4 0.5
Pro 142 5.6 0.1 5.4 0.0 5.3 0.0 4.3 0.6
Asp 218 0.5 0.47 0.4 0.39 4.4 1.4 2.3 1.3
Asp 232 8.3 0.6 7.0 0.3 13.5 0.8 6.6 0.1
Leu 158 4.1 0.1 4.1 0.1 3.5 0.3 3.9 0.2
Ile 218 0.3 0.3 0.9 0.9 0.4 0.2 1.9 0.9
Glu 156 6.3 1.6 7.8 0.4 5.1 2.4 5.0 1.0
Glycerate 292 10.5 0.3 11.4 0.6 11.9 0.1 12.6 0.1
Lactate 117 5.3 2.6 7.9 0.6 8.8 0.2 8.1 0.2
Uracil 241 5.2 0.2 5.6 0.5 7.1 0.0 6.4 0.2
Uracil 255 9.1 0.1 9.3 0.1 10.8 0.4 10.8 0.1
Adipic acid 111 1.9 0.1 1.9 0.1 1.8 0.0 2.1 0.1
Adipic acid 141 6.0 0.6 5.9 0.2 6.0 0.3 6.5 0.3
Threonate 292 10.0 0.2 10.1 0.4 6.5 3.7 nd nd
Salicylic acid 267 8.8 1.2 9.3 1.1 nd nd nd nd
Glycerol 293 12.1 0.6 12.0 0.5 12.4 0.1 12.8 0.2
OXA 175 nd nd nd nd 14.5 0.3 nd nd
Succ 172 22.6 6.1 17.8 0.5 22.5 1.7 21.0 1.1
Succ 247 7.3 0.5 6.9 0.3 9.0 0.3 9.0 1.0
Mal 233 7.3 0.0 9.7 1.8 18.0 0.1 7.3 0.3
Citramalate 247 0.3 0.28 0.1 0.097 0.8 0.4 1.3 0.8
Fum 245 7.6 0.4 7.2 0.0 6.7 1.6 8.2 0.5
GABA 174 6.6 0.1 6.4 0.1 nd nd nd nd
Erythritol 217 8.6 0.2 8.3 0.2 9.3 1.0 6.6 1.8
myo inositol 191 4.9 4.9 4.8 4.8 7.2 4.1 11.6 2.1
Sucrose 437 2.5 0.8 2.5 0.1 4.7 0.3 3.7 0.4
Trehalose 169 3.9 2.2 5.6 2.8 5.1 2.7 5.0 2.5
Maltose 361 7.6 3.8 8.7 2.2 nd nd 8.1 0.3
Isomaltose 361 nd nd 12.6 0.6 nd nd nd nd

Table S12. Content of the metabolites analyzed in this study. The content (ng) of each metabolite was
obtained using the equation of a linear regression of the peak area obtained from different concentrations of
standard compounds.
Concentration (ng)
Metabolite M30 SE M60 SE GC30 SE GC60 SE
Gly 675.1 319.4 949.3 103.7 266.1 84.7 959.5 238.7
Ser 171.7 94.6 189.2 55.6 100.6 32.8 93.5 9.3
Homoserine 92.3 57.6 40.9 2.8 81.7 30.6 133.6 65.2
Glycolate 291.5 7.3 290.9 6.1 283.0 4.0 284.3 2.8
Val 17.1 4.7 29.4 8.4 9.6 2.1 9.3 0.7
Ala 71.7 54.4 58.7 32.7 42.1 22.1 23.4 8.4
Thr 34.5 12.5 34.8 9.3 17.8 4.7 16.8 1.8
Pro 44.2 15.9 34.3 4.3 24.8 9.4 11.7 2.0
Asp 184.4 3.9 187.1 3.9 174.1 0.9 175.0 1.5
Leu 120.6 2.3 124.9 3.7 111.3 0.8 112.8 1.5
Ile 17.2 6.2 22.5 6.3 9.9 2.8 10.0 0.7
Glu 673.4 207.5 697.1 263.6 224.6 92.0 324.1 146.4
Glycerate 8.9 3.7 7.0 1.7 3.4 0.0 3.8 0.7
Lactate 46.4 29.2 18.7 0.9 40.1 15.5 60.7 27.5
Salicylic acid 10.7 7.6 5.3 2.2 0.5 0.1 0.5 0.1
Glycerol 289.4 118.7 243.6 93.2 482.3 239.2 118.2 20.1
Succ 192.6 93.8 77.4 20.6 33.3 8.4 42.5 5.7
Mal 182.9 4.3 184.3 1.1 179.6 1.9 177.7 0.1
Fum 94.9 33.1 90.4 15.7 81.0 22.4 65.8 7.0
GABA 489.1 97.1 343.7 120.0 135.4 78.2 35.2 20.3
Erythritol 24.1 6.6 22.7 5.5 15.8 8.0 11.5 4.7
Sucrose 246540 86181 239692 101307 97619 43785 124067 39544

2) Map data to reactions
Ev rule: Gene 3 OR Gene 1 OR (Gene 3 AND Gene 2) OR (Gene 1 AND Gene 2)
Dv: max(Gene 3, Gene 1, min(Gene 3, Gene 2), min(Gene 1, Gene 2)) = 1.5
3) Obtain cell-specific flux distribution
4) Obtain AO space sample
1) Preprocess data
gene name – RMA value Gene 1– 1.1 Gene 2– 1.4 Gene 3 – 1.5
RMA (affy R package) Affymetrix probe names Arabidopsis gene names
D mapgene2rxn(GPR rules, gene names, RMA value)
V* RegrExLAD(AraCOREred,D)
VAO RegrExAOS(AraCOREred,D,V*)
𝑓𝑦 = |𝑣| + |𝑣𝑜𝑢𝑡(𝑘)|
𝑛
𝑘=1
5) Obtain flux-sum distributions per metabolite and compare between
cell-types h1 (MWW test, α = 0.05):
𝑣∗𝑜𝑢𝑡𝑚𝑖𝑛
(𝑅𝑒𝑔𝑟𝐸𝑥𝐹𝑉𝐴) 𝑣∗𝑜𝑢𝑡𝑚𝑎𝑥
(𝑅𝑒𝑔𝑟𝐸𝑥𝐹𝑉𝐴)

Figure S1. Schematic depiction of the workflow followed to obtain metabolic predictions specific to G and M cells. This schematic depiction is based on the toy metabolic model displayed in the top right: X first enters the system through the reaction, vin, which is dependent on the transporter Ein. X is then transformed to Y through v, which is dependent on Ev (coded by gene1-3). Finally Y diffuses spontaneously to the exterior (vout), and hence no genes are associated to this reaction. (1) In a first step, expression data is preprocessed, which includes data RMA normalization and mapping of array probe names to (Arabidopsis) gene names. (2) Gene expression values are then mapped to reactions in the metabolic model following the gene-protein-reaction rules contained in the model, which generates the vector D of mapped expression values. (3) In a third step, a cell-specific flux distribution that is closest to the mapped expression data integrated in the metabolic model is obtained through RegrExLAD. However, the optimal solution (i.e.,flux distribution) is not unique, and an alternative optima space (AO) exists. In this case, this is because D contains data to only two of the three reactions (vin and v) since vout has not associated gene-protein-reaction rule. Thus, vout can vary in an orthogonal direction to the plane, where D lies, without affecting the optimal value of the RegrExLAD objective function (see Appendix S1). (4) To account for this issue, the AO space is sampled through RegrExAOS and a sampled distribution of optimum flux values for vout is obtained. Additionally, the function RegrExFVA calculates the minimum and maximum values in the alternative optima space, as a means to validate the coverage of the random sample. (5) Finally, flux-sums are calculated for each metabolite across the previously obtained AO sample (here only depicted for the case of Y), thus obtaining another distribution of flux-sums. This process is applied to the two cell types, G and M cells, and the resulting AO flux and flux-sum distributions are compared through a Mann-Whitney-Wilcoxon (MWW) test. In this example, the alternative hypothesis (H1) states that the flux-sum distribution corresponding to G cells is greater than that of M cells, while the null hypothesis states that both distributions are indistinguishable. Here, the null hypothesis is rejected at a significant level of α = 0.05.
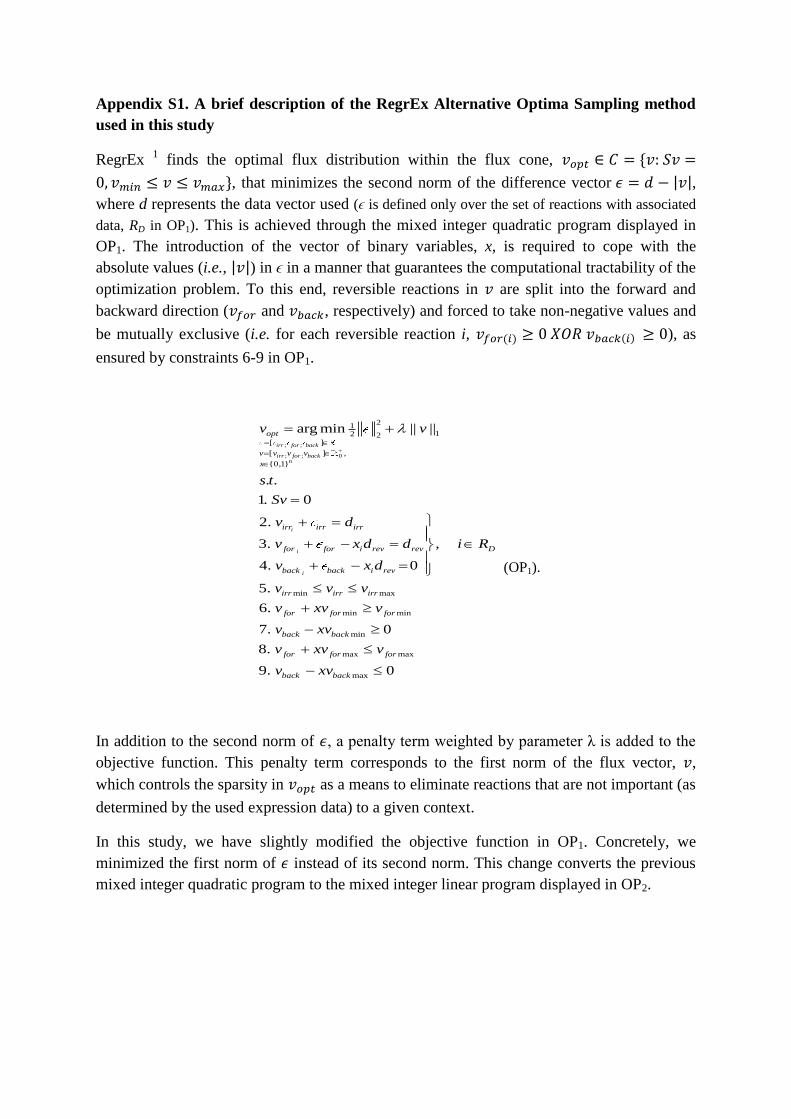
Appendix S1. A brief description of the RegrEx Alternative Optima Sampling method
used in this study
RegrEx 1 finds the optimal flux distribution within the flux cone, 𝑣𝑜𝑝𝑡 ∈ 𝐶 = {𝑣: 𝑆𝑣 =
0, 𝑣𝑚𝑖𝑛 ≤ 𝑣 ≤ 𝑣𝑚𝑎𝑥}, that minimizes the second norm of the difference vector 𝜖 = 𝑑 − |𝑣|,
where d represents the data vector used (ϵ is defined only over the set of reactions with associated
data, RD in OP1). This is achieved through the mixed integer quadratic program displayed in
OP1. The introduction of the vector of binary variables, x, is required to cope with the
absolute values (i.e., |𝑣|) in ϵ in a manner that guarantees the computational tractability of the
optimization problem. To this end, reversible reactions in 𝑣 are split into the forward and
backward direction (𝑣𝑓𝑜𝑟 and 𝑣𝑏𝑎𝑐𝑘, respectively) and forced to take non-negative values and
be mutually exclusive (i.e. for each reversible reaction i, 𝑣𝑓𝑜𝑟(𝑖) ≥ 0 𝑋𝑂𝑅 𝑣𝑏𝑎𝑐𝑘(𝑖) ≥ 0), as
ensured by constraints 6-9 in OP1.
; ; 0
;;
2
1
[
[ ] ,
{0,1}
2 2
1
]
arg min || ||
. .
1. 0
2.
3. ,
4. 0
5.
for bacirr
irr for backn
i
i
k
i
rev rev
rev
opt
v v v v
x
irr irr irr
for for i D
back back i
irr
v
v
v v
s t
S
d
x d d i R
d
v
v
v
x
min max
min min
min
max max
max
6.
7. 0
8.
9. 0
irr
for for for
back
for for for
back b
irr
bac
k
k
ac
x v
v v
v v
v
v v
v v
xv
x v
x
(OP1).
In addition to the second norm of 𝜖, a penalty term weighted by parameter λ is added to the
objective function. This penalty term corresponds to the first norm of the flux vector, 𝑣,
which controls the sparsity in 𝑣𝑜𝑝𝑡 as a means to eliminate reactions that are not important (as
determined by the used expression data) to a given context.
In this study, we have slightly modified the objective function in OP1. Concretely, we
minimized the first norm of 𝜖 instead of its second norm. This change converts the previous
mixed integer quadratic program to the mixed integer linear program displayed in OP2.
;
;
;
;
; ; 0
],
],
1
[
[
[ ] ,
{0,1}
arg min w ( || ||
. .
1. 0
2. ( )
)
3. (
irr for back
irr for back
irr for backn
i
i
T
opt
v v v v
x
ext
irrirr irr irr
for for
v
v
v
v v
s t
S
d
min max
min min
min
max max
max
,
4. ( ) 0
5.
6.
7. 0
8.
9. 0
10.
)
i
for rev rev D
back back back rev
irr irr
for for for
back back
for f
i
or f
rr
or
baback ck
v
v v v
v v
v
v v
v v
xd d i R
xd
x v
xv
x v
x
0
11. 0
lb O C
ub O C
r v v
r v v
(OP2).
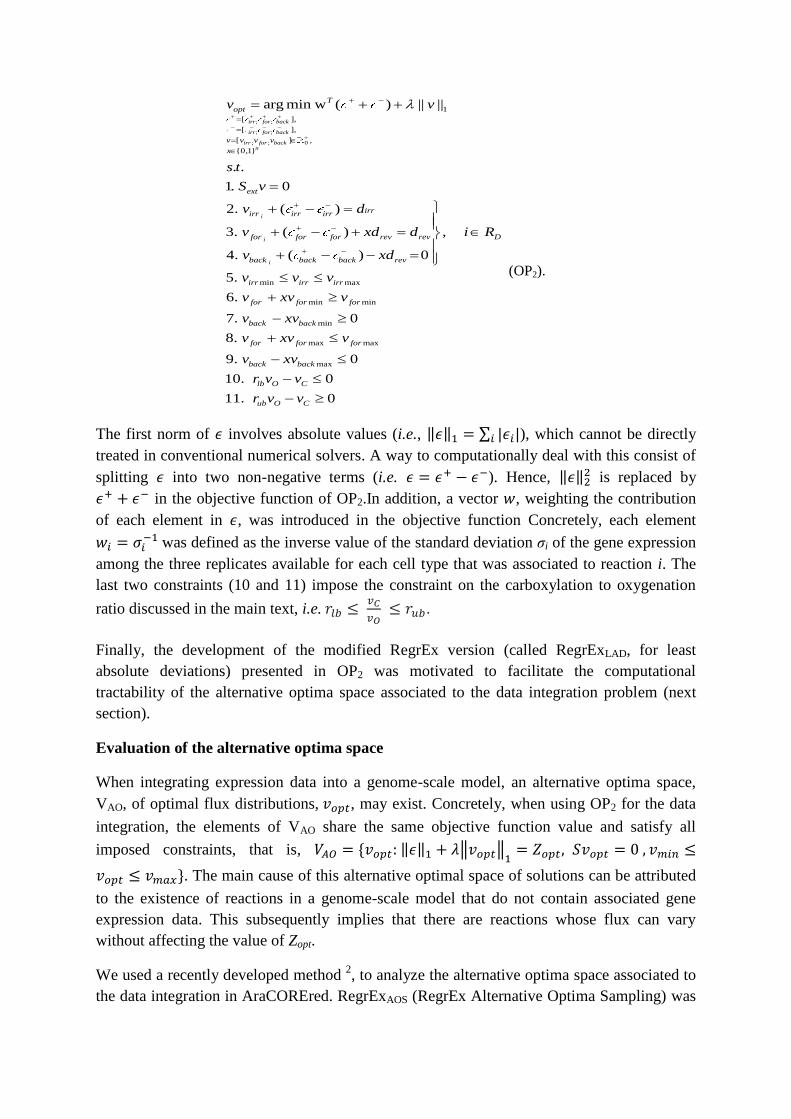
The first norm of 𝜖 involves absolute values (i.e., ‖𝜖‖1 = ∑ |𝜖𝑖|𝑖 ), which cannot be directly
treated in conventional numerical solvers. A way to computationally deal with this consist of
splitting 𝜖 into two non-negative terms (i.e. 𝜖 = 𝜖+ − 𝜖−). Hence, ‖𝜖‖22 is replaced by
𝜖+ + 𝜖− in the objective function of OP2.In addition, a vector 𝑤, weighting the contribution
of each element in 𝜖, was introduced in the objective function Concretely, each element
𝑤𝑖 = 𝜎𝑖−1 was defined as the inverse value of the standard deviation σi of the gene expression
among the three replicates available for each cell type that was associated to reaction i. The
last two constraints (10 and 11) impose the constraint on the carboxylation to oxygenation
ratio discussed in the main text, i.e. 𝑟𝑙𝑏 ≤ 𝑣𝐶
𝑣𝑂 ≤ 𝑟𝑢𝑏.
Finally, the development of the modified RegrEx version (called RegrExLAD, for least
absolute deviations) presented in OP2 was motivated to facilitate the computational
tractability of the alternative optima space associated to the data integration problem (next
section).
Evaluation of the alternative optima space
When integrating expression data into a genome-scale model, an alternative optima space,
VAO, of optimal flux distributions, 𝑣𝑜𝑝𝑡, may exist. Concretely, when using OP2 for the data
integration, the elements of VAO share the same objective function value and satisfy all
imposed constraints, that is, 𝑉𝐴𝑂 = {𝑣𝑜𝑝𝑡: ‖𝜖‖1 + 𝜆‖𝑣𝑜𝑝𝑡‖1
= 𝑍𝑜𝑝𝑡, 𝑆𝑣𝑜𝑝𝑡 = 0 , 𝑣𝑚𝑖𝑛 ≤
𝑣𝑜𝑝𝑡 ≤ 𝑣𝑚𝑎𝑥}. The main cause of this alternative optimal space of solutions can be attributed
to the existence of reactions in a genome-scale model that do not contain associated gene
expression data. This subsequently implies that there are reactions whose flux can vary
without affecting the value of Zopt.
We used a recently developed method 2, to analyze the alternative optima space associated to
the data integration in AraCOREred. RegrExAOS (RegrEx Alternative Optima Sampling) was

designed to generate a uniform sample of the alternative optima space associated to
RegrExLAD. To this end, it first generates a random flux vector, 𝑣𝑟𝑎𝑛𝑑, and then searches for
the closest flux distribution, 𝑣 ∈ 𝑉𝐴𝑂, to 𝑣𝑟𝑎𝑛𝑑 that belongs to the alternative optima space of
the previous RegrExLAD optimization. This is accomplished through the mixed integer linear
program depicted in OP3 (this process is repeated n times to obtain the uniform sample).
;
;
;
;
;
;
; ;
; ; 0
[
[
[
[
1],
],
],
[ ] ,
{0,1
]
}
,
2
. .
1 11 (OP )
1
min ||
2. ( (
13.
||
) )
irr for back
irr for back
irr for back
irr for back
irr for backn
v v v v
x
T T
opt opt
s t
w w
( )
( )
( ) ( )
1 1 || || || ||
14.
15.
16.
( )
( ) 0
irr irr irr rand irr
for for for rand rev
back back rand rev rand rev
optv v
v v
v xv
v xv v
(OP3).
OP3 inherits constraints 1-11 from OP2 and introduces two sets of new constraints. One set is
formed by constraints 12 and 13, and guarantees that the sampled flux distribution shares the
same objective value than the previously found 𝑣𝑜𝑝𝑡 in OP2. The other set consists of
constraints 14-16 introducing the auxiliary variables 𝛿 = 𝛿+ − 𝛿− = 𝑣𝑟𝑎𝑛𝑑 − 𝑣𝑜𝑝𝑡∗ , which
measure the distance of an alternative optimum flux distribution to the randomly generated
𝑣𝑟𝑎𝑛𝑑. In addition, 𝛿 is partitioned into the set of irreversible and the forward and reverse
directions of reversible reactions, which simplifies the computation of the first norm of 𝛿 in
the objective function.
In addition to generating a sample of alternative optima flux distributions with RegrExAOS,
we also developed a complementary approach to evaluate the extreme flux values within the
alternative optima space. This approach, akin to the Flux Variability Analysis 3 procedure,
minimizes and maximizes the flux 𝑣𝑗 through each reaction j in the genome-scale metabolic
model such that the flux distribution remains in the alternative optima space, that is, 𝑣 ∈ 𝑉𝐴𝑂.
Computing the extreme flux values within the alternative optima space serves to assess the
quality of the sampling performed by RegrExAOS. Concretely, it allows evaluating whether
the sample covers the whole range of flux values within the alternative optima space—i.e., it
is uniform. This evaluation is importance, since a sample covering the whole allowable range
renders not only statistically significant, but also quantitatively accurate results. This is
fundamental when comparing alternative optimal distributions of flux values between
different metabolic contexts. Our complementary approach, which we term RegrExFVA
(RegrEx Flux Variability Analysis), iterates the mixed integer linear program in OP4 through
each reaction j in the metabolic model (one time minimizing 𝑣𝑗 , the other maximizing it).

Constraints 1-11 are again inherited from OP1, and constraints 12 and 13, which ensure
𝑣 ∈ 𝑉𝐴𝑂, are identical to the corresponding ones in OP3.
;
;
; ; 0
;
;
[
[
[ ] ,
{0,1}
2
1
],
],
1
. .
1 11
min/
(OP )
12. ( (
13. || || || ||
max
) )
irr for back
irr for back
irr for backn
v v v v
x
T T
opt opt
opt
j
s t
w w
v v
v
(OP4).
References:
1. Robaina Estévez, S. & Nikoloski, Z. Context-Specific Metabolic Model Extraction
Based on Regularized Least Squares Optimization. PLoS One 10, e0131875 (2015).
2. Robaina Estévez, S. & Nikoloski, Z. On the effects of alternative optima in context-
specific metabolic model predictions. Plos Comp.Biol. In Press. (2017).
3. Mahadevan, R. & Schilling, C. H. The effects of alternate optimal solutions in
constraint-based genome-scale metabolic models. Metab. Eng. 5, 264–276 (2003).