Supplementary revised Bettini et al SREP1622537 · 1 Supplementary Information Title: Food-grade...
13
1 Supplementary Information Title: Food-grade TiO 2 impairs intestinal and systemic immune homeostasis, initiates preneoplastic lesions and promotes aberrant crypt development in the rat colon Sarah Bettini 1 , Elisa Boutet-Robinet 1 , Christel Cartier 1 , Christine Comera 1 , Eric Gaultier 1 , Jacques Dupuy 1 , Nathalie Naud 1 , Sylviane Taché 1 , Patrick Grysan 2 , Solenn Reguer 3 , Nathalie Thieriet 4 , Matthieu Réfrégiers 3 , Dominique Thiaudière 3 , Jean-Pierre Cravedi 1 , Marie Carrière 5,6 , Jean-Nicolas Audinot 2 , Fabrice H Pierre 1 , Laurence Guzylack-Piriou 1,* , and Eric Houdeau 1,* 1 Toxalim (Research Centre in Food Toxicology), Université de Toulouse, INRA, ENVT, INP- Purpan, UPS, Toulouse, France; 2 Luxembourg Institute of Science and Technology (LIST), Materials Research and Technology (MRT), Advanced Instrumentation for Ion Nano- Analytics (IANA), L-4362 Esch-sur-Alzette, Luxembourg; 3 Synchrotron SOLEIL, F-91192 Gif-sur-Yvette, France; 4 French Agency for Food, Environmental and Occupational Health and Safety (ANSES), F-94701 Maisons-Alfort, France; 5 Université Grenoble-Alpes, INAC- LCIB, Laboratoire Lésions des Acides Nucléiques, 17 rue des Martyrs, F-38000 Grenoble, France; 6 CEA, INAC-SCIB, Laboratoire Lésions des Acides Nucléiques, 17 rue des Martyrs, F-38000 Grenoble, France Supplementary Materials and Methods Particle Characterization Hydrodynamic diameter, polydispersity index and zeta potential of TiO 2 particles after dispersion protocol were measured by dynamic light scattering (ZetaSizer nano ZS; Malvern Instruments Ltd.). The size and shape of TiO 2 particles were determined by transmission electron microscopy (TEM) (JEOL 1200EX), operated at 80 kV (226 particles analyzed). Element composition was assessed by TEM and energy dispersive X-ray (JEOL JEM-2100),
Transcript of Supplementary revised Bettini et al SREP1622537 · 1 Supplementary Information Title: Food-grade...

1
Supplementary Information
Title: Food-grade TiO2 impairs intestinal and systemic immune homeostasis, initiates
preneoplastic lesions and promotes aberrant crypt development in the rat colon
Sarah Bettini1, Elisa Boutet-Robinet1, Christel Cartier1, Christine Comera1, Eric Gaultier1,
Jacques Dupuy1, Nathalie Naud1, Sylviane Taché1, Patrick Grysan2, Solenn Reguer3, Nathalie
Thieriet4, Matthieu Réfrégiers3, Dominique Thiaudière3, Jean-Pierre Cravedi1, Marie
Carrière5,6, Jean-Nicolas Audinot2, Fabrice H Pierre1, Laurence Guzylack-Piriou1,*, and Eric
Houdeau1,*
1Toxalim (Research Centre in Food Toxicology), Université de Toulouse, INRA, ENVT, INP-Purpan, UPS, Toulouse, France; 2Luxembourg Institute of Science and Technology (LIST), Materials Research and Technology (MRT), Advanced Instrumentation for Ion Nano-Analytics (IANA), L-4362 Esch-sur-Alzette, Luxembourg; 3Synchrotron SOLEIL, F-91192 Gif-sur-Yvette, France; 4French Agency for Food, Environmental and Occupational Health and Safety (ANSES), F-94701 Maisons-Alfort, France; 5Université Grenoble-Alpes, INAC-LCIB, Laboratoire Lésions des Acides Nucléiques, 17 rue des Martyrs, F-38000 Grenoble, France; 6CEA, INAC-SCIB, Laboratoire Lésions des Acides Nucléiques, 17 rue des Martyrs, F-38000 Grenoble, France
Supplementary Materials and Methods
Particle Characterization
Hydrodynamic diameter, polydispersity index and zeta potential of TiO2 particles after
dispersion protocol were measured by dynamic light scattering (ZetaSizer nano ZS; Malvern
Instruments Ltd.). The size and shape of TiO2 particles were determined by transmission
electron microscopy (TEM) (JEOL 1200EX), operated at 80 kV (226 particles analyzed).
Element composition was assessed by TEM and energy dispersive X-ray (JEOL JEM-2100),

2
operated at 200 kV. The X-ray absorption near edge structure (XANES) analysis was
performed at the Synchrotron SOLEIL (Gif-sur-Yvette, France) on DiffAbs beamline, using a
monochromatic x-ray beam obtained from a Si(111) double crystal monochromator. For
XANES spectra, the beam size was basically 300x300 µm2.
Comet Assay. The alkaline comet assay was used to detect strand breaks and alkali-labile
sites as previously described1. PP and scraped colonic mucosa were collected in cold NaCl-
ethylenediamine tetra-acetic acid (EDTA) (0.075 M/0.024 M, respectively; pH=7.5). Cells
were isolated using a Dounce homogenizer, embedded in 0.7% low melting point agarose
(Sigma-Aldrich) and laid on CometAssay® HT Slide (Trevigen). A parallel digestion with
formamido pyrimidine glycosylase (FPG, gift from Serge Boiteux), allowing the detection of
oxidative damages, was performed as already described2. Fifty cells per slide and 2 slides per
sample were analyzed. The extent of DNA damage was evaluated for each cell through the
measurement of intensity of all tail pixels divided by the total intensity of all pixels in head
and tail of comet. The median from these 100 values was calculated, and named % tail DNA.
Myeloperoxidase Activity Assay. For assessment of neutrophilia in intestinal mucosa, the
activity of the enzyme myeloperoxidase (MPO), a marker of polymorphonuclear neutophils
granules, was determined in tissue segments of the jejunum and colon (1 cm) as previously
described3.
Ex Vivo Cytotoxicity and Proliferation Assay. Isolated cells from PP were labeled with
CellTrace® Violet (Life Technologies) to assess proliferation. Cells were seeded on 24-well
plates at 6*105 cells/well in Cerrotini medium, and incubated with 2 µg/mL concanavalin A
for 4 days with E171 or NM-105 (0, 37, 75 or 150 µg/mL). After washing, T cells were

3
stained with anti-TCRαβ (R73) and with To-pro-3 (Life Technologies) to follow cell viability
by flow cytometry.
Western blot analysis for caspase-1. Colons of rats treated with vehicle or E171 (n=4 per
group) for 100 days were collected in dry ice and stored at -80°C until processing. Proteins
were extracted with RIPA buffer containing protease inhibitor cocktail (Roche Diagnostics),
and total protein concentrations were assessed using a BCA Protein Assay kit (Thermo
Scientific, Rockford, USA). Equal amounts of protein extracts (30 µg) were separated in 12%
FastCast TGX Bio-Rad gels and transferred onto a blotting membrane. The membrane was
blocked for 1 h at RT with Odyssey blocking buffer (Rockland, Tebu-bio, France) and then
incubated overnight at 4°C with primary mouse anti-caspase-1 antibody (R&D Systems;
1:1000 in blocking buffer). After washing, the membranes were incubated for 1 h at RT with
secondary fluorescent IRDye *680 anti-mouse antibody (LI-COR, Lincoln, USA; 1:10000 in
blocking buffer). An Odyssey Infrared Imaging Scanner (LiCor ScienceTec, Les Ulis, France)
was used to detect the intensity of full length (45 kD) and cleaved (20 kD) caspase-1 protein
bands.
Supplementary Results
Size and Crystal Form of Titanium Dioxide. The referent NM-105 batch of P25 has been
previously characterized4, and displayed mixed crystallinity with anatase the predominant
form (85% anatase : 15% rutile), and a mean particle diameter of 22±1 nm (range 10-45 nm).
As shown in Figure S1a, TEM-EDX analysis showed the E171 sample (i.e. food-grade TiO2)
close to purity. Primary particle size distribution ranged from 20 to 340 nm (118±53 nm), and
44.7% were below 100 nm in diameter (Fig. S1b). Furthermore, the hydrodynamic diameter
of E171 in our study was of 373±20 nm (Supplementary Fig. S1c), consistent with

4
measurements reported for other commercial food-grade TiO2 ranging from 127 to 504 nm
depending on the supplier5-6. The zeta potentials were 5.03±0.02 mV and -23.9±2.4 mV for
NM-105 and E171, respectively (Supplementary Fig. S1c), suggesting a higher stability of the
E171 suspension in water as compared to NM-105. In Figure S1d, the fact that the XANES
spectra of titanium (Ti) overlapped between E171 and NM-105 indicated similar crystal form,
thus primarily composed of TiO2 anatase as commonly reported for other food-grade TiO26-7.
Altogether, these findings made our commercial E171 batch a representative TiO2 food
additive for oral toxicity study.

5
Supplementary Figures
Figure S1. Physico-chemical characteristics of E171 and NM-105 TiO2 particles. (a) EDX
spectrum and TEM image recorded on E171. EDX data indicates TiO2 particles to be close to
purity, being devoid of surface coatings with alumina, phosphate or silica (the presence of
copper corresponded to the TEM-EDX grid used as a sample support). TEM image shows
E171 particles displaying a spherical shape, found isolated and in small agglomerates when
dispersed in water before oral administration in rats (scale bar 200 nm). (b) Primary diameter
distribution of E171 particles, measured from 4 independent TEM images and a total of 226
particles. Dashed line shows 100 nm. (c) Hydrodynamic diameter (Z average), polydispersity
index (PdI) from DLS measurements and zeta potential (ζ) of E171 water suspension after
dispersion protocol according to Nanogenotox standard operating procedure. (d) XANES
spectra of E171 and NM-105 materials measured with synchrotron x-ray beam on the raw
powders. The fact that pre-peaks and post-edge XANES features overlay between TiO2
materials indicates similar crystal form, i.e., mainly composed of anatase.
Z average PdI ͏ (mV)
NM-105 192.23 ê 5.43 0.133 ê 0.014 5.013 ê 0.025
E171 373.5 ê 20.22 0.316ê0.048 -23.9 ê 2.36
c
4.95 4.96 4.97 4.98 4.99 5.00 5.01 5.020.00
0.25
0.50
0.75
1.00
1.25NM-105E171
Energy (keV)
XAN
ES (a
.u.)
d
ba
0 2 4 6 8 10 12keV
0
1
2
3
4
5
cps/eV4
C
CuTi
Cu
Cu
Ti
TiO
Energy (keV)
Energy (keV)
[0-20
]
[20-40
]
[40-60
]
[60-80
]
[80-10
0]
[100-1
20]
[120-1
40]
[140-1
60]
[160-1
80]
[180-2
00]
[200-2
20]
[220-2
40]
[240-2
60]
[260-2
80]
[280-3
00]
[300-3
20]
[320-3
40]
[340-3
60]
[360-3
80]
[380-4
00]
05
1015202530354045
Diameter (nm)
Num
ber o
f par
ticle
s

6
Figure S2. TiO2 particle size determination using confocal microscopy in water
suspension (before and immediately after ultrasonication) and in the luminal contents of
the jejunum and the colon collected 4 hours after a single gavage of 10 mg/kg E171 (n=4
rats). The laser reflection of TiO2 was detected with a magnification given 1 pixel = 50
nm. (a) Particle size measurements using Image J and Student’s t-test (***P<0.001) for
statistical analysis. Note the number of counted particles is indicated in brackets. (b, c, d)
Representative confocal micrographs of ultrasonicated TiO2 particles in water suspension
before the gavage (b), and along the intestine in the luminal content of the jejunum (c) and the
colon (d).
7
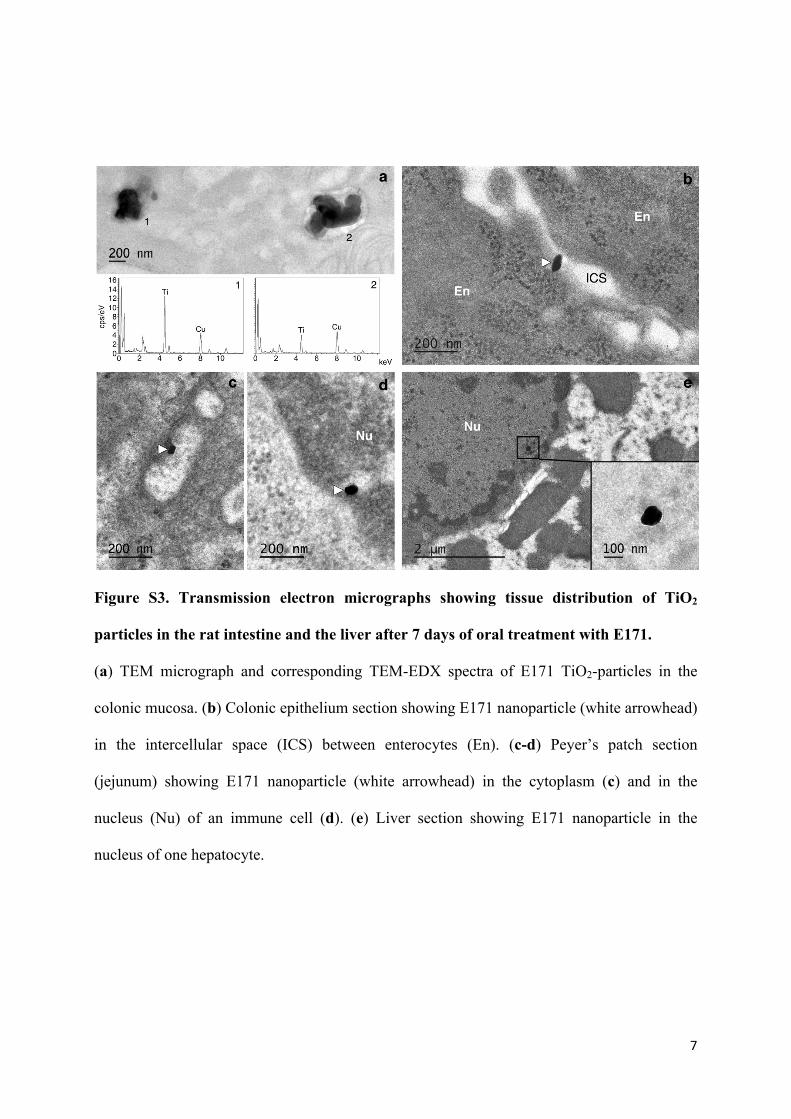
Figure S3. Transmission electron micrographs showing tissue distribution of TiO2
particles in the rat intestine and the liver after 7 days of oral treatment with E171.
(a) TEM micrograph and corresponding TEM-EDX spectra of E171 TiO2-particles in the
colonic mucosa. (b) Colonic epithelium section showing E171 nanoparticle (white arrowhead)
in the intercellular space (ICS) between enterocytes (En). (c-d) Peyer’s patch section
(jejunum) showing E171 nanoparticle (white arrowhead) in the cytoplasm (c) and in the
nucleus (Nu) of an immune cell (d). (e) Liver section showing E171 nanoparticle in the
nucleus of one hepatocyte.
8
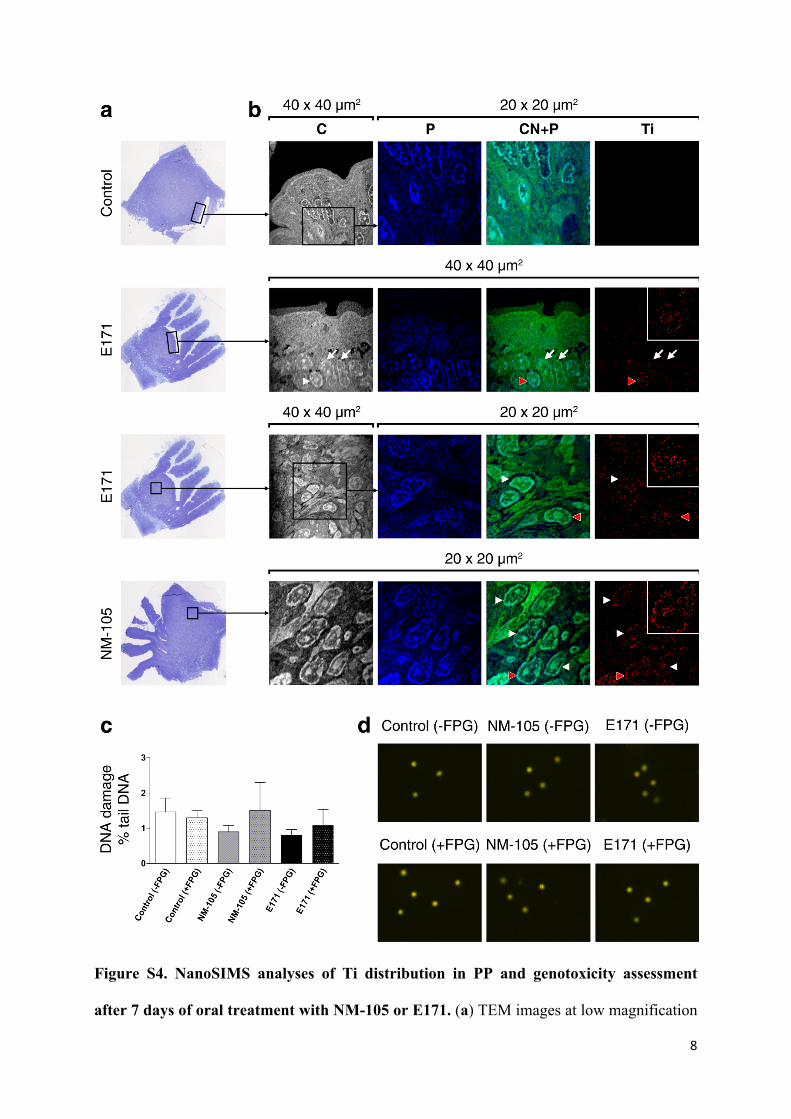
Figure S4. NanoSIMS analyses of Ti distribution in PP and genotoxicity assessment
after 7 days of oral treatment with NM-105 or E171. (a) TEM images at low magnification

9
on ultra-thin PP sections, and (b) nanoSIMS images of corresponding fields for elemental
distribution of carbon-nitrogen 12C14N (black and white), phosphorus 31P (blue), merge of 31P
and 12C14N (blue/green), and titanium oxide clusters 48Ti16O (red). Raster sizes in (b) were
40x40 or 20x20 µm2. The two first horizontal series of micrographs show PP tissue sections
from the surface epithelium in control rats and from rats exposed to E171 for 7 days. The two
following series show the central zone of PP tissue sections after E171 and NM-105 treatment
for 7 days. Note that the nucleus of immune cells (white arrowheads) is enriched in Ti
elements in contrast to epithelial cell nuclei (white arrows). Red arrowheads indicate enlarged
fields in upper squares. In (c), note the absence of genotoxic effects on PP cells as compared
to controls evaluated with alkaline comet assay without or with FPG (revealing DNA strand
breaks and oxidized DNA bases). (d) Representative images of (c). Data are means±s.e.m,
and no statistical difference between groups was observed (Kruskall-Wallis test, n=5
rats/group).
10
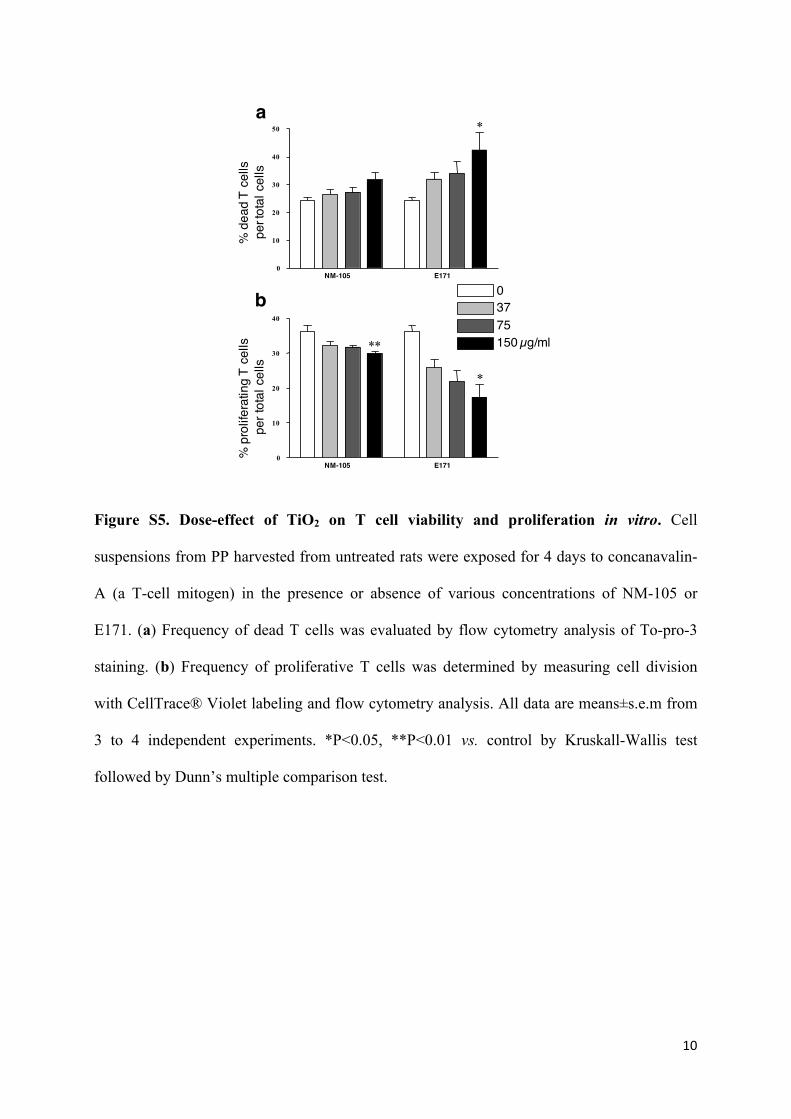
Figure S5. Dose-effect of TiO2 on T cell viability and proliferation in vitro. Cell
suspensions from PP harvested from untreated rats were exposed for 4 days to concanavalin-
A (a T-cell mitogen) in the presence or absence of various concentrations of NM-105 or
E171. (a) Frequency of dead T cells was evaluated by flow cytometry analysis of To-pro-3
staining. (b) Frequency of proliferative T cells was determined by measuring cell division
with CellTrace® Violet labeling and flow cytometry analysis. All data are means±s.e.m from
3 to 4 independent experiments. *P<0.05, **P<0.01 vs. control by Kruskall-Wallis test
followed by Dunn’s multiple comparison test.
% d
ead
Tce
llspe
r tot
al c
ells
% p
rolif
erat
ing
Tce
llspe
r tot
al c
ells
a
b 03775150 µg/ml
NM-105 E1710
10
20
30
40
50 *
NM-105 E1710
10
20
30
40
*
**

11
Figure S6. Western blot analysis of caspase-1 activation in the rat colonic mucosa after
100 days of oral treatment with E171. No detectable increase of caspase-1 cleavage was
observed in the colonic mucosa of E171-exposed rats.
Figure S7. Exposure to NM-105 TiO2 induces preferential cytotoxicity against
preneoplastic cells. Normal Apc+/+ and preneoplastic ApcMin/+ colon cells were exposed 24h
to 2.56 µg/mL or 25.6 µg/mL TiO2. *P<0.05 vs. Apc +/+, Student’s t-test.

12
Jejunum Colon
Control NM-105 E171 Control NM-105 E171 MPO 3160±424 2424±355ns 2862±526ns 686±119 611±146 ns 609±130 ns
TNF-α nd nd nd 5.4±1 8.3±0.3 ns 5.8±1.2
IL-10 nd nd nd 18±2.6 19±2.6 14±2.3
IL-1β 225±55 284±100 ns 145±46 ns 189±17 175±31 178±16
IFN-γ nd nd nd nd nd nd
IL-17 nd nd nd 9.9±1.1 10.2±1.9 10±0.3
Table S1. A 7 days oral treatment with E171 or NM-105 did not provoke inflammation
in the jejunal and colonic mucosa. Cytokine concentrations (pg/mg of proteins) and
myeloperoxydase activity (MPO, U/mg of protein) were evaluated in jejunal and colonic
tissues by ELISA and enzyme activity assay, respectively. Data are means±s.e.m. (n=5
rats/group); ns: not significant vs. control by Kruskall-Wallis test followed by Dunn’s
multiple comparison test; nd: not detectable.

13
References
1 Lebailly, P. et al. DNA damage in B and T lymphocytes of farmers during one pesticidesprayingseason.IntArchOccupEnvironHealth88,963-972(2015).
2 Azqueta,A., Arbillaga, L., Lopez deCerain,A.&Collins, A. Enhancing the sensitivity of thecomet assay as a genotoxicity test, by combining it with bacterial repair enzyme FPG.Mutagenesis28,271-277(2013).
3 Menard, S. et al. Food intolerance at adulthood after perinatal exposure to the endocrinedisruptorbisphenolA.FASEBJ28,4893-4900(2014).
4 Rasmussen, K. et al. TitaniumDioxide, NM-100, NM-101, NM-102, NM-103, NM-104, NM-105: Characterisation and Physico-Chemical Properties. Report No. EUR 26637 EN, (JRC,2014).
5 Weir, A., Westerhoff, P., Fabricius, L., Hristovski, K. & von Goetz, N. Titanium DioxideNanoparticlesinFoodandPersonalCareProducts.EnvironSciTechnol46,2242-2250(2012).
6 Yang, Y. et al. Characterization of food-grade titanium dioxide: the presence of nanosizedparticles.EnvironSciTechnol48,6391-6400(2014).
7 Faust,J.J.,Doudrick,K.,Yang,Y.,Westerhoff,P.&Capco,D.G.Foodgradetitaniumdioxidedisrupts intestinal brush border microvilli in vitro independent of sedimentation. Cell BiolToxicol30,169-188(2014).