Supplementary Note - Nature Research › original › nature-assets › ng › journal › v49...
19
Supplementary Note GTEx Collaborators Laboratory, Data Analysis & Coordinating Center (LDACC)—Analysis Working Group François Aguet 1 , Kristin G. Ardlie 1 , Beryl B. Cummings 1,2 , Ellen T. Gelfand 1 , Gad Getz 1,3 , Kane Hadley 1 , Robert E. Handsaker 1,4 , Katherine H. Huang 1 , Seva Kashin 1,4 , Konrad J. Karczewski 1,2 , Monkol Lek 1,2 , Xiao Li 1 , Daniel G. MacArthur 1,2 , Jared L. Nedzel 1 , Duyen T. Nguyen 1 , Michael S. Noble 1 , Ayellet V. Segrè 1 , Casandra A. Trowbridge 1 , Taru Tukiainen 1,2 Statistical Methods groups—Analysis Working Group Nathan S. Abell 5,6 , Brunilda Balliu 6 , Ruth Barshir 7 , Omer Basha 7 , Alexis Battle 8 , Gireesh K. Bogu 9,10 , Andrew Brown 11,12,13 , Christopher D. Brown 14 , Stephane E. Castel 15,16 , Lin S. Chen 17 , Colby Chiang 18 , Donald F. Conrad 19,20 , Nancy J. Cox 21 , Farhan N. Damani 8 , Joe R. Davis 5,6 , Olivier Delaneau 11,12,13 , Emmanouil T. Dermitzakis 11,12,13 , Barbara E. Engelhardt 22 , Eleazar Eskin 23,24 , Pedro G. Ferreira 25,26 , Laure Frésard 5,6 , Eric R. Gamazon 21,27,28 , Diego Garrido‐Martín 9,10 , Ariel D.H. Gewirtz 29 , Genna Gliner 30 , Michael J. Gloudemans 5,6,31 , Roderic Guigo 9,10,32 , Ira M. Hall 18,19,33 , Buhm Han 34 , Yuan He 35 , Farhad Hormozdiari 23 , Cedric Howald 11,12,13 , Hae Kyung Im 36 , Brian Jo 29 , Eun Yong Kang 23 , Yungil Kim 8 , Sarah Kim‐Hellmuth 15,16 , Tuuli Lappalainen 15,16 , Gen Li 37 , Xin Li 6 , Boxiang Liu 5,6,38 , Serghei Mangul 23 , Mark I. McCarthy 39,40,41 , Ian C. McDowell 42 , Pejman Mohammadi 15,16 , Jean Monlong 9,10,43 , Stephen B. Montgomery 5,6 , Manuel Muñoz‐Aguirre 9,10,44 , Anne W. Ndungu 39 , Dan L. Nicolae 36,45,46 , Andrew B. Nobel 47,48 , Meritxell Oliva 36,49, Halit Ongen 11,12,13 , John J. Palowitch 47 , Nikolaos Panousis 11,12,13 , Panagiotis Papasaikas 9,10 , YoSon Park 14 , Princy Parsana 8 , Anthony J. Payne 39 , Christine B. Peterson 50 , Jie Quan 51 , Ferran Reverter 9,10,52 , Chiara Sabatti 53,54 , Ashis Saha 8 , Michael Sammeth 55 , Alexandra J. Scott 18 , Andrey A. Shabalin 56 , Reza Sodaei 9,10 , Matthew Stephens 45,46 , Barbara E. Stranger 36,49,57 , Benjamin J. Strober 35 , Jae Hoon Sul 58 , Emily K. Tsang 6,31 , Sarah Urbut 46 , Martijn van de Bunt 39,40 , Gao Wang 46 , Xiaoquan Wen 59 , Fred A. Wright 60 , Hualin S. Xi 51 , Esti Yeger‐Lotem 7,61 , Zachary Zappala 5,6 , Judith B. Zaugg 62 , Yi‐Hui Zhou 60 Enhancing GTEx (eGTEx) groups Joshua M. Akey 29.63 , Daniel Bates 64 , Joanne Chan 5 , Lin S. Chen 17 , Melina Claussnitzer 1,65,66 , Kathryn Demanelis 17 , Morgan Diegel 64 , Jennifer A. Doherty 67 , Andrew P. Feinberg 35,68,69,70 , Marian S. Fernando 36,49 , Jessica Halow 64 , Kasper D. Hansen 68,71,72 , Eric Haugen 64 , Peter F. Hickey 72 , Lei Hou 1,73 , Farzana Jasmine 17 , Ruiqi Jian 5 , Lihua Jiang 5 , Audra Johnson 64 , Rajinder Kaul 64 , Manolis Kellis 1,73 , Muhammad G. Kibriya 17 , Kristen Lee 64 , Jin Billy Li 5 , Qin Li 5 , Xiao Li 5 , Jessica Lin 5,74 , Shin Lin 5,75 , Sandra Linder 5,6 , Caroline Linke 36,49 , Yaping Liu 1,73 , Matthew T. Maurano 76 , Benoit Molinie 1 , Stephen B. Montgomery 5,6 , Jemma Nelson 64 , Fidencio J. Neri 64 , Meritxell Oliva 36,49 , Yongjin Park 1,64 , Brandon L. Pierce 17 , Nicola J. Rinaldi 1,73 , Lindsay F. Rizzardi 68 , Richard Sandstrom 64 , Andrew Skol 36,49,57 , Kevin S. Smith 5,6 , Michael P. Snyder 5 , John Stamatoyannopoulos 64,74,77 , Barbara E. Stranger 36,49,57 , Hua Tang 5 , Emily K. Tsang 6,31 , Li Wang 1 , Meng Wang 5 , Nicholas Van Wittenberghe 1 , Fan Wu 36,49 , Rui Zhang 5 NIH Common Fund Concepcion R. Nierras 78 Nature Genetics: doi:10.1038/ng.3981
Transcript of Supplementary Note - Nature Research › original › nature-assets › ng › journal › v49...

Supplementary Note
GTEx Collaborators
Laboratory, Data Analysis & Coordinating Center (LDACC)—Analysis Working Group
François Aguet1, Kristin G. Ardlie1, Beryl B. Cummings1,2, Ellen T. Gelfand1, Gad Getz1,3, Kane Hadley1,
Robert E. Handsaker1,4, Katherine H. Huang1, Seva Kashin1,4, Konrad J. Karczewski1,2, Monkol Lek1,2,
Xiao Li1, Daniel G. MacArthur1,2, Jared L. Nedzel1, Duyen T. Nguyen1, Michael S. Noble1, Ayellet V.
Segrè1, Casandra A. Trowbridge1, Taru Tukiainen1,2
Statistical Methods groups—Analysis Working Group
Nathan S. Abell5,6, Brunilda Balliu6, Ruth Barshir7, Omer Basha7, Alexis Battle8, Gireesh K. Bogu9,10,
Andrew Brown11,12,13, Christopher D. Brown14, Stephane E. Castel15,16, Lin S. Chen17, Colby Chiang18,
Donald F. Conrad19,20, Nancy J. Cox21, Farhan N. Damani8, Joe R. Davis5,6, Olivier Delaneau11,12,13,
Emmanouil T. Dermitzakis11,12,13, Barbara E. Engelhardt22, Eleazar Eskin23,24, Pedro G. Ferreira25,26,
Laure Frésard5,6, Eric R. Gamazon21,27,28, Diego Garrido‐Martín9,10, Ariel D.H. Gewirtz29, Genna
Gliner30, Michael J. Gloudemans5,6,31, Roderic Guigo9,10,32, Ira M. Hall18,19,33, Buhm Han34, Yuan He35,
Farhad Hormozdiari23, Cedric Howald11,12,13, Hae Kyung Im36, Brian Jo29, Eun Yong Kang23, Yungil Kim8,
Sarah Kim‐Hellmuth15,16, Tuuli Lappalainen15,16, Gen Li37, Xin Li6, Boxiang Liu5,6,38, Serghei Mangul23,
Mark I. McCarthy39,40,41, Ian C. McDowell42, Pejman Mohammadi15,16, Jean Monlong9,10,43, Stephen B.
Montgomery5,6, Manuel Muñoz‐Aguirre9,10,44, Anne W. Ndungu39, Dan L. Nicolae36,45,46, Andrew B.
Nobel47,48, Meritxell Oliva36,49, Halit Ongen11,12,13, John J. Palowitch47, Nikolaos Panousis11,12,13,
Panagiotis Papasaikas9,10, YoSon Park14, Princy Parsana8, Anthony J. Payne39, Christine B. Peterson50,
Jie Quan51, Ferran Reverter9,10,52, Chiara Sabatti53,54, Ashis Saha8, Michael Sammeth55, Alexandra J.
Scott18, Andrey A. Shabalin56, Reza Sodaei9,10, Matthew Stephens45,46, Barbara E. Stranger36,49,57,
Benjamin J. Strober35, Jae Hoon Sul58, Emily K. Tsang6,31, Sarah Urbut46, Martijn van de Bunt39,40, Gao
Wang46, Xiaoquan Wen59, Fred A. Wright60, Hualin S. Xi51, Esti Yeger‐Lotem7,61, Zachary Zappala5,6,
Judith B. Zaugg62, Yi‐Hui Zhou60
Enhancing GTEx (eGTEx) groups
Joshua M. Akey29.63, Daniel Bates64, Joanne Chan5, Lin S. Chen17, Melina Claussnitzer1,65,66, Kathryn
Demanelis17, Morgan Diegel64, Jennifer A. Doherty67, Andrew P. Feinberg35,68,69,70, Marian S.
Fernando36,49, Jessica Halow64, Kasper D. Hansen68,71,72, Eric Haugen64, Peter F. Hickey72, Lei Hou1,73,
Farzana Jasmine17, Ruiqi Jian5, Lihua Jiang5, Audra Johnson64, Rajinder Kaul64, Manolis Kellis1,73,
Muhammad G. Kibriya17, Kristen Lee64, Jin Billy Li5, Qin Li5, Xiao Li5, Jessica Lin5,74, Shin Lin5,75, Sandra
Linder5,6, Caroline Linke36,49, Yaping Liu1,73, Matthew T. Maurano76, Benoit Molinie1, Stephen B.
Montgomery5,6, Jemma Nelson64, Fidencio J. Neri64, Meritxell Oliva36,49, Yongjin Park1,64, Brandon L.
Pierce17, Nicola J. Rinaldi1,73, Lindsay F. Rizzardi68, Richard Sandstrom64, Andrew Skol36,49,57, Kevin S.
Smith5,6, Michael P. Snyder5, John Stamatoyannopoulos64,74,77, Barbara E. Stranger36,49,57, Hua Tang5,
Emily K. Tsang6,31, Li Wang1, Meng Wang5, Nicholas Van Wittenberghe1, Fan Wu36,49, Rui Zhang5
NIH Common Fund
Concepcion R. Nierras78
Nature Genetics: doi:10.1038/ng.3981

NIH/NCI
Philip A. Branton79, Latarsha J. Carithers79,80, Ping Guan79, Helen M. Moore79, Abhi Rao79, Jimmie B.
Vaught79
NIH/NHGRI
Sarah E. Gould81, Nicole C. Lockart81, Casey Martin81, Jeffery P. Struewing81, Simona Volpi81
NIH/NIMH
Anjene M. Addington82, Susan E. Koester82
NIH/NIDA
A. Roger Little83
Biospecimen Collection Source Site—NDRI
Lori E. Brigham84, Richard Hasz85, Marcus Hunter86, Christopher Johns87, Mark Johnson88, Gene
Kopen89, William F. Leinweber89, John T. Lonsdale89, Alisa McDonald89, Bernadette Mestichelli89,
Kevin Myer86, Brian Roe86, Michael Salvatore89, Saboor Shad89, Jeffrey A. Thomas89, Gary Walters88,
Michael Washington88, Joseph Wheeler87
Biospecimen Collection Source Site—RPCI
Jason Bridge90, Barbara A. Foster91, Bryan M. Gillard91, Ellen Karasik91, Rachna Kumar91, Mark
Miklos90, Michael T. Moser91
Biospecimen Core Resource—VARI
Scott D. Jewell92, Robert G. Montroy92, Daniel C. Rohrer92, Dana R. Valley92
Brain Bank Repository—University of Miami Brain Endowment Bank
David A. Davis93, Deborah C. Mash93
Leidos Biomedical—Project Management
Anita H. Undale94, Anna M. Smith95, David E. Tabor95, Nancy V. Roche95, Jeffrey A. McLean95, Negin
Vatanian95, Karna L. Robinson95, Leslie Sobin95, Mary E. Barcus96, Kimberly M. Valentino95, Liqun Qi95,
Steven Hunter95, Pushpa Hariharan95, Shilpi Singh95, Ki Sung Um95, Takunda Matose95, Maria M.
Tomaszewski95
ELSI Study
Laura K. Barker97, Maghboeba Mosavel98, Laura A. Siminoff97, Heather M. Traino97
Genome Browser Data Integration & Visualization—EBI
Paul Flicek99, Thomas Juettemann99, Magali Ruffier99, Dan Sheppard99, Kieron Taylor99, Stephen J,
Trevanion99, Daniel R. Zerbino99
Nature Genetics: doi:10.1038/ng.3981

Genome Browser Data Integration & Visualization—UCSC Genomics Institute, University of
California Santa Cruz
Brian Craft100, Mary Goldman100, Maximilian Haeussler100, W. James Kent100, Christopher M. Lee100
Benedict Paten100, Kate R. Rosenbloom100, John Vivian100, Jingchun Zhu100
AFFILIATIONS
1The Broad Institute of Massachusetts Institute of Technology and Harvard University, Cambridge,
MA 02142, USA. 2Analytic and Translational Genetics Unit, Massachusetts General Hospital, Boston,
MA 02114, USA. 3Massachusetts General Hospital Cancer Center and Dept. of Pathology,
Massachusetts General Hospital, Boston, MA 02114, USA 4Department of Genetics, Harvard Medical
School, Boston, MA 02114, USA 5Department of Genetics, Stanford University, Stanford, CA 94305,
USA. 6Department of Pathology, Stanford University, Stanford, CA 94305, USA. 7Department of
Clinical Biochemistry and Pharmacology, Faculty of Health Sciences, Ben‐Gurion University of the
Negev, Beer‐Sheva 84105, Israel. 8Department of Computer Science, Johns Hopkins University,
Baltimore, MD 21218, USA. 9Centre for Genomic Regulation (CRG), The Barcelona Institute for
Science and Technology, Dr. Aiguader 88, 08003 Barcelona, Spain 10Universitat Pompeu Fabra (UPF),
Barcelona, Spain 11Department of Genetic Medicine and Development, University of Geneva Medical
School, 1211 Geneva, Switzerland. 12Institute for Genetics and Genomics in Geneva (iG3), University
of Geneva, 1211 Geneva, Switzerland. 13Swiss Institute of Bioinformatics, 1211 Geneva, Switzerland. 14Department of Genetics, Perelman School of Medicine, University of Pennsylvania, Philadelphia, PA
19104, USA. 15New York Genome Center, New York, NY 10013, USA. 16Department of Systems
Biology, Columbia University Medical Center, New York, NY 10032, USA. 17Department of Public
Health Sciences, The University of Chicago, Chicago, IL 60637, USA. 18McDonnell Genome Institute,
Washington University School of Medicine, St. Louis, MO 63108, USA. 19Department of Genetics,
Washington University School of Medicine, St. Louis, MO 63108, USA. 20Department of Pathology &
Immunology, Washington University School of Medicine, St. Louis, MO 63108, USA. 21Division of
Genetic Medicine, Department of Medicine, Vanderbilt University Medical Center, Nashville, TN
37232, USA. 22Department of Computer Science, Center for Statistics and Machine Learning,
Princeton University, Princeton, NJ 08540, USA. 23Department of Computer Science, University of
California, Los Angeles, CA 90095, USA. 24Department of Human Genetics, University of California,
Los Angeles, CA 90095, USA. 25Instituto de Investigação e Inovação em Saúde (i3S), Universidade do
Porto, 4200‐135 Porto, Portugal. 26Institute of Molecular Pathology and Immunology (IPATIMUP),
University of Porto, 4200‐625 Porto, Portugal. 27Department of Clinical Epidemiology, Biostatistics
and Bioinformatics, Academic Medical Center, University of Amsterdam, 1105 AZ Amsterdam, The
Netherlands. 28Department of Psychiatry, Academic Medical Center, University of Amsterdam, 1105
AZ Amsterdam, The Netherlands. 29Lewis Sigler Institute, Princeton University, Princeton, NJ 08540,
USA. 30Department of Operations Research and Financial Engineering, Princeton University,
Princeton, NJ 08540, USA. 31Biomedical Informatics Program, Stanford University, Stanford, CA
94305, USA. 32Institut Hospital del Mar d'Investigacions Mèdiques (IMIM), 08003 Barcelona, Spain. 33Department of Medicine, Washington University School of Medicine, St. Louis, MO 63108, USA. 34Department of Convergence Medicine, University of Ulsan College of Medicine, Asan Medical
Center, Seoul 138‐736, South Korea. 35Department of Biomedical Engineering, Johns Hopkins
University, Baltimore, MD 21218, USA. 36Section of Genetic Medicine, Department of Medicine, The
University of Chicago, Chicago, IL 60637, USA. 37Department of Biostatistics, Mailman School of
Public Health, Columbia University, New York, NY 10032, USA. 38Department of Biology, Stanford
University, Stanford, CA 94305, USA. 38Wellcome Trust Centre for Human Genetics, Nuffield
Department of Medicine, University of Oxford, Oxford, OX3 7BN, UK. 40Oxford Centre for Diabetes,
Nature Genetics: doi:10.1038/ng.3981
Endocrinology and Metabolism, University of Oxford, Churchill Hospital, Oxford, OX3 7LE, UK. 41Oxford NIHR Biomedical Research Centre, Churchill Hospital, Oxford, OX3 7LJ, UK. 42Computational
Biology & Bioinformatics Graduate Program, Duke University, Durham, NC 27708, USA. 43Human
Genetics Department, McGill University, Montreal, Quebec H3A 0G1, Canada. 44Departament
d'Estadística i Investigació Operativa, Universitat Politècnica de Catalunya, 08034 Barcelona, Spain. 45Department of Statistics, The University of Chicago, Chicago, IL 60637, USA. 46Department of
Human Genetics, The University of Chicago, Chicago, IL 60637, USA. 47Department of Statistics and
Operations Research, University of North Carolina, Chapel Hill, NC 27599, USA. 48Department of
Biostatistics, University of North Carolina, Chapel Hill, NC 27599, USA. 49Institute for Genomics and
Systems Biology, The University of Chicago, Chicago, IL 60637, USA.50Department of Biostatistics, The
University of Texas MD Anderson Cancer Center, 1400 Pressler Street, Houston, TX 77030, USA. 51Computational Sciences, Pfizer Inc, Cambridge, MA 02139, USA. 52Universitat de Barcelona, 08028
Barcelona, Catalonia, Spain. 53Department of Biomedical Data Science, Stanford University, Stanford,
CA 94305, USA. 54Department of Statistics, Stanford University, Stanford, CA 94305, USA. 55Institute
of Biophysics Carlos Chagas Filho (IBCCF), Federal University of Rio de Janeiro (UFRJ), 21941902 Rio
de Janeiro, Brazil. 56Department of Psychiatry, University of Utah, Salt Lake City, UT 84108, USA 57Center for Data Intensive Science, The University of Chicago, Chicago, IL 60637, USA. 58Department
of Psychiatry and Biobehavioral Sciences, University of California, Los Angeles, CA 90095, USA. 59Department of Biostatistics, University of Michigan, Ann Arbor, MI 48109, USA. 60Bioinformatics
Research Center and Departments of Statistics and Biological Sciences, North Carolina State
University, Raleigh, NC 27695, USA. 61National Institute for Biotechnology in the Negev, Beer‐Sheva,
84105 Israel. 62European Molecular Biology Laboratory, 69117 Heidelberg, Germany. 63Department
of Ecology and Evolutionary Biology, Princeton University, Princeton, NJ 08540, USA 64Altius Institute
for Biomedical Sciences, Seattle, WA 98121, USA. 65Beth Israel Deaconess Medical Center Harvard
Medical School, Boston, MA 02215, USA. 66University of Hohenheim, 70599 Stuttgart, Germany. 67Huntsman Cancer Institute, Department of Population Health Sciences, University of Utah, Salt
Lake City, Utah 84112‐5550, USA. 68Center for Epigenetics, Johns Hopkins University School of
Medicine, Baltimore, MD 21205, USA. 69Department of Medicine, Johns Hopkins University School of
Medicine, Baltimore, MD 21205, USA. 70Department of Mental Health, Johns Hopkins University
School of Public Health, Baltimore, MD 21205, USA. 71McKusick‐Nathans Institute of Genetic
Medicine, Johns Hopkins School of Medicine, Baltimore, MD 21205, USA. 72Department of
Biostatistics, Johns Hopkins University, Baltimore, MD 21205, USA. 73Computer Science and Artificial
Intelligence Laboratory, Massachusetts Institute of Technology, Cambridge, MA 02139, USA. 74Department of Medicine, University of Washington, Seattle, WA 98195, USA. 75Division of
Cardiology, University of Washington, Seattle, WA 98195, USA. 76Institute for Systems Genetics, New
York University Langone Medical Center, New York, New York 10016, USA. 77Department of Genome
Sciences, University of Washington, Seattle, WA 98195, USA. 78Office of Strategic Coordination,
Division of Program Coordination, Planning and Strategic Initiatives, Office of the Director, NIH,
Rockville, MD 20852, USA. 79Biorepositories and Biospecimen Research Branch, Division of Cancer
Treatment and Diagnosis, National Cancer Institute, Bethesda, MD 20892, USA. 80National Institute
of Dental and Craniofacial Research, Bethesda, MD 20892, USA. 81Division of Genomic Medicine,
National Human Genome Research Institute, Rockville, MD 20852, USA. 82Division of Neuroscience
and Basic Behavioral Science, National Institute of Mental Health, NIH, Bethesda, MD 20892, USA. 83Division of Neuroscience and Behavior, National Institute on Drug Abuse, NIH, Bethesda, MD
20892, USA. 84Washington Regional Transplant Community, Falls Church, VA 22003, USA. 85Gift of
Life Donor Program, Philadelphia, PA 19103, USA. 86LifeGift, Houston, TX 77055, USA. 87Center for
Organ Recovery and Education, Pittsburgh, PA 15238, USA. 88LifeNet Health, Virginia Beach, VA
23453, USA. 89National Disease Research Interchange, Philadelphia, PA 19103, USA. 90Unyts, Buffalo,
Nature Genetics: doi:10.1038/ng.3981

NY 14203, USA. 91Pharmacology and Therapeutics, Roswell Park Cancer Institute, Buffalo, NY 14263,
USA. 92Van Andel Research Institute, Grand Rapids, MI 49503, USA. 93Brain Endowment Bank, Miller
School of Medicine, University of Miami, Miami, FL 33136, USA. 94National Institute of Allergy and
Infectious Diseases, NIH, Rockville, MD 20852, USA. 95Biospecimen Research Group, Clinical Research
Directorate, Leidos Biomedical Research, Inc., Rockville, MD 20852, USA. 96Leidos Biomedical
Research, Inc., Frederick, MD 21701, USA. 97Temple University, Philadelphia, PA 19122, USA. 98Department of Health Behavior and Policy, School of Medicine, Virginia Commonwealth University,
Richmond, VA 23298, USA. 99European Molecular Biology Laboratory, European Bioinformatics
Institute, Hinxton CB10 1SD, UK. 100UCSC Genomics Institute, University of California Santa Cruz,
Santa Cruz, CA 95064, USA.
Nature Genetics: doi:10.1038/ng.3981
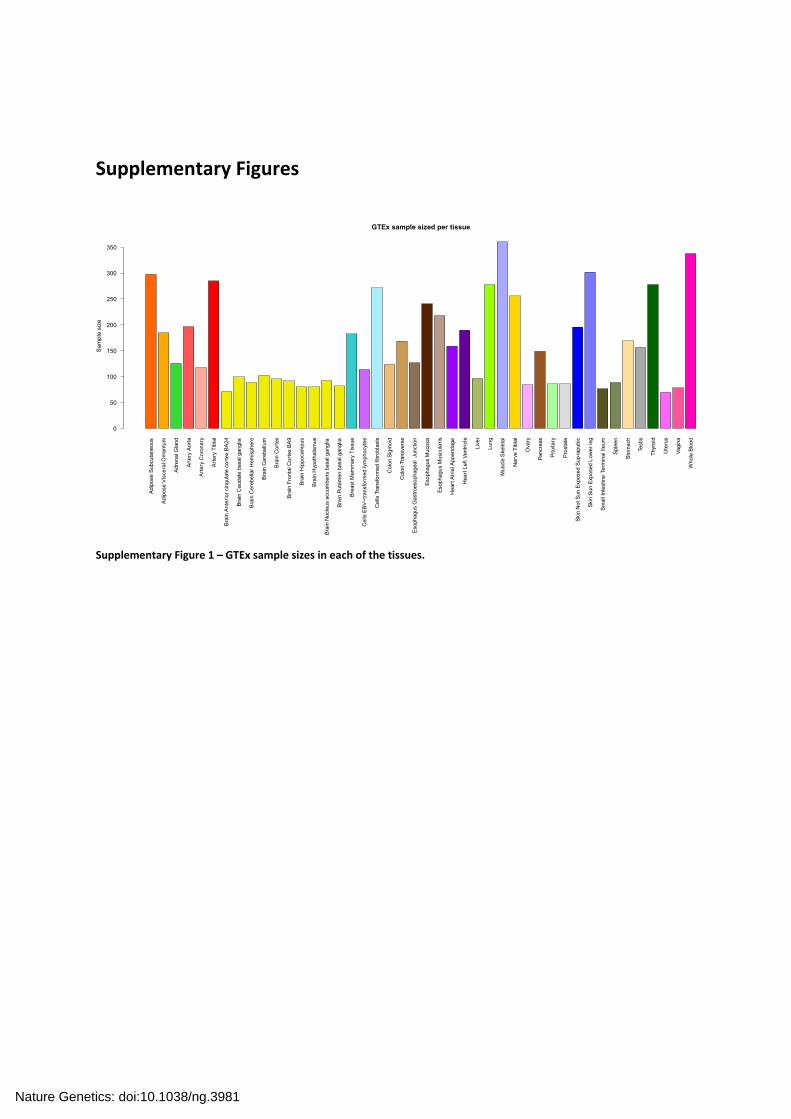
Supplementary Figures
Supplementary Figure 1 – GTEx sample sizes in each of the tissues.
Adi
pose
Sub
cuta
neou
s
Adi
pose
Vis
cera
l Om
entu
m
Adr
enal
Gla
nd
Art
ery
Ao
rta
Art
ery
Cor
ona
ry
Art
ery
Tib
ial
Bra
in A
nte
rior
cin
gula
te c
ort
ex B
A24
Bra
in C
auda
te b
asal
gan
glia
Bra
in C
ereb
ella
r H
emis
pher
e
Bra
in C
ereb
ellu
m
Bra
in C
ort
ex
Bra
in F
ront
al C
ort
ex B
A9
Bra
in H
ippo
cam
pus
Bra
in H
ypot
hala
mus
Bra
in N
ucle
us a
ccum
bens
bas
al g
angl
ia
Bra
in P
utam
en b
asal
gan
glia
Bre
ast M
amm
ary
Tis
sue
Cel
ls E
BV
−tr
ansf
orm
ed ly
mph
ocyt
es
Cel
lsTr
ansf
orm
ed fi
bro
blas
ts
Col
on S
igm
oid
Col
onTr
ansv
erse
Eso
phag
us G
astr
oeso
phag
eal
Junc
tion
Eso
phag
us M
ucos
a
Eso
phag
us M
uscu
lari
s
Hea
rt A
tria
l App
enda
ge
Hea
rt L
eft
Ven
tric
le
Live
r
Lung
Mus
cle
Ske
leta
l
Ner
ve T
ibia
l
Ova
ry
Pan
crea
s
Pitu
itary
Pro
stat
e
Ski
n N
ot S
un E
xpos
ed S
upra
pubi
c
Ski
n S
un E
xpos
ed L
ower
leg
Sm
all I
ntes
tine
Term
inal
Ileu
m
Spl
een
Sto
mac
h
Test
is
Thy
roid
Ute
rus
Vag
ina
Who
le B
lood
GTEx sample sized per tissue
Sa
mp
le s
ize
0
50
100
150
200
250
300
350
Nature Genetics: doi:10.1038/ng.3981

Supplementary Figure 2 – The RTC algorithm. Here x represents variants in the region, n is the number of variants in the region Q is the phenotype, and the orange peaks are recombination hotspots.
Regulatory Trait Concordance (RTC) Score
1. For xi .. xn:• Correct Q for Xi (linear regression) ‐> pseudo‐phenotype XiQ
(residuals)
2. For xi .. xn:• Calculate p‐value for eQTL‐XiQ association
3. Sort (decreasing) p‐values eQTL‐Xi .. nQ and find the rankof eQTL‐xGWASQ
4. RTC = (n ‐ RankGWAS)/ n
xi . . . . . . . . . . . . . . . . . . . . . . . . . . . xn
GWAS eQTL
Q
Nature Genetics: doi:10.1038/ng.3981

Supplementary Figure 3 – Simulation scheme when two variants are tagging different functional effects (H0). Here x represents variants in the region, n is the number of variants in the region Qp is the pseudo phenotype generated based on the true eQTL in the region, and the orange peaks are recombination hotspots.
Supplementary Figure 4 ‐ Simulation scheme when two variants are tagging the same functional effects (H1). Here x represents variants in the region, n is the number of variants in the region Qp is the pseudo phenotype generated based on the true eQTL in the region, and the orange peaks are recombination hotspots.
• Calculate RTC for T2‐T1Q and assume T2,causal as the causal eQTL variant andT1,causal as the causal GWAS variant.
• For each simulation iteration with N total iterat ions:
1. Select random T1,causal and T2,causal in the region with a true eQTL (T1,causal ≠T2,causal )
2. Find randomly selected T1 which is linked to T1,casual with r2 ≥ 0.5. Do the same
for T2 and T2,causal. (T1 ≠ T1,causal ≠ T2 ≠ T2,causal)
3. Generate a pseudo phenotype for T2,causal based on the β and intercept of thetrue eQTL and randomly distributed residuals of the true eQTL.
4. Rerun RTC with T1‐T2Qp
xi . . . . . . . . . . . . . . . . . . . . . . . . . . . xn
T1 T2
Qp
T1,causal T2, causal
RTC Simulation Scheme H0 (not‐shared)
r2 ≥ 0.5r2 ≥ 0.5
RTC Simulation Scheme H1(shared)
• Calculate RTC for T2‐T1Q and assume Tcausal as the casual eQTL variant.
• For each simulation iteration with N total iterat ions:
1. Select random and T2,causal random in the region with a true eQTL
2. Find randomly selected T1 which is linked to Tcausal with r2 ≥ 0.5. Do the samefor T2 and Tcausal. (T1 ≠ T2 ≠ Tcausal)
3. Generate a pseudo phenotype for Tcausal based on the β and intercept of thetrue eQTL and randomly distributed residuals of the true eQTL.
4. Rerun RTC with T1‐T2Qp
xi . . . . . . . . . . . . . . . . . . . . . . . . . . . xn
T1 T2
Qp
Tcausal
r2 ≥ 0.5
r2 ≥ 0.5
Nature Genetics: doi:10.1038/ng.3981

Supplementary Figure 5 – Conversion of RTC into a probability. We use the distributions generated under H0 and H1 with the RTC value (here as an example 0.9 to convert RTC into a probability. The π1 statistic is calculated from the p‐value distribution of eQTL effects of the GWAS variants. We take a range centred around the real RTC score, here 0.9, and find the proportion of values that overlap with this range under H0 and H1. Using these proportions, the π1 estimate, and Bayes’ theorem we calculate a probability of sharing.
| 0.9 =0.9 ∗ 1
0.9 ∗ 0 0.9 ∗ 1
H0 (Not‐shared) H1 (Shared)
RTC RTC
Nature Genetics: doi:10.1038/ng.3981

Supplementary Figure 6 – Number of independent signals per tissue (FDR = 5%). On the y‐axis total number independent eQTLs per tissue is plotted and the x‐axis represents the number of significant eQTL genes per tissue.
●
●
●
●
●
●
●
●
●
●
●
●
●●
●
●
●
●
●
●
●
●
●
●
●
●
●
●●
●
●
●
●
●
●
●
●
●
●
●
●
●●
●
Adipose − Subcutaneous
Adipose − Visceral (Omentum)
Adrenal Gland
Artery − Aorta
Artery − Coronary
Artery − Tibial
Brain − Anterior cingulate cortex (BA24)
Brain − Caudate (basal ganglia)
Brain − Cerebellar Hemisphere
Brain − Cerebellum
Brain − Cortex
Brain − Frontal Cortex (BA9)
Brain − Hippocampus
Brain − Hypothalamus
Brain − Nucleus accumbens (basal ganglia)
Brain − Putamen (basal ganglia)
Breast − Mammary Tissue
Cells − EBV−transformed lymphocytes
Cells − Transformed fibroblasts
Colon − Sigmoid
Colon − Transverse
Esophagus − Gastroesophageal Junction
Esophagus − Mucosa
Esophagus − Muscularis
Heart − Atrial Appendage
Heart − Left Ventricle
Liver
Lung
Muscle − Skeletal
Nerve − Tibial
Ovary
Pancreas
Pituitary
Prostate
Skin − Not Sun Exposed (Sup rapubic)
Skin − Sun Exposed (Lower leg)
Small Intestine − Terminal Ileum
Spleen
Stomach
Testis
Thyroid
Uterus
Vagina
Whole Blood
5000
10000
2500 5000 7500 10000eGenes
Inde
pend
ent
sign
als
Nature Genetics: doi:10.1038/ng.3981

1 2 3 4 5 6 7 8 9 10 11 12 13 14 15 16 17 18 19 20 21 22 23 24 25 26 27 28 29 30 31 32 33 34 35 36 37 38 39 40 41 42 43 44
Number of tissues an eQTL is active inWhole_Blood FDR = 5%, common genes
Number of tissues an eQTL is active in
0
50
100
150
200
Top 10 tissues with most sharing forWhole_Blood FDR = 5%, common genes
Pro
port
ion
of s
hari
ng
0.0
0.1
0.2
0.3
0.4
0.5
0.6
Lung
Splee
n
Adipos
e_Sub
cuta
neou
s
Adipos
e_Visc
eral_O
men
tum
Esoph
agus
_Muc
osa
Nerve
_Tibi
al
Artery
_Aor
ta
Skin_S
un_E
xpos
ed_L
ower
_leg
Esoph
agus
_Mus
cular
is
Artery
_Tibi
al
3 4 5 7 8 9 10 11 12 13 14 15 16 17 18 19 20 21 22 23 24 25 26 27 28 29 30 31 32 33 34 35 36 37 38 39 40 41 42 43 44
Number of tissues an eQTL is active inOvary FDR = 5%, common genes
Number of tissues an eQTL is active in
0
50
100
150
Top 10 tissues with most sharing forOvary FDR = 5%, common genes
Pro
port
ion
of s
harin
g0.0
0.2
0.4
0.6
0.8
Uteru
s
Vagina
Colon
_Sigm
oid
Breas
t_M
amm
ary_
Tissue
opha
gus_
Gastro
esop
hage
al_J
uncti
on
Artery
_Cor
onar
y
Esoph
agus
_Mus
cular
is
Stom
ach
Nerve
_Tibial
Adipo
se_S
ubcu
tane
ous
3 4 5 6 7 8 9 10
11
12
13
14
15
16
17
18
19
20
21
22
23
24
25
26
27
28
29
30
31
32
33
34
35
36
37
38
39
40
41
42
43
44
Number of tissues an eQTL is active inBrain_Cortex FDR = 5%, common genes
Number of tissues an eQTL is active in
0
50
100
150
200
Top 10 tissues with most sharing forBrain_Cortex FDR = 5%, common genes
Pro
port
ion
of s
harin
g
0.0
0.2
0.4
0.6
0.8
Brain_
Front
al_C
orte
x_BA9
rain_
Anter
ior_c
ingula
te_c
orte
x_BA24
Brain_
Cauda
te_b
asal
_gan
glia
Nucleus
_acc
umbe
ns_b
asal_g
angli
a
Brain_P
utam
en_b
asal_g
angl
ia
Brain
_Hipp
ocam
pus
Brain_H
ypot
halam
us
Brain_C
ereb
ellum
Brain
_Cer
ebell
ar_H
emisp
here
Pituita
ry
1 2 3 4 5 6 7 8 9 10 11 12 13 14 15 16 17 18 19 20 21 22 23 24 25 26 27 28 29 30 31 32 33 34 35 36 37 38 39 40 41 42 43 44
Number of tissues an eQTL is active inArtery_Tibial FDR = 5%, common genes
Number of tissues an eQTL is active in
0
50
100
150
200
250
Top 10 tissues with most sharing forArtery_Tibial FDR = 5%, common genes
Pro
port
ion
of s
hari
ng
0.0
0.2
0.4
0.6
Artery
_Aor
ta
Adipo
se_S
ubcu
tane
ous
Nerve
_Tibi
al
Esoph
agus
_Mus
cular
is
opha
gus_
Gastro
esop
hage
al_Ju
nctio
n
Artery
_Cor
onar
y
Breas
t_M
amm
ary_
Tissue
Lung
Thyro
id
Adipos
e_Visc
eral_O
men
tum
Supplementary Figure 7 – Further examples of tissue sharing. The left column displays the number of tissues eQTLs are active in for whole blood, ovary, brain cortex, and tibial artery, and the right column of histograms are the 10 ten tissues that these tissue are similar with.
Nature Genetics: doi:10.1038/ng.3981

Supplementary Figure 8 – The distribution of probability of sharing between the null GWAS variants and the eQTLs in all tissues merged. When compared to the distribution of the same metric in real GWAS hits in Figure 3b, we see that the enrichment of high probability of sharing is absent in this distribution.
Distrubution of null GWAS probabilities
P(shared)
Fre
qu
en
cy
0.0 0.2 0.4 0.6 0.8 1.0
01
00
00
20
00
03
00
00
40
00
0
Nature Genetics: doi:10.1038/ng.3981

Supplementary Figure 9 – ROC curve of r2 for causal links found by RTC. Here RTC score of >= 0.9 is taken as a true causal link between the two variants4, and the true positive and false positive rates of different r2 thresholds is plotted as the grey line where different r2 thresholds are labelled alongside the line.
Supplementary Figure 10 – The distribution of median LD in regions where RTC is high and r2 is low versus regions where both RTC and r2 are high.
0.0 0.2 0.4 0.6 0.8 1.0
0.0
0.2
0.4
0.6
0.8
1.0
R−squared ROC curve
False positive rate
Tru
e p
osi
tive
rate
0
0.1
0.2
0.4
0.5
0.7
0.8
0.9
1
RTC >= 0.9 when R2 < 0.1 RTC >= 0.9 when R2 > 0.9
0.0
0.2
0.4
0.6
0.8
1.0
Distributions of median LD in regions
Me
dia
n R
2 in
the
reg
ion
Mann−WhitneyP <2e−16
Nature Genetics: doi:10.1038/ng.3981

Supplementary Figure 11 – Correlation between RTC P(Shared) and the equivalent statistic calculated by COLOC. The red line represents the regression line.
0.0 0.2 0.4 0.6 0.8 1.0
0.0
0.2
0.4
0.6
0.8
1.0
P(Shared) RTC vs. H4 COLOCrho = 0.734 p = 3.9e−10
P(Shared) RTC
H4
CO
LO
C
Nature Genetics: doi:10.1038/ng.3981

Supplementary Figure 12 – Distribution of COLOC probabilities for cases where there is a high RTC sharing probability but a low COLOC sharing probability. COLOC requires summary statistics for both the eQTL and the GWAS effects for all the variants, so it follows that we need to intersect two lists of variants. In doing so, mainly due to different MAF thresholds used in eQTL (5%) and GWAS (1%) discovery, we lose some of the variants in a given region. COLOC calculates probabilities for five hypotheses, no eQTL effect, no GWAS effect, no eQTL and GWAS effect, shared effects, and independent effects, whereas RTC assumes the two effects are present in the region. In some regions, the most significant GWAS effect is lost (due to the intersection with eQTLs) which in turn results in COLOC calculating a high probability of no GWAS effect in the region hence decreasing the sharing probability.
No associationBoth
No associationGWAS
No associationeQTL Different causal Shared causal
0.0
0.2
0.4
0.6
0.8
Cases where RTC P(Shared) >= 0.9 and COLOC H4 <= 0.8
COLOC posterior probabilities
Pro
ba
bili
ty
Nature Genetics: doi:10.1038/ng.3981

Supplementary Figure 13 – The correlation between sharing probabilities calculated by RTC and COLOC in the simulation study. Correlation under both (a), null (b), and alternate (c) hypotheses. Null hypothesis refers to cases where the GWAS and the eQTLs are independent effects whereas the alternate is when it is a shared effect.
Supplementary Figure 14 – ROCs for RTC and COLOC based on the simulations. Calculated by varying the probability of sharing threshold at which two variants are called as tagging the same functional effect. False positive rates are calculated from the null simulation (what proportion of the null probabilities would have been called mistakenly as shared given a threshold) and the true positive rates from the alternate simulations (what proportion of the alternate probabilities would have been correctly called as shared given a threshold). Values next to the curves are the probability of sharing thresholds.
0.0 0.2 0.4 0.6 0.8 1.0
0.0
0.2
0.4
0.6
0.8
1.0
Allrho = 0.801 p = 1.5e−115
RTC
CO
LOC
0.0 0.2 0.4 0.6 0.8 1.0
0.0
0.2
0.4
0.6
0.8
1.0
Nullrho = 0.263 p = 2e−05
RTC
CO
LOC
0.0 0.2 0.4 0.6 0.8 1.0
0.0
0.2
0.4
0.6
0.8
1.0
Alternaterho = 0.482 p = 2.5e−16
RTC
CO
LOC
0.0 0.2 0.4 0.6 0.8 1.0
0.0
0.2
0.4
0.6
0.8
1.0
Receiver operating curve for RTC and COLOCSharing probability threshold >= 0.9
RTC sen = 0.91 spe = 0.95COLOC sen = 0.66 spe = 1
False positive rate
Tru
e p
osi
tive
rate
07.0 6.0 5.0 4.0 3.0 2.0 1.00.8
0.9
1
0
0.10.2
0.30.4
0.5
0.60.7
0.8
0.9
1
RTC
COLOC
a) b) c)
Nature Genetics: doi:10.1038/ng.3981
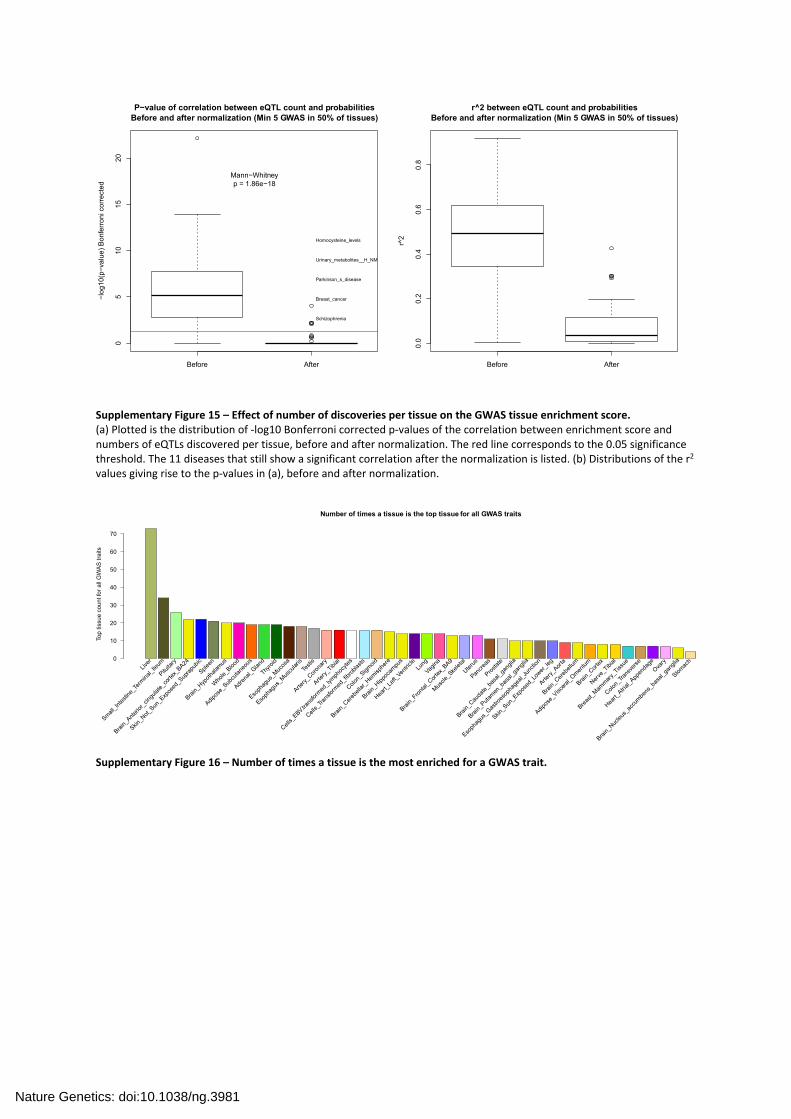
Supplementary Figure 15 – Effect of number of discoveries per tissue on the GWAS tissue enrichment score. (a) Plotted is the distribution of ‐log10 Bonferroni corrected p‐values of the correlation between enrichment score and numbers of eQTLs discovered per tissue, before and after normalization. The red line corresponds to the 0.05 significance threshold. The 11 diseases that still show a significant correlation after the normalization is listed. (b) Distributions of the r2 values giving rise to the p‐values in (a), before and after normalization.
Supplementary Figure 16 – Number of times a tissue is the most enriched for a GWAS trait.
Before After
05
10
15
20
P−value of correlation between eQTL count and probabilitiesBefore and after normalization (Min 5 GWAS in 50% of tissues)
−lo
g1
0(p
−va
lue
) B
onf
err
on
i co
rre
cte
d
Schizophrenia
Breast_cancer
Parkinson_s_disease
Urinary_metabolites__H_NM
Homocysteine_levels
Mann−Whitneyp = 1.86e−18
Before After
0.0
0.2
0.4
0.6
0.8
r^2 between eQTL count and probabilitiesBefore and after normalization (Min 5 GWAS in 50% of tissues)
r^2
Number of times a tissue is the top tissue for all GWAS traits
Top
tiss
ue
co
un
tfo
r a
ll G
WA
S t
raits
0
10
20
30
40
50
60
70
Liver
Smal
l_In
testi
ne_T
erm
inal
_Ile
um
Pituita
ry
Brain_A
nter
ior_
cingu
late
_cor
tex_
BA24
Skin_N
ot_S
un_E
xpos
ed_S
upra
pubi
c
Splee
n
Brain
_Hyp
otha
lamus
Who
le_B
lood
Adipo
se_S
ubcu
tane
ous
Adren
al_G
land
Thyro
id
Esoph
agus
_Muc
osa
Esoph
agus
_Mus
cular
is
Testi
s
Artery
_Cor
onar
y
Artery
_Tib
ial
Cells_
EBV.tra
nsfo
rmed
_lym
phoc
ytes
Cells_
Tran
sform
ed_f
ibrob
lasts
Colon
_Sig
moi
d
Brain
_Cer
ebel
lar_
Hemisp
here
Brain
_Hip
poca
mpu
s
Heart_
Left_
Vent
ricle
Lung
Vagin
a
Brain
_Fro
ntal
_Cor
tex_
BA9
Mus
cle_S
kele
tal
Uteru
s
Pancr
eas
Prosta
te
Brain
_Cau
date
_bas
al_g
angl
ia
Brain
_Put
amen
_bas
al_g
angl
ia
Esoph
agus
_Gas
troes
opha
geal
_Jun
ction
Skin_S
un_E
xpos
ed_L
ower
_leg
Artery
_Aor
ta
Brain
_Cer
ebellu
m
Adipo
se_V
iscer
al_O
men
tum
Brain
_Cor
tex
Nerve
_Tibi
al
Breas
t_M
amm
ary_
Tissue
Colon
_Tra
nsve
rse
Heart_
Atrial_A
ppen
dage
Ovary
Brain
_Nuc
leus
_acc
umbe
ns_b
asal
_gan
glia
Stom
ach
Nature Genetics: doi:10.1038/ng.3981

Supplementary Figure 17 – Distribution of the tissue causality score for CAD and lipid measurements, in tissues that identify SORT1 as the causal gene for the 1p23 locus vs. the tissues that do not. Tissues that correctly identify SORT1 contribute significantly (p = 0.0007) higher to the genetic causality of these complex phenotypes than the ones that do not.
Tissues that identify SORT1 Tissues that identify another gene
24
68
Tissue causality enrichment distributions for CAD and lipid measurements
Fo
ld e
nric
hm
en
tove
r th
enu
ll
Mann−Whitneyp = 0.000397
Nature Genetics: doi:10.1038/ng.3981

Supplementary Figure 19 – Tissue sharing of eQTLs with RTC. Here tissue sharing results from skeletal muscle eQTLs with coronary artery eQTLs is shown as an example. (a) The distribution of tissue sharing RTC scores, showing an enrichment for high RTC values indicating high degree of sharing between these tissues. (b) LD between the two variants (r2) vs. the RTC score. (c) RTC score vs. the calculated probability of sharing. The red points represent significant eQTLs in either skeletal muscle or coronary artery, whereas the grey points are for eQTLs significant in other tissues.
Distribution of RTCMuscle_Skeletal_in_Artery_Coronary
RTC
Fre
quen
cy
0.0 0.2 0.4 0.6 0.8 1.0
010
0020
0030
0040
0050
00
0.0 0.2 0.4 0.6 0.8 1.0
0.0
0.2
0.4
0.6
0.8
1.0
r^2 vs. RTC
r^2
RT
C
0.0 0.2 0.4 0.6 0.8 1.0
0.0
0.2
0.4
0.6
0.8
1.0
RTC vs. P(Shared|RTC)Muscle_Skeletal_in_Artery_Coronary
RTC
P(S
hare
d|R
TC
)
a) b) c)
Supplementary Figure 18 – Distribution of simulated RTC values. Under the null H0 (a) and under the alternative H1 hypotheses (b). As expected under H0 simulated RTC values are uniform and under H1 there is an enrichment of high RTC values.
Distribution of H0 RTC values (All regions)All tissues merged
RTC
0e+
001e
+06
2e+
063e
+06
4e+
06
0.0 0.2 0.4 0.6 0.8 1.0
Distribution of H1 RTC values (All regions)All tissues merged
RTC0e
+00
1e+
072e
+07
3e+
074e
+07
5e+
07
0.0 0.2 0.4 0.6 0.8 1.0
b)a)
Nature Genetics: doi:10.1038/ng.3981