Supplementary Materials for - Science | AAAS Materials for China’s Aquaculture and the World’s...
39
Originally posted 8 January 2014; corrected 9 January 2014 www.sciencemag.org/content/347/6218/133/suppl/DC1 Supplementary Materials for China’s Aquaculture and the World’s Wild Fisheries Ling Cao, Rosamond Naylor,* Patrik Henriksson, Duncan Leadbitter, Marc Metian, Max Troell, Wenbo Zhang *Corresponding author. E-mail: [email protected] Published 9 January 2015, Science 346, 133 (2014) DOI: 10.1126/science.1260149 This PDF file includes Materials and Methods Supplementary Text Figs. S1 to S8 Tables S1 to S5 References Other Supplementary Material for this manuscript includes the following: (available at www.sciencemag.org/content/347/6218/page/suppl/DC1) Calculations, baseline assumptions, and raw data can be found in the following Excel tables Table S6. Raw data for Figures S2 to S8 Table S7. Calculations for Table S3 base cases Table S8. Calculations for Table S4 Table S9. MC outputs for Policy Forum figure and Table S3 Correction: Equations now appear.
Transcript of Supplementary Materials for - Science | AAAS Materials for China’s Aquaculture and the World’s...

Originally posted 8 January 2014; corrected 9 January 2014
www.sciencemag.org/content/347/6218/133/suppl/DC1
Supplementary Materials for
China’s Aquaculture and the World’s Wild Fisheries
Ling Cao, Rosamond Naylor,* Patrik Henriksson, Duncan Leadbitter, Marc Metian, Max Troell, Wenbo Zhang
*Corresponding author. E-mail: [email protected]
Published 9 January 2015, Science 346, 133 (2014) DOI: 10.1126/science.1260149
This PDF file includes
Materials and Methods Supplementary Text Figs. S1 to S8 Tables S1 to S5 References
Other Supplementary Material for this manuscript includes the following: (available at www.sciencemag.org/content/347/6218/page/suppl/DC1) Calculations, baseline assumptions, and raw data can be found in the following Excel tables
Table S6. Raw data for Figures S2 to S8 Table S7. Calculations for Table S3 base cases Table S8. Calculations for Table S4 Table S9. MC outputs for Policy Forum figure and Table S3
Correction: Equations now appear.

METHODS
Data collection. Primary data for this study were obtained from interviews with fish farmers and
fishmeal and feed manufacturers in China’s major aquaculture producing regions—Guangdong,
Shandong, Zhejiang, and Hainan. The data were based on in-depth field surveys conducted by
the Center on Food Security and the Environment at Stanford University
(http://foodsecurity.stanford.edu) and the EU-FP7 Sustaining Ethical Aquaculture Trade (SEAT)
project (www.seatglobal.eu) in 2010–2012. The surveys focused on carp, tilapia, and shrimp
systems, which represent three of the largest aquaculture subsectors in China along a spectrum of
low- to high-valued species and account for >50% of the country’s aquaculture output by
volume. These systems span a suite of target markets, including species produced mainly for
domestic consumption (carps), species in transition from export-oriented to domestic market
(shrimp), and species still primarily destined for export markets (tilapia).
Structured systematic questionnaires for two separate surveys of fish production and fishmeal
and feed manufacturing were tested in the field and then improved in response to feedback
before the start of general surveys. The fish production survey mainly collected information on
farm characteristics such as farm area, pond size, labor, and feed use; farming techniques, such
as stocking density and water quality control; production costs; disease outbreak; main concerns
during fish farming; as well as consumer preference for whole fish. The survey of fishmeal and
feed manufacturing mainly covered topics of feeds produced, feed ingredients (raw materials)
used and their origin and substitutions, utilization of fish-processing wastes, annual production
quantities, sales and marketing, price fluctuations, and challenges faced. The survey instruments
are available through the following links:
1) For the Stanford survey:
http://fse.fsi.stanford.edu/research/chinas_impact_on_forage_fisheries_aquaculture_and_
feed_use_in_china
2) For the SEAT survey: http://media.leidenuniv.nl/legacy/seatsurveysampledesignd1-
murray-2013.pdf
Total sample size was determined according to resource availability. A total of 238 carp farms
(Zhejiang 118, Shandong 120), 300 shrimp farms (Guangdong 200, Hainan 100), 320 tilapia
1

farms (Guangdong 135, Hainan 185), 21 feed and 4 fishmeal companies were surveyed. The
regions surveyed were selected for the prevalence of carp (Zhejiang and Shandong), tilapia
(Guangdong and Hainan), and shrimp (Guangdong and Hainan) aquaculture. Within each region,
producers were selected randomly for the sample, and information from available contacts was
used to expand the sample size (“snowball sampling”). The feed and fishmeal companies
targeted for the survey were among the largest in these regions at the time of the study
(collectively accounting for ~13% of China’s fishmeal production and ~6% of the country’s total
aquafeed production); they produced feeds and feed ingredients that are widely sold within the
industry. For each survey site, farm owners or head managers were interviewed. Facility records
were used for verification to reduce possible errors. The names and contact information for the
respondents are held confidential under the IRB agreements.
A careful review of papers from the Chinese literature (and international literature) on China’s
aquaculture practices, use of diverse fish inputs—including processing by-products, in feeds,
multi-species fisheries, and by-catch categories—was performed in order to filter out the top
scholarly work and most accurate numbers and/or trends. References to articles written in
Mandarin have been translated into English in the citations of this Policy Forum and
supplementary materials.
Data management and analysis. Primary data obtained from these surveys were compiled and
analyzed using Microsoft Excel 2010 and R (version 3.1.0, www.r-project.org). The data were
scanned for outliers (greater than two standard deviations from the overall sample mean) in R;
these outliers were then evaluated using a number of possible triangulations from our original
questionnaires, and any physically or economically impossible data points were removed and
reset to the mean of the sample for further analyses. From the remaining values, economic
average feed conversion ratios (FCRs) and fishmeal and fish oil inclusion rates in feeds were
defined by arithmetic means. Fishmeal and fish oil inclusions in feeds were calculated as a
percentage of the total feed production for each species, which captured juvenile, grow-out, and
finisher feeds.
2

Equations for authors’ calculations in Policy Forum Table:
FCR = total feed fedtotal biomass increase
Total fishmeal used = production with feeds × FCR × average % fishmeal (FM) in feed
Forage fish equivalent = total fishmeal used21%
[Note: Fish oil is a byproduct of fishmeal production.
In this study, forage fish equivalent to produce fishmeal can produce enough fish oil for use in
the feeds of tilapia and shrimp. Therefore, total forage fish equivalent was calculated based on
only fishmeal used in the feeds.]
Equations for authors’ calculations in the Policy Forum figure:
Total seafood supply = imports + domestic farmed + domestic wild caught
Proportion used for processing = total raw seafood for processing
total seafood supply
Total whole fish supply = whole fish imports + domestic farmed + domestic wild caught
Whole fish used for processing = total whole fish supply × proportion used for processing
Processed fish = whole fish used for processing × fish processing yield rate
Fish waste = whole fish used for processing in China × waste ratio
Potential fishmeal yield from fish waste = fish waste × fishmeal reduction ratio
Potential fish oil yield from fish waste = fish waste × fish oil reduction ratio
Monte Carlo analysis. A Monte Carlo analysis was undertaken in Oracle Crystal Ball (Release
11.1.2.3.500, http://www.oracle.com/technetwork/middleware/crystalball/overview/index.html)
to estimate the aggregate impact of data uncertainty on fishmeal and oil yield from fish-
processing waste in China (here, “fish” is limited to finfish and crustaceans; mussels are
excluded because their waste is rarely used in feed production). The uncertainty parameters
represented variations in the yield of fish waste during processing and its market allocation for
fishmeal and oil production (Table S5). The parameter estimates for the model were obtained
from our interviews with fishmeal and feed companies and from personal communication with
experts in the field and then triangulated with values taken from the literature. We calculated
uncertainty results from 50,000 simulations using the Monte Carlo sampling method.
3

Scenarios for the Monte Carlo analysis. Two scenarios were developed to assess China’s
potential in recycling fish-processing wastes for feeds. Scenario 1, which examines processing
wastes from finfish only, is considered the most likely scenario, because finfish-processing
wastes are used mainly for producing fishmeal, whereas crustacean wastes are used for
producing a wide range of feed and (mostly) nonfeed products. Scenario 2, which includes all
processing wastes from both finfish and crustaceans, is reported only in the SM for comparison
purposes. Some crustacean-processing wastes are used as aquafeed supplements or attractants.
4

Supplemental Note 1: Trends in China’s fish consumption, production, and trade
China’s fisheries sector (farmed and capture) involves a complex web of producing, processing,
and trading fish for direct human consumption and recycling fish for fishmeal and fish feeds, as
illustrated in Fig. S1. Data and sources of data for these trends are provided in Excel file Table
S6. Raw data for Figures S2 to S8.
Consumption
China is currently the world’s largest consumer of fish, accounting for one-quarter of global fish
demand, and its fish consumption continues to rise with its burgeoning middle-income class (3).
Its per capita fish intake is estimated at 12.6 to 14.2 kg/year when out-of-home consumption is
included (11) and is expected to increase by 25% by 2030 (2). Growth in demand for fish is
expected to be particularly strong in rural areas (29). Of all fish consumed in China, fresh whole
fish account for 88%, which indicates a strong preference for live and fresh fish by Chinese
consumers; however, tastes are likely to change over time. In China, as in other Asian countries,
patterns of fish consumption and trade are determined by rising incomes, out-of-home
consumption, a preference for convenience foods, and a taste for high-valued fish products (e.g.,
shrimp, crab, lobster, and salmon) and other luxury seafood (e.g., live reef fish and caviar) (2, 11,
29).
Per capita seafood consumption in China has doubled over the last two decades (Fig. S2).
Interpreting fish demand trends for China is difficult because estimates for China’s per capita
seafood consumption vary by source (11). China’s average seafood consumption was 10.5
kg/capita in 2012 according to National Bureau of Statistics of China (NBSC). Official Chinese
statistics do not account for out-of-home consumption, however, and thus underestimate per
capita seafood consumption by 20to 35% in both rural and urban areas (11). Food and
Agriculture Organization of the United Nations (FAO) statistics on per capita seafood
consumption in China are substantially higher than the national averages recorded by NBSC
(Fig. S3). This difference arises because FAO statistics refer to per capita seafood supply
(physical availability), which are very close to the availability numbers reported in the China
Fisheries Yearbook.
5

Production
China’s total fish production (via aquaculture and capture fisheries) increased sixfold between
1986 and 2012 (Fig. S4). The country’s per capita fish supply reached 43.6 kg in 2012—almost
twice the global average—and is expected to climb to 50 kg by 2030 (1, 2). Virtually all of the
growth is from the aquaculture sector. Freshwater fish species accounted for 58% of total
aquaculture production (excluding seaweeds) in China in 2012, with the rapidly growing
mariculture industry (mollusks, crustaceans, and marine fishes) contributing the balance.
The production of farmed shrimp has been one of the most robust subsectors of China’s
aquaculture sector in recent decades and has led to rapidly rising demand for shrimp within the
country. Accordingly, China’s shrimp export volume has stagnated since 2008 (only 15% of its
penaeid shrimp output is currently exported), whereas its shrimp import volume has risen by
47% (30). China’s farmed tilapia exports remain robust (accounting for 70% of production), but
tilapia could follow the path of shrimp over time and become increasingly a product for its
domestic consumption (11, 30). Overall, trends in domestic consumption portend a major shift in
China’s trade position in fish products, from the world’s leading fish exporter to a net importer in
the coming decades.
Trade
China is the world’s largest fish exporter, processer, and re-exporter, and its imports are rising
rapidly as domestic fish consumption grows. The country’s trade volume in fish products more
than doubled between 2000 and 2013, from 4 million metric tons (mmt) to 8.1 mmt, whereas the
value of fish trade increased fivefold (1) (Fig. S5). China’s trade surplus in fish (i.e., net trade
balance) has increased about sixfold from US$1.98 billion in 2000 to US$11.7 billion in 2013
(1).
China has dominated the fish export market since 2002, contributing >12% of the global total
(worth over $19 billion) in 2013 (3). Despite the slow recovery in the global economy,
increasing nontariff trade barriers among its trade partners, and rising production and
transportation costs, China’s fish exports have been rising steadily during the past decade. Export
value increased fivefold between 2000 and 2013, from US$3.8 billion to US$20.3 billion,
whereas the volume of fish exports rose from 1.5 to 3.9 mmt (31). Such strong growth in exports
was due mainly to the disproportionate increase in aquaculture exports (8), which now account
6
for more than half of the total. The leading export species have been shrimp, followed by tilapia,
molluscs, eels, crawfish, and croakers (31). Fish fillets remains the largest export category over
the last decade, accounting for 25% of total fish exports by value, and exports of value-added
products, such as surimi and caviar, have also grown substantially. The main destinations for
China’s fish exports include Japan, the United States, the Association of Southeast Asian Nations
(ASEAN), Europe, and South Korea with a collective market share of 68% in 2013 (31). China’s
re-exports of fish, consisting of domestically processed products from imported raw fish (e.g.,
fish fillets and value-added products, such as surimi and caviar), have also continued to grow.
Given these trends, it is not surprising that China’s import value of fish also increased fivefold
between 2000 and 2013. China is now the third largest fish importer in the global market (3).
The value of its fish imports increased fivefold between 2000 and 2013, reaching US$8.6 billion
at the end of the period, and the volume of fish imports reached 4.2 mmt (31). Russia and the
United States remain China’s main suppliers of fish, accounting for 32% (US$2.7 billion) of total
imports by value in 2013 (31). More than half of fish imports are frozen whole fish, including
mainly cod, salmon, herrings, squid, large head hairtail, plaice, and flatfish (Fig. S6). The
majority, about 60 to 75%, of the imported frozen raw fish is processed and then re-exported (2).
In addition, China has become the world’s largest importer of fishmeal (Figs. S7 and S8). The
country imports around 1.2 mmt of fishmeal annually (mainly from Peru, the United States, and
Chile), accounting for ~30% of global fishmeal imports (3). China’s farmed carp, tilapia, and
shrimp systems alone consumed about 1 mmt of fishmeal in 2012 (as noted in the Policy Forum
Table), accounting for 76% of the country’s total fishmeal demand for aquaculture, and ~20% of
global fishmeal production. The amount of fishmeal, domestically produced and imported,
consumed by these three systems is equivalent to 5.1 mmt of live-weight forage fish. When the
wet-weight fish equivalent of fishmeal imports are calculated into China’s net fish trade, the
country actually becomes a net fish importer globally (authors’ calculations).
7

Supplemental Note 2: Government Directives and Policies
China has been farming fish for hundreds of years, but the government’s strong focus on
aquaculture within its fisheries policy dates to the 1970s when it became clear that the
country’s capture fisheries were seriously overexploited and its domestic fish demand
was steadily increasing (32). The dominance of aquaculture in policy was formally
established in the first promulgated Fisheries Law in 1986 (33, 34). Although there is no
legal definition of aquaculture in China (35), it refers to the farming of fish, crustaceans,
molluscs, and aquatic plants in enclosures, and it includes both marine and freshwater
systems in coastal and terrestrial regions (2). The government supports aquaculture
through investments in a variety of genetic improvements (e.g., selective breeding for
fish growth and pathogen resistance) and through subsidies to help producers replace
outdated equipment, increase the scale of their aquaculture systems, adopt new
technologies, and insure themselves against extreme weather events and other risks (2).
The Chinese government aims to expand and improve domestic aquaculture through a
mix of public- and private-sector initiatives.
Since the first Fisheries Law was established, the general policy for Chinese fisheries has
been adjusted to “aquaculture oriented,” emphasizing “major efforts devoted to
aquaculture in freshwater and marine water, protection and reasonable utilization of
inshore resources, and active development of mid-water and deep-sea fishery” (2).
Government policies and directives designed to boost production in both distant-water
fisheries and aquaculture reflect the underlying goal of enhancing employment, incomes,
and export revenues in the face of its declining domestic fisheries. China has historically
had the world’s largest labor force employed in the fishing sector and among the highest
rates of capture-fishing subsidies (3, 36). With its recent emphasis on distant-water
fishing, China currently operates the largest international fishing fleet, with vessels in
more than 80 exclusive economic zones (EEZs) and foreign territories (4–6).
Policies governing China’s fish production (both farmed and capture) are articulated in
two main documents: the country’s annual “No. 1 Central Document,” which provides a
vision for achieving food security in China, and its Five-Year Plan for Fisheries, which
8
provides a detailed logistical, legislative, and fiscal plan that includes development
principles and goals, regional priorities, budget outlays, and so forth.
There have been eleven No. 1 Central Documents starting in 2004, each with its own set
of priorities for food security, agricultural development, and fisheries production
(http://www.moa.gov.cn/ztzl/yhwj2014/; http://english.agri.gov.cn/hottopics/cpc/). For
example, the goal of the 2010 No. 1 Central Document was to promote long-distance
capture fisheries, build aquaculture demonstration farms, and increase the scale of
aquaculture farms. Capture fisheries and aquaculture were not a focus of the 2011 No. 1
Central Document, but the 2012 document set several goals, such as starting trials on the
ecological restoration of aquaculture environments, continuing to implement the artificial
propagation and release of fish, and launching fisheries insurance trials. In 2013, the No.1
Central Document goal was to “promote long distance capture fisheries” and “build
standard aquaculture farms”, and in 2014, it aimed to establish long-term mechanisms for
the sustainable development of agriculture through the ecological restoration of the
aquaculture environment. The 2014 document also articulated a vision to control capture
fisheries and fishing efforts and to implement continued subsidies for the artificial
propagation and release of fish.
Although the No. 1 Central Document is important for setting the vision for policy each
year, the Five-Year Plan for Fisheries provides the nuts and bolts of policy. China’s 12th
Five-Year Plan for Fisheries (2011–2015) established a policy framework to meet several
specific targets, including a goal for increasing seafood production from 53.7 mmt in
2010 to >60 mmt by 2015, with 75% contributed by aquaculture; a goal of raising the
seafood processing rate from 35% in 2010 to 40% by 2015; a green development
initiative with an emphasis on balancing growth in seafood production with improved
environmental protection; and a goal to achieve food-safety targets for 98% of its seafood
products. For further details about China’s 12th Five-Year Plan for fisheries sector, see:
http://www.moa.gov.cn/zwllm/ghjh/201110/t20111017_2357716.htm.
China’s State Council provides the framework for achieving the goals of the Five-Year
Plan for fisheries. In the State Council meeting in 2013, it was agreed that China is a
major maritime country, and marine fisheries are an important part of the country’s
9

modern agriculture and marine economy (37). The State Council also stated that the
sustained and healthy development of marine fisheries is of great significance to the
effectively protection of aquatic fish supplies and is important for increasing incomes of
fishermen, improving economic development in coastal areas, and safeguarding China's
maritime rights and interests. Specific policy actions based on this meeting included
efforts to control offshore farming density and to exploit offshore aquaculture and
intensive aquaculture. Policies were also implemented to continue to expand offshore and
deep-sea fisheries aggressively and to develop processing and distribution of marine
products vigorously.
In addition to supporting fish production, the Chinese government uses policy to enhance
fish trade. An export tax rebate policy has been in place since 1985 to eliminate double
taxation on exported goods and, therefore, to promote export trade (38). The export tax
rebate allows refunds or exemption of value-added tax (VAT) and consumption tax
levied during production, distribution, and sales of exported goods. In the case of fish, the
VAT rate is 0% if imports are targeted for re-exports.
Although China has achieved remarkable progress in achieving food security during the
past half-century, many people in the country still face serious nutritional deficits (39). It
is thus in the interest of the Chinese government to promote food security in terms of
protein and micronutrient consumption, and aquaculture and marine fisheries will play a
crucial role in this process. In the “Outline of the Program for Food and Nutrition
Development in China (2014–2020)” by the State Council (40), the aim of per capita
seafood consumption in 2020 was set at 18 kg, which is much higher than that in 2012
[per capita seafood consumption was 15.19 kg in urban areas and 5.36 kg in rural areas,
the national average was only 10.53 kg in 2012 (41)]. Because the Chinese government
remains primarily focused on staple food output, however, efforts to enhance fish
supplies cannot come at the expense of staple crop production (e.g., rice, wheat, maize).
The majority of China’s fish supplies for domestic production come from terrestrial
aquaculture ponds (mainly carp systems). In an effort to minimize the trade-offs between
agriculture and aquaculture production, the government has implemented a set of land
and water policies:
10

Land management law
To ensure the nation’s food security, China’s central government requires a
minimum threshold of 120 million hectares of arable land for agricultural uses, and
digging new ponds for the expansion of aquaculture in staple farmland regions is
strictly prohibited (http://www.gov.cn/banshi/2005-05/26/content_989_2.htm). This
law reflects the country’s land scarcity in the face of rising population and food
demand. In 2012, China’s population reached 1.35 billion—roughly one-fifth of the
global population—yet the country contains only 9% of the world’s arable land and
6.5% of the world’s freshwater resources.
Water policy
Similar to land (above), the allocation of freshwater resources for terrestrial pond
aquaculture is limited in many areas of the country, and in recent years, most
medium-sized reservoirs and lakes have been reserved for drinking water for nearby
cities and crop production. Most aquaculture cage and pen systems have been
removed or highly restricted in these reservoirs and lakes for health and sanitation
reasons. Mariculture is being promoted in China owing to rising constraints on
freshwater quantity and quality in many parts of the country (2).
Because of the constraints on land and freshwater, the intensification of the
aquaculture industry will need to become more environmentally friendly in the
future—an aim articulated in the No. 1 Central Document (above). Given its scale,
China’s aquaculture sector will also have to curtail the demand for fishmeal to
relieve pressure on global wild fisheries. Supported by China’s “Circular Economic
Promotion Law,” one promising solution would be extensive recycling of fish-
processing wastes.
Circular economy promotion law
The use of fish-processing wastes for aquafeeds is aligned with China’s “Circular
Economic Promotion Law,” According to this 2009 law, the Chinese government
offers tax preferences to industrial activities promoting the development of the
circular economy—the recycling of energy, water, and waste products—and uses tax
11
measures to encourage the import of water-saving technologies. Specific policy
measures are formulated by the public finance department and the tax department
under the State Council.
This Circular Economy Law potentially provides the “carrot” for increasing the use
of fish-processing wastes and thus reducing the need for wild fish in aquaculture
feeds. However, there is not a good policy “stick” in China, such as strict regulations
on illegal coastal fishing and illegal net gear, to ensure that the catch of trash fish
will be minimized or that coastal fisheries will be protected. Although laws exist to
protect coastal fisheries in China, enforcement of these laws is generally poor (42).
12
Supplemental Note 3: Dependence on marine resources
Targeted fisheries
During the past decade, China’s annual fishmeal imports have ranged from about 1.0 to 1.5 mmt
(average 1.2 mmt) (3, 31, 43, 44). Peruvian anchovy is the world’s largest targeted fishery at
around 7.8 mmt per year (ranging between 4.2 and 10.7 mmt because of El Niño events and
fishing closures in 2002–2011), and China is the largest importer of Peruvian fishmeal (24).
China also imports fishmeal reduced mainly from sardines, herring, and menhaden fisheries.
Most of these reduction fisheries are fully or overexploited (Table S1).
Domestic fishmeal production from China’s targeted forage fisheries has been limited by major
declines in some stocks and is estimated at only 0.3 to 0.4 mmt per year (11, 45, 46). China’s
main reduction fisheries—including the Japanese anchovy, skinnycheek lanternfish, and jack
mackerel fisheries—are fully to over-exploited, whereas others, such as Pacific herring, are
moderately exploited but periodically shift to a low-productivity regime with interannual climate
variation and overfishing (6, 47) (Table S1).
Nontargeted fisheries
Virtually all of the fish hauled out of the ocean by Chinese vessels are put to economic use, first
for human consumption and then for feeds and other purposes. Discards in China’s fisheries are
negligible (0.5% of total catch versus ~8% for global fish catch) (48). “Trash fish” in China thus
refers only to fish of low economic value used in fish and/or livestock feeds (unfit for direct
human consumption), whereas “low-value fish” generally indicates fish consumed directly by
humans (16). Converting trash fish to a quality suitable for human consumption would increase
the total costs owing to value-adding process and extra transportation and preservation needs
(17). Although the price of trash fish increased from less than $0.2 per kg before 2005 to $0.3 to
$0.4 per kg in 2013, it is still relatively inexpensive compared with other protein sources (16).
Direct and indirect use of perishable trash fish as feeds is therefore still economically viable in
China. In addition, common forms of trash fish, such as that derived from Pacific sandlance, are
often used to improve the appearance and meat quality of farmed carnivorous species (17).
Numerous fish species found in China’s trash fish and their stock status are listed in Table S2.
This list was compiled from information gathered by the authors of this paper (especially
Leadbitter), and from other reviews and studies in the literature as indicated in the table. It is
13
clear from Table S2 that little is known about the stock status of many of the fish captured in
nontargeted fisheries in China. Assessing impacts of trash fish use on marine ecosystems will
therefore require a broader scientific effort to identify species composition by locality and season
(6, 17).
Ratio of fish-in to fish-out
One measure of aquaculture’s dependence on fish resources is the ratio of fish-in to fish-out
(FIFO); FIFO provides a rough gauge of fish inputs used in fish feeds, but it does not identify the
source of fish for feeds (i.e., targeted forage fisheries, nontargeted multispecies fisheries, by-
catch, or fish-processing wastes). In the case of China’s main aquaculture systems, FIFO is
estimated to be 0.18 for non–filter-feeding carps, 0.39 for tilapia, and 1.5 for penaeid shrimp.
These values are comparable to the global estimates for FIFO for these species reported by
Tacon and Metian (28) and substantially lower than earlier estimates dating back 10 to 15 years
(49, 50), which indicates improved feed efficiencies over time. It is likely that these FIFO ratios
will decline in the future with improved feeding practices and feed efficiencies, but the aggregate
use of fish for aquaculture feeds in China is still expected to grow as the culture of high-valued
species reliant on feeds expands.
Impacts on global marine ecosystems
To secure fishmeal supply to China’s ever-growing market, Chinese companies have
increasingly purchased fishing rights in foreign countries (4, 8). Precise information on these
transactions is difficult to obtain, but many news stories suggest a trend in this direction. For
example, see:
• http://www.undercurrentnews.com/2014/01/14/china-fishery-could-buy-more-in-peru-as-
diamante-owners-still-looking-for-exit/
• http://www.marketwatch.com/story/china-fishery-bids-556m-for-copeinca-2013-02-26
• http://sbr.com.sg/shipping-marine/more-news/china-fishery-becomes-perus-sixth-largest-
fishmeal-company
http://www.4-traders.com/news/China-Fishery-acquires-a-fishmeal-plant-and-further-increases-fishing-quota-in-Peru--13881959/.
China’s aquaculture sector does not consistently follow international mandates on responsible
fishmeal and/or oil sourcing. These guidelines were developed jointly by the Aquaculture
14
Stewardship Council (www.asc-aqua.org), the Global Aquaculture Alliance
(www.gaalliance.org), and GlobalGAP (Global Good Agricultural Practices,
www.globalgap.org) in 2013. The mandates include traceability of fishmeal and/or oil inputs to
species and country of origin; banning the use of endangered species and fish sourced from
illegal, unreported, and unregulated fishing for feeds; and preference for commercial feed
manufactures that source fishmeal and/or oil from certified “sustainable” aquaculture and capture
fisheries operations, including products derived from fish-processing wastes.
Overall, China has a relatively low ranking in ocean health, and the demands that aquaculture
places on the marine environment contribute to its poor performance. An ocean health index tool
was developed recently to evaluate the condition of marine ecosystems from biological, physical,
economic, and social dimensions and to assess how sustainably each country or region is using
the ocean (51). China received an overall index score of 58 out of 100 on its ocean health within
EEZ boundaries in 2013 (ranking 161 out of 220 countries) (http://www.oceanhealthindex.org).
China’s ranking is below the global average (index = 65), which indicates poor management of
the index’s public goals and substantial room for improvement in the future.
15

Supplemental Note 4: Potential for wastes as feed
China faces two main constraints in transitioning toward widespread use of fish-processing
wastes—and away from wild fish inputs—as a key ingredient in fish feeds. These constraints
include (i) nutritional inferiority issues of waste-derived feeds for species fed in aquaculture
systems and (ii) food-safety issues for humans consuming farmed species reliant on commercial
feeds.
Nutritional constraints
Numerous papers have indicated the nutritional quality of waste-derived fishmeal depends on the
source of raw materials and processing technology used (23, 25, 52–55). Some fisheries by-catch
or by-product (e.g. Alaskan Pollock by-product) meals may have equal nutritional quality as that
of the highest-graded fishmeal. However, because of the removal of structural protein to produce
fish fillets, fishmeal derived from processing wastes usually has a lower protein content and
higher ash (bone) content than conventional whole-fish meal (23). In addition, key fatty acids
might be low in fishmeal derived from wastes of freshwater species. Although deboning
technology has been investigated as a way to reduce ash content in raw materials (56), the
nutritional quality of fishmeal obtained from processing wastes still tends to be inferior to
conventional fishmeal.
Fish processing has long been a growth industry in China and has been fueled by its fish export
and re-export industry. In the past, the industry has been supported by the availability of cheap
labor and a rapidly growing aquaculture industry. The number of aquatic processing facilities
increased from 6900 in 2000 to >9700 in 2012 (1). During the same period, the country’s total
processing capacity increased from 9 to 26 mmt (1). The future of the processing industry is less
certain, however, because of rising wage rates in China and increasing competition in the fish-
processing and re-export market by other Southeast Asian countries.
Given the traditional preference for fresh whole fish by Chinese consumers, the majority of
processed fish products are destined for export (or re-export), but there is a growing domestic
demand for convenience fish products. Currently, one-third of fish output available for
consumption in China is processed, and the portion is targeted to reach 40% by 2015 according
to China’s 12th Five-Year Plan.
16

Food-safety constraints
In China, all fishmeal used in feeds is required to meet the national fishmeal standard SC/T
3501-1996 (57), however the enforcement of this standard is not necessarily strict or uniform
throughout the country. There are no specific food-safety requirements within the standards set
for feeds. For example, no food-safety requirements are specified for using animal or fisheries
by-products in feeds by “Regulation on the Management of Feeds and Feed Additives” (58),
hygienical standard for feeds “GB 13078-2001” (59), fishery feed safety limits “NY5072-2002”
(60), or the updated fishmeal standard “GB/T 19164-2003” (61).
Analysis of processing wastes for fishmeal and fish oil production
The Policy Forum Figure shows the results of our analysis on the estimated potential of fishmeal
and fish oil production from China’s fish-processing industry. In this analysis, we estimate that
in 2012, 12.4 mmt of finfish were used as raw materials for processing. We assume a median
production yield for whole raw fish of 40% and a 2% flesh loss due to spoilage and other
technical reasons. Because there is wide uncertainty in the waste ratio (percentage of waste
derived from whole fish, ranging from 30 to 70%) and the market allocation of fish-processing
waste (the share of processing by-products used in fishmeal and fish oil production, ranging from
50 to 80%), a Monte Carlo analysis was conducted.
Monte Carlo results
Scenario 1: waste from processing finfish only
Our results indicated that averagely about 0.65 mmt of fishmeal (95% confidence interval: 0.39–
0.92 mmt) and 0.21 mmt of fish oil (95% confidence interval: 0.09–0.22 mmt) could be gained
from China’s finfish processing (Table S3).
Scenario 2: waste from processing both finfish and crustaceans
Our results indicated that averagely about 0.9 mmt of fishmeal (95% confidence interval: 0.68–
1.15 mmt) and 0.22 mmt of fish oil (95% confidence interval: 0.16–0.27 mmt) could be gained
from processing both finfish and crustaceans (Table S3).
17
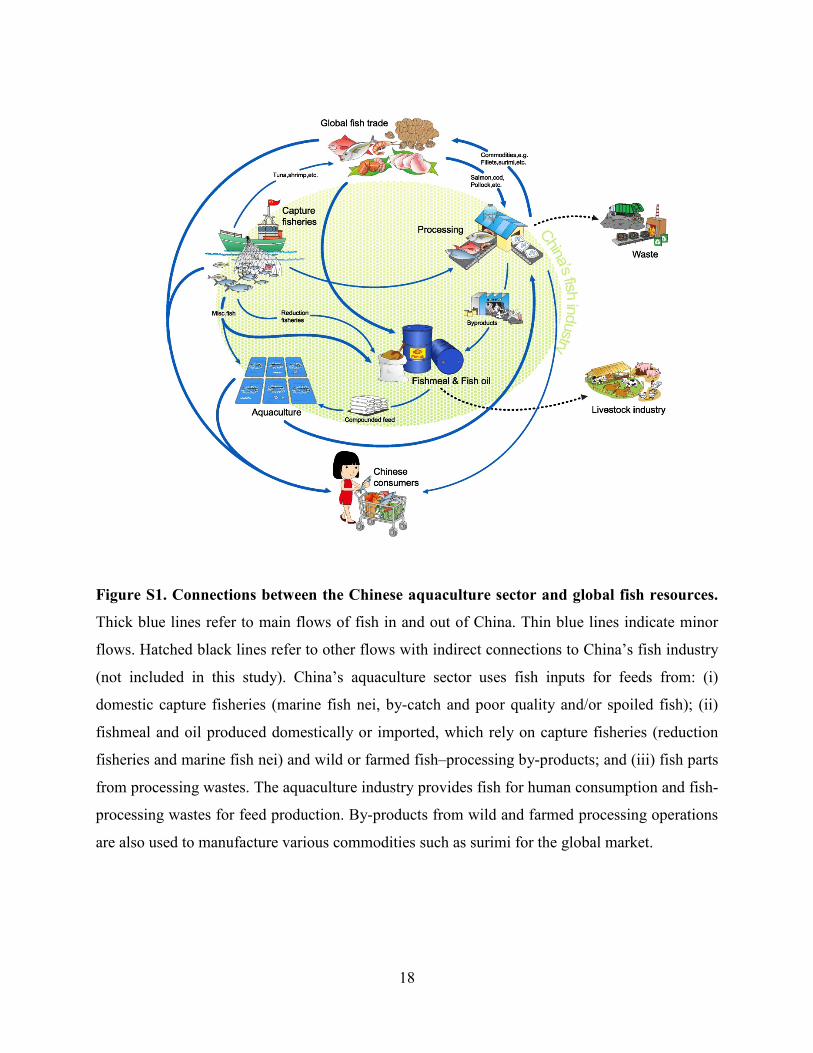
Figure S1. Connections between the Chinese aquaculture sector and global fish resources.
Thick blue lines refer to main flows of fish in and out of China. Thin blue lines indicate minor
flows. Hatched black lines refer to other flows with indirect connections to China’s fish industry
(not included in this study). China’s aquaculture sector uses fish inputs for feeds from: (i)
domestic capture fisheries (marine fish nei, by-catch and poor quality and/or spoiled fish); (ii)
fishmeal and oil produced domestically or imported, which rely on capture fisheries (reduction
fisheries and marine fish nei) and wild or farmed fish–processing by-products; and (iii) fish parts
from processing wastes. The aquaculture industry provides fish for human consumption and fish-
processing wastes for feed production. By-products from wild and farmed processing operations
are also used to manufacture various commodities such as surimi for the global market.
18
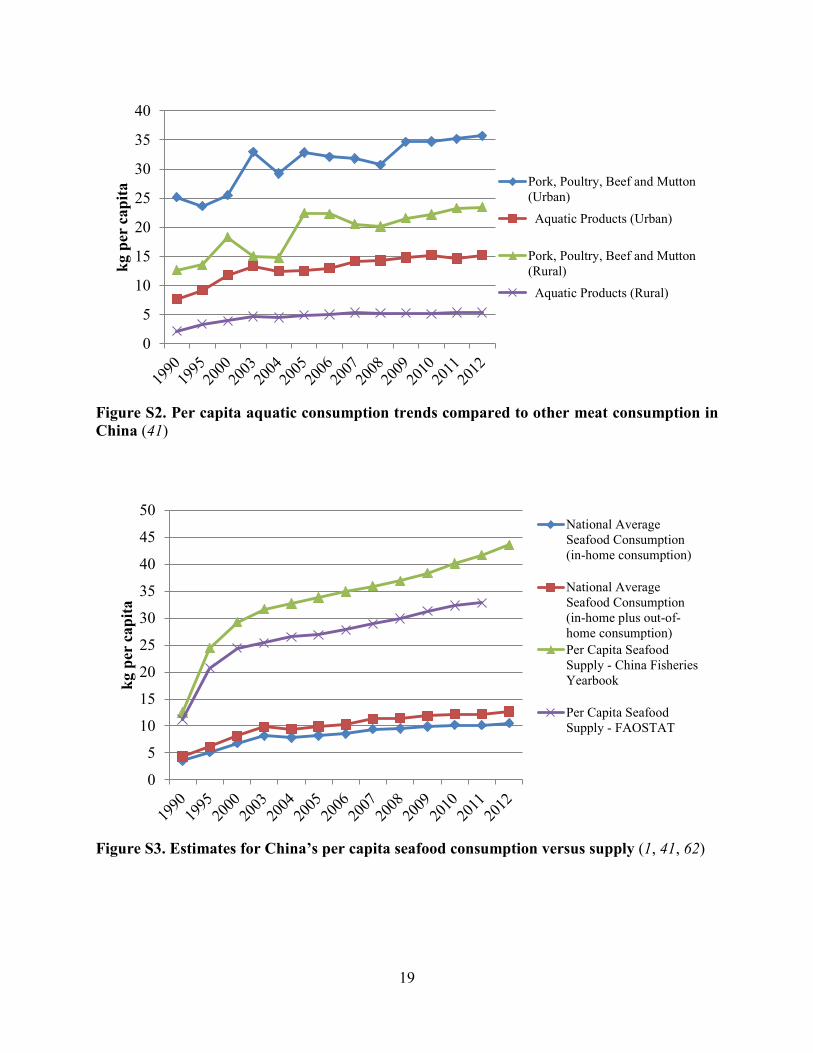
Figure S2. Per capita aquatic consumption trends compared to other meat consumption in China (41)
Figure S3. Estimates for China’s per capita seafood consumption versus supply (1, 41, 62)
0
5
10
15
20
25
30
35
40kg
per
cap
ita Pork, Poultry, Beef and Mutton
(Urban)
Aquatic Products (Urban)
Pork, Poultry, Beef and Mutton(Rural)
Aquatic Products (Rural)
0
5
10
15
20
25
30
35
40
45
50
kg p
er c
apita
National AverageSeafood Consumption(in-home consumption)
National AverageSeafood Consumption(in-home plus out-of-home consumption)Per Capita SeafoodSupply - China FisheriesYearbook
Per Capita SeafoodSupply - FAOSTAT
19

Figure S4. China’s total aquatic production (1)
Figure S5. China’s fish trade by value from 2000-2013 (1, 31)
0
10
20
30
40
50
60
Mill
ion
met
ric
tons
Freshwater aquaculture
Mariculture
Domestic marine fishery
Freshwater fishery
Distant-water fishery
0
5
10
15
20
25
30
35
US$
bill
ion
Export Import
20

Figure S6. China’s imports of frozen whole fish (27)
-
500,000
1,000,000
1,500,000
2,000,000
2,500,000
tons
Frozen whole fish Salmon Cod Herrings
21

Figure S7. The balance of global fishmeal trade in 2012 (unit: metric tons, MT) (27, 63)
22

Figure S8. China’s fishmeal imports (64)
0
0.2
0.4
0.6
0.8
1
1.2
1.4
1.6
1.8
mill
ion
met
ric
tons
23
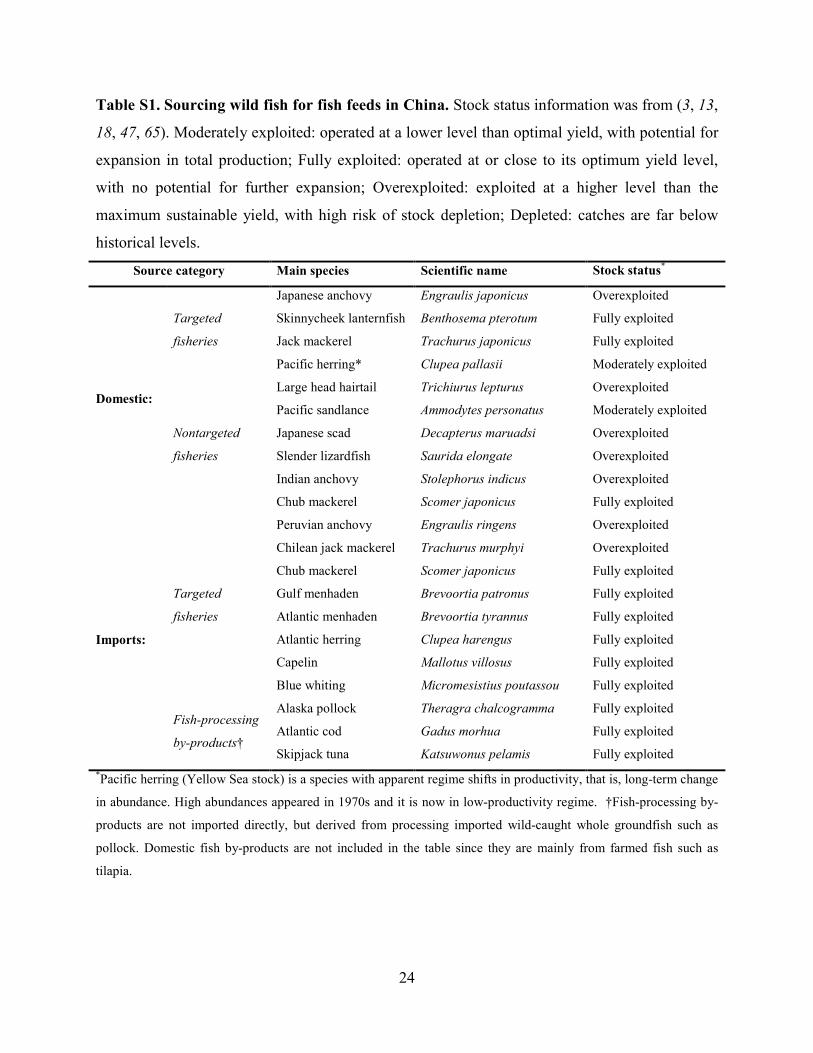
Table S1. Sourcing wild fish for fish feeds in China. Stock status information was from (3, 13,
18, 47, 65). Moderately exploited: operated at a lower level than optimal yield, with potential for
expansion in total production; Fully exploited: operated at or close to its optimum yield level,
with no potential for further expansion; Overexploited: exploited at a higher level than the
maximum sustainable yield, with high risk of stock depletion; Depleted: catches are far below
historical levels.
Source category Main species Scientific name Stock status*
Domestic:
Targeted
fisheries
Japanese anchovy Engraulis japonicus Overexploited
Skinnycheek lanternfish Benthosema pterotum Fully exploited
Jack mackerel Trachurus japonicus Fully exploited Pacific herring* Clupea pallasii Moderately exploited
Nontargeted
fisheries
Large head hairtail Trichiurus lepturus Overexploited
Pacific sandlance Ammodytes personatus Moderately exploited Japanese scad Decapterus maruadsi Overexploited
Slender lizardfish Saurida elongate Overexploited
Indian anchovy Stolephorus indicus Overexploited
Chub mackerel Scomer japonicus Fully exploited
Imports:
Targeted
fisheries
Peruvian anchovy Engraulis ringens Overexploited
Chilean jack mackerel Trachurus murphyi Overexploited
Chub mackerel Scomer japonicus Fully exploited
Gulf menhaden Brevoortia patronus Fully exploited
Atlantic menhaden Brevoortia tyrannus Fully exploited
Atlantic herring Clupea harengus Fully exploited
Capelin Mallotus villosus Fully exploited
Blue whiting Micromesistius poutassou Fully exploited
Fish-processing
by-products†
Alaska pollock Theragra chalcogramma Fully exploited
Atlantic cod Gadus morhua Fully exploited
Skipjack tuna Katsuwonus pelamis Fully exploited *Pacific herring (Yellow Sea stock) is a species with apparent regime shifts in productivity, that is, long-term change
in abundance. High abundances appeared in 1970s and it is now in low-productivity regime. †Fish-processing by-
products are not imported directly, but derived from processing imported wild-caught whole groundfish such as
pollock. Domestic fish by-products are not included in the table since they are mainly from farmed fish such as
tilapia.
24

Table S2. Numerous trash fish species found in China and their stock status (17, 18, 47, 66)
Fish species Scientific name Stock status Region
Bald glassy Ambassis gymnocephalus Unknown South China Sea
Beka squid Loligo beka Unknown East China Sea Belenger's croaker Johnius belengerii Unknown East China Sea Bladder moon snail Polinices didyma Unknown East China Sea Bluespotted
stargazer Xenocephalus elongatus Unknown East China Sea
Bombay-duck Harpadon nehereus Moderately fully exploited East China Sea
Brownback trevally Carangoides praeustus Unknown South China Sea
Butterfly bobtail squid Sepiola birostrata Unknown East China Sea
Chinese ditch prawn Palaemon gravieri Unknown East China Sea
Commerson's anchovy
Stolephorus commersonnii Overexploited East China Sea
Common frog shell Bufonaria rana Unknown East China Sea Common hairfin
anchovy Setipinna tenuifilis Unknown Yellow and Bohai Seas; East China Sea
Common octopus Octopus vulgare Depleted East China Sea Crocodile flathead Cociella crocodila Unknown East China Sea Deep pugnose
ponyfish Secutor ruconius Unknown South China Sea
Dotted gizzard shad Konosirus punctatus Unknown South China Sea Fat greenling Hexagrammos otakii Unknown East China Sea
Finespot goby Chaeturichthys stigmatias Unknown East China Sea
Firefly lanternfish Hygophum proximum Unknown East China Sea Forksnout searobin Lepidotrigla alata Unknown East China Sea Gaper Tresus Keenae Unknown East China Sea Gray stingfish Minous monodactylus Unknown East China Sea Gunther's lizard
fish Synodus kaianus Unknown South China Sea
Hardyhead silverside
Atherinomorus lacunosus Unknown South China Sea
Indian anchovy Stolephorus indicus Overexploited East China Sea
Indian perch Apogonichthys lineatus Unknown East China Sea
Japanese bonnet Phalium bisulcatum Unknown East China Sea Japanese scad Decapterus maruadsi Overexploited South China Sea
25

Japanese silver biddy Gerres equulus Unknown South China Sea
Japanese stone crab Charybdis Japonica Unknown East China Sea Javelin goby Synechogobius hasta Unknown East China Sea Kammal thryssa Thrissa kammalensis Unknown South China Sea Keeled mullet Liza carinata Unknown South China Sea Kobi cuttlefish Sepia kobiensis Hoyle Unknown East China Sea Largehead hairtail Trichiurus lepturus Overexploited South China Sea Largescale
lizardfish Saurida brasiliensis Overexploited East China Sea
Longtail silver biddy Gerres longirostris Unknown South China Sea
Macclelland's codlet
Bregmaceros mcclellandi Unknown East China Sea
Mackerel scad Decapterus macasellus Unknown East China Sea
Mantis shrimp Oratosquilla oratoria Unknown East China Sea Mimika bobtail
squid Euprymna morsei Unknown East China Sea
Moonfish Mene maculate Unknown South China Sea Offshore ponyfish Equulites rivulatus Unknown East and South China Seas
Orangefin ponyfish Photopectoralis bindus Unknown South China Sea
Oriental flying gurnard
Dactylopterus orientalis Unknown East China Sea
Osbeck's grenadier anchovy Coilia mystus Unknown East China Sea
Pacific mackerel Scomber japonicus Unknown South China Sea
Pacific sandlance Ammodytes personatus Unknown East China Sea
Pinkgray goby Amblychaeturichthys hexanema Unknown East China Sea
Red eelgoby Caragobius rubristriatus Unknown East China Sea
Robust tonguefish Cynoglossus robustus Unknown East China Sea Sand crab Ovalipes punctatus Unknown East China Sea Scaly hairfin
anchovy Setiponna taty Unknown East China Sea
Shortheaded tonguesole Cynoglossus kopsii Unknown East China Sea
Shortnose ponyfish Leiognathus brevirostris Unknown South China Sea
Silver jewfish Argyrosomus argentatus Overexploited East and South China Seas
Skinnycheek Benthosema pterotum Unknown East China Sea
26

lanternfish Slender lizardfish Saurida elongate Overexploited East China Sea Small yellow
croaker Larimichthys polyactis Unknown East China Sea
Spear dragonet Callionymus huguenini Unknown East China Sea
Spinyhead croaker Collichthys lucidus Unknown East China Sea
Spotfin cardinalfish Apogonichthys carinatus Unknown East China Sea
Spotted velvetfish Erisphex pottii Unknown East China Sea Striated frogfish Antennarius striatus Unknown East China Sea
Swordtip squid Loligo edulis Moderately exploited East and South China Seas
Toothpony Gazza minuta Unknown South China Sea Veined rapa whelk Rapana venosa Unknown East China Sea Wart perch Psenopsis anomala Unknown East China Sea Whipfin silver
biddy Gerres filamentosus Unknown South China Sea
White croaker Genyonemus lineatus Unknown East China Sea Whitespotted
conger Conger myriaster Unknown East China Sea
27

Table S3. China’s potential in recycling fish-processing wastes for feeds
Statistics Potential fishmeal yield
(tons)
Potential fish oil yield
(tons)
Scenario 1
Base case* 793,821 189,005
Mean† 652,557 155,371
2.5th percentile† 394,363 93,896
50th percentile (median)† 648,340 154,367
97.5th percentile† 925,235 220,294
Standard deviation† 139,442 33,200
Minimum† 278,971 66,422
Maximum† 1,049,655 249,918
Scenario 2
Base case* 970,845 231,153
Mean† 901,487 214,640
2.5th percentile† 676,039 160,962
50th percentile (median)† 898,381 213,900
97.5th percentile† 1,150,601 273,953
Standard deviation† 131,570 31,326
Minimum† 591,750 140,893
Maximum† 1,273,511 162,324 *Base case: results without uncertainty analysis. †Results calculated from 50,000 Monte Carlo simulations.
28

Table S4. Fishmeal and fish oil potential derived from processing wastes in China's finfish export sector (year 2011). Conversion factor (CF) is used to convert product weight to live weight (live weight = product weight × CF). Waste ratio: ratio of waste after processing (67–69). Export data from (24).
Product Group Product types
Conversion factor
Waste ratio
Export (tons)
Waste (tons)
Fish, frozen, nei fish frozen whole 1.00 0.00 354,939 0 Sardines, sardinellas, brisling or sprats, frozen fish frozen whole 1.00 0.00 126,926 0
Mackerels nei, frozen fish frozen whole 1.00 0.00 126,452 0 Tilapias, frozen fish frozen whole 1.00 0.00 107,600 0
Fish live, nei fish live, fresh, or chilled 1.00 0.00 72,665 0
Herrings nei, frozen fish frozen whole 1.00 0.00 72,492 0 Skipjack tuna, frozen fish frozen whole 1.00 0.00 40,257 0 Croakers, frozen fish frozen whole 1.00 0.00 39,975 0 Fish, fresh, or chilled, nei fish live, fresh, or
chilled 1.00 0.00 27,643 0
Miscellaneous pelagic fishes, nei, frozen fish frozen whole 1.00 0.00 19,799 0
Plaices, frozen, nei fish frozen whole 1.00 0.00 17,164 0 Hairtails, frozen fish frozen whole 1.00 0.00 15,375 0 Cods nei, frozen fish frozen whole 1.00 0.00 11,642 0 Octopus, live, fresh, or chilled fish live, fresh, or
chilled 1.00 0.00 10,539 0
Fish waste, nei fish Waste 1.00 0.00 9,494 0 Yellowfin tuna, frozen, nei fish frozen whole 1.00 0.00 6,577 0
Caviar and caviar substitutes fish caviar 1.00 0.00 6,194 0
Eels and elvers live fish live, fresh, or chilled 1.00 0.00 5,638 0
Bigeye tuna, frozen, nei fish frozen whole 1.00 0.00 5,023 0 Croakers, fresh, or chilled fish live, fresh, or
chilled 1.00 0.00 3,496 0
Greenland halibut, frozen fish frozen whole 1.00 0.00 3,279 0
Pacific salmon, frozen, nei fish frozen whole 1.00 0.00 3,049 0
Fish for culture incl. ova, fingerlings etc. fish live, fresh, or
chilled 1.00 0.00 2,965 0
Tunas nei, frozen fish frozen whole 1.00 0.00 2,649 0
Carps live fish live, fresh, or chilled 1.00 0.00 2,302 0
Albacore (=Longfin tuna), frozen, nei fish frozen whole 1.00 0.00 2,019 0
29

Livers, roes, milt, frozen fish livers/roes 1.00 0.00 2,018 0 Sharks nei, frozen fish frozen whole 1.00 0.00 1,812 0 Eels, frozen fish frozen whole 1.00 0.00 1,755 0 Pomfrets, ocean breams, fresh, or chilled fish live, fresh, or
chilled 1.00 0.00 1,430 0
Miscellaneous demersal fishes,nei, fresh, or chilled
fish live, fresh, or chilled 1.00 0.00 1,029 0
Swordfish, frozen fish frozen whole 1.00 0.00 912 0 Flatfishes nei, frozen fish frozen whole 1.00 0.00 905 0 Livers, roes, milt, fresh, or chilled, nei fish livers/roes 1.00 0.00 870 0
Common sole, frozen fish frozen whole 1.00 0.00 853 0 Cods, fresh, or chilled, nei fish live, fresh, or
chilled 1.00 0.00 734 0
Ornamental fish nei fish live, fresh, or chilled 1.00 0.00 571 0
Atlantic(Thunnus thynnus)and Pacific(Thunnus orientalis)bluefin tuna, frozen
fish frozen whole 1.00 0.00 249 0
Toothfish (Dissostichus spp.), frozen fish frozen whole 1.00 0.00 223 0
Saltwater fish nei, live fish live, fresh, or chilled 1.00 0.00 142 0
Puffer, fresh, or chilled fish live, fresh, or chilled 1.00 0.00 114 0
Salmonoids, frozen fish frozen whole 1.00 0.00 84 0
Eels, fresh, or chilled fish live, fresh, or chilled 1.00 0.00 27 0
Atlantic salmon and Danube salmon, frozen fish frozen whole 1.00 0.00 25 0
Hake nei, frozen fish frozen whole 1.00 0.00 24 0 Trouts and chars, frozen fish frozen whole 1.00 0.00 13 0 Halibuts nei, frozen fish frozen whole 1.00 0.00 12 0 Flatfishes, fresh, or chilled, nei fish live, fresh, or
chilled 1.00 0.00 5 0
Mackerels, nei, fresh, or chilled fish live, fresh, or
chilled 1.00 0.00 5 0
Sardines, sardinellas, brisling or sprats, fresh, or chilled
fish live, fresh, or chilled 1.00 0.00 1 0
Albacore (=Longfin tuna), fresh, or chilled fish live, fresh, or
chilled 1.00 0.00 0 0
Bigeye tuna, fresh, or chilled fish live, fresh, or
chilled 1.00 0.00 0 0
Common sole, fresh, or fish live, fresh, or 1.00 0.00 0 0
30

chilled chilled Haddock, fresh, or chilled fish live, fresh, or
chilled 1.00 0.00 0 0
Haddock, frozen fish frozen whole 1.00 0.00 0 0 Halibuts, fresh, or chilled, nei fish live, fresh, or
chilled 1.00 0.00 0 0
Herrings, fresh, or chilled, nei fish live, fresh, or
chilled 1.00 0.00 0 0
Plaices, fresh, or chilled, nei fish live, fresh, or
chilled 1.00 0.00 0 0
Saithe (=Pollock), fresh, or chilled fish live, fresh, or
chilled 1.00 0.00 0 0
Saithe (=Pollock), frozen fish frozen whole 1.00 0.00 0 0 Salmonoids, fresh, or chilled, nei fish live, fresh, or
chilled 1.00 0.00 0 0
Salmons, fresh, or chilled, nei fish live, fresh, or
chilled 1.00 0.00 0 0
Sharks nei, fresh, or chilled fish live, fresh, or
chilled 1.00 0.00 0 0
Skipjack tuna, fresh, or chilled fish live, fresh, or
chilled 1.00 0.00 0 0
Sockeye salmon (red salmon)(Oncorhynchus nerka), frozen
fish frozen whole 1.00 0.00 0 0
Tilapias, fresh, or chilled fish live, fresh, or chilled 1.00 0.00 0 0
Trouts and chars live fish live, fresh, or chilled 1.00 0.00 0 0
Trouts and chars, fresh, or chilled fish live, fresh, or
chilled 1.00 0.00 0 0
Tunas, fresh, or chilled, nei fish live, fresh, or
chilled 1.00 0.00 0 0
Yellowfin tuna, fresh, or chilled fish live, fresh, or
chilled 1.00 0.00 0 0
Herring, salted or in brine fish dried/salted/
smoked 1.20 0.00 0 0
Anchovies, salted or in brine fish dried/salted/
smoked 1.33 0.00 435 0
Herrings nei, smoked fish dried/salted/ smoked 1.67 0.00 3 0
Miscellaneous demersal fishes, salted or in brine, nei
fish dried/salted/ smoked 1.60 0.00 16 0
Salmons, smoked fish dried/salted/ smoked 1.92 0.00 115 0
Herring roes, cured fish roes 0.00 0.00 0 0 Catfish fillets, frozen fish fillets 2.86 0.65 5,940 11,048 Fish fillets, frozen, nei fish fillets 2.45 0.59 864,168 1,253,044 Miscellaneous dried fish, fish dried/salted/ 4.00 0.00 12,896 0
31

whether or not salted, nei
smoked
Fish fillets, dried, salted or in brine fish dried/salted/
smoked 4.00 0.59 39,825 94,280
Fish fillets, fresh, or chilled, nei fish fillets 2.45 0.59 3,655 5,283
Toothfish (Dissostichus spp.), fillets, frozen fish fillets 2.45 0.59 183 265
Toothfish (Dissostichus spp.), meat, frozen fish fish meat 1.94 0.00 116 0
Fish minced nei, prepared or preserved fish fish minced 1.44 0.00 131,222 0
Fish nei, prepared or preserved, not minced fish prepared or
preserved 1.44 0.48 105,597 72,862
Fish minced nei, in airtight containers prepared or preserved
fish fish minced 1.44 0.00 31,912 0
Fish nei, smoked fish dried/salted/ smoked 1.61 0.00 2,262 0
Fish nei, salted or in brine fish dried/salted/
smoked 4.00 0.00 442 0
Fish meat, whether or not minced, frozen, nei fish fish meat 1.94 0.69 52,442 70,240
Cods nei, salted or in brine fish dried/salted/
smoked 2.70 0.00 1,152 0
Mackerel prepared or preserved, not minced, nei
fish prepared or preserved 1.46 0.49 64,862 46,135
Tunas prepared or preserved, not minced, nei
fish prepared or preserved 1.44 0.48 52,163 35,992
River eels, prepared or preserved, not minced, nei
fish prepared or preserved 2.03 0.63 35,199 44,990
Sardines, sardinellas, brisling or sprats, prep. or pres., not minced, nei
fish prepared or preserved 1.07 0.30 12,404 3,991
Salmon nei, not minced, prepared or preserved fish prepared or
preserved 1.52 0.35 4,637 2,467
Herrings prepared or preserved, not minced, nei
fish prepared or preserved 1.22 0.38 1,707 797
Miscellaneous freshwater fishes, prepared or preserved, not minced, nei
fish prepared or preserved 1.44 0.48 652 450
Anchovies, prepared or preserved, not minced fish prepared or
preserved 2.00 0.54 641 692
Atlantic salmon, not minced, prepared or preserved
fish prepared or preserved 1.52 0.35 188 100
32

Cods nei, dried whether or not salted fish dried/salted/
smoked 3.00 0.00 8,365 0
Tilapia fillets, frozen fish fillets 2.70 0.63 158,112 269,218 Tilapias prepared or preserved, not minced fish prepared or
preserved 2.03 0.63 63,379 80,937
Livers, roes, milt, smoked, dried, salted or in brine
fish dried/salted/ smoked 0.00
0.00 6,862 0
Fish meals, nei fish meal 4.76 0.00 441 0 Fish liver oils, nei fish oil 0.00 0.00 386 0 Miscellaneous coastal fishes, salted or in brine, nei
fish dried/salted/ smoked 1.39
0.00 1 0
Fish heads, tail, maws etc., dried, salted, or in brine
fish dried/salted/ smoked 0.00
0.00 0 0
Freshwater fishes nei, dried, salted, or in brine fish dried/salted/
smoked 1.50 0.00 0 0
Miscellaneous coastal fishes, dried, whether or not salted
fish dried/salted/ smoked 4.00
0.00 0 0
Miscellaneous pelagic fishes, salted or in brine, nei
fish dried/salted/ smoked 1.39
0.00 0 0
Fish body oils, nei fish oil 0.00 0.00 22,666 0 Fish meal fit for human consumption, nei fish meal 0.00 0.00 1,890 0
Shark fins, prepared or preserved fish fins 0.00 0.00 146 0
Shark fins, dried, salted, etc. fish fins 0.00 0.00 343 0
Waste Sum (tons) 1,992,790 Fishmeal potential (tons) 418,486 Fish oil potential (tons) 99,639
33

Table S5. Uncertainty parameters for calculating recycling fish-processing wastes for fishmeal and oil production. Processing yield rate: Typical production yield for whole raw fish, from (22, 67, 70). Waste ratio: Percentage of waste derived from whole fish = 1 – (fish-processing yield rate) – [loss (assumed 2%)]. Market allocation: Percentage of fish-processing waste destined for fishmeal and oil production. Triangular distribution has lower and upper limits and a midpoint value.
Uncertainty parameters Low value
High value
Most likely value
Assumed distribution
Finfish-processing yield rate 30% 70% 40% Triangular Crustaceans-processing yield rate 30% 50% 40% Triangular Waste ratio 28% 68% 58% Triangular Market allocation 50% 80% - Uniform Calculations, baseline assumptions, and raw data can be found in the following Excel
tables:
Table S6. Raw data for Figures S2 to S8 Table S7. Calculations for Table S3 base cases Table S8. Calculations for Table S4 Table S9. MC outputs for Policy Forum figure and Table S3
34

References and Notes 1. Fishery Bureau, Ministry of Agriculture (MOA), People’s Republic of China, China Fisheries
Yearbook 2013 (China Agriculture Press, Beijing, 2013), 315 pp. 2. Project Team for Research into the Sustainable Development Strategy of China’s Cultivation
Industry, Study on the Sustainable Development Strategy of China’s Cultivation Industry—Aquaculture (China Agricultural Press, Beijing, 2013), pp. 408.
3. Food and Agriculture Organization of the United Nations, “The state of world fisheries and aquaculture” (FAO, Rome, 2014).
4. T. G. Mallory, China’s distant water fishing industry: Evolving policies and implications. Mar. Policy 38, 99–108 (2013). doi:10.1016/j.marpol.2012.05.024
5. S. Villasante, D. Rodríguez-González, M. Antelo, S. Rivero-Rodríguez, J. A. de Santiago, G. Macho, All fish for China? Ambio 42, 923–936 (2013). Medline doi:10.1007/s13280-013-0448-9
6. S. Funge-Smith, M. Briggs, W. Miao, “Regional overview of fisheries and aquaculture in Asia and the Pacific 2012” (Asia-Pacific Fishery Commission, FAO, Rome, 2013).
7. D. Pauly, D. Belhabib, R. Blomeyer, W. W. W. L. Cheung, A. M. Cisneros-Montemayor, D. Copeland, S. Harper, V. W. Y. Lam, Y. Mai, F. Le Manach, H. Österblom, K. M. Mok, L. van der Meer, A. Sanz, S. Shon, U. R. Sumaila, W. Swartz, R. Watson, Y. Zhai, D. Zeller, China’s distant-water fisheries in the 21st century. Fish Fish. 15, 474–488 (2014). doi:10.1111/faf.12032
8. R. Blomeyer et al., “The role of China in world fisheries” (European Parliament, Directorate General for Internal Policies, Brussels, 2012).
9. L. Cao, J. S. Diana, G. A. Keoleian, Q. Lai, Life cycle assessment of Chinese shrimp farming systems targeted for export and domestic sales. Environ. Sci. Technol. 45, 6531–6538 (2011). Medline doi:10.1021/es104058z
10. B. Xie, J. Qin, H. Yang, X. Wang, Y.-H. Wang, T.-Y. Li, Organic aquaculture in China: A review from a global perspective. Aquaculture 414–415, 243–253 (2013). doi:10.1016/j.aquaculture.2013.08.019
11. A. Chiu, L. Li, S. Guo, J. Bai, C. Fedor, R. L. Naylor, Feed and fishmeal use in the production of carp and tilapia in China. Aquaculture 414–415, 127–134 (2013). doi:10.1016/j.aquaculture.2013.07.049
12. C. X. Ai, Q. Y. Tao, Feed Industry 34, 1 (2013). 13. J. Alder, B. Campbell, V. Karpouzi, K. Kaschner, D. Pauly, Forage fish: From ecosystems to
markets. Annu. Rev. Environ. Resour. 33, 153–166 (2008). doi:10.1146/annurev.environ.33.020807.143204
14. M. L. Pinsky, O. P. Jensen, D. Ricard, S. R. Palumbi, Unexpected patterns of fisheries collapse in the world’s oceans. Proc. Natl. Acad. Sci. U.S.A. 108, 8317–8322 (2011). Medline doi:10.1073/pnas.1015313108
15. M. R. Hasan, M. Halwart, “Fish as feed inputs for aquaculture: practices, sustainability and implications” (FAO, Rome, 2009).
16. S. Funge-Smith, E. Lindebo, D. Staples, “Asian fisheries today: The production and use of low value/trash fish from marine fisheries in the Asia-Pacific region” (Asia-Pacific Fishery Commission, FAO, Rome, 2005).
35
17. S. S. De Silva, G. M. Turchini, “Use of wild fish and other aquatic organisms as feed in aquaculture—a review of practices and implications in the Asia-Pacific” (FAO, Rome, 2009).
18. R. Grainger, Y. Xie, S. Li, Z. Guo, “Production and utilization of trash fish in selected Chinese ports” (Asia-Pacific Fishery Commission, FAO, Rome, 2005).
19. Y. Kong, Chinese J. Anim. Sci. 49, 7 (2013). 20. A. E. Ghaly et al., J. Microb. Biochem. Technol. 5, 107 (2013). doi: 10.4172/1948-
5948.1000110 21. R. Newton, T. Telfer, D. Little, Perspectives on the utilization of aquaculture coproduct in
Europe and Asia: Prospects for value addition and improved resource efficiency. Crit. Rev. Food Sci. Nutr. 54, 495–510 (2014). Medline doi:10.1080/10408398.2011.588349
22. R. L. Olsen, J. Toppe, I. Karunasagar, Challenges and realistic opportunities in the use of by-products from processing of fish and shellfish. Trends Food Sci. Technol. 36, 144–151 (2014). doi:10.1016/j.tifs.2014.01.007
23. R. L. Naylor, R. W. Hardy, D. P. Bureau, A. Chiu, M. Elliott, A. P. Farrell, I. Forster, D. M. Gatlin, R. J. Goldburg, K. Hua, P. D. Nichols, Feeding aquaculture in an era of finite resources. Proc. Natl. Acad. Sci. U.S.A. 106, 15103–15110 (2009). Medline doi:10.1073/pnas.0905235106
24. FAO, FishstatJ—software for fishery statistical time series (2014); www.fao.org/fishery/statistics/software/fishstatj/en.
25. F. Y. Ayadi, K. A. Rosentrater, K. Muthukumarappan, Alternative protein sources for aquaculture feeds. J. Aquaculture Feed Sci. Nutr. 4, 1–26 (2012). doi:10.3923/joafsnu.2012.1.26
26. D. Klinger, R. Naylor, Searching for solutions in aquaculture: Charting a sustainable course. Annu. Rev. Environ. Resour. 37, 247–276 (2012). doi:10.1146/annurev-environ-021111-161531
27. UN, UN Comtrade Statistics Database (2014); http://comtrade.un.org/. 28. A. G. J. Tacon, M. Metian, Global overview on the use of fish meal and fish oil in
industrially compounded aquafeeds: Trends and future prospects. Aquaculture 285, 146–158 (2008). doi:10.1016/j.aquaculture.2008.08.015
29. M. Fabinyi, Historical, cultural and social perspectives on luxury seafood consumption in China. Environ. Conserv. 39, 83–92 (2012). doi:10.1017/S0376892911000609
30. H. Cui, China Fish. 6, 68 (2011). 31. MOA, People’s Republic of China, “China’s seafood trade in 2013” (2014);
www.moa.gov.cn/zwllm/jcyj/shc/201402/t20140211_3755451.htm. 32. J. Zhang, J. Rørtveit, “Aquaculture in China” (Innovation Norway, Beijing Office, Beijing,
2005). 33. L. S. Chen, FAO Fish. Proc. 9, 189 (2007). 34. J. H. Li, FAO Fish. Proc. 9, 29 (2007). 35. FAO, “National aquaculture legislation overview: China” (FAO, Rome, 2014);
www.fao.org/fishery/legalframework/nalo_china/en.
36

36. U. R. Sumaila, A. S. Khan, A. J. Dyck, R. Watson, G. Munro, P. Tydemers, D. Pauly, A bottom-up re-estimation of global fisheries subsidies. J. Bioecon. 12, 201–225 (2010). doi:10.1007/s10818-010-9091-8
37. State Council, (2013); www.gov.cn/zwgk/2013-06/25/content_2433577.htm. 38. C. H. Chen, C. C. Mai, H. C. Yu, The effect of export tax rebates on export performance:
Theory and evidence from China. China Econ. Rev. 17, 226–235 (2006). doi:10.1016/j.chieco.2005.06.001
39. S. Rozelle, J. Huang, X. Wang, in The Evolving Sphere of Food Security, R. Naylor, Ed. (Oxford Univ. Press, Oxford, 2014), chap. 3.
40. State Council, www.gov.cn/zwgk/2014-02/10/content_2581766.htm (2014). 41. National Bureau of Statistics of China, (2013); www.stats.gov.cn/english/. 42. G. Shen, M. Heino, An overview of marine fisheries management in China. Mar. Policy 44,
265–272 (2014). doi:10.1016/j.marpol.2013.09.012 43. M. L. Chen, Fish. Adv. Mag. 4, 95 (2012). 44. Q. Xu, Review of China's fishmeal market for year 2011 and preview for year 2012. Chinese
J. Anim. Sci. 9, 20 (2012). 45. C. L. Chen, C. D. Huang, B. Shen, Guangdong Feed 9, 32 (2010). 46. M. Godfrey, “China adds fishmeal, fish oil regulations” (2012);
www.seafoodsource.com/newsarticledetail.aspx?id=18954. 47. Y. Ye, K. Cochrane, Y. Qiu, Using ecological indicators in the context of an ecosystem
approach to fisheries for data-limited fisheries. Fish. Res. 112, 108–116 (2011). doi:10.1016/j.fishres.2011.06.004
48. K. Kelleher, “Discards in the world’s marine fisheries: an update” (FAO, Rome, 2005). 49. R. L. Naylor, R. J. Goldburg, J. H. Primavera, N. Kautsky, M. C. Beveridge, J. Clay, C.
Folke, J. Lubchenco, H. Mooney, M. Troell, Effect of aquaculture on world fish supplies. Nature 405, 1017–1024 (2000). Medline doi:10.1038/35016500
50. R. Naylor, M. Burke, Raising tigers of the sea. Annu. Rev. Environ. Resour. 30, 185–218 (2005). doi:10.1146/annurev.energy.30.081804.121034
51. B. S. Halpern, C. Longo, D. Hardy, K. L. McLeod, J. F. Samhouri, S. K. Katona, K. Kleisner, S. E. Lester, J. O’Leary, M. Ranelletti, A. A. Rosenberg, C. Scarborough, E. R. Selig, B. D. Best, D. R. Brumbaugh, F. S. Chapin, L. B. Crowder, K. L. Daly, S. C. Doney, C. Elfes, M. J. Fogarty, S. D. Gaines, K. I. Jacobsen, L. B. Karrer, H. M. Leslie, E. Neeley, D. Pauly, S. Polasky, B. Ris, K. St Martin, G. S. Stone, U. R. Sumaila, D. Zeller, An index to assess the health and benefits of the global ocean. Nature 488, 615–620 (2012). Medline doi:10.1038/nature11397
52. R. Hardy, T. Masumoto, in Proceedings of the International Conference on Fish By-Product, S. Keller, Ed. (Alaska Sea Grant Program, Fairbanks, 1990), pp. 109–120.
53. S. Goddard, G. Al-Shagaa, A. Ali, Fisheries by-catch and processing waste meals as ingredients in diets for Nile tilapia, Oreochromis niloticus. Aquacult. Res. 39, 518–525 (2008). doi:10.1111/j.1365-2109.2008.01906.x
54. R. W. Hardy, W. M. Sealey, D. M. Gatlin III, Fisheries by-catch and by-product meals as protein sources for rainbow trout Oncorhynchus mykiss. J. World Aquacult. Soc. 36, 393–400 (2005). doi:10.1111/j.1749-7345.2005.tb00343.x
37

55. K. W. Whiteman, D. M. Gatlin, Evaluation of fisheries by-catch and by-product meals in diets for red drum Sciaenops ocellatus L. Aquacult. Res. 36, 1572–1580 (2005). doi:10.1111/j.1365-2109.2005.01380.x
56. C. K. Rathbone, J. K. Babbitt, F. M. Dong, R. W. Hardy, Performance of juvenile coho salmon Oncorhynchus kisutch fed diets containing meals from fish wastes, deboned fish wastes, or skin-and-bone by-product as the protein ingredient. J. World Aquacult. Soc. 32, 21–29 (2001). doi:10.1111/j.1749-7345.2001.tb00918.x
57. MOA, Fish meal SC/T 3501-1996 (China Standard Press, Beijing, 1997). 58. State Council, “Regulation on the management of feeds and feed additives,” (2011);
www.lawinfochina.com/display.aspx?lib=law&id=9287&CGid=. 59. General Administration of Quality Supervision Inspection and Quarantine of the P.R. China,
“Hygienical standard for feeds: GB 13078-2001” (GAQSIQ, Beijing, 2001). 60. MOA, “NY5072-2002 pollution-free food” (2002);
www.gdofa.gov.cn/download/200605231614.doc. 61. General Administration of Quality Supervision, Inspection, and Quarantine of the P.R.
China, “Fish meal GB/T 19164-2003” (GAQSIQ, Beijing, 2003). 62. FAOSTAT, (FAO, Rome, 2013); http://faostat3.fao.org/faostat-
gateway/go/to/download/FB/CL/E. 63. C. Fedor, Fishmap, Center on Food Security and the Environment, Stanford University
(2014); http://173.255.223.11:3200/. 64. China Customs, (2014); http://english.customs.gov.cn/publish/portal191/. 65. J. Y. Liu, Status of marine biodiversity of the China seas. PLOS ONE 8, e50719 (2013).
Medline doi:10.1371/journal.pone.0050719 66. FAO, “Report of the second workshop on the assessment of the fishery stock status in South
and Southeast China” (FAO, Rome, 2009). 67. Torry Research Station, “Yield and nutritional value of the commercially more important fish
species” (FAO, Rome, 1989). 68. S. R. Bush, B. Belton, D. Hall, P. Vandergeest, F. J. Murray, S. Ponte, P. Oosterveer, M. S.
Islam, A. P. Mol, M. Hatanaka, F. Kruijssen, T. T. Ha, D. C. Little, R. Kusumawati, Certify sustainable aquaculture? Science 341, 1067–1068 (2013). Medline doi:10.1126/science.1237314
69. FAO, “Conversion factors: Landed weight to live weight” (Fishery Information, Data and Statistics Unit, Rome, 2000).
70. L. Marsh, P. J. Bechtel, Waste (By-Products) Utilization, L. A. Granata, G. J. Flick, R. E. Martin, Eds. (Wiley-Blackwell, Hoboken, NJ, 2012), pp. 128–135.
38