Supplementary Material for - Science Material for ... The following KAT and KDAC inhibitors were in...
26
www.sciencemag.org/content/344/6183/527/suppl/DC1 Supplementary Material for Chemical Inhibition of NAT10 Corrects Defects of Laminopathic Cells Delphine Larrieu, Sébastien Britton, Mukerrem Demir, Raphaël Rodriguez,* Stephen P. Jackson* *Corresponding author. E-mail: [email protected] (S.P.J.); [email protected] (R.R.) Published 2 May 2014, Science 344, 527 (2014) DOI: 10.1126/science.1252651 This PDF file includes: Materials and Methods Figs S1 to S11 Other Supplementary Material for this manuscript includes the following: (available at www.sciencemag.org/content/344/6183/527/suppl/DC1) Movie S1
-
Upload
nguyennguyet -
Category
Documents
-
view
218 -
download
1
Transcript of Supplementary Material for - Science Material for ... The following KAT and KDAC inhibitors were in...

www.sciencemag.org/content/344/6183/527/suppl/DC1
Supplementary Material for
Chemical Inhibition of NAT10 Corrects Defects of Laminopathic Cells
Delphine Larrieu, Sébastien Britton, Mukerrem Demir, Raphaël Rodriguez,* Stephen P. Jackson*
*Corresponding author. E-mail: [email protected] (S.P.J.); [email protected] (R.R.)
Published 2 May 2014, Science 344, 527 (2014)
DOI: 10.1126/science.1252651
This PDF file includes:
Materials and Methods
Figs S1 to S11 Other Supplementary Material for this manuscript includes the following: (available at www.sciencemag.org/content/344/6183/527/suppl/DC1)
Movie S1

2
Materials and Methods
Cell culture and transfections. U2OS and SaOS-2 osteosarcoma cells, HeLa cervical cancer cells, A431 melanoma cells, NCI-SNU5 gastric cancer cells, MRC-5 lung fibroblast cells and Werner syndrome patient-derived SV40 fibroblast cells were grown in Dulbecco’s modified Eagle medium (DMEM, Sigma-Aldrich) supplemented with 10% fetal bovine serum (BioSera), 2mM L-glutamine, 100U per ml penicillin, 100 μg ml-1 streptomycin. Normal skin primary fibroblasts GM03440 and Hutchinson-Gilford progeria syndrome (HGPS) skin primary fibroblasts AG11498 and AG06297 were purchased from Coriell Cell Repositories and used between passage number 9-25. Cells were grown in DMEM supplemented as above. RPE-1 retinal pigment epithelial cells were grown in DMEM and Ham F12 mix medium supplemented as above and buffered with sodium bicarbonate. HMV-II melanoma cell line, 22RV1 prostate carcinoma cells, NCI-H82 and NCI-H69 lung carcinoma cells, and NCI-N87 gastric cancer cell lines were grown in RPMI-1640 medium (Sigma-Aldrich) supplemented as above. Stably transfected U2OS cells were maintained in standard medium containing 1mg ml-1 G418 (Invitrogen). siRNA duplexes were obtained from Life Sciences: Lamin A/C stealth RNAi: CCAUGAAGGAGGAACUGGACUUCCA and GCGUGAGGAGUUUAA-GGAGCUGAAA, NAT10 stealth RNAi: GAGCAUGGACCUCUCUGAAUACAUA, and as control siRNA, stealth RNAi negative control duplexes were used. Plasmid DNA and siRNA transfections were carried out using Lipofectamine 2000 and Lipofectamine RNAiMax (Life Sciences) respectively, following the manufacturer’s instructions. Cells were analysed 48 to 72 h after transfection.
Drug treatments. The following KAT and KDAC inhibitors were included in the nuclear shape rescue screen, incubating cells with the molecules for 16 h: trichostatin A (1 μM), sodium butyrate (5 mM), tubacin (10 μM), SAHA (5 μM), curcumin (10 μM), garcinol (50 μM), anacardic acid (1 μM), MB-3 (5 μM), 4-(4-chlorophenyl)-2-(2-cyclopentylidenehydrazinyl)thiazole (1) (50 μM), 4-(4-chlorophenyl)-2-(2-cyclopentylidene-1-(prop-2-yn-1-yl)hydrazinyl)thiazole (2) (50 μM) and cyclopentylidene-[4-(4-cyanophenyl)thiazol-2-yl)hydrazine (4) (Remodelin) (10 to 50 μM). For HGPS cellular fitness assays, Remodelin was incubated at 1 μM for 1 to 10 days, renewing the medium every 3 days. For long-term senescence assay, cells were kept and passaged in medium containing 1 μM Remodelin or DMSO only for 12 population doublings. Senescence was assessed after 8 days of Remodelin treatment when cells were at Population Doubling 12, and then after several weeks of Remodelin treatment, when cells reached Population Doubling 24 using the Senescence β-Galactosidase Staining Kit #9860 from Cell Signaling. Nocodazole, colchicine and latrunculin A (Sigma-Aldrich) were used at 200ng/ml, 1 μg/ml and 1 μM respectively. Aphidicolin (Sigma-Aldrich) was used at 5 μg/ml for 16 h. Farnesyltransferase inhibitor FTI-277 was purchased from Tocris Bioscience and used at 5 μM. ATMi (KU55933) and ATRi (ATR-45) were obtained from Tocris Bioscience and from the Ohio State University respectively and used at 10 μM and 500 nM. Pifithrin alpha (Sigma-Aldrich) was used at 10 μM.

3
Live imaging of GFP-H2B cells. U2OS cells were transfected with siLMNA for 48h before addition of (1) at 50 μM. Pictures were acquired every 15 min for 16 h in z-stack of 0.2 μm interval with a Deltavision PersonalDV (Applied Precision, 512x512 CoolSNAP HQ2 camera) equipped with a 100x UPlanSApo/1.40 oil objective (Olympus) and controlled with SoftWoRx software (Applied Precision). Movies were then assembled from pictures with ImageJ software.
Flow cytometry. 10 μM EdU was incubated for 2 h when indicated. Cells were fixed in 4% paraformaldehyde (Sigma-Aldrich). EdU was fluorescently labeled using the Click-iT® EdU Flow Cytometry Assay Kit (Life Sciences). DNA was stained with 50 mg ml-1 propidium iodide (Sigma-Aldrich) in phosphate buffer solution (PBS) containing 0.1% Triton X-100 and 0.5mg ml-1 DNase free RNase A (Sigma-Aldrich). Samples were processed on a FACSCalibur flow cytometer equipped with CellQuest software (Becton Dickinson). Results were analysed by FlowJo software (TreeStar).
Nuclear circularity and nuclear area quantification. CellProfiler software was used to quantify nuclear circularity and nuclear area from DAPI staining pictures, using the “object size shape” measurement. The AreaShape measurement allowed the calculation of the Form Factor index (4 × π × Area/Perimeter2) corresponding to circularity (a Form Factor of 1 reflecting a perfect circle), as well as the calculation of nuclear Area.
Proliferation assay. HGPS cells were plated at the same number in 24 well dishes. Next day, Remodelin (1 μM) or small molecule 1 (1 to 10 μM), were added to the wells and plates were transferred into an IncuCyte microscope (Essen BioScience). Phase contrast pictures were acquired every 2 h over 250 h. Percentage of cell confluence was calculated by the Cell Player integrated software (Essen BioScience) and analysed with GraphPad Prism® software.
Protein purification from human cells. HEK293 cells were transiently transfected with NAT10 constructs and harvested after 48 h in PBS. Cells were lysed for 5 min at room temperature in IP lysis buffer (20 mM Tris pH 7.5, 40 mM NaCl, 2 mM MgCl2, 0.5% NP-40) freshly supplemented with 50 U/ml benzonase and EDTA-free protease inhibitor cocktail (Roche). After this initial lysis step, NaCl concentration was adjusted to 450 mM and samples were incubated at 4°C with rotation. Lysates were clarified by centrifugation (13,200 rpm, 20 min at 4°C), and after recovery NaCl concentration was equilibrated to 150 mM. Lysates were used for immunoprecipitation reaction in IP buffer (25 mM Tris pH 7.5, 150 mM NaCl, 1.5 mM DTT, 10% glycerol, 0.5% NP-40) supplemented with protease inhibitors. Target proteins were captured with anti FLAG antibody (Sigma-Aldrich) coupled to protein A/G-Dynabeads (Life Sciences). Complexes were washed with IP buffer containing incrementally increasing amounts of NaCl (250mM, 500mM, and 1M). Following this, the immuno-complexes were washed in TBS containing gradually decreasing amounts of NaCl (1M, 500mM, 250mM, and 150mM). At this point, elution was carried out using excess triple-Flag peptide (Sigma Aldrich). Eluted

4
proteins were loaded on a gel and the purification was verified by Silver Staining (SilverQuest kit, Life Sciences).
Analysis of soluble or polymerised tubulin. U2OS cells pre-treated with 5 μM Remodelin for 16 h or with 10 μM nocodazole for 8h, were lysed in MT Stabilization Buffer (MSB) (85 mM PIPES [pH 6.9], 1 mM EGTA, 1 mM MgCl2, 2M glycerol, 0.5% Triton with 4 μg/ml Taxol). Lysates were kept at 4°C for 2 min and then centrifuged for 10 min at 13,000 rpm. Supernatants, representing the soluble fraction of proteins, were transferred to new tubes, and Laemmli buffer was added. Pellets, representing the polymerized fraction of proteins, were washed once in MSB without Triton, and then resuspended in Laemmli buffer. Equal amounts of lysate were loaded on a gradient gel.
Microtubules regrowth assay. 48 h after siRNA transfections, microtubules were depolymerized by cold treatment at 4°C for 1 h in cells pre-treated or not with 1 to 5 μM Remodelin for 16 h. Cold medium was replaced by pre-warmed medium and cells were incubated at 37°C for 5 or 15 min to allow microtubule nucleation and anchorage respectively. Cells were fixed in PFA and stained with anti α-Tubulin antibody as described in the immunofluorescence procedure.
Immunoblotting. Total cell extracts were prepared by scraping cells in SDS lysis buffer (4% SDS, 20% glycerol, and 120 mM Tris-HCl, pH 6.8), boiling for 5 min at 95°C, followed by 10 strokes through a 25-gauge needle. Before loading, lysates were diluted with a solution of 0.01% bromophenol blue and 200 mM DTT and boiled for 5 min at 95°C. Proteins were resolved by SDS-PAGE on 4-12% gradient gels (NUPAGE, Life Sciences) and transferred onto nitrocellulose membrane (Protran; Whatman). Secondary antibodies conjugated to IRDye 800CW were from LI-COR Biosciences. Detection and quantification was performed with an imager (Odyssey; LI-COR Biosciences).
Immunofluorescence. Cells were washed with PBS and fixed for 20 min with 2% PFA in PBS. Cells were permeabilised for 5 min with PBS/0.2% Triton X-100, and blocked with PBS/0.2% Tween 20 (PBS-T) containing 5% BSA. Coverslips were incubated for 1 h with primary antibodies and for 30 min with appropriate secondary antibodies coupled to Alexa Fluor 488 or 594 fluorophores (Life Technologies), before being incubated with 2μg/ml DAPI. Pictures were acquired with a FluoView 1000 confocal microscope (Olympus). For high resolution imaging, z-stacks were aquired with a Deltavision PersonalDV (Applied Precision, 1024x1024 CoolSNAP HQ2 camera, z-stack of 0.2 μm interval) or with a Deltavision OMX V3 in conventional mode (Applied Precision, 512x512 Cascade II cameras (Photometrics), z-stack of 0.125 μm interval) both equipped with a 100x UPlanSApo/1.40 oil objective (Olympus) and controlled with SoftWoRx software (Applied Precision). Deconvolutions were then performed with SoftWoRx (Applied Precision) in conservative mode. The different channels were acquired sequentially.
5
Fluorescent labeling of clickable molecules. Cells were pre-incubated with clickable molecules 2 or 3 for 2 h before being fixed and permeabilised as described above. Click reaction was prepared using Invitrogen Click-iT reagents with Alexa fluor 488 Azide and incubated with fixed cells for 1 h in the dark. In case of co-labeling with another protein, the click reaction was performed before the antibody incubations.
Antibodies. Antibodies used in this study are:
Abcam antibodies: Santa Cruz antibodies:
Lamin A/C ab40567 Lamin A/C sc-6215
HMG1 ab18256 p53 (DO-1) sc-126
H2AX total ab11175 p21 sc-397
Histone H3 ab1791
β-actin ab8226 Cell Signaling antibodies:
ATM (phospho S1981) ab81292 γH2AX 2577
SUN1 ab124770 p-Rb (Ser 807/811) 9308
anti-Giantin ab24586 Rb 9309
α-tubulin T9026 p-p53 (Ser15) 9284
H3K9me3 ab8898
Sigma-Aldrich antibodies: Others:
α-tubulin FITC F2168 γH2AX 05-636 Millipore
FLAG F3165 NAT10 13365-1-AP ProteinTech
Micrococcal nuclease digestion sensitivity assay. 1x10⁶ cells were trypsinized, harvested, and washed once with 1ml of 1xRSB buffer (10 mM Tris, pH 7.6, 15 mM NaCl, and 1.5 mM MgCl2). After centrifugation (3,00 x g), the cell pellet was resuspended in 1 ml of 1x RSB buffer with 1% Triton-X 100 and homogenized by five strokes with a loose-fitting glass pestle to release nuclei. Nuclei were collected by centrifugation (13, 000 x g) and washed twice with 1 ml of buffer A (15 mM Tris, pH 7.5, 15 mM NaCl, 60 mM KCl, 0.34 M sucrose, 0.5 mM spermidine, 0.15 mM spermine, 0.25 mM PMSF, and 0.1% β-mercaptoethanol). Nuclei were resuspended in Buffer A and aliquoted into 100 μl aliquots. 1.2μl of 0.1 M CaCl2 was added to each aliquot and nuclei were digested by addition of 0.25 μl of 200 U/ml MNase (Sigma-Aldrich) and incubated at 30°C. Each aliquot was put back on ice at different time points and digestion was immediately stopped by addition of 3μl EDTA. DNA was purified using the Qiagen PCR purification kit and 1500 ng of DNA was analysed on a 1.5% agarose gel. Digestion profiles were analysed using ImageJ and values were adjusted relative to the global intensity of each lane to compensate for DNA loading variations.

6
Lysine acetyltransferase (KAT) assay. The KAT assay was performed using the Fluorescent HAT Assay kit (Active Motif) using NAT10 purified from HEK293 cells and 5 μg of purified MAP enriched Tubulin Porcine (Tebu-bio) as a substrate. Remodelin and clickable molecule 2 were used at 50 μM.
Circular Dichroism Spectroscopy. CD experiments were performed using a Chirascan Circular Dichroism Spectrophotometer (Applied Photophysics, UK). 200 μl of purified FLAG-NAT10 at a final concentration of 10 μM in TBS + 0.1 % NP-40 (Sigma-Aldrich) was placed in a quartz cuvette with an optical path length of 1 mm, transferred to the spectrophotometer. CD scans were recorded at 25°C over the wavelength range of 180 to 350 nm with a 1s response time, 1 nm pitch and 1.5-nm bandwidth. Compound 1 solubilized in DMSO was added and the solution was incubated for 5 min before recording scans. CD spectra were buffer subtracted, zero corrected at 300 nm and normalized (Molar ellipticity θ is quoted in 105 deg cm2 dmol−1).
DNA manipulations. All DNA constructs were validated to be mutation-free by DNA sequencing. A list of DNA oligonucleotides used in this study is provided below. pICE-FLAG was generated by cloning annealed primers FLAG-S and FLAG-AS into HindIII- and BamHI-digested pICE, a new synthetic plasmid conferring puromycin-resistance to mammalian cells (29). To generate NAT10 cDNA resistant to NAT10 siRNA, NAT10 cDNA was amplified from IMAGE clone 5166101 (Source Bioscience) using primer pairs NAT10-F and NAT10-siR-R, or NAT10-siR-F and NAT10-R. The resulting PCR products were fused together by PCR using primers NAT10-F and NAT10-R. The resulting PCR product was digested with BamHI and MluI and cloned into pICE-FLAG digested with the same restriction enzymes. To generate pICE-FLAG-NAT10-G641E, the G641E mutation was introduced into pICE-FLAG-NAT10 using QuickChange Site-Directed Mutagenesis kit (Agilent Technologies), according to the manufacturer’s instructions and using primers NAT10-G641E-F and NAT10-G641E-R.
List of DNA oligonucleotides used in this study. Name Sequence 5’ to 3’ FLAG-S AGCTTGCGGCCGCCGCCACCATGGATTACAAGGATGACGACGATAAGG
FLAG-AS GATCCCTTATCGTCGTCATCCTTGTAATCCATGGTGGCGGCGGCCGCA
NAT10-F GCCGGATCCATGCATCGGAAAAAGGTGGATAACCG
NAT10-R CGGACGCGTCTATTTCTTCCGCTTCAGTTTCATATC
NAT10-siR-F CTGAAATCAATGGATTTGAGTGAATATATTATCCGTGGGGACGATGAAGAGTGG
NAT10-siR-R GGATAATATATTCACTCAAATCCATTGATTTCAGCTTCCCTACTTCCTTCTTGTG
NAT10-G641E-F CAAGGGATGGGCTATGAGAGCCGTGCTCTGCAG
NAT10-G641E-R CTGCAGAGCACGGCTCTCATAGCCCATCCCTTG

7
Synthesis of Remodelin and derivatives. All solvents and reagents were purified using standard techniques or used as supplied from commercial sources (Sigma-Aldrich). NMR spectra were acquired on a Bruker 500 MHz instrument using deuterated solvents at 300 K. Notation for the 1H NMR spectral splitting patterns includes: singlet (s), doublet (d), triplet (t), broad (br) and multiplet/overlapping peaks (m). Signals are quoted as values in ppm and coupling constants (J) are quoted in Hertz. Mass spectra were recorded on a Micromass® Q-Tof (ESI) spectrometer.
General procedure: The appropriate ketone or aldehyde was dissolved in isopropanol at a final concentration of 0.5 M and refluxed for 24h in the presence of an equimolar amount of thiosemicarbazide. The corresponding thiosemicarbazones were isolated by filtration and recrystallized from hot ethanol. Equimolar amounts of thiosemicarbazones and the desired haloketones were stirred at room temperature in isopropanol overnight at a final concentration of 0.2 M. The resulting products were recrystallized from hot ethanol several times to yield pure products and were used without further purification.
4-(4-chlorophenyl)-2-(2-cyclopentylidenehydrazinyl)thiazole hydrochloride salt (1) Thiosemicarbazide (20 g, 220 mmol) and cyclopentanone (19.43 ml, 220 mmol) were refluxed in 500 ml of isopropanol for 24 h. The precipitate was filtered and recrystallized
from hot ethanol to provide the corresponding thiosemicarbazone (2-cyclopentylidenehydrazine-1-carbothioamide) as pale yellow crystals. 2-cyclopentylidenehydrazine-1-carbothioamide (10 g, 63 mmol) and 2,4’-dichloroacetophenone (12 g, 63 mmol) were stirred overnight in 300 ml of isopropanol at room temperature. The precipitate was filtered and recrystallized from hot ethanol to yield the hydrochloride salt of the desired compound (16 g, 48 mmol, 77%) as light yellow needles. Spectral data were in agreement with those previously described in the literature (16). Molecule 1 was resuspended in DMSO at 10mg/ml.
4-(4-chlorophenyl)-2-(2-cyclopentylidene-1-(prop-2-yn-1-yl)hydrazinyl)thiazole (2) To a solution of 1 (1 g, 3 mmol) in freshly distilled DMF (75 ml) was added K2CO3
(1.375 g, 10 mmol), triethylamine (1.4 ml, 10 mmol) and propargyl bromide (1.2 ml, 5 mmol, 80 wt. % in toluene). The solution turned purple after 12 h at room temperature. Propargyl bromide (1.2 ml) was added and the reaction mixture was stirred for another 12 h. The solvent was then evaporated under reduced pressure and the crude residue dissolved in CH2Cl2, washed several times with saturated solutions of NH4Cl and NaCl and dried over MgSO4. The solvent was evaporated under reduced pressure and the desired product (0.35 g, 1 mmol, 34%) was obtained as a brown oil after regular column chromatography. TLC (Hexane : CH2Cl2, 80 : 20): Rf = 0.25; 1H NMR (500
MHz, CDCl3): δ 7.78 (d, J = 8.0 Hz, 2H), 7.32 (d, J = 8.0 Hz, 2H), 6.86 (s, 1H), 4.65 (s, 2H), 2.64–2.55 (m, 4H), 2.22 (s, 1H), 1.86–1.82 (m, 4H); 13C NMR (125 MHz, CDCl3): δ 184.9, 171.8, 150,6, 133.4, 133.3, 128.6 (2C), 127.3 (2C), 105.2, 78.3, 72.5, 42.7, 33.8,

8
31.5, 24.9, 24.4; HRMS (m/z): [M]+ calcd. for C17H16ClN3S, 329.0758; found, 329.0747. Molecule 2 was resuspended in DMSO at 10mg/ml.
1-Chloro-4-ethynilbenzene (Clickable inactive molecule 3) was purchased from Sigma-Aldrich.
4-(4-cyanophenyl)-2-(2-cyclopentylidenehydrazinyl)thiazole (4, Remodelin)
2-cyclopentylidenehydrazine-1-carbothioamide (1 g, 4.46 mmol) and 2-bromo-4’-cyanoacetophenone (700 mg, 4.45 mmol) were stirred overnight in 12 ml of isopropanol at room temperature. The precipitate was filtered and recrystallized from hot ethanol to yield the hydrobromide salt of the desired compound (559 mg, 1.98 mmol, 45%) as light yellow needles. 1H NMR (500 MHz, CDCl3): δ 12.11 (br s), 7.84 (d, J = 9.0 Hz, 2H), 7.81 (d, J = 9.0 Hz, 2H), 6.84 (s, 1H), 2.61 (t, J = 9.0 Hz, 2H), 2.51 (t, J = 9.0 Hz, 2H), 1.94–1.80 (m, 4H); 13C NMR (125 MHz, CDCl3): δ 173.8, 169.5, 138.8, 133.5, 131.3,
126.3, 118.0, 114.1, 103.8, 33.7, 31.2, 25.2, 25.0; HRMS (m/z): [M]+ calcd. for C15H15N4S, 283.1009; found, 283.1017. Molecule 4 was resuspended in DMSO at 10mg/ml.
Small molecules for protein pull-down assays. Biotinylated derivative 5 was synthesized from compounds 2, commercially available O-(2-aminoethyl)-O’-(2-azidoethyl)heptaethylene glycol and (+)-biotin N-hydroxysuccinimide. Biotinylated derivatives 6 and control 7 were generated in situ from 2 and 3, by addition of PEG4 carboxamide-6-azidohexanyl biotin (Life Sciences) and click reagents in cell extracts.
Biotinylated small molecule pull-downs. Cells were harvested in PBS and lysed in RIPA buffer supplemented with 1 mM PMSF and protease inhibitors (Roche) for 30 min at 4°C with rotation. The supernatants were collected by centrifugation at 16,000 x g for
9
10 min. Supernatants were then incubated with 40 μM of biotinylated small molecule or for the competition experiment with 200 μM of (1) and 40 μM of biotinylated compound for 2 h. Streptavidin coated magnetic beads (Dynabeads M-280 Streptavidin, Life Sciences) were washed 3 times with binding buffer (25 mM Tris.HCl, 150 mM NaCl, 0.1% Triton) and incubated with supernatants for 1 h at 4°C with rotation. The magnetic beads were washed 3 times with the binding buffer followed by boiling in Laemmli buffer for 5 min to elute the proteins. Samples were then loaded on 4-12% gradient gels (NUPAGE, Life Sciences), analyzed by silver staining (SilverQuest staining kit, Life Sciences) and specific bands were cut and analysed by LC-MS/MS.
Clickable small molecule pull-downs. Cells were incubated with clickable compounds 2 and control 3 for 2 h and cell lysates were prepared as described above. Small molecules were then coupled to biotin using the click reaction to form molecules 6 and 7. Click reaction reagents were added to the cell lysates as follows: 10 μM biotin azide (PEG4 carboxamide-6-Azidohexanyl Biotin, Life Sciences), 10 mM sodium ascorbate (Sigma-Aldrich), 2 mM CuSO4 (Life Sciences). Click reactions were incubated in the dark for 1 h at 4°C with rotation. Streptavidin beads were then incubated for 1 h and samples were eluted and loaded on a gel as described above, before immunoblotting.
10
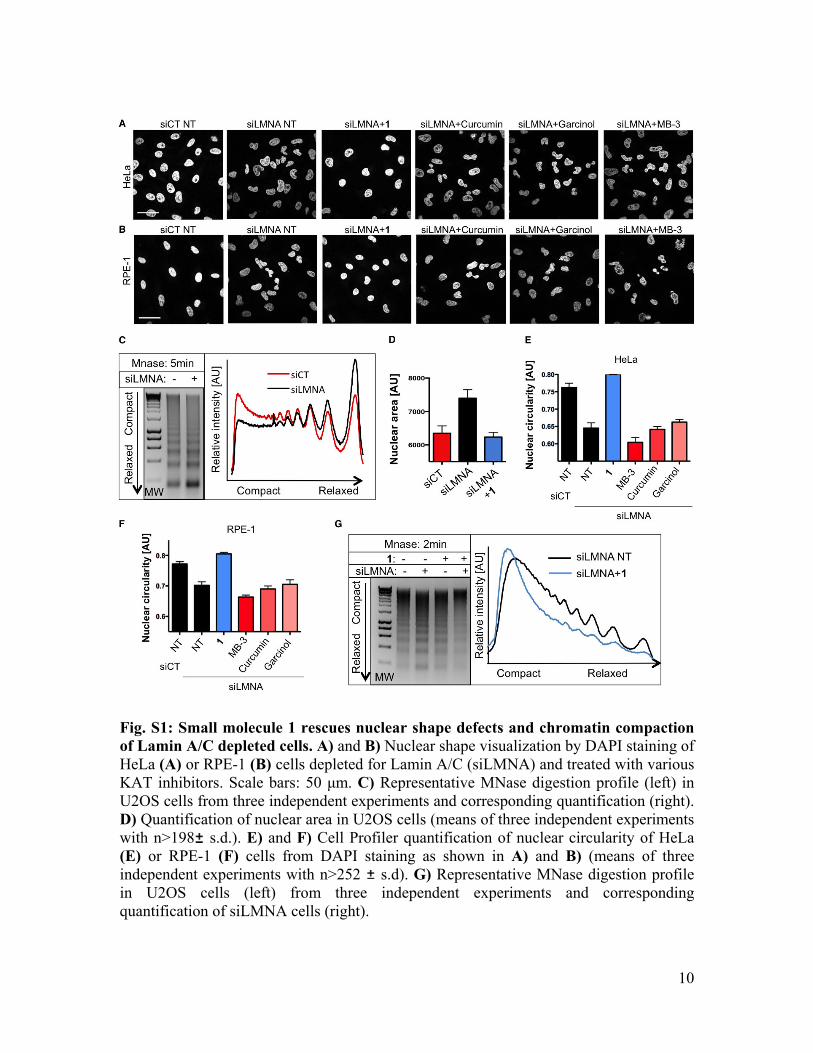
Fig. S1: Small molecule 1 rescues nuclear shape defects and chromatin compaction of Lamin A/C depleted cells. A) and B) Nuclear shape visualization by DAPI staining of HeLa (A) or RPE-1 (B) cells depleted for Lamin A/C (siLMNA) and treated with various KAT inhibitors. Scale bars: 50 μm. C) Representative MNase digestion profile (left) in U2OS cells from three independent experiments and corresponding quantification (right). D) Quantification of nuclear area in U2OS cells (means of three independent experiments with n>198 s.d.). E) and F) Cell Profiler quantification of nuclear circularity of HeLa (E) or RPE-1 (F) cells from DAPI staining as shown in A) and B) (means of three independent experiments with n>252 s.d). G) Representative MNase digestion profile in U2OS cells (left) from three independent experiments and corresponding quantification of siLMNA cells (right).

11
Fig. S2: Small molecule 1 acts independently of the cell cycle and improves nuclear shape in cancer cells with low Lamin A/C expression. A) Nuclear shape rescue of LMNA depleted cells after treatment with 1 is independent of mitosis, and still occurs in cells synchronized in S phase by aphidicolin to prevent mitotic entry. Scale bars: 20 μm. B) and C) Cell cycle profiles of indicated cell lines analysed by flow cytometry. PI: propidium iodide. Scale bars: 20 μm. D) Analysis of Lamin A/C expression levels in

12
indicated cancer cell lines. Bottom panel: Image J quantification of Lamin A/C expression in cancer cells relative to normal RPE-1 cells. E) Representative pictures of DAPI staining showing nuclear shape improvement in low Lamin A/C expressing cancer cells after treatment with 1. Scale bars: 20 μm.

13
Fig. S3: Biotin analog of 1 retrieves the acetyl-transferase protein NAT10. A) Molecular structure of biotinylated analogue. B) Silver staining of proteins after pull-down of biotinylated molecule and identification of specific bands (see arrows) decreasing in the presence of 5 equivalents of non-clickable molecule 1. The band

14
corresponding to NAT10 is magnified on the right (*) together with other specific and non-specific bands. C) Specific protein hits retrieved by biotinylated small molecule and identified by liquid chromatography-tandem mass spectrometry (LC-MS/MS).

15
Fig. S4: Subcellular localization of the molecules and analysis of Remodelin binding to purified NAT10. A) Fluorescent labeling of clickable control molecule 3 showing no specific staining, contrasting to molecule 2 (see Fig. 1K). Scale bar: 20 μm. B) NAT10 depletion by siRNA (siNAT10) is observed by western blotting. C) IF pictures of Lamin A/C and NAT10 staining within cells transfected or treated as indicated. Scale bar: 20 μm. D) NAT10 was expressed and purified in human HEK293 cells and analysed by silver staining (left *). NAT10 folding was assessed by circular dichroism spectroscopy (right). In the absence of compound, the NAT10 spectra displayed a characteristic negative signal at 210 nm, reflecting the presence of α-helices. Upon addition of

16
molecule 1, absolute molar ellipticity increased, consistent with stabilization of NAT10 by supramolecular stapling (30) and suggesting that stabilization of protein folding by 1 might inhibit NAT10 activity.

17
Fig. S5: Screening of 1 analogs to identify structural requirements for nuclear shape rescue. A) Nuclear shape analysis by DAPI staining in siLMNA cells treated with the indicated analogs of 1. B) Dose-dependent nuclear shape rescue observed by DAPI staining of siLMNA cells, showing an ~5-fold increase in the potency of Remodelin compared to 1. Scale bar: 20 μm.

18
Fig. S6: NAT10 mutation G641E (MUT) does not affect its localization. A) Alignment of NAT10 GNAT (Gcn5-related N-acetyltransferase) domain showing the conservation of G641. B) Silver staining of purified FLAG-NAT10 WT or G641E mutant (MUT) from Human HEK293 cells. These proteins were used in acetyl-transferase activity assays (Fig. 2E). C) Characterization of U2OS cells stably expressing siRNA resistant constructs of FLAG-NAT10 WT and MUT. Expression of constructs and siRNA resistance was assessed by western blotting and D) the correct localization of both constructs was verified by IF staining using anti-NAT10 antibody or anti-FLAG antibody. Scale bars: 10 μm.

19
Fig. S7: Remodelin rescues nuclear shape of aged MRC5 cells but not Werner Syndrome cells in a dose-dependent manner. A) Misshapen nuclei observed by DAPI staining in MRC5 aged cells in culture, at population doubling 44 (PD44) was rescued by Remodelin. B) Quantification of misshapen nuclei after increasing concentrations of Remodelin (mean of three independent experiments ± s.e.m.). C) DAPI staining of non-laminopathic Werner syndrome cells showing no nuclear shape improvement upon Remodelin treatment. D) Cell Profiler quantification of misshapen nuclei (means of three independent experiments ± s.d. n>273). Scale bars: 50 μm.

20
Fig. S8: Remodelin prevents FTI induced nuclear shape defects in non-progeric cells. A) Analysis of Lamin A/C processing after Remodelin or FTI treatment, showing that Remodelin is not a FTI. B) Representative pictures of Lamin A/C IF staining after the indicated treatments. Arrows indicate FTI induced misshapen nuclei in normal fibroblasts. Scale bar: 50 μm. C) Quantification of misshapen nuclei with the indicated cell lines and inhibitor treatments (means of three independent experiments ± s.e.m.

21
n>178). D) Representative pictures of DAPI staining showing effects of FTI and Remodelin on nuclear shape of U2OS cells. Scale bars: 20 μm.

22
Fig. S9: Remodelin improves global cellular fitness of HGPS cells. A) NAT10 depletion in normal fibroblasts and HGPS AG11498 cells observed by western blotting, and showing that siNAT10 has no effect on Lamin A/C expression and processing. B) IF images showing nuclear shape improvement and decreased numbers of γH2AX foci in HGPS cells upon Remodelin treatment. Scale bars: 10 μm. C) Western Blotting analysis showing that Remodelin decreases γH2AX levels in both HGPS cell lines tested. D)

23
Western blotting analysis showing the effect of Remodelin on the p53 and DNA damage signalling pathways in HGPS AG11498 cells. E) Representative IF images of H3K9me3 or SUN1 patterns quantified in F). Scale bars: 20 μm. G) IF staining showing more intense and homogenous DAPI staining, as well as reorganization of nucleolus architecture as observed by NAT10 staining upon Remodelin treatment. Scale bars: 10 μm. H) Flow cytometry analysis after 2 hours of EdU incorporation in HGPS cells upon Remodelin treatment showing enhancement of DNA replication rate. I) Quantification of senescence-associated β-galactosidase positive cells after treatment with p53 inhibitor (Pifithrin) or with the indicated KAT inhibitors, showing that none of these compounds decrease the senescence in HGPS AG11498.

24
Fig. S10: Remodelin targets the microtubule network in HGPS cells to improve nuclear shape. A) Nuclear shape visualisation and quantification after treating cells with microtubule-disrupting agents. B) Microtubule regrowth assay in HGPS AG11498 cells treated with Remodelin. α-tubulin inverted IF staining shows normal microtubule

25
depolymerisation (T=0) and nucleation phase (T=5 min) but defects in the microtubule anchorage (T=15 min) upon Remodelin treatment. C) Microtubule regrowth assay as in B) showing defects in the microtubule anchorage (T=15 min) upon NAT10 depletion (siNAT10) in the indicated HGPS cell lines and compared to cells transfected with control siRNA (siCT). Scale bars: 20 μm.

26
Fig. S11: Model of nuclear shape rescue by Remodelin. Laminopathic cells have enlarged, misshapen nuclei associated with disorganized chromatin structure. Upon Remodelin treatment, NAT10 acetyltransferase activity is inhibited, leading to disruption of microtubule anchorage at the centrosome and release of microtubule forces on the nuclear envelope. This release of mechanical stress on the nucleus contributes to nuclear shape rescue and global improvement of cell fitness and chromatin organization. Additional nuclear function of NAT10 might also contribute to chromatin reorganization, decreased DNA damage and decreased senescence.
Movie S1: Live imaging of nuclear shape rescue in siLMNA cells. U2OS stably expressing GFP-H2B were transfected by siLMNA and treated with Remodelin. Pictures were acquired every 15 min over 12 h.