Supplementary Material and MethodsSupplementary Material and Methods ... The relationship between...
23
This File contains Supplementary Materials and Methods and 8 Supplementary Figures. Supplementary Material and Methods Gene expression profiling analyses. TCGA breast cancer transcriptional profiling data previously analyzed in (1) were downloaded from the TCGA website https://tcga-data.nci.nih.gov/docs/publications/brca_2012/ (file BRCA.exp.547.med.txt, level 3 data freeze from November 2011). Data were processed on Agilent custom 244K whole genome arrays for 522 tumors, 3 metastatic tumors, and 22 tumor-adjacent normal and provided as median centered on 17,184 genes. Genes with a low dynamic range (estimated by standard deviation < 0.5 and max - min expression across samples < 1.5) were filtered out and the expression data were restricted to the 12,459 reliable genes. Clinical information on estrogen receptor (ER) status and progesteron receptor (PR) status were available in the BRCA_Clinical.tar/nationwidechildrens.org_ clinical_patient_public_brca.txt file with several clinical information inconsistencies highlighted in (1). ERBB2 clinical status was assessed as described by integrating immunohistochemistry results with FISH results and copy number calls. Breast cancer intrinsic subtypes were assigned for 514 of the 522 primary tumors based on the PAM50 calls (file BRCA.547.PAM50.SigClust.Subtypes.txt) (1, 2) as Basal (98 samples out of which 82 were triple negative tumors), Her2 (58 samples), Luminal A (231 samples) and Luminal B (127 samples). Amplification status for the chr1q32.1 region harboring IKKε as estimated by GISTIC (3) was available for 498 primary tumors. The IKKε high/low status for individual tumors was evaluated based on the z-scores of IKKε expression and the absolute cutoff threshold 1. In statistics, the z-score is the (signed) number of standard deviations an observation is above the mean. The z-scores of IKKε expression were
Transcript of Supplementary Material and MethodsSupplementary Material and Methods ... The relationship between...

This File contains Supplementary Materials and Methods and 8 Supplementary Figures.
Supplementary Material and Methods
Gene expression profiling analyses. TCGA breast cancer transcriptional profiling data previously
analyzed in (1) were downloaded from the TCGA website
https://tcga-data.nci.nih.gov/docs/publications/brca_2012/ (file BRCA.exp.547.med.txt, level 3
data freeze from November 2011). Data were processed on Agilent custom 244K whole genome
arrays for 522 tumors, 3 metastatic tumors, and 22 tumor-adjacent normal and provided as
median centered on 17,184 genes. Genes with a low dynamic range (estimated by standard
deviation < 0.5 and max - min expression across samples < 1.5) were filtered out and the
expression data were restricted to the 12,459 reliable genes. Clinical information on estrogen
receptor (ER) status and progesteron receptor (PR) status were available in the
BRCA_Clinical.tar/nationwidechildrens.org_ clinical_patient_public_brca.txt file with several
clinical information inconsistencies highlighted in (1). ERBB2 clinical status was assessed as
described by integrating immunohistochemistry results with FISH results and copy number calls.
Breast cancer intrinsic subtypes were assigned for 514 of the 522 primary tumors based on the
PAM50 calls (file BRCA.547.PAM50.SigClust.Subtypes.txt) (1, 2) as Basal (98 samples out of
which 82 were triple negative tumors), Her2 (58 samples), Luminal A (231 samples) and
Luminal B (127 samples). Amplification status for the chr1q32.1 region harboring IKKε as
estimated by GISTIC (3) was available for 498 primary tumors.
The IKKε high/low status for individual tumors was evaluated based on the z-scores of IKKε
expression and the absolute cutoff threshold 1. In statistics, the z-score is the (signed) number of
standard deviations an observation is above the mean. The z-scores of IKKε expression were
computed by subtracting from the gene expression for each sample the average gene expression
across all samples and by dividing the result to the standard deviation of gene expression across
samples. High IKKε status was assigned to samples with z-scores above 1.
TNBC subtypes used for unsupervised clustering were identified within the 82 basal TCGA
samples with negative ER and negative PR status by applying the ssGSEA method (see below)
for six TNBC subtype signatures identified by Lehman et al (4). In their study Lehman et al
analyzed gene expression profiles for 587 TNBC samples from 21 breast cancer data sets and
identified six TNBC subtypes displaying unique gene expression signatures and ontologies,
including 2 basal-like (BL1 and BL2), an immunomodulatory (IM), a mesenchymal (M), a
mesenchymal stem–like (MSL), and a luminal androgen receptor (LAR) subtype. The gene
signatures consisting of top 300 genes up-regulated and top 300 genes down regulated in each of
the six TNBC subtypes versus all others were provided by Supplementary Table S3 in Lehman et
al. The B-cell cluster signature reflects lymphocytic infiltration and was derived from Iglesia et
al (5). Correlation of IKKε mRNA expression with TP53 mutational status (present or absent)
within the TCGA dataset was analyzed by two sample t-test in all tumors and in the TNBC
subset. The relationship between IKKε levels and Miller-Payne response to neoadjuvant cisplatin
(6) was also measured by t-test comparison of poor (0-2) and good (3-5) responders.
The single sample GSEA (ssGSEA) Method. The ssGSEA method (7) and implemented in
GenePattern v3.6.1 (8) provides for each individual tumor sample an enrichment score (ES) with
respect to a priori defined gene set signatures. The enrichment score provides evidence for the
coordinate up- or down-regulation of a gene set’s members within individual samples. In

ssGSEA the genes for each individual sample are ranked based on their expression intensity by
applying the RankNormalize method implemented in GenePattern (8). ES is calculated as a
running sum statistic by walking down across the ranked list of genes, increasing the sum when
encountering genes in the gene set and decreasing it when encountering genes not in the gene set.
A positive ES denotes a significant overlap of the signature gene set with groups of genes at the
top of the ranked list, while a negative ES denotes a significant overlap of the signature gene set
with groups of genes at the bottom of the ranked list.
The IL-1 and IL-6 signatures were derived from the transcriptome profile of cultured human
macrophages stimulated for 4 h with interleukin 1 (IL-1) and interleukin 6 (IL-6) (9) derived
from the NCBI/Genbank GEO database (series entry GSE8515). The IL-1 signature was defined
based on the collection of 127 probe sets strongly activated by IL-1 only (cluster A) along with
the collection of 43 probe sets activated by both IL-1 and IL-6 (cluster C) (9). TNF, IFN-γ, and
IFN-2α signatures were generated from stimulated monocytes (10) based on GEO dataset
GSE38351. Correlation with IKKε mRNA expression was assessed using the normalized mutual
information statistic as described in (11).
The IL-1 high/low status for individual tumors was evaluated based on the z-scores of
enrichment with the IL-1 signature and the absolute cutoff threshold 1. ES scores for IL-1
signature enrichment were evaluated for each primary tumor sample by applying the ssGSEA
method described above. The z-scores of IL-1 enrichment were then computed by subtracting
from the ES value of each sample the average of the ES values across all samples and by

dividing the result to their standard deviation. High IL-1 status was assigned to samples with
enrichment z-scores above 1.
Cell Culture. All breast cancer cell lines and 293T cells were obtained from ATCC and cultured
in the recommended media for each cell line with supplements as per ATCC guidelines.
Immortalized human mammary epithelial cells (HMLE) isogenic for IKKε expression
(myristolated-Flag-IKKε or vector control) were cultured as described (12). For suspension
culture of triple negative breast cancer cell lines, cells were plated onto ultra low attachment
plates (from Corning Costar) for 48 h in their respective medium with or without IL-1β (25
ng/ml) and CYT387.
3D culture was performed as described using a novel microfluidic device (13). In brief, the
device consists of a central gel region surrounded by two channels on either side formed by
bonding a coverslip to a patterned polydimethylsiloxane (PDMS) substrate. MDA-MB-468
breast cancer cell spheroids obtained following 10-14 d suspension culture were embedded in
collagen matrigel in the central gel region. One channel was used to infuse media and the other
for stimulation of spheroid dispersal by addition of growth factor (EGF 20 ng/ml) or cytokines
(CCL5 and IL-6 each at 20 ng/ml). Cell dispersal was monitored over time by phase-contrast
imaging after growth factor/cytokine addition with or without CYT387 treatment. For
angiogenesis experiments, HUVECs were seeded in the central channel of the 3 chamber
angiogenesis device, surrounded by collagen on either side. Control media was infused through
one channel, while 293T cells transfected with IKKε x 24 h were seeded in the opposing channel,

or CCL5/IL-6 (20 ng/ml each) were added directly to media in this channel. HUVEC cell
migration was observed into collagen by phase-contrast imaging and distance was quantified
after 24 h. For MEK inhibitor experiments, GSK1120212 was added to CCL5/IL-6 at the
indicated concentrations.
Inhibitors, Growth Factors/Cytokines, and ELISA. CYT387 and Ruxolitinib were purchased
from Shanghai Haoyuan Chemexpress Co. Ltd. EGF (#4127) was from Sigma, IL-1β (#201-LB),
IL-6 (#206-IL), and CCL5 (#278-RN) were obtained from R&D. ELISA kits for IL-6 (D6050)
and CCL5 (DRN00B) levels were from R&D and were performed according to the
manufacturer’s instructions. Media was collected following transfection of 293T cells with
EGFP or IKKε +/- CYT387 (5µM) starting 12 h post-transfection, or following stimulation of
the TNBC lines with IL-1β (25 ng/ml) for 24h +/- CYT387 (5µM). Proteome ProfilerTM Human
Cytokine Array (ARY005) was purchased from R&D and treated with media from 293T cells
transfected with EGFP as a control, or IKKε +/- CYT387 (5µM) starting 12 h post-transfection.
Media was collected 24 h after transfection, the blot was performed according to the
manufacturer’s instructions and imaged using standard ECL-based detection and
autoradiography. Proteome ProfilerTM Human Phospho-kinase Array (ARY003B) was treated
with lysates from the same 293T cells, processed, and imaged by ECL-based detection and
autoradiography according to the manufacturer’s instructions.
Antibodies and Immunoblotting. Immunoblotting was performed according to a standard
protocol (14). Anti-STAT3 (#9132), Y705 pSTAT3 (#9145), STAT5 (#9358), Y694 pSTAT5

(#4322), p105 (#4717), S933 p-p105 (#4806), IKKα (#2682), IKKβ (#2370), and T180/Y182 p-
p38 (#4511) were from Cell Signaling Technologies. β-Actin antibody was from Santa Cruz
Biotechnology (#sc-47778 HRP). IKKε antibody was from Sigma (#I4907). Secondary
antibodies were from Bio-Rad. Blots were developed using standard ECL-based detection and
autoradiography.
Transfection, Lentiviral Infection, Constructs. 293T cells were transfected using Fugene 6
reagent (#11815091001, Roche) according to the manufacterer’s instructions with 1 µg of
plasmid. Lentiviral infection of shRNAs or ORFs was performed as described (7, 15). For
selection of virally infected cells, 1-2 µg/ml of Puromycin (pLKO.1) or 5-10 µg/ml of Blasticidin
(pLX304) was used 24 h post infection. pLKO.1 shRNA constructs were obtained from the
Broad Institute TRC (http://www.broadinstitute.org/rnai/trc) with the following sequences:
shGFP TRCN0000072181: 5’ ACAACAGCCACAACGTCTATA 3’ shIKKε-1 TRCN0000010036: 5’ TGGGCAGGAGCTAATGTTTCG 3’ shIKKε-2 TRCN0000010027: 5’ GAGCATTGGAGTGACCTTGTA 3’ pLX304-GFP, pLX304-IKKε-WT, and pLX304-IKKε-K38A constructs were used for transient
transfection of 293T cells. MDA-MB-468-IKKe-Y88C cells were generated by stable
transduction of MDA-MB-468 cells by lentiviral infection with pLX304-IKKe-Y88C using
blasticidin selection, followed by treatment in CYT387 (2.5 µM) for 3 weeks.
Quantitative Real-Time PCR. RNA was extracted from transfected 293T cells or snap-frozen
xenograft tumors using PerfectPure RNA Kit (5 PRIME). Reverse transcription of 1 µg RNA
samples was performed using SuperScript® III First-Strand Synthesis SuperMix (Invitrogen).
Quantitative real-time PCR was conducted using LightCycler® 480 SYBR Green I Master
(Roche) and Light Cycler 480 II real-time PCR system (Roche). Values were normalized to
36B4. The sequences of the primers used for RT-PCR are:
CCL5: FWD 5’CGCTGTCATCCTCATTGCTA3’, REV 5’GAGCACTTGCCACTGGTGTA3’ IL6: FWD 5’TCAATGAGGAGACTTGCCTG3’, REV 5’TCATCTGCACAGCTCTGGCT3’ IKKε: FWD 5’ATTACAACACTGCCAAGGGC3’, REV 5’AGCACCTCCATGACCCAGTG3’ 36B4: FWD 5’GCAATGTTGCCAGTGTCTGT3’, REV 5’GCCTTGACCTTTTCAGCAAG3’
Animal Studies. MDA-MB-468 xenografts were established following subcutaneous injection of
1X10^6 cells into nude mice. WHIM patient derived xenografts were cultured as described (16,
17). Mice with established tumors were treated by daily oral gavage with vehicle control or
CYT387 dissolved in N-Methyl-2-pyrrolidone (Sigma-Aldrich) at 100 mg/mL and mixed with a
methylcellulose/tween vehicle (0.5% methylcellulose (Sigma-Aldrich) and 0.4% polysorbate-80
(Tween-80) (Sigma-Aldrich) in sterile water for daily oral gavage dose of 100 mg/kg. Tumor
area measurements were obtained in a blinded fashion, and tumor volume was calculated using
the formula ((width)2 x length)/2.
For short term pharmacodynamics studies mice were treated for 3 d to achieve steady state
inhibition and tumors were harvested 6 h after the final dose of drug. Tumors were isolated and
snap frozen for qRT-PCR or immunoblotting, or formalin fixed for immunohistochemistry (IHC).
IHC staining was performed on FFPE tissue sectioned at 5µm thickness. Slides were
deparaffinized, rehydrated and treated with 3% H2O2 in PBS. Antigen retrieval was achieved by
microwaving in a pressure cooker for 15 min in Antigen Retrieval Citra Solution (BioGenex,
HK086-9K). Sections were incubated with Peroxidase Blocking Reagent (Dako, S2001) for 15
min, and Protein Block (Dako, X0909) for 15 min. Anti-pSTAT3 (Cell Signaling Technology,
9131; 1:70 dilution) was applied for 16 h at 4°C, followed by EnVision™+/HRP, Rabbit (Dako,
K4003), diaminobenzidine (Dako, K3468), and hematoxylin counterstain. pSTAT3 expression
was evaluated by two blinded pathologists (Y.I. and Z.R.Q.).
Histopathologic analysis. A total of 11 formalin-fixed, paraffin-embedded WHIM21 xenograft
tumors treated with vehicle control (n = 3), 50mg/kg/d CYT387 (n = 2), 2.5mg/kg/d GSK112012
(n = 2), or CYT387 andGSK112012 in combination (n = 4), respectively. Pathology review of
the H&E staining and the subsequent immunohistochemical stains were conducted manually by a
trained pathologist in the Dana-Farber Cancer Institute Molecular Pathology Core.
Immunohistochemical staining of Ki67, CD31 and ERG were performed on 4-µm sections
of the FFPE WHIM21 xenograft tissue; using the Bond Refine Detection System following the
manufacturer’s protocols on the Leica Bond III automated immunostainer. The sections were
automatically deparaffinized, antigen retrieval was performed with Bond Epitope Retrieval
Solution 1 (HIER1, pH 6.0) and processed for 20 min. The slides were incubated with the
antibody against Ki67 (VP-K451, Rabbit polyclonal, Vector) at a dilution of 1:1500 for 60 min,
CD31 (Rabbit polyclonal, ab28364, Abcam) at a dilution of 1:50 for 20 min and ERG (Rabbit
monoclonal, #2805-1, Epitomics) at a dilution of 1:200 for 60 min, respectively. The sections
were then treated according to the streptavidin–biotin–peroxidase complex method (Bond
Polymer Refine Detection, Leica Microsystems) with diaminobenzidine (DAB) as a chromogen
and counterstained with hematoxylin. Tonsil tissue was used as a positive control for Ki67 and
CD31; Prostate cancer tissue was used as positive controls for ERG. Omission of the primary
antibody was utilized as a negative control.
The Ki67 labeling index scoring and microvessel density (MVD) estimation were visually
performed by histopathology using an Olympus CX41 light microscope. High resolution, high
magnification 40x images were taken with the Image Capture software (Company, version X).
For each individual case, the region of most intense staining (or “hot spot”) was identified with
4x and 10x object lenses. Ki-67 score was assessed in a minimum of 10 consecutive High Power
Fields (HPFs, 400x) in the representative “hot spot” area. The Ki67 labeling index was
calculated as the percentage of positively stained tumor cells relative to total tumor cells. To
evaluate MVD, slides stained with anti-CD31 antibody were examined. Single endothelial cell or
clusters of endothelial cells positive for CD31 were considered as a vessel; Vessels with
muscular walls were not counted. For each case, the number of microvessels was counted in a
minimum of 6 consecutive HPFs (HPF size 0.95 mm2) in the “hot spot” area. MVD was then
estimated as a mean of the number of microvessels per square millimeter (microvessel/mm2).
Supplementary Figures
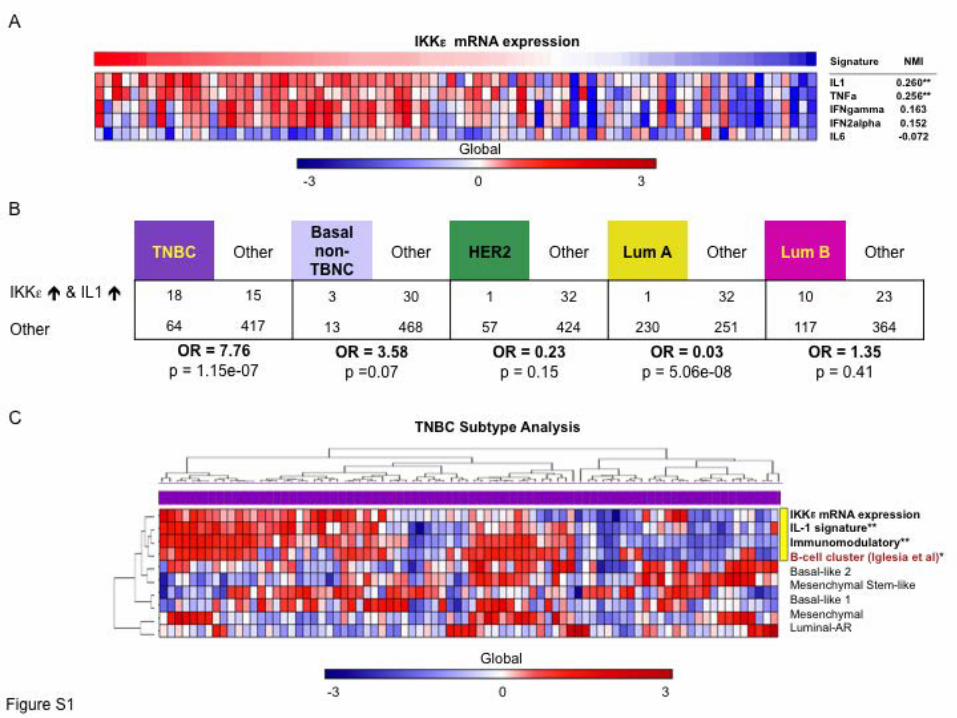
Supplemental Figure 1. IKKε expression correlates with IL-1 associated immune signaling in
TNBC. (A) Relationship between IKKε mRNA levels and expression of several different
cytokine gene signatures across breast cancers in the TCGA dataset. The degree of cytokine
signature expression were measured using single sample GSEA (ssGSEA), NMI = normalized
mutual information statistic. **p<0.001 (B) Correlation between IKKε mRNA and IL-1 signature
expression in TNBC, HER2+ or Luminal breast tumors. Odds ratios were calculated by two

tailed Fisher tests. The high/low status for IKKε was estimated based on z-scores of IKKε
expression across samples. The high/low status for IL-1 was estimated based on z-scores for
ssGSEA enrichment of the IL-1 signature across samples. (C) Unsupervised clustering of IKKε
mRNA and IL-1 signature expression with other previously described TNBC subtypes and with
a previously described lymphocyte infiltration signature. Yellow bar indicates the association
between IKKε mRNA, IL-1 signature, immunomodulatory subtype (NMI = 0.28) and B-cell
cluster (NMI = 0.15), **p<0.001, *p<0.02
Supplemental Figure 2. Correlation of IKKε mRNA levels with TP53 status and response to
cisplatin. (A) Log2 mRNA expression of IKKε sorted by the presence or absence of TP53
mutation, analyzed by t-test across all tumors (p=0.01) or TNBC subset (p=0.58). (B) Log2
mRNA expression of IKKε sorted by Miller-Payne response to neoadjuvant cisplatin in a cohort
of TNBC patients. No significant difference was observed by t-test (p = 0.74).
Supplemental Figure 3. Inhibition of IKKε alone is insufficient to disrupt cytokine expression
TNBC cells. (A) MDA-MB468 cells were infected with a control shRNA or 2 different IKKε
specific shRNAs and stimulated with IL-1β for 4 h. CCL5 or IL-6 levels were measured by
ELISA. Mean and SD of duplicate samples shown. (B) Immunoblot of IKKε and β-actin levels
in MDA-MB468 cells following control or IKKε shRNA expression.
Supplemental Figure 4. CYT387 treatment inhibits migration and anchorage independent
proliferation of TNBC cells. (A) Phase contrast images of MDA-MB-468 spheroids in
microfluidic 3D culture stimulated to proliferate and migrate with EGF (20 ng/ml). Spheroids
were treated with DMSO as a control or CYT387 at the indicated concentrations. Representative
spheroid dispersal at 48 h shown (20x). (B) Phase contrast images (10x) of multiple other TNBC
cell lines cultured in suspension using ultra-low cluster plates and stimulated to proliferate with
IL-1β (25 ng/ml) in the presence of DMSO or 5 µM CYT387.
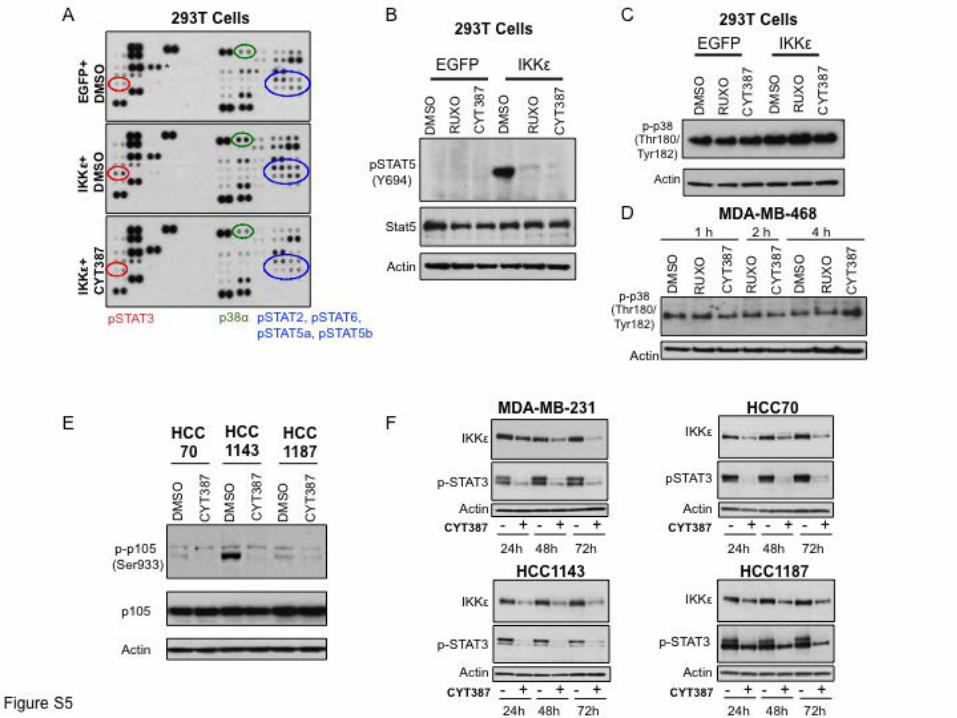
Supplemental Figure 5. CYT387 treatment disrupts IKKε-associated STAT and NF-κB
signaling. (A) Proteomics array measuring the phosphorylation status of 45 different proteins
involved in signal transduction 24 h following control EGFP expression or IKKε with 12 h
DMSO or CYT387 (5 µM) pretreatment. Highlighted are STAT family members as well as p38α,
which were induced by IKKε and suppressed by CYT387 treatment. (B) Levels of Y694
pSTAT5, total STAT5, and β-actin following EGFP or IKKε overexpression in 293T cells and
treatment with DMSO, 5 µM Ruxolitinib or 5 µM CYT387. (C) Levels of T180/Y182 p-p38 and
β-actin following EGFP or IKKε overexpression in 293T cells and treatment with DMSO,
Ruxolitinib or CYT387. (D) Immunoblot of T180/Y182 p-p38 and β-actin levels in MDA-MB-
468 cells treated with DMSO, 5 µM Ruxolitinib or 5 µM CYT387 for the indicated times. (E)
Levels of S933 p-p105, total p105, and β-actin in the indicated TNBC cell lines following
DMSO or 5 µM CYT387 treatment for x 1 h. (F) Immunoblot of IKKε, pSTAT3, and β-actin
levels in the indicated TNBC cell lines following 24 h, 48 h, or 72 h DMSO or 5 µM CYT387
treatment.
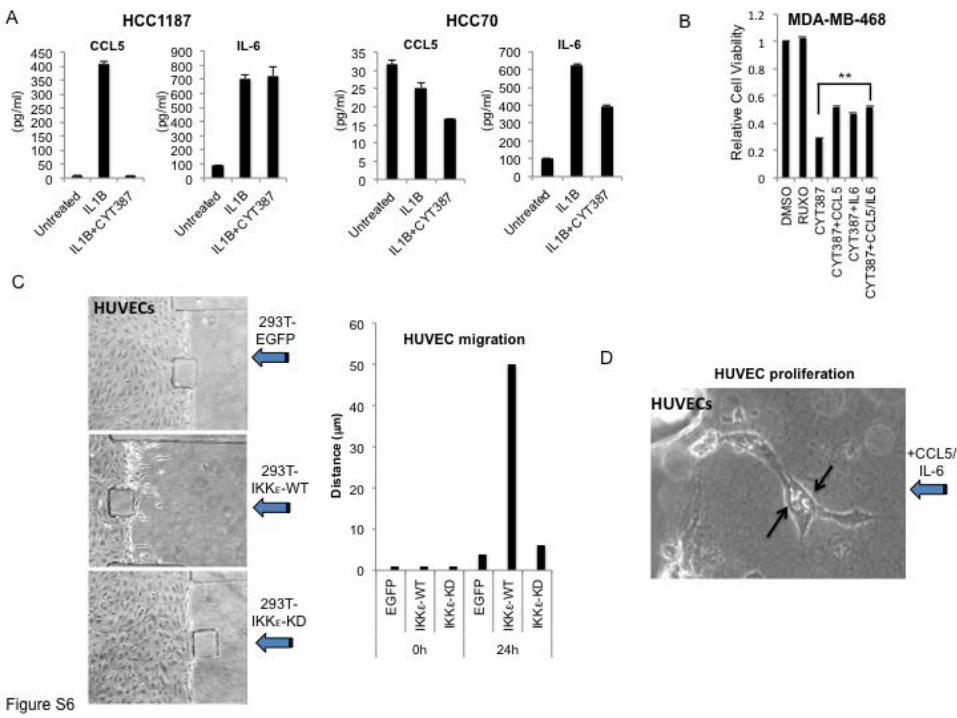
Supplemental Figure 6. Autocrine and paracrine effects of IKKε regulated cytokines. (A)
ELISA measuring CCL5 or IL-6 levels in HCC1187 or HCC70 cells x 24 h following IL-1β (25
ng/ml) with DMSO as a control or 5 µM CYT387 treatment. Values represent mean and SD of
duplicate samples. (B) Relative viability of MDA-MB-468 cells in 2D culture by CTG 72 h
following 5µM Ruxolitinib or CYT387 treatment, or CYT387 + CCL5, IL-6, CCL5/IL-6,
compared with DMSO control. Mean and SEM of triplicate samples shown, ** p<0.001 by t-test

for comparison of CYT alone to cytokine addition. (C) 293T cells transfected with EGFP,
IKKε-WT or IKKε-KD were seeded after 24 hours into the channel as indicated, such that
conditioned media diffused towards HUVECs into the central channel (arrows). Phase contrast
images (20x) and quantification of migration show that IKKε-WT expressing cells specifically
induced HUVEC migration. (D) High resolution 40x image of HUVEC cell proliferation during
CCL5/IL-6 induced migration (arrows indicate nuclear division).
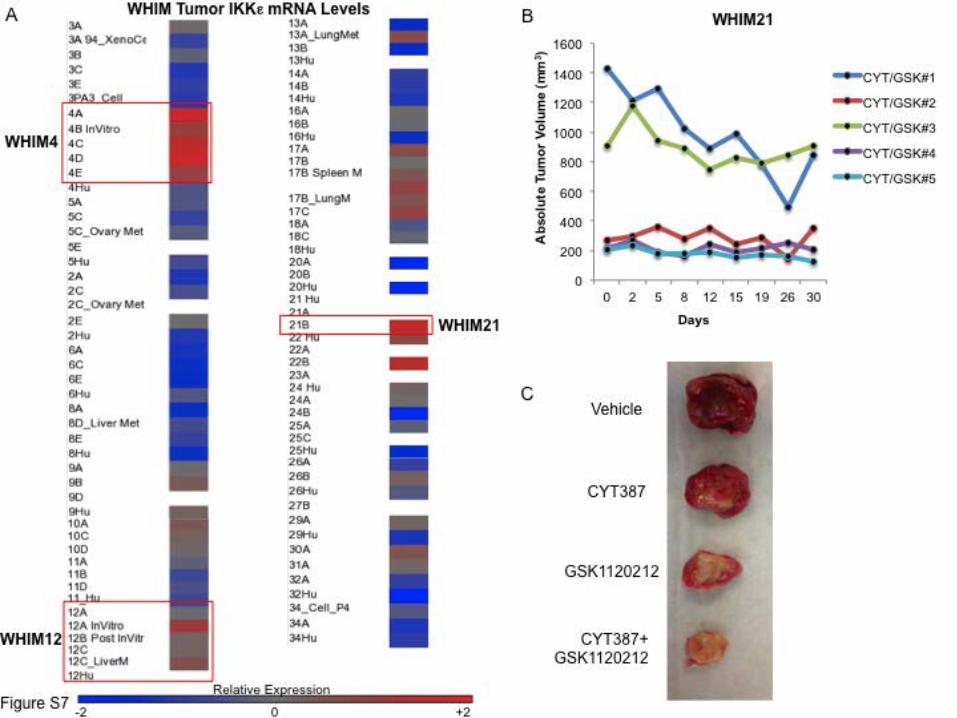
Supplemental Figure 7. IKKε expression across TNBC PDX tumors and WHIM21 response to
therapy. (A) Relative levels of IKKε mRNA in a WHIM tumor panel, scale levels of normalized
expression, white = not tested. Highlighted are WHIM4 and WHIM21 tumors, TNBC WHIM
tumor models that showed high level IKKε expression, as well as WHIM12, a TNBC that did not
over-express IKKε. (B) Change in absolute tumor volume over time from subset of
CYT387/GSK1120212 treated mice with high initial tumor burden demonstrating regression of
established tumors. (C) Representative WHIM21 tumors dissected from vehicle, CYT387,
GSK1120212 or CYT387+GSK112012 treated mice after 30 d.
Supplemental Figure 8. Low dose CYT387/GSK1120212 combination therapy in IKKε high
versus IKKε low TNBC PDX tumors. (A) Spider plot of % change in tumor volume over time in
WHIM21 tumors treated with vehicle control, high dose Ruxolitinib (100 mg/kg/d), or low dose
CYT387 (10 mg/kg/d) combined with GSK1120212 (2.5 mg/kg/d). Over the course of a 30 day
treatment Ruxolitinib treated mice progressed similarly to control treated animals, whereas tumor
progression was halted over this time period after just 2 weeks of treatment with low dose
CYT387/GSK1120212. (B) Spider plot of % change in tumor volume following vehicle (n=15)
or low dose CYT387/GSK1120212 treatment (n=15) of WHIM12 PDX tumors, a TNBC model

with low levels of IKKε expression. Tumors also responded to therapy, although less
dramatically than WHIM21 tumors, with some mice progressing on treatment.
Supplemental Figure 9. Histologic analysis of WHIM21 treated tumors. (A-D) Area of necrosis
(indicated by arrows) in control, CYT387, GSK1120212, and CYT+GSK treated tumors. (E-H)
Ki-67 nuclear stain to assess proliferation in viable tumor cells across each condition. (I-L)
CD31 stain to used to assess microvascular density in regions of viable tumor following each
treatment. (M-P) Orthogonal assessment of tumor vascularity using ERG immunohistochemistry.
Supplementary References
1. Koboldt, D.C., Fulton, R.S., McLellan, M.D., Schmidt, H., Kalicki-Veizer, J., McMichael, J.F., Fulton, L.L., Dooling, D.J., Ding, L., Mardis, E.R., et al. 2012. Comprehensive molecular portraits of human breast tumours. Nature 490:61-70.
2. Parker, J.S., Mullins, M., Cheang, M.C., Leung, S., Voduc, D., Vickery, T., Davies, S., Fauron, C., He, X., Hu, Z., et al. 2009. Supervised risk predictor of breast cancer based on intrinsic subtypes. J Clin Oncol 27:1160-1167.
3. Mermel, C.H., Schumacher, S.E., Hill, B., Meyerson, M.L., Beroukhim, R., and Getz, G. 2011. GISTIC2.0 facilitates sensitive and confident localization of the targets of focal somatic copy-number alteration in human cancers. Genome Biol 12:R41.
4. Lehmann, B.D., Bauer, J.A., Chen, X., Sanders, M.E., Chakravarthy, A.B., Shyr, Y., and Pietenpol, J.A. 2011. Identification of human triple-negative breast cancer subtypes and preclinical models for selection of targeted therapies. J Clin Invest 121:2750-2767.
5. Iglesia, M.D., Vincent, B.G., Parker, J.S., Hoadley, K.A., Carey, L.A., Perou, C.M., and Serody, J.S. 2014. Prognostic B-cell Signatures Using mRNA-Seq in Patients with Subtype-Specific Breast and Ovarian Cancer. Clin Cancer Res 20:3818-3829.
6. Silver, D.P., Richardson, A.L., Eklund, A.C., Wang, Z.C., Szallasi, Z., Li, Q., Juul, N., Leong, C.O., Calogrias, D., Buraimoh, A., et al. 2010. Efficacy of neoadjuvant Cisplatin in triple-negative breast cancer. J Clin Oncol 28:1145-1153.

7. Barbie, D.A., Tamayo, P., Boehm, J.S., Kim, S.Y., Moody, S.E., Dunn, I.F., Schinzel, A.C., Sandy, P., Meylan, E., Scholl, C., et al. 2009. Systematic RNA interference reveals that oncogenic KRAS-driven cancers require TBK1. Nature 462:108-112.
8. Reich, M., Liefeld, T., Gould, J., Lerner, J., Tamayo, P., and Mesirov, J.P. 2006. GenePattern 2.0. Nat Genet 38:500-501.
9. Jura, J., Wegrzyn, P., Korostynski, M., Guzik, K., Oczko-Wojciechowska, M., Jarzab, M., Kowalska, M., Piechota, M., Przewlocki, R., and Koj, A. 2008. Identification of interleukin-1 and interleukin-6-responsive genes in human monocyte-derived macrophages using microarrays. Biochim Biophys Acta 1779:383-389.
10. Smiljanovic, B., Grun, J.R., Biesen, R., Schulte-Wrede, U., Baumgrass, R., Stuhlmuller, B., Maslinski, W., Hiepe, F., Burmester, G.R., Radbruch, A., et al. 2012. The multifaceted balance of TNF-alpha and type I/II interferon responses in SLE and RA: how monocytes manage the impact of cytokines. J Mol Med (Berl) 90:1295-1309.
11. Abazeed, M.E., Adams, D.J., Hurov, K.E., Tamayo, P., Creighton, C.J., Sonkin, D., Giacomelli, A.O., Du, C., Fries, D.F., Wong, K.K., et al. 2013. Integrative radiogenomic profiling of squamous cell lung cancer. Cancer Res 73:6289-6298.
12. Boehm, J.S., Zhao, J.J., Yao, J., Kim, S.Y., Firestein, R., Dunn, I.F., Sjostrom, S.K., Garraway, L.A., Weremowicz, S., Richardson, A.L., et al. 2007. Integrative genomic approaches identify IKBKE as a breast cancer oncogene. Cell 129:1065-1079.
13. Aref, A.R., Huang, R.Y., Yu, W., Chua, K.N., Sun, W., Tu, T.Y., Bai, J., Sim, W.J., Zervantonakis, I.K., Thiery, J.P., et al. 2013. Screening therapeutic EMT blocking agents in a three-dimensional microenvironment. Integr Biol (Camb) 5:381-389.
14. Barbie, T.U., Barbie, D.A., MacLaughlin, D.T., Maheswaran, S., and Donahoe, P.K. 2003. Mullerian Inhibiting Substance inhibits cervical cancer cell growth via a pathway involving p130 and p107. Proc Natl Acad Sci U S A 100:15601-15606.
15. Johannessen, C.M., Boehm, J.S., Kim, S.Y., Thomas, S.R., Wardwell, L., Johnson, L.A., Emery, C.M., Stransky, N., Cogdill, A.P., Barretina, J., et al. 2010. COT drives resistance to RAF inhibition through MAP kinase pathway reactivation. Nature 468:968-972.
16. Li, S., Shen, D., Shao, J., Crowder, R., Liu, W., Prat, A., He, X., Liu, S., Hoog, J., Lu, C., et al. 2013. Endocrine-therapy-resistant ESR1 variants revealed by genomic characterization of breast-cancer-derived xenografts. Cell Rep 4:1116-1130.
17. Ma, C.X., Cai, S., Li, S., Ryan, C.E., Guo, Z., Schaiff, W.T., Lin, L., Hoog, J., Goiffon, R.J., Prat, A., et al. 2012. Targeting Chk1 in p53-deficient triple-negative breast cancer is therapeutically beneficial in human-in-mouse tumor models. J Clin Invest 122:1541-1552.