SUPPLEMENTARY INFORMATION - Nature INFORMATION 6 | RESEARCH Supplementary Figure 5. Cell toxicity of...
21
WWW.NATURE.COM/NATURE | 1 SUPPLEMENTARY INFORMATION doi:10.1038/nature12655 Supplementary Table 1. Oligonucleotides used in this study Name Sequence (5’-3’) Construction of pTX hld Delta Bam CTAGATCACAGAGATGTGATGGATCCTAGTTGATGAGTTG Delta Mlu GTTGGGATGGCTTAATAACGCGTACTTTTAGTACTATACG Construction of S. epidermidis hld mutant HLDATT1 GGGGACAAGTTTGTACAAAAAAGCAGGCTTGGTACTTCTGGTTC GTCAAAGTAAGAGGCACA HLDATT2 GGGGACCACTTTGTACAAGAAAGCTGGGTGGCACTTCTGGTTCG TCAAAGTAAGAAGCACA HLD1 CGAAAGGAGTGAAGTTATAATAGCAGCAGATATC HLD2 GATATCTGCTGCTATTATAACTTCACTCCTTTCG Integration of P3-lux in the S. aureus genome P3prEco CAATTTTACACCACTCTCCTCACTGGAATTCCATTATACG P3prBam ATGCGGATCCCTCATCAACTATTTTCCATCACATCTCTGT luxBamHI ATGCGGATCCTGCAGATGAAGCAAGAGGAG luxSalI ATGCGTCGACGCAGCGGTATTTTTCGATCA luxArvseq AAGGCGCGACTGTTATTCAT
Transcript of SUPPLEMENTARY INFORMATION - Nature INFORMATION 6 | RESEARCH Supplementary Figure 5. Cell toxicity of...

W W W. N A T U R E . C O M / N A T U R E | 1
SUPPLEMENTARY INFORMATIONdoi:10.1038/nature12655
Supplementary Table 1. Oligonucleotides used in this study Name Sequence (5’-3’) Construction of pTX hld Delta Bam CTAGATCACAGAGATGTGATGGATCCTAGTTGATGAGTTG Delta Mlu GTTGGGATGGCTTAATAACGCGTACTTTTAGTACTATACG Construction of S. epidermidis hld mutant
HLDATT1 GGGGACAAGTTTGTACAAAAAAGCAGGCTTGGTACTTCTGGTTCGTCAAAGTAAGAGGCACA
HLDATT2 GGGGACCACTTTGTACAAGAAAGCTGGGTGGCACTTCTGGTTCGTCAAAGTAAGAAGCACA
HLD1 CGAAAGGAGTGAAGTTATAATAGCAGCAGATATC HLD2 GATATCTGCTGCTATTATAACTTCACTCCTTTCG Integration of P3-lux in the S. aureus genome P3prEco CAATTTTACACCACTCTCCTCACTGGAATTCCATTATACG P3prBam ATGCGGATCCCTCATCAACTATTTTCCATCACATCTCTGT luxBamHI ATGCGGATCCTGCAGATGAAGCAAGAGGAG luxSalI ATGCGTCGACGCAGCGGTATTTTTCGATCA luxArvseq AAGGCGCGACTGTTATTCAT Nunez_supplementary Table 1

SUPPLEMENTARY INFORMATION
2 | W W W. N A T U R E . C O M / N A T U R E
RESEARCH
Staphylococcus strain -hex activity (%)
S.aureus (Newman) 75.62 ± 6.12 ***
S.aureus (Newmanlgt) 59.58 ± 3.11 ***
S.aureus (8325-4) 41.36 ± 1.90 ***
S.aureus (8325-4) 34.24 ± 1.90 ***
S.aureus (SA113) 7.27 ± 0.03
S.saprophyticus 16.99 ± 1.46 ***
S.epidermidis 11.90 ± 1.72 *
S.xylosus 8.38 ± 0.53
S.sciuri 4.15 ± 0.56
S.cohnii 5.07 ± 0.15
S.succinus 6.04 ± 1.38
S.lentus 5.76 ± 0.38
S.fleuretti 5.73 ± 0.28
unstimulated MCs 6.24 ± 0.18
Nunez_supplementary Figure 1
FSMCs MC/9a b
c
Supplementary Figure 1. Culture supernatant from S. aureus induces MCdegranulation. (a) -hexosaminidase activity from supernatants of fetal skin-derived MC (FSMC) cultures stimulated with medium alone (Control), DNP-IgEalone, DNP-IgE plus DNP, ionomycin, ATP and indicated concentrations ofculture supernatant from S. aureus (8325-4). (b) -hexosaminidase activity fromsupernatants of MC/9 cell cultures stimulated with indicated stimuli. (c) -hexosaminidase activity from supernatants of MC/9 cells stimulated with 10 %culture supernatant of indicated Staphylococcus species. Data represent means ±s.d. of triplicate cultures. *P < 0.05; ***P < 0.001, two-tailed Student’s t-test. (d)MC/9 cells were incubated 60 min in medium (Control), 10% S. aureus culturesupernatant (8325-4) or medium containing Nigericin (10 M, used as a positivecontrol). Percentage of propidium iodide (PI) positive cells were measured by flowcytometry. Data are representative of at least two independent experiments
D
NP
-IgE
+DN
P
com
poun
d 48
/80
35
0
0.08 0.4 2 5 10
D
NP
-IgE
Iono
myc
in
ATP
S.a. sup (%)
5
10
15
20
25
30
-h
exos
amin
idas
e(%
)
Con
trol 0
10
20
30
40
-h
exos
amin
idas
e(%
)
0.08 0.
4 2 10
S.a. sup (%)
Iono
myc
inC
ontro
l
d
0
10
20
30
40
50
PI p
ositi
ve c
ells
(%)
***
***
***
***
***
***
***
**
***
***
***
***
W W W. N A T U R E . C O M / N A T U R E | 3
SUPPLEMENTARY INFORMATION RESEARCH
MC-degranulation activity (%)
BHI sup +bacterial pellet 100
BHI sup 120
Washed bacterial pellet 7.2
sonicated bacterial pellet 0
RPMI sup 17
TSB sup 55
chemical medium sup 13
chemical medium + 2%Yeast Extract sup 48
boiling (100C 30min) 70
(100C over night) 0
acid (pH3) 63
alkaline (pH12) 25
phenol/chloroform 0
protenase K 0
Chromatography
DEAE-cellulose binding Yes
CM-cellulose binding Yes
gel filtration (pH 7.4) void fraction
isoelectric pH (pI) pH 8.8
Protein Name AAtotal independent spectra
cover length(%)
1 -toxin 26 121 100
2cysteine protease precursor, putative
393 15 19.6
3hypothetical protein SAOUHSC00617
168 12 18.5
4 lipase precursor 690 11 7.4
5hypothetical protein SAOUHSC00094
199 3 25.1
a b
c
Supplementary Figure 2. Characterization, purification and mass spectrometryidentification of -toxin.(a) -hexosaminidase activity compared with that of BHI culture supernatant (sup) andbacteria pellet (100%). (b) Purification scheme for identification of -toxin. (c) Proteinsidentified in the purified sample. The summarized “total independent spectra” isindicative of the relative abundance of a specific protein in the purified sample. Fulllength of mature form -toxin sequence were detected(MAQDIISTIGDLVKWIIDTVNKFTKK). (BHI; brain heart infusion, TSB; tryptic soybroth, DEAE; Diethylaminoethyl, CM; Carboxymethyl.
800 ml culture supernatant(2% Yeast Extract chemical medium)
CM-cellulose purification
superdex 200
Amicon Ultra Centrifugal filter
LC-tandem MS
Amicon Ultra Centrifugal filter
Nunez_supplementary Figure 2

SUPPLEMENTARY INFORMATION
4 | W W W. N A T U R E . C O M / N A T U R E
RESEARCH
-toxin (N-form.)-toxin (N-deform.)
a
Supplementary Figure 3. Amount of -toxin in S. aureus supernatant. (a) MCdegranulation activity of supernatants of MC/9 cells stimulated with 2% of culturesupernatant of S. aureus strains. Data represent means± s.d. of triplicate cultures. NS; nosignificant, *P < 0.05; ***P < 0.001, two-tailed Student’s t-test. (b) -toxin expressionsof filtrated supernatants from S.aureus strains (SA113, LAC and 8325-4) detected by RP-HPLC/ESI-MS. ND; not detected. Bars represent the means. (c) -toxin expressions ofsupernatants from S. aureus wild-type (LAC (pTxΔ16)), -toxin deletion (LAC Δhld(pTxΔ16)) and complemented strain (LAC Δhld (pTxΔhld)) detected by extracted ionchromatograms. Chromatography was performed as described previously15. Data arerepresentative of three independent experiments.
b
0
5
10
15
20
25
Iono
myc
in
LAC
wt
LAC
hld
MW
2 wt
MW
2 hld
8325
-4 wt
8325
-4
-h
exos
amin
idas
e(%
)
NS****
Con
trol
c
Abs
orpt
ion
(280
nm
)
Nunez_supplementary Figure 3

W W W. N A T U R E . C O M / N A T U R E | 5
SUPPLEMENTARY INFORMATION RESEARCH
Supplementary Figure 4. MC degranulation activity of -toxin is independent of formylation.(a) % LDH released from MC/9 cells stimulated by medium alone (Ctrl) and indicated concentrations(g ml-1) of PSMs for 15 or 60 min. (b) -hexosaminidase assay from supernatants of MC/9 cellsstimulated with indicated concentrations (g ml-1) of formylated PSMs. (c) -hexosaminidase assayfrom supernatants of MC/9 cells stimulated with indicated concentrations (g ml-1) of unformylated-toxin (-toxin) or formylated -toxin (f-toxin) (left panel). -hexosaminidase assay fromsupernatants of MC/9 cells stimulated with indicated concentrations (g ml-1) of unformylated -toxin (-toxin) or control peptide (right panel). (d) IL-8 secretion in cultured supernatant of humanneutrophils stimulated by indicated concentrations (g ml-1) of phenol-soluble modulins (PSMs).Data represent means ± s.d. of triplicate cultures. Data are representative of three independentexperiments.
-h
exos
amin
idas
e(%
)
0
5
10
15
20
f-toxin -toxin 0.1 0.3 1 3 1
030
0.1 0.3 1 3 10
30
Ctrl
0
200
400
600
800
1,000
1,200
IL-8
(pg/
ml)
fPSMα2 fPSMα3 f-toxin -toxin
Ctrl
purif
ied
-to
xin
(0.1
%)
101 101 101 101
d
0
5
10
15
20
25
-h
exos
amin
idas
e(%
)
0.1 1 100.3 0.1 1 100.3CtrlfPSMα2 fPSMα3
0
20
40
60
80
100C
ytot
oxic
ity(%
LD
H re
leas
e)
ContfPSMα2fPSMα3fδ-toxinδ-toxin
0.1 1 10 100 0.1 1 10 Ctrl
15 min 60 minc
a 100
80
60
40
20
0
5
10
15
20
25
30
35
-h
exos
amin
idas
e(%
)Ctrl
-toxin 10
30
10
30Ctrl
peptide
b
Nunez_supplementary Figure 4

SUPPLEMENTARY INFORMATION
6 | W W W. N A T U R E . C O M / N A T U R E
RESEARCH
Supplementary Figure 5. Cell toxicity of -toxin. BMCMCs,BMM bone marrow derived macrophages), bone marrowneutrophils and primary keratinocytes isolated from mice werestimulated with PSM (10 g ml-1) or -toxin (10 or 100 g ml-1) forindicated times. Cell toxicity was measured by LDH assay. Datarepresent means± s.d. of triplicate cultures. NS; no significant, ***P< 0.001, one-way ANOVA with Tukey's post-hoc test for multiplecomparisons. Data are representative of two independent experiments.
Nunez_supplementary Figure 5

W W W. N A T U R E . C O M / N A T U R E | 7
SUPPLEMENTARY INFORMATION RESEARCH
0
2
4
6
8
10
12-hexosaminidase(%)
S.aureus LAC S.epidermidis 1457Ctrl
wtΔhld
a
b
wtΔhld wtΔhld
S.epidermidis1457
S.aureustoxin (ng)
100 50 10 1
-toxin
Supplementary Figure 6. MC degranulation activity of -toxin in supernatant from S.aureus and S. epidermidis. (a) Immunoblot analysis of culture supernatants of S. aureuswild-type (LAC), -toxin deletion (LAC Δhld), S. epidermidis wild-type (1457) and -toxin deletion (1457 Δhld)(0.25 l per well). Representativee of two experiments. (b) -hexosaminidase from MC/9 cells stimulated by medium alone (Control), culturesupernatants of from S. aureus wild-type (LAC), -toxin deletion (LAC Δhld),S.epidermidis wild-type (1457) and -toxin deletion (1457 Δhld). Data represent means±s.d of triplicate cultures. *P < 0.05, **P < 0.01, ***P < 0.001, two-tailed Student’s t-test.Data are representative of three independent experiments.
***
**
**
***
***
*****
***
wtΔhldLACMW2
Nunez_supplementary Figure 6

SUPPLEMENTARY INFORMATION
8 | W W W. N A T U R E . C O M / N A T U R E
RESEARCH
Medium
LAC wt
LAC Δhld
SA113
a b
*** ****
Supplementary Figure 7. δ-toxin in S. aureus culture supernatant induces MCdegranulation in vivo. (a) C57BL6 mice were injected intradermally into the left andright ears with 40% S. aureus culture supernatant from LAC wt, LAC Δhld and SA113or 40% TSB (as control), respectively. Culture supernatants were diluted by PBS.Three representative mice for each group are shown. Representative of at least 9 miceper group. (b) Quantification of Evans blue extracted from skin tissue of C57BL6 miceis shown. Dots represent individual ear samples pooled from three independentexperiments. **P < 0.01, ***P < 0.001, Kruskal-Wallis test. Bars represent the means.
1 2 3
Nunez_supplementary Figure 7
W W W. N A T U R E . C O M / N A T U R E | 9
SUPPLEMENTARY INFORMATION RESEARCH
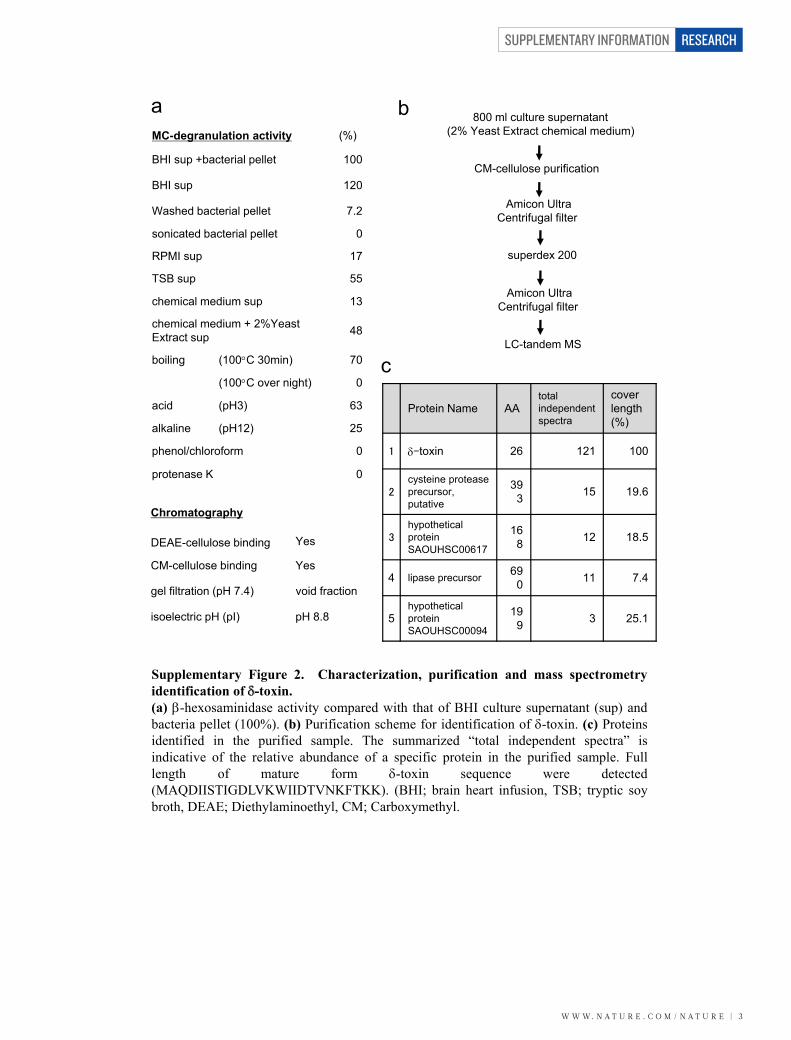
Nunez_supplementary Figure 8
Supplementary Figure 8. Mouse Fpr gene expression. Expressionof mouse Fpr genes in BMCMCs, MC/9 and bone marrow neutrophils.Expression is normalized to that of Gapdh. Data represent means ±s.d. of triplicate cultures. Data are representative of two independentexperiments.

SUPPLEMENTARY INFORMATION
1 0 | W W W. N A T U R E . C O M / N A T U R E
RESEARCH
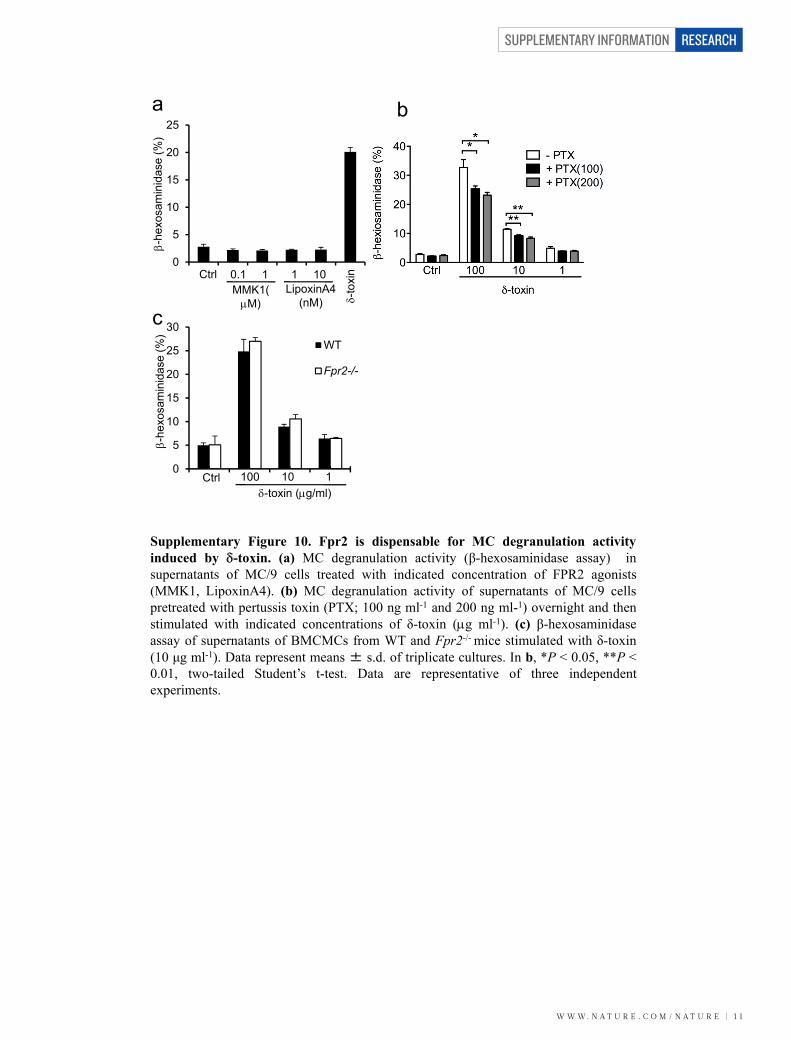
Supplementary Figure 9. MC degranulation activity induced by -toxin is inhibited by FPR antagonists. (a) MC degranulation activity (β-hexosaminidase assay) of supernatants of MC/9 cells pretreated withWRW4 peptide and then stimulated with δ-toxin (10 μg ml-1). (b)Quantification of Evans blue extracted from skin tissue of C57BL6 mice isshown. Mice were pretreated with or without WRW4 peptides (100 M).1h later, mice were injected intradermally into the ears with 40% culturesupernatant from S. aureus. Dots represent individual ear samples. (c) β-hexosaminidase assay of supernatants of MC/9 cells pretreated with FPR1antagonist (Cyclosporin H) and then stimulated with δ-toxin (10 μg ml-1)Data represent means± s.d. of triplicate cultures. In a,c, **P < 0.01, ***P< 0.001, two-tailed Student’s t-test. In b, NS; no significant, **P < 0.01,Kruskal-Wallis test. Bars represent the means. Data are representative ofthree independent experiments.
a
c
5
7
9
11
13
15
17
19
-h
exos
amin
idas
e(%
)
Ctrl -toxin+
CsH(10 M)
***
*NS
b
5
10
15
20
25
30
35
-h
exos
amin
idas
e(%
)
-toxin
**
Nunez_supplementary Figure 9
W W W. N A T U R E . C O M / N A T U R E | 1 1
SUPPLEMENTARY INFORMATION RESEARCH
0
5
10
15
20
25
CtrlMMK1(M)
0.1 1 1 10LipoxinA4
(nM) -to
xin
-h
exos
amin
idas
e(%
)
0
5
10
15
20
25
30WT
Fpr2-/-
100 10 1Ctrl-toxin (g/ml)
-h
exos
amin
idas
e(%
)
a b
c
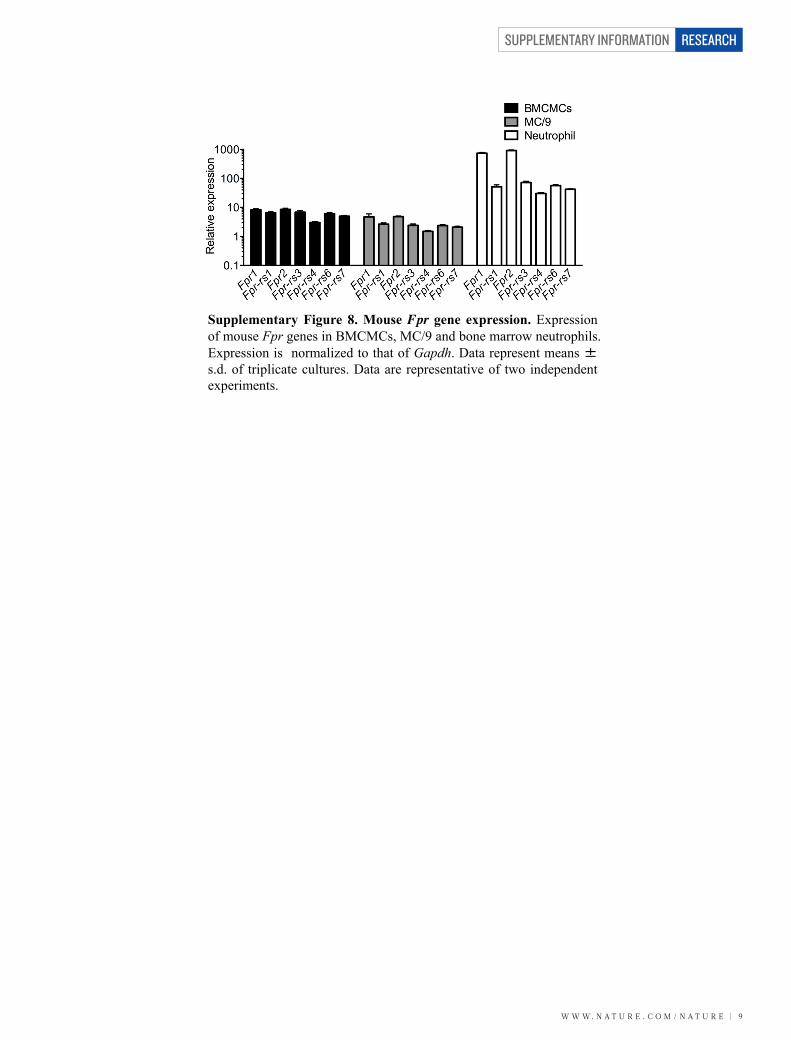
Supplementary Figure 10. Fpr2 is dispensable for MC degranulation activityinduced by -toxin. (a) MC degranulation activity (β-hexosaminidase assay) insupernatants of MC/9 cells treated with indicated concentration of FPR2 agonists(MMK1, LipoxinA4). (b) MC degranulation activity of supernatants of MC/9 cellspretreated with pertussis toxin (PTX; 100 ng ml-1 and 200 ng ml-1) overnight and thenstimulated with indicated concentrations of δ-toxin (g ml-1). (c) β-hexosaminidaseassay of supernatants of BMCMCs from WT and Fpr2-/- mice stimulated with δ-toxin(10 μg ml-1). Data represent means± s.d. of triplicate cultures. In b, *P < 0.05, **P <0.01, two-tailed Student’s t-test. Data are representative of three independentexperiments.
Nunez_supplementary Figure 10
SUPPLEMENTARY INFORMATION
1 2 | W W W. N A T U R E . C O M / N A T U R E
RESEARCH
1 2 3 4 5 6 7 8 9 10 11 12 13
14 15 16 17 18 19 20 21 22 23 24 25 26
10 11 12 SA
113
LAC
100 50 10 5 1 0.5synthetic toxin (ng)
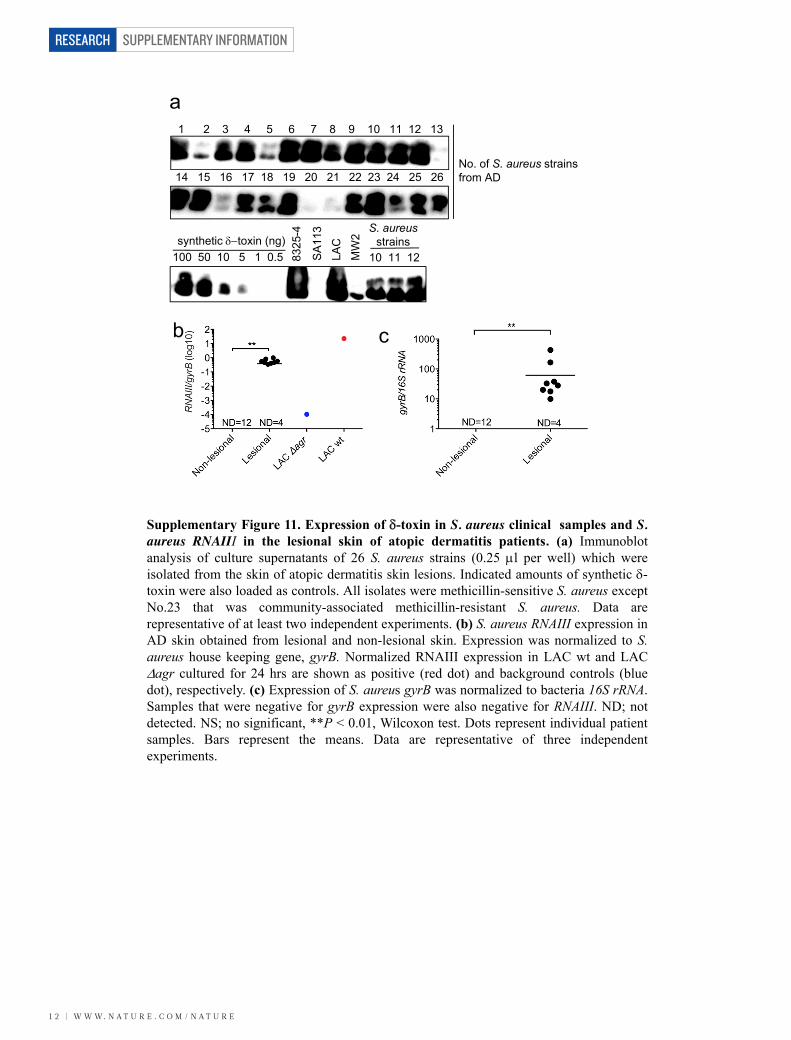
Supplementary Figure 11. Expression of -toxin in S. aureus clinical samples and S.aureus RNAIII in the lesional skin of atopic dermatitis patients. (a) Immunoblotanalysis of culture supernatants of 26 S. aureus strains (0.25 l per well) which wereisolated from the skin of atopic dermatitis skin lesions. Indicated amounts of synthetic -toxin were also loaded as controls. All isolates were methicillin-sensitive S. aureus exceptNo.23 that was community-associated methicillin-resistant S. aureus. Data arerepresentative of at least two independent experiments. (b) S. aureus RNAIII expression inAD skin obtained from lesional and non-lesional skin. Expression was normalized to S.aureus house keeping gene, gyrB. Normalized RNAIII expression in LAC wt and LACagr cultured for 24 hrs are shown as positive (red dot) and background controls (bluedot), respectively. (c) Expression of S. aureus gyrB was normalized to bacteria 16S rRNA.Samples that were negative for gyrB expression were also negative for RNAIII. ND; notdetected. NS; no significant, **P < 0.01, Wilcoxon test. Dots represent individual patientsamples. Bars represent the means. Data are representative of three independentexperiments.
MW
2
8325
-4
No. of S. aureus strains from AD
S. aureusstrains
Nunez_supplementary Figure 11
a
b c
W W W. N A T U R E . C O M / N A T U R E | 1 3
SUPPLEMENTARY INFORMATION RESEARCH
1.E+04
1.E+05
1.E+06
1.E+07
1.E+08
1.E+09
5.E+04
5.E+05
5.E+06
5.E+07
day1 day4 day7
CFU
/cm
2
Rad
ianc
e (p
/sec
/cm
2/sr
)
Bacteria number LuminescenceR
adia
nce
(x10
5p/
sec/
cm2 /s
r)b c
1.5
1.0
0.5
LACLAC
P3_lux
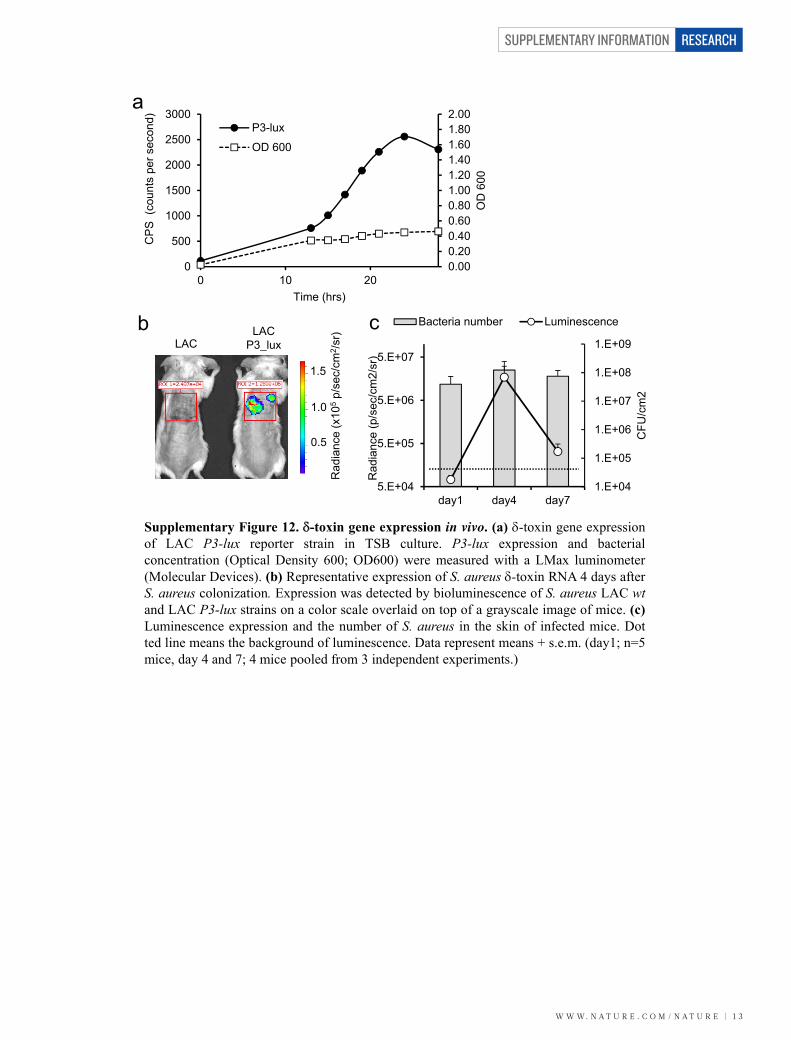
Supplementary Figure 12. -toxin gene expression in vivo. (a) -toxin gene expressionof LAC P3-lux reporter strain in TSB culture. P3-lux expression and bacterialconcentration (Optical Density 600; OD600) were measured with a LMax luminometer(Molecular Devices). (b) Representative expression of S. aureus -toxin RNA 4 days afterS. aureus colonization. Expression was detected by bioluminescence of S. aureus LAC wtand LAC P3-lux strains on a color scale overlaid on top of a grayscale image of mice. (c)Luminescence expression and the number of S. aureus in the skin of infected mice. Dotted line means the background of luminescence. Data represent means + s.e.m. (day1; n=5mice, day 4 and 7; 4 mice pooled from 3 independent experiments.)
0.000.200.400.600.801.001.201.401.601.802.00
0
500
1000
1500
2000
2500
3000
0 10 20
OD
600
CP
S (
coun
ts p
er s
econ
d)
Time (hrs)
P3-lux
OD 600
a
Nunez_supplementary Figure 12
SUPPLEMENTARY INFORMATION
1 4 | W W W. N A T U R E . C O M / N A T U R E
RESEARCH
a PBS LAC pTXΔ16 LACΔhld pTXΔ16 LACΔhld pTXΔhld
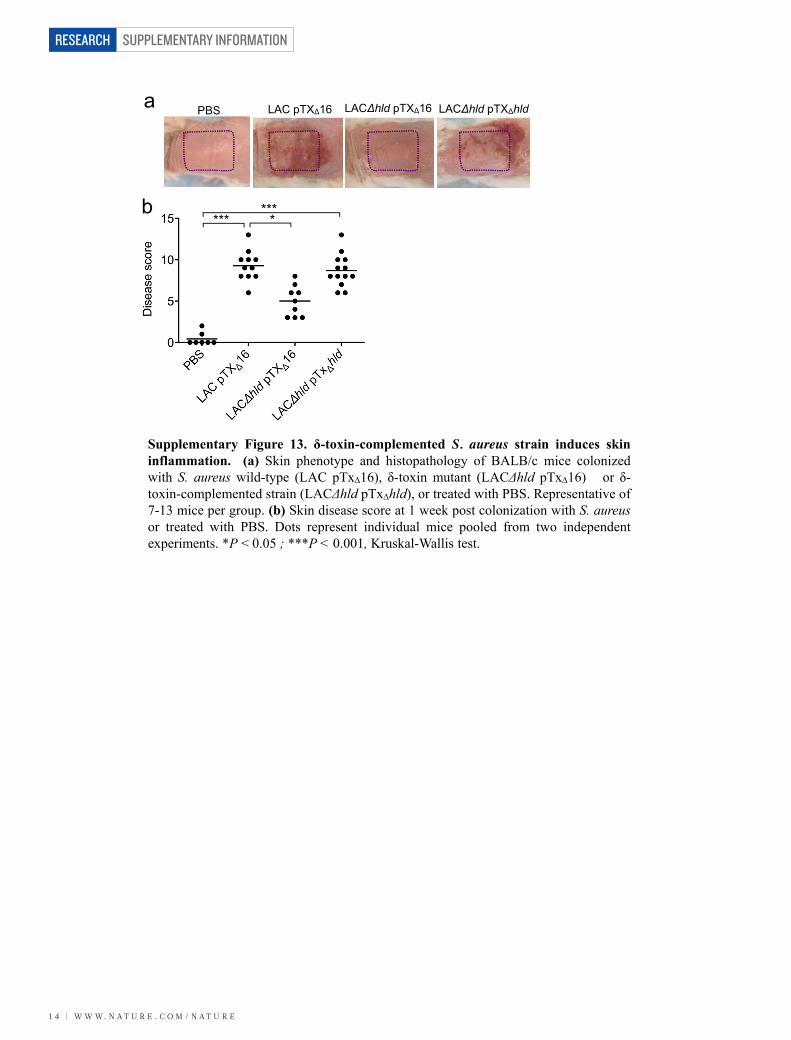
Supplementary Figure 13. δ-toxin-complemented S. aureus strain induces skininflammation. (a) Skin phenotype and histopathology of BALB/c mice colonizedwith S. aureus wild-type (LAC pTx16), δ-toxin mutant (LACΔhld pTx16) or δ-toxin-complemented strain (LACΔhld pTxhld), or treated with PBS. Representative of7-13 mice per group. (b) Skin disease score at 1 week post colonization with S. aureusor treated with PBS. Dots represent individual mice pooled from two independentexperiments. *P < 0.05 ; ***P < 0.001, Kruskal-Wallis test.
******
*b
Nunez_supplementary Figure 13

W W W. N A T U R E . C O M / N A T U R E | 1 5
SUPPLEMENTARY INFORMATION RESEARCH
Supplementary Figure 14. The number of bacteria and IL-4 levels in skin colonized withS. aureus. (a and b) Number of culturable bacteria and S. aureus in the skin of BALB/c mice1 week post inoculation with S. aureus. Results are mean±s.e.m. (n=5). (a) Swabbed sampleswere plated on TSB and Baird-Parker agar plates, and then colonies were counted 48 h later(b). Swabbed (surface) and skin homogenized (nonsurface) samples were plated on Baird-Parker agar plates, and then colonies were counted 48 h later. (c) IL-4 levels in skin of Balb/cmice inoculated with or without S. aureus (S.a. wt or S.a. Δhld) for 1 week. Dots representindividual mice. In a, b, NS; no significant, two-tailed Student’s t-test. ND; not detected. In c,NS; no significant; *P < 0.05, **P < 0.01, Kruskal-Wallis test. Data are representative of atleast two independent experiments.
c
a b NS NS
Nunez_supplementary Figure 14
NS NS
SUPPLEMENTARY INFORMATION
1 6 | W W W. N A T U R E . C O M / N A T U R E
RESEARCH
PBS S.a.wt
S.a.Δhld
PBS S.a.wt
S.a.Δhld
3 wk1 wk
PBS S.a.wt
S.a.Δhld
PBS S.a.wt
S.a.Δhld
3 wk1 wk
*****a
b
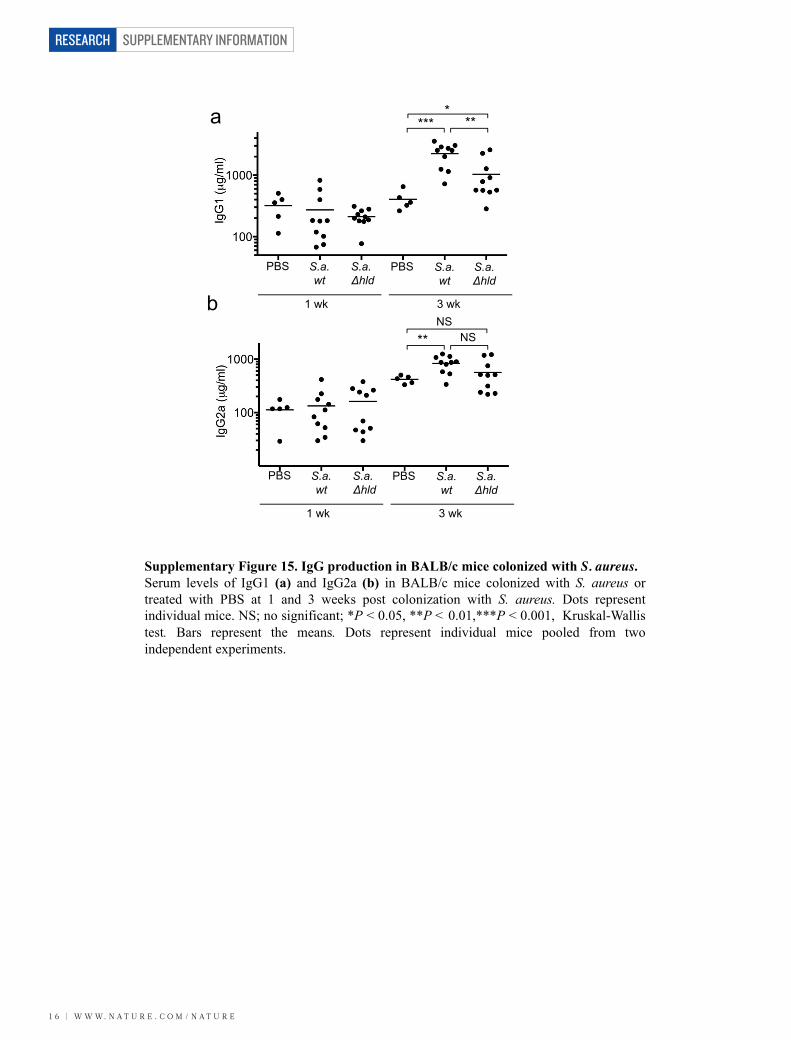
Supplementary Figure 15. IgG production in BALB/c mice colonized with S. aureus.Serum levels of IgG1 (a) and IgG2a (b) in BALB/c mice colonized with S. aureus ortreated with PBS at 1 and 3 weeks post colonization with S. aureus. Dots representindividual mice. NS; no significant; *P < 0.05, **P < 0.01,***P < 0.001, Kruskal-Wallistest. Bars represent the means. Dots represent individual mice pooled from twoindependent experiments.
** NS
Nunez_supplementary Figure 15
*
NS
W W W. N A T U R E . C O M / N A T U R E | 1 7
SUPPLEMENTARY INFORMATION RESEARCH
a b c
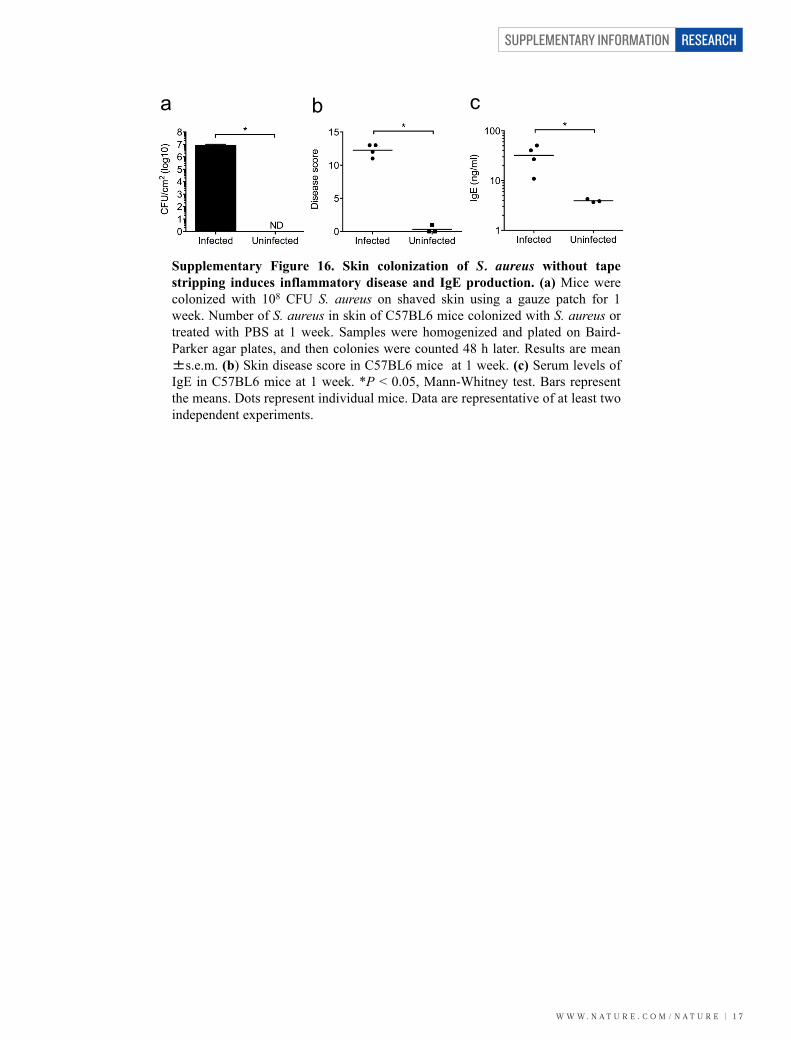
Supplementary Figure 16. Skin colonization of S. aureus without tapestripping induces inflammatory disease and IgE production. (a) Mice werecolonized with 108 CFU S. aureus on shaved skin using a gauze patch for 1week. Number of S. aureus in skin of C57BL6 mice colonized with S. aureus ortreated with PBS at 1 week. Samples were homogenized and plated on Baird-Parker agar plates, and then colonies were counted 48 h later. Results are mean±s.e.m. (b) Skin disease score in C57BL6 mice at 1 week. (c) Serum levels ofIgE in C57BL6 mice at 1 week. *P < 0.05, Mann-Whitney test. Bars representthe means. Dots represent individual mice. Data are representative of at least twoindependent experiments.
Nunez_supplementary Figure 16

SUPPLEMENTARY INFORMATION
1 8 | W W W. N A T U R E . C O M / N A T U R E
RESEARCH
PBS S.a.wt
S.a.Δhld
PBS S.a.wt
S.a.Δhld
a b
Supplementary Figure 17. S. aureus colonization after OVA administration does notinduce OVA-IgE. (a) BALB/c mice were exposed epicutaneously with 108 CFU S.aureus (LAC wt and LAC hld) and 100 g OVA at the same time using a gauze patchfor 1 week. Sera were collected at 1 week. (b) 100 g OVA was given epicutaneouslyusing a gauze patch for 1 week. After 1 week interval, BALB/c mice were exposed 108CFU S. aureus (LAC wt and LAC hld) for 1 week. Sera were collected at 3 weeks.Serum IgE levels were measured by ELISA. NS; no significant, Kruskal-Wallis test.Bars represent the means. Data are representative of two independent experiments.
NS NS NS NS
1 week 3 week
Nunez_supplementary Figure 17

W W W. N A T U R E . C O M / N A T U R E | 1 9
SUPPLEMENTARY INFORMATION RESEARCH
0 1 wk 3 wk 4 wk
blood blood skin
OVA+-toxin
a
OVA+-toxin
b PBS OVA OVA+-toxin
c d e
f
Supplementary Figure 18. Synthetic -toxin enhances allergic skin disease. (a) OVA sensitizationprotocol with or without -toxin. BALB/c mice were sensitized epicutaneously with OVA (100 g)with or without synthetic -toxin (100 g) for 1 week. After 2 week interval, mice were challengedwith OVA (100 g) with or without synthetic -toxin (100 g) at the same skin site. (b) Skinphenotype (top panels) and histopathology (bottom panels) of mice. Notice white scaly areas as wellas thickened epidermis and dermal inflammatory infiltrate in the skin of mice challenged with OVAplus -toxin. Skin sections were stained with H&E (HE). Representative of at least 6 mice per group.Bar = 200 m. (c) Skin disease score at 1 and 4 week. Kruskal-Wallis test. (d-f) Serum levels of OVAspecific IgE (d), IgG1(e) and IgG2a (f) in BALB/c sensitized with OVA with or without -toxin at 1and 3 weeks. Dots represent individual mice. NS; no significant, *P < 0.05, **P < 0.01, ***P <0.001, Kruskal-Wallis test. Bars represent the means. Data are representative of two independentexperiments. Nunez_supplementary Figure 18
HE
SUPPLEMENTARY INFORMATION
2 0 | W W W. N A T U R E . C O M / N A T U R E
RESEARCH
+BMCMCs
b
a
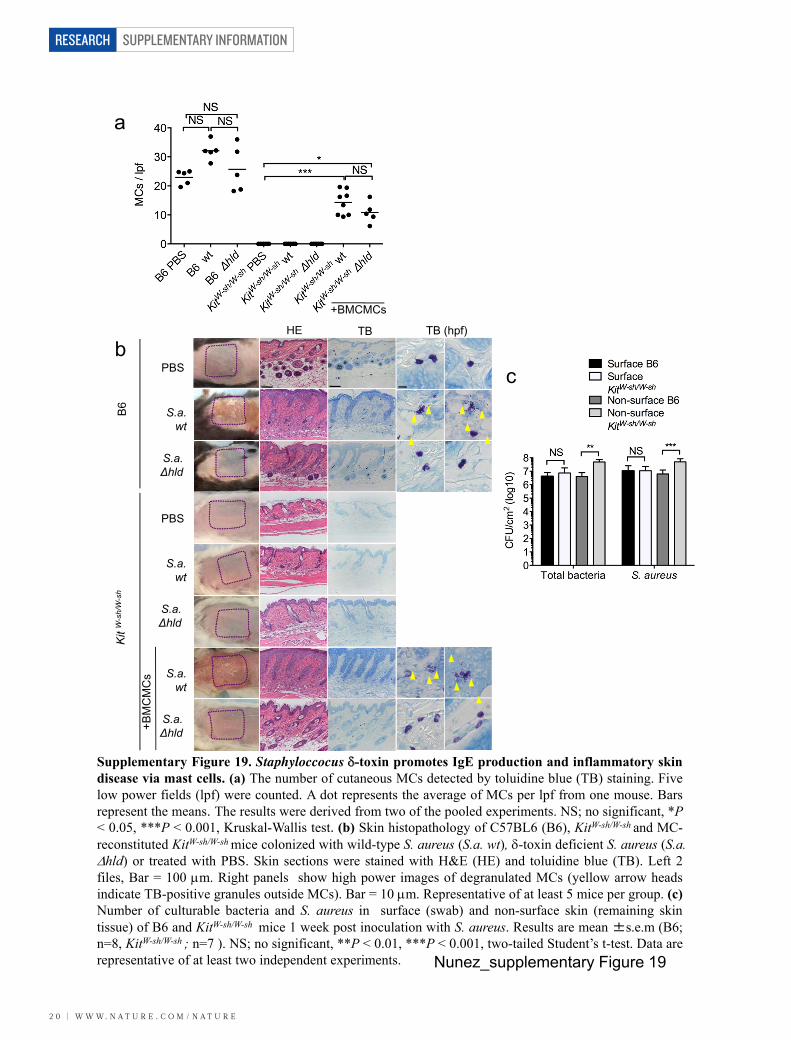
Supplementary Figure 19. Staphyloccocus -toxin promotes IgE production and inflammatory skindisease via mast cells. (a) The number of cutaneous MCs detected by toluidine blue (TB) staining. Fivelow power fields (lpf) were counted. A dot represents the average of MCs per lpf from one mouse. Barsrepresent the means. The results were derived from two of the pooled experiments. NS; no significant, *P< 0.05, ***P < 0.001, Kruskal-Wallis test. (b) Skin histopathology of C57BL6 (B6), KitW-sh/W-sh and MC-reconstituted KitW-sh/W-shmice colonized with wild-type S. aureus (S.a. wt), -toxin deficient S. aureus (S.a.hld) or treated with PBS. Skin sections were stained with H&E (HE) and toluidine blue (TB). Left 2files, Bar = 100 m. Right panels show high power images of degranulated MCs (yellow arrow headsindicate TB-positive granules outside MCs). Bar = 10 m. Representative of at least 5 mice per group. (c)Number of culturable bacteria and S. aureus in surface (swab) and non-surface skin (remaining skintissue) of B6 and KitW-sh/W-sh mice 1 week post inoculation with S. aureus. Results are mean±s.e.m (B6;n=8, KitW-sh/W-sh ; n=7 ). NS; no significant, **P < 0.01, ***P < 0.001, two-tailed Student’s t-test. Data arerepresentative of at least two independent experiments. Nunez_supplementary Figure 19
HE TB
PBS
S.a.wt
S.a.Δhld
PBS
S.a.wt
S.a.Δhld
S.a.wt
S.a.Δhld
B6
Kit
W-s
h/W
-sh
+BM
CM
Cs
TB (hpf)
c

W W W. N A T U R E . C O M / N A T U R E | 2 1
SUPPLEMENTARY INFORMATION RESEARCH
Nunez_supplementary Figure 20
b
Supplementary Figure 20. The number of cutaneous MCs in the earpina detected by toluidine blue staining. (a) Ear histopathology ofC57BL6 (B6), KitW-sh/W-sh and MC-reconstituted KitW-sh/W-sh mice. Skinsections were stained with toluidine blue. Red arrow heads indicatetoluidine-positive MCs. Bar = 200 mm. Representative of at least 8mice per group. (b) The number of cutaneous MCs detected bytoluidine blue staining. Two low power fields (lpf) were counted permouse. Each dot represents the average of MCs per lpf from one mouse.Bars represent the means. The results were derived from two of thepooled experiments. **P < 0.01, Kruskal-Wallis test. Data arerepresentative of three independent experiments.
aB6
Kit W-sh/W-sh
Kit W-sh/W-sh
+BMCMCs