
Supplementary information for Variable-temperature NMR ...
15
Supplementary information for Variable-temperature NMR spectroscopy for metabolite identification in biological materials Ewa K. Nawrocka a,b , Mateusz Urbańczyk a,c , Kamil Koziński a , and Krzysztof Kazimierczuk a a) Centre of New Technologies, University of Warsaw, ul. Banacha 2C, 02-097 Warsaw, Poland b) Faculty of Chemistry, University of Warsaw, Pasteura 1, 02-093 Warsaw, Poland c) Institute of Physical Chemistry, Polish Academy of Sciences, Kasprzaka 44/52, 01- 224 Warsaw, Poland Electronic Supplementary Material (ESI) for RSC Advances. This journal is © The Royal Society of Chemistry 2021
Transcript of Supplementary information for Variable-temperature NMR ...

Supplementary information
for
Variable-temperature NMRspectroscopy for metabolite
identification in biological materialsEwa K. Nawrockaa,b, Mateusz Urbańczyka,c, Kamil Kozińskia, and Krzysztof Kazimierczuka
a) Centre of New Technologies, University of Warsaw, ul. Banacha 2C, 02-097 Warsaw, Poland
b) Faculty of Chemistry, University of Warsaw, Pasteura 1, 02-093 Warsaw, Polandc) Institute of Physical Chemistry, Polish Academy of Sciences, Kasprzaka 44/52, 01-
224 Warsaw, Poland
Electronic Supplementary Material (ESI) for RSC Advances.This journal is © The Royal Society of Chemistry 2021

Chemical shift dependence, ppb, on temperature, °C, formetabolites from the first artificial mixture. Temperaturecoefficients (TCs) as a slope of the linear function. For
all diagrams, the coefficient of determination R2 isshown.

25 30 35 40Temperature, °C
3060
3080
3100
3120
3140
3160
3180
3200
3220
3240
Chemicalshift,ppb
Creatinine
R2 = 0.99982TC = 10.7734
25 30 35 40Temperature, °C
3040
3060
3080
3100
3120
3140
3160
3180
3200
3220
3240
Chemicalshift,ppb
Creatine
R2 = 0.99994TC = 11.1454
25 30 35 40Temperature, °C
3520
3540
3560
3580
3600
3620
3640
3660
3680
3700
Chemicalshift,ppb
Glycine
R2 = 0.99992TC = 11.0494
25 30 35 40Temperature, °C
1000
1050
1100
1150
1200
Chemicalshift,ppb
L-Valine2
R2 = 0.99989TC = 10.9733
25 30 35 40Temperature, °C
1920
1940
1960
1980
2000
2020
2040
2060
2080
2100
Chemicalshift,ppb
Acetate
R2 = 0.9999TC = 10.6298
25 30 35 40Temperature, °C
1060
1080
1100
1120
1140
1160
1180
1200
1220
1240
Chemicalshift,ppb
L-Valine
R2 = 0.99991TC = 10.7942
25 30 35 40Temperature, °C
1340
1360
1380
1400
1420
1440
1460
1480
1500
1520
Chemicalshift,ppb
L-Lactate
R2 = 0.99992TC = 10.7463
25 30 35 40Temperature, °C
3220
3240
3260
3280
3300
3320
3340
3360
3380
3400
Chemicalshift,ppb
Choline
R2 = 0.99993TC = 10.5706
25 30 35 40Temperature, °C
4120
4140
4160
4180
4200
4220
4240
4260
4280
4300Chemicalshift,ppb
L-Lactate2
R2 = 0.9999TC = 10.4201
25 30 35 40Temperature, °C
2240
2260
2280
2300
2320
2340
2360
2380
2400
2420
Chemicalshift,ppb
Acetone
R2 = 0.9999TC = 10.8314
25 30 35 40Temperature, °C
1500
1520
1540
1560
1580
1600
1620
1640
1660
1680
Chemicalshift,ppb
L-Alanine
R2 = 0.99991TC = 10.9237
25 30 35 40Temperature, °C
5240
5260
5280
5300
5320
5340
5360
5380
5400
5420
5440
Chemicalshift,ppb
Glucose
R2 = 0.9999TC = 10.8766

Chemical shift dependence1, ppb, on temperature, °C,
for NIST1950 plasma sample (experiment lasting 21 h).
Temperature coefficients (TCs) as a slope of the linear
function. For all diagrams, the coefficient of
determination R2 is shown.
1 Raw data, before referencing to Lactate peak
10 15 20 25 30 35Temperature, °C
2900
2950
3000
3050
3100
3150
3200
Chemicalshift,ppb
Creatinine
R2 = 0.99923TC = 10.682
10 15 20 25 30 35Temperature, °C
2900
2950
3000
3050
3100
3150
3200
Chemicalshift,ppb
Creatine
R2 = 0.99917TC = 11.0032
10 15 20 25 30 35Temperature, °C
3400
3450
3500
3550
3600
3650
3700
Chemicalshift,ppb
Glycine
R2 = 0.99927TC = 10.7089
10 15 20 25 30 35Temperature, °C
850
900
950
1000
1050
1100
1150
Chemicalshift,ppb
L-Valine2
R2 = 0.99922TC = 10.7744
10 15 20 25 30 35Temperature, °C
1750
1800
1850
1900
1950
2000
2050
Chemicalshift,ppb
Acetate
R2 = 0.99935TC = 10.4519
10 15 20 25 30 35Temperature, °C
3700
3750
3800
3850
3900
3950
4000
Chemicalshift,ppb
L-Alanine2
R2 = 0.99934TC = 10.7309
10 15 20 25 30 35Temperature, °C
900
950
1000
1050
1100
1150
1200
Chemicalshift,ppb
L-Valine
R2 = 0.99921TC = 10.5731
10 15 20 25 30 35Temperature, °C
1200
1250
1300
1350
1400
1450
1500
Chemicalshift,ppb
L-Lactate
R2 = 0.9994TC = 10.5606
10 15 20 25 30 35Temperature, °C
3050
3100
3150
3200
3250
3300
3350Chemicalshift,ppb
Choline
R2 = 0.99946TC = 10.3484
10 15 20 25 30 35Temperature, °C
4000
4050
4100
4150
4200
4250
Chemicalshift,ppb
L-Lactate2
R2 = 0.99933TC = 10.2579
10 15 20 25 30 35Temperature, °C
2100
2150
2200
2250
2300
2350
2400
Chemicalshift,ppb
Acetone
R2 = 0.99934TC = 10.6599
10 15 20 25 30 35Temperature, °C
1350
1400
1450
1500
1550
1600
1650
Chemicalshift,ppb
L-Alanine
R2 = 0.99937TC = 10.7442
10 15 20 25 30 35Temperature, °C
5100
5150
5200
5250
5300
5350
5400
Chemicalshift,ppb
Glucose
R2 = 0.99919TC = 10.696
10 15 20 25 30 35Temperature, °C
3200
3250
3300
3350
3400
3450
3500
Chemicalshift,ppb
L-Arginine2
R2 = 0.99922TC = 10.7787
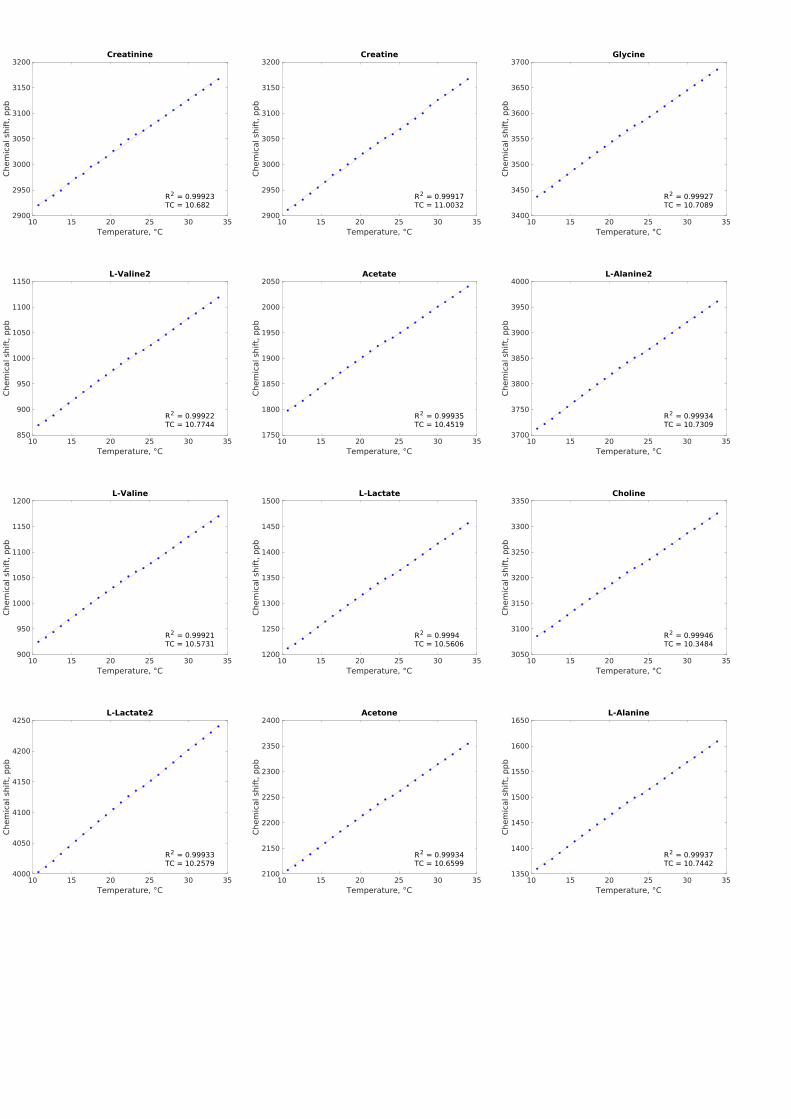
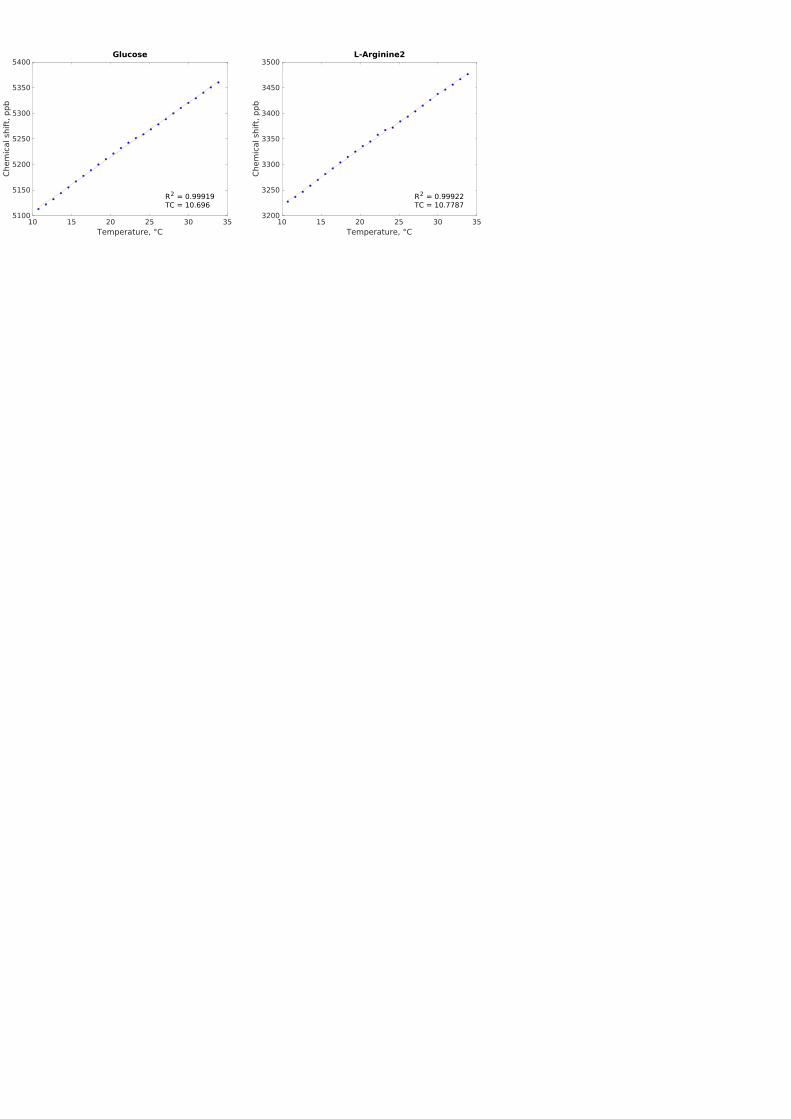
Chemical shift dependence1, ppb, on temperature, °C,
for mouse serum. Temperature coefficients (TCs) as a
slope of the linear function. For all diagrams, the
coefficient of determination R2 is shown.
1 Raw data, before referencing to Lactate peak

5 10 15 20 25 30 35Temperature, °C
3050
3100
3150
3200
3250
3300
3350
Chemicalshift,ppb
Creatinine
R2 = 0.99977TC = 10.6376
5 10 15 20 25 30 35Temperature, °C
3550
3600
3650
3700
3750
3800
3850
Chemicalshift,ppb
Glycine
R2 = 0.99972TC = 11.1987
5 10 15 20 25 30 35Temperature, °C
2900
2950
3000
3050
3100
3150
3200
Chemicalshift,ppb
Creatine1
R2 = 0.99973TC = 11.2373
5 10 15 20 25 30 35Temperature, °C
850
900
950
1000
1050
1100
1150
Chemicalshift,ppb
L-Valine2
R2 = 0.99973TC = 11.1158
5 10 15 20 25 30 35Temperature, °C
1750
1800
1850
1900
1950
2000
2050
2100
Chemicalshift,ppb
Acetate
R2 = 0.99969TC = 10.7794
5 10 15 20 25 30 35Temperature, °C
900
950
1000
1050
1100
1150
1200
Chemicalshift,ppb
L-Valine
R2 = 0.99975TC = 10.9108
5 10 15 20 25 30 35Temperature, °C
1200
1250
1300
1350
1400
1450
1500
Chemicalshift,ppb
L-Lactate
R2 = 0.9997TC = 10.8728
5 10 15 20 25 30 35Temperature, °C
3050
3100
3150
3200
3250
3300
3350
Chemicalshift,ppb
Choline
R2 = 0.99977TC = 10.6387
5 10 15 20 25 30 35Temperature, °C
4000
4050
4100
4150
4200
4250
4300Chemicalshift,ppb
L-Lactate2
R2 = 0.99966TC = 10.5741
5 10 15 20 25 30 35Temperature, °C
5100
5150
5200
5250
5300
5350
5400
Chemicalshift,ppb
Glucose
R2 = 0.99971TC = 11.0078
5 10 15 20 25 30 35Temperature, °C
2100
2150
2200
2250
2300
2350
2400
Chemicalshift,ppb
Acetone
R2 = 0.99969TC = 10.9963
5 10 15 20 25 30 35Temperature, °C
1350
1400
1450
1500
1550
1600
1650
Chemicalshift,ppb
L-Alanine
R2 = 0.99972TC = 11.0688
Chemical shift dependence1, ppb, on temperature, °C,
for NIST1950 plasma sample (experiment lasting 1 h).
Temperature coefficients (TCs) as a slope of the linear
function. For all diagrams, the coefficient of
determination R2 is shown.
1 Raw data, before referencing to Lactate peak

10 15 20 25 30Temperature, °C
2900
2950
3000
3050
3100
3150
Chemicalshift,ppb
Creatinine
R2 = 0.99947TC = 10.6377
10 15 20 25 30Temperature, °C
2900
2950
3000
3050
3100
Chemicalshift,ppb
Creatine
R2 = 0.9892TC = 10.3858
10 15 20 25 30Temperature, °C
850
900
950
1000
1050
1100
Chemicalshift,ppb
L-Valine2
R2 = 0.9995TC = 10.885
10 15 20 25 30Temperature, °C
1750
1800
1850
1900
1950
2000
Chemicalshift,ppb
Acetate
R2 = 0.99953TC = 10.4815
10 15 20 25 30Temperature, °C
900
950
1000
1050
1100
1150
Chemicalshift,ppb
L-Valine
R2 = 0.99946TC = 10.6559
10 15 20 25 30Temperature, °C
1200
1250
1300
1350
1400
Chemicalshift,ppb
L-Lactate
R2 = 0.99958TC = 10.5596
10 15 20 25 30Temperature, °C
3200
3250
3300
3350
3400
3450
Chemicalshift,ppb
Choline
R2 = 0.99953TC = 10.7648
10 15 20 25 30Temperature, °C
4000
4050
4100
4150
4200
Chemicalshift,ppb
L-Lactate2
R2 = 0.99957TC = 10.292
10 15 20 25 30Temperature, °C
2100
2150
2200
2250
2300Chemicalshift,ppb
Acetone
R2 = 0.99953TC = 10.7162
10 15 20 25 30Temperature, °C
1350
1400
1450
1500
1550
1600
Chemicalshift,ppb
L-Alanine
R2 = 0.99961TC = 10.7603
10 15 20 25 30Temperature, °C
5100
5150
5200
5250
5300
5350
Chemicalshift,ppb
Glucose
R2 = 0.9995TC = 10.7487

Chemical shift dependence1, ppb, on temperature, °C,for metabolites from the artificial mixture 2.
Temperature coefficients (TCs) as a slope of the linearfunction. For all diagrams, the coefficient of
determination R2 is shown.
1 Raw data, before referencing to Lactate peak

24 25 26 27 28 29 30 31 32Temperature, °C
1380
1390
1400
1410
1420
1430
1440
1450
1460
1470
Chemicalshift,ppb
Lactate1
R2 = 0.99999TC = 10.5194
24 25 26 27 28 29 30 31 32Temperature, °C
1020
1030
1040
1050
1060
1070
1080
1090
1100
1110
Chemicalshift,ppb
Leucine1
R2 = 0.99999TC = 10.6294
24 25 26 27 28 29 30 31 32Temperature, °C
7490
7500
7510
7520
7530
7540
7550
7560
7570
7580
7590
Chemicalshift,ppb
Phenylalanine6
R2 = 0.99998TC = 10.9276
24 25 26 27 28 29 30 31 32Temperature, °C
1070
1080
1090
1100
1110
1120
1130
1140
1150
1160
Chemicalshift,ppb
Isoleucine2
R2 = 0.99999TC = 10.5516
24 25 26 27 28 29 30 31 32Temperature, °C
7440
7450
7460
7470
7480
7490
7500
7510
7520
7530
Chemicalshift,ppb
Phenylalanine5
R2 = 0.99999TC = 10.8617
24 25 26 27 28 29 30 31 32Temperature, °C
980
990
1000
1010
1020
1030
1040
1050
1060
1070
Chemicalshift,ppb
Isoleucine1
R2 = 0.99999TC = 10.5792
24 25 26 27 28 29 30 31 32Temperature, °C
1330
1340
1350
1360
1370
1380
1390
1400
1410
1420
1430
Chemicalshift,ppb
Isoleucine3
R2 = 0.99998TC = 10.7174
24 25 26 27 28 29 30 31 32Temperature, °C
7390
7400
7410
7420
7430
7440
7450
7460
7470
7480
Chemicalshift,ppb
Phenylalanine4
R2 = 0.99999TC = 11.0526

Chemical shift dependence1, ppb, on temperature, °C,for metabolites from artificial mixture 3. Temperature
coefficients (TCs) as a slope of the linear function. Forall diagrams, the coefficient of determination R2 is
shown.
1 Raw data, before referencing to Lactate peak
S3HB - Sodium 3-hydroxybutyrate
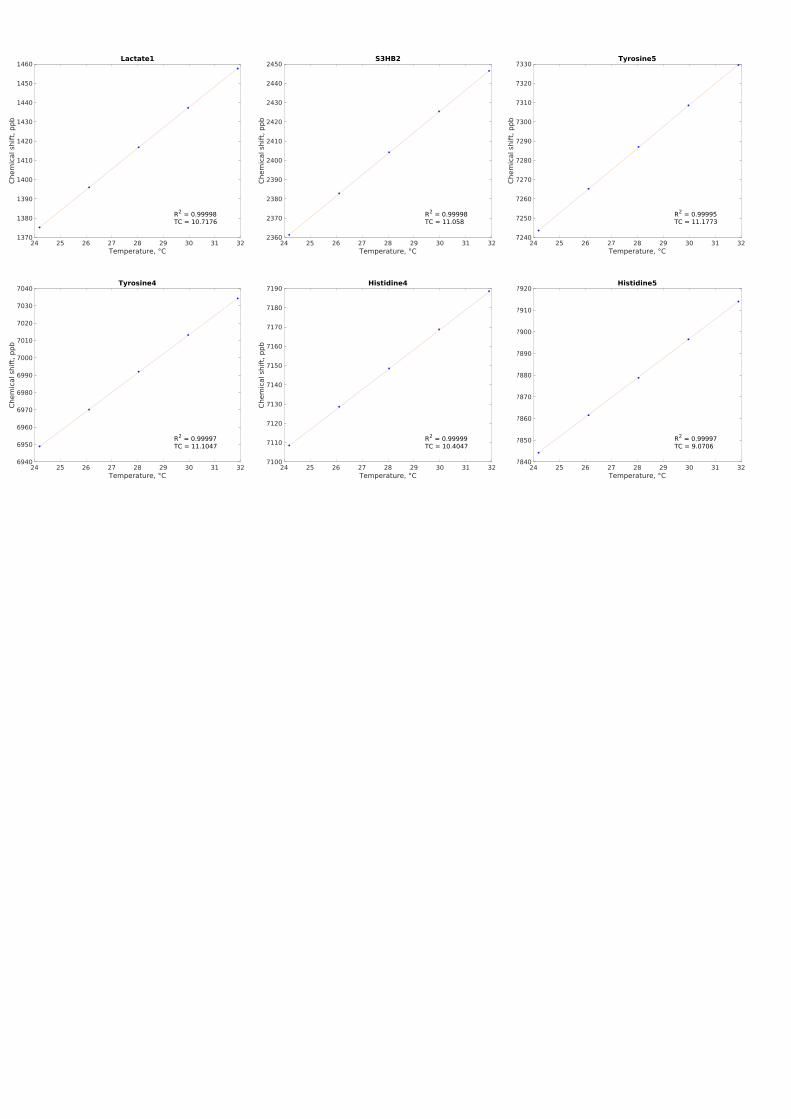
24 25 26 27 28 29 30 31 32Temperature, °C
1370
1380
1390
1400
1410
1420
1430
1440
1450
1460
Chemicalshift,ppb
Lactate1
R2 = 0.99998TC = 10.7176
24 25 26 27 28 29 30 31 32Temperature, °C
2360
2370
2380
2390
2400
2410
2420
2430
2440
2450
Chemicalshift,ppb
S3HB2
R2 = 0.99998TC = 11.058
24 25 26 27 28 29 30 31 32Temperature, °C
7240
7250
7260
7270
7280
7290
7300
7310
7320
7330
Chemicalshift,ppb
Tyrosine5
R2 = 0.99995TC = 11.1773
24 25 26 27 28 29 30 31 32Temperature, °C
7840
7850
7860
7870
7880
7890
7900
7910
7920
Chemicalshift,ppb
Histidine5
R2 = 0.99997TC = 9.0706
24 25 26 27 28 29 30 31 32Temperature, °C
6940
6950
6960
6970
6980
6990
7000
7010
7020
7030
7040
Chemicalshift,ppb
Tyrosine4
R2 = 0.99997TC = 11.1047
24 25 26 27 28 29 30 31 32Temperature, °C
7100
7110
7120
7130
7140
7150
7160
7170
7180
7190
Chemicalshift,ppb
Histidine4
R2 = 0.99999TC = 10.4047

Temperature coefficients (TC), ppb/K after referencing to Lactate peakChem. shift, ppm Art. mixture NIST1950 (21 h) NIST1950 (1 h) Mouse serum NIST1950 (1 h) after Radon proc.
Alanine 1.51 10.93 10.93 10.95 10.94 10.90Lactate* 1.36 10.75 10.75 10.75 10.75 10.75Lactate 4.14 10.44 10.48 10.42 10.45 10.46Acetate 1.95 10.64 10.67 10.63 10.65 10.66Acetone 2.26 10.85 10.90 10.83 10.87 10.94Choline 3.23 10.53 10.95 10.57 10.51 10.60Glucose 5.26 10.88 10.94 10.88 10.88 10.85
Creatinine 3.07 10.87 10.82 10.77 10.51Creatine 3.065 11.19 10.57 11.15 11.11 11.31Valine 1.08 10.76 10.84 10.79 10.78 10.87Valine 1.02 10.96 11.07 10.97 10.99 11.01
Leucine 1.03 10.85 10.84 10.80Isoleucine 0.99 10.81 10.76 10.79Isoleucine 1.07 10.79 10.73 10.76Isoleucine 1.31 10.93 10.82 10.90
Phenylalanine 7.39 11.27 11.30 11.47Phenylalanine 7.43 11.04 11.90 10.86Phenylalanine 7.49 11.14 11.12 11.07
Tyrosine 6.94 11.11 11.16 11.24Tyrosine 7.24 11.17 11.22 11.33Histidine 7.11 10.45 10.58 10.61Histidine 7.84 9.36 9.57 9.61S3HB∗∗ 2.35 11.03 11.01 11.10
* Treated as a TC reference** Sodium 3-hydroxybutyrate
1


2 (2) in deuterated water. Figure S4. 1H-NMR of complex 2 (top, in CD3CN), and 2 after irradiation](https://static.fdocuments.in/doc/165x107/5f0866a77e708231d421d390/electronic-supplementary-figure-s3-1h-nmr-of-ruf-dppzpy4cl2-2-in-deuterated.jpg)