Supplementary Information for: The Crystal … Table S2. Oligonucleotides used in the study. Primer...
12
Supplementary Information for: The Crystal Structure of Peroxiredoxin Asp f3 Provides Mechanistic Insight into Oxidative Stress Resistance and Virulence of Aspergillus fumigatus Short title: Aspergillus fumigatus Asp f3: Structure, Function, and Virulence Falk Hillmann, Karine Bagramyan, Maria Strassburger, Thorsten Heinekamp, Teresa B. Hong, Krzysztof P. Bzymek, John C. Williams, Axel A. Brakhage, and Markus Kalkum
Transcript of Supplementary Information for: The Crystal … Table S2. Oligonucleotides used in the study. Primer...

Supplementary Information for:
The Crystal Structure of Peroxiredoxin Asp f3 Provides Mechanistic Insight into Oxidative Stress
Resistance and Virulence of Aspergillus fumigatus
Short title: Aspergillus fumigatus Asp f3: Structure, Function, and Virulence
Falk Hillmann, Karine Bagramyan, Maria Strassburger, Thorsten Heinekamp, Teresa B. Hong,
Krzysztof P. Bzymek, John C. Williams, Axel A. Brakhage, and Markus Kalkum

Supplementary Table S1 Interfacing residues < 3.6 Å
PISA output for WT
Salt bridges:
1 B:ARG 131[ NH1] 3.58 A:ASP 91[ OD2] 2 B:ARG 131[ NH2] 2.95 A:ASP 91[ OD2] 3 B:ASP 91[ OD2] 3.78 A:ARG 131[ NH1] 4 B:ASP 91[ OD2] 2.99 A:ARG 131[ NH2]
Hydrogen bonds:
1 B:ARG 131[ NH2] 2.95 A:ASP 91[ OD2] 2 B:THR 29[ O ] 3.08 A:VAL 60[ N ] 3 B:ALA 30[ O ] 3.33 A:VAL 60[ N ] 4 B:ALA 30[ O ] 2.83 A:CYS 61[ N ] 5 B:ASP 91[ OD2] 2.99 A:ARG 131[ NH2]
Hydrophobic contacts:
1 B:Ile 28 – A:Val 60 2 B:Phe 57 – A:Ala 97 3 B:Ala 97 – A:Phe 57
PISA output for C31/61S
Salt bridges:
1 B:ARG 131[ NH1] 3.14 A:ASP 91[ OD2] 2 B:ARG 131[ NH2] 2.80 A:ASP 91[ OD2] 3 B:ASP 91[ OD2] 3.35 A:ARG 131[ NH1] 4 B:ASP 91[ OD2] 3.10 A:ARG 131[ NH2]
Hydrogen bonds:
1 B:SER 31[ OG ] 3.04 A:PHE 57[ O ] 2 B:ARG 131[ NH2] 2.80 A:ASP 91[ OD2] 3 B:TYR 89[ OH ] 2.69 A:ASP 91[ OD2] 4 B:PHE 57[ O ] 3.02 A:SER 31[ OG ] 5 B:ASP 91[ OD2] 2.75 A:TYR 89[ OH ] 6 B:ASP 91[ OD2] 3.10 A:ARG 131[ NH2]
Hydrophobic Contacts:
1 B:Ile 28 – A:Ile 28 2 B:Phe 57 – A:Ala 89 3 B:Thr 58 – A:Tyr 93 4 B:Val 94 – A:Val 94 5 B:Ala 97 – A:Phe 57

Supplementary Table S2. Oligonucleotides used in the study.
Primer name Sequence 5‘ to 3‘
WTf TACGCCATGGGTTCTGGACTCAAGGCCGGTG
WTr CGTAGCGGCCGCTTAGTGGTGGTGGTGGTGGTGCAGGTGCTTGAGGACGGTCTACGGTCT
C31Af GGTGAGATCACTGCTGCCGGTATCCCCATCAAC
C31Ar GTTGATGGGGATACCGGCAGCAGTGATCTCACC
C61Af GCCTTCACTCCCGTCGCCTCTGCTCGCCACGTT
C61Ar AACGTGGCGAGCAGAGGCGACGGGAGTGAAGGC
C31Sf GGTGAGATCACTGCTTCCGGTATCCCCATCAAC
C31Sr GTTGATGGGGATACCGGAAGCAGTGATCTCACC
C61Af GCCTTCACTCCCGTCTCCTCTGCTCGCCACGTT
C61Ar AACGTGGCGAGCAGAGGAGACGGGAGTGAAGGC
Aspf3‐1 CAGCCCTCATACCCCATAAC
Aspf3‐2 AGAAGATGAGGCGGGTGAG
Aspf3‐3 TATATGCGGCCGCCGGGCCTCTAGCAAATAAACTT
Aspf3‐4 ATATTACCCGGGGGCCTGAGTGGCCGCGGTCAATATATACACCATCTG
Aspf3‐5 CATCAACTACAACGCCTCCA
Aspf3‐6 GGAGGTGAGAAACGAGTTGG
Aspf3‐7 ATATTAAAGCTTGGCCATCTAGGCCCCTTCACTCCCGTCTGCTCT
Aspf3‐8 TATCGTTAATTAATGCCGAACAGACGGATTATT
Aspf3C‐fw AAAACCCGGGAGAATTCGAGAAAGCGAG
Aspf3C‐rv GAGTCCCGGGATACCACTAATG
LF‐ASPF3‐fw CAATCAATTGCCAGTTTGC
LF‐ASPF3‐rv GCGGTAAGCTAGAGTAGTGG

Supplementary Fig S1. Stereo image of simulated annealing composite omit map around C31-C62residues of WT Asp f3 contoured at =1.0.�
C31 C31C61 C61

Supplementary Fig S2. Aspf3 sedimentation equilibrium experiments
a b c
performed in PBS at 25°C. Data wascollected after 10 h equilibration at 10,000 rpm purple 20,000 rpm blue and 30,000 rpm cyan Proteinconcentration was 10 M ( ) WT Aspf3 ( ) WT Aspf3 in the presence of 1 mM TCEP ( ) C31S C61SAspf3 variant Data was fit using a monomer dimer association model The calculated molecular weight ofthe associating species ranged from 35.5 to 37.3 kDa, consistent with a dimer
( ), ( ) ( ).. ; ; /
. - ;.
μ
a
b
c

Supplementary Fig S3. (A) Deletion mutants were generated byhomologous recombination using a hygromycin resistance cassette with upstream and downstream DNA sequences ofthe encoding gene (AFUA_6G02280). (B) Deletion mutants were complemented with the gene locuslinked to the pyrithiamine resistance cassette. Homologous recombination and chromosomal integration of the genecassettes were verified by (C) Southern hybridizations using probes directed against the upstream region of andthe absence of the Asp f3 protein in the deletions strains was further confirmed by (D) Coomassie stained SDS-PAGEand Western blot with cell lysates from the following strains: parental D141 (WT), deletion ( ), thecomplemented strain ( ), and
. (D-E) Lanes were rearranged according to the loading order and demarcated by black lines.
Gene deletion of in .asp f3 A. fumigatus
asp f3 asp f3
asp f3
asp f3A. fumigatus
asp f3
�
C (E) with recombinant Asp f3 and its mutants under reducing (r) and non-reducing(nr) conditions
D141(WT) asp f3
C�asp f3
A
B
D
C E
SDS PAGEanti-Asp f3
Western blot
asp
f3C
�asp
f3
D141(WT)
D141(WT) a
sp
f3C
�asp
f3
nr r
75
37
25
15
kDa
rAsp f3
nr r nr r nr rWT
nr r nr r nr rWT
75
37
25
15
kDa
C31S/C61S
C31A/C61A
C31S/C61S
C31A/C61A
A. fumigatus
nr r

Supplementary Fig S4 Enzymatic production and quantification of ·O ¯ by the ferricytochrome reduction assay .
A)
, C3131
B)
2
20
Xanthine oxidase (100 μg/mL) was added to Czapek-Dox medium with varying concentrations of xanthin and 100 μMferricytochrome (Sigma-Aldrich ). ° =550 nm. The· ¯-dependent reduction of ferricytochrome was strictly dependant on the xanthine concentration and was fully inhibited by theaddition of SOD (red line) at 20 units/mL(Sigma-Aldrich, S4636). Data were acquired from three independent experiments andone representative data set is displayed. 200 μM (blue line) and 100 μM of xanthine (blue line) led to a linear increase inabsorbance (A ) from 0.45 to 0.75 and from 0.41 to 0.60, respectively. The absorbance difference between oxidized andcompletely, dithionite-reduced ferricytochrome (ΔA ) depends on the total concentration of ferricytochrome . The standardcurve demonstrates that xanthine oxidation and ·O ¯ release occurred at a molar ratio of approximately 2:1.
c
c
c c
The reaction was followed at 37 C as an increase in absorbance at λO2
2
550 nm
550 nm
.

Supplementary Fig S5. Lungs were fixed in bufferedformalin and embedded in paraffin; 4-μm sections were stained using Periodic acid-Schiff (PAS, hyphae stain magenta)or methenamine silver (hyphae stain black). The presence of invasive fungal hyphae (magenta or black), destructed lungtissue, and infiltration of immune cells (purple nuclei) was confirmed in lungs of mice infected with WT(D141) and the complemented strain ( ) 2-5 days post infection. Invasive hyphae (arrow 1) and infiltration ofimmune cells (arrow 2) were detected in lung sections infected with the WT, but comparably few immune cells orinvasive hyphae were detected 14 d after infection with the deletion mutant ( ). Occasional goblet cellhyperplasia was observed (arrow 3). A lung section of a sham-infected mouse is shown as a control (PBS).
Histology of lungs from mice infected with .A. fumigatus
A. fumigatus
asp f3
asp f3
C
�
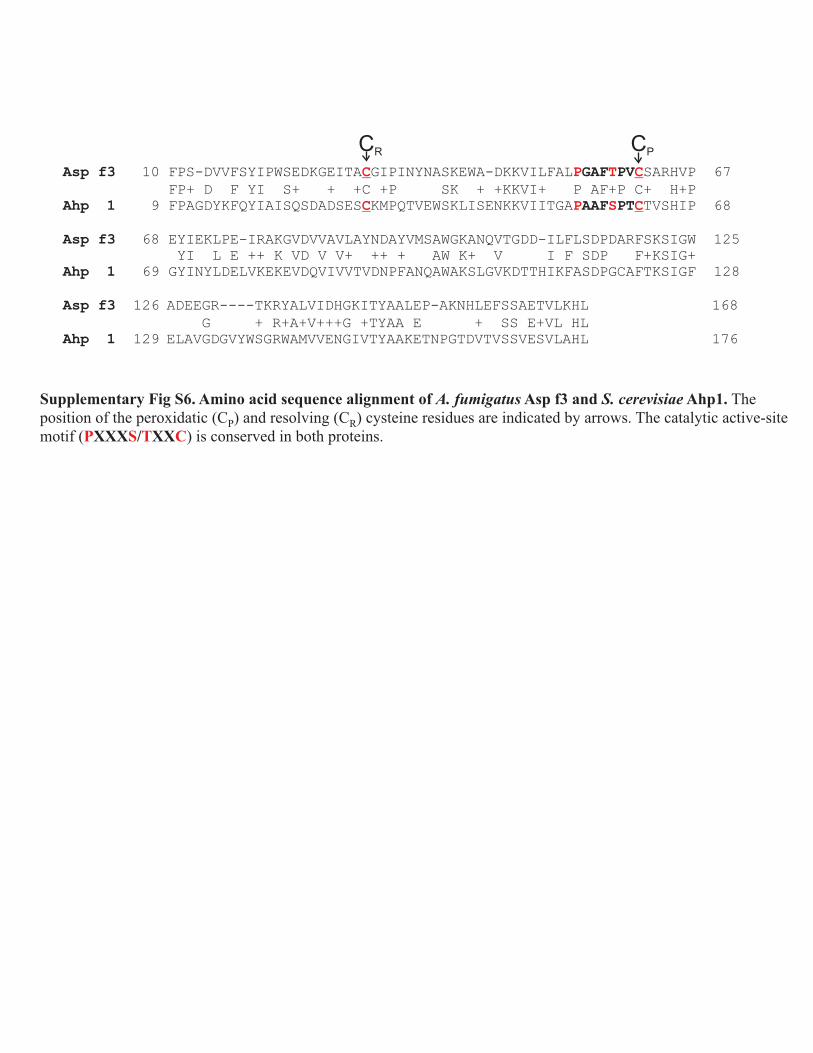
Supplementary Fig S6. Amino acid sequence alignment of Asp f3 and Ahp1.
XXX / XX
A. fumigatus S. cerevisiae Theposition of the peroxidatic (C ) and resolving (C ) cysteine residues are indicated by arrows. The catalytic active-sitemotif ( ) is conserved in both proteins.
P R
P S T C
Asp f3 10 FPS-DVVFSYIPWSEDKGEITA GIPINYNASKEWAC -DKKVILFAL SARHVP 67GAF PVP T C
FP+ D F YI S+ + +C +P SK + +KKVI+ P AF+P C+ H+P
Ahp 1 9 FPAGDYKFQYIAISQSDADSES KMPQTVEWSKLISENKKVIITGA TVSHIP 68AAF PTC CP S
Asp f3 68 EYIEKLPE-IRAKGVDVVAVLAYNDAYVMSAWGKANQVTGDD-ILFLSDPDARFSKSIGW 125
YI L E ++ K VD V V+ ++ + AW K+ V I F SDP F+KSIG+
Ahp 1 69 GYINYLDELVKEKEVDQVIVVTVDNPFANQAWAKSLGVKDTTHIKFASDPGCAFTKSIGF 128
Asp f3 126 ADEEGR----TKRYALVIDHGKITYAALEP-AKNHLEFSSAETVLKHL 168
G + R+A+V+++G +TYAA E + SS E+VL HL
Ahp 1 129 ELAVGDGVYWSGRWAMVVENGIVTYAAKETNPGTDVTVSSVESVLAHL 176
CR CP

Supplementary Fig S7. A structural difference between the dimerization interfaces of Asp f3 () and Ahp1 ( )
A.
fumigatus S. cerevisiae . Asp f3 backbones are shown in green and yellow, Ahp1 backbones ingrey; Unique to Asp f3: the carboxylate in Asp91 in makes a backbone h-bond (distance = 2.9 Å), capping thehelix. Arg131* from the other protomer stabilizes the Asp91 through a salt bridge (distance = 3.0 Å).Moreover, the hydroxyl group of Tyr89* makes an H-bind to the guandinium group of Arg131* (3.3 Å). Thispart of the interface is not affected by the large conformation change that involves the redox active cysteines.The asterisk marks residues of the opposite protomer.
Asp91
Arg131*
Tyr89*

10 100 1000
0
5.0 x 10³
1.0 x 10⁴
2.0 x 10⁴
RF
UC31AWT
C31SC61AC61SC31A/C61AC31S/C61S
HRP
Asp f3:
Time, min
Supplementary Fig S8. Time-based kinetic analysis of fluorescence produced by Asp f3 WT and its mutants
with AmplifluRed and H O .2 2 Fluorescent measurements were made at 535/585 Excitation/Emission wavelengths.HRP was used as a positive control. Data represents the average of three independent measurements.

b
a
1000
0 250 500 750 1000
y = 9.34x + 476.9R² = 0.97
3.0 x 10⁴
1.8 x 10⁴
6.0 x 10³
RF
U
[H O ], mol/L2 2 µ
[ -BOOH], µmol/Lt
750500
y = 23.8x + 1178.9
250
R² = 0.99
0
2.5 x 10⁴
1.5 x 10⁴
5.0 x 10³
RF
U
Supplementary Fig S9. Standard curves generated with an HRP. a
b
Each reaction contained Ampliflu Red and ( )H O or ( ) -bOOH ranging in concentration from 0 to 1 mM. The data was fitted by linear regression analysisrepresented by the inserted equations.
2 2 t