Supplementary Information ApoC-III Modulates Clearance of ... · cholesterol in wild-type mice...
13
Supplementary Information ApoC-III Modulates Clearance of Triglyceride-Rich Lipoproteins Through LDL Family Receptors Philip L.S.M. Gordts 1,2,* , Ryan Nock 1 , Ni-Huiping Son 3 , Bastian Ramms 1,2,4 , Irene Lew 1 , Jon C. Gonzales 1 , Bryan E. Thacker 1 , Debapriya Basu 3 , Richard G. Lee 5 , Adam E. Mullick 5 , Mark J. Graham 5 , Ira J. Goldberg 3 , Rosanne M. Crooke 5 , Joseph L. Witztum 2 and Jeffrey D. Esko 1,* . 1 Department of Cellular and Molecular Medicine, Glycobiology Research and Training Center, University of California, San Diego, La Jolla, CA, USA 2 Department of Medicine, Division of Endocrinology and Metabolism, University of California, San Diego, La Jolla, CA, USA 3 Division of Endocrinology, Diabetes and Metabolism, NYU Langone Medical Center, New York, NY, USA 4 Department of Chemistry, Biochemistry I, Bielefeld University, Bielefeld, Germany 5 Ionis Pharmaceuticals, Inc., Carlsbad, CA, USA *Corresponding authors: Jeffrey D. Esko, Department of Cellular and Molecular Medicine, University of California, San Diego, La Jolla, CA 92093-0687, Ph: 858/822-1100, FAX: 858/534-5611, [email protected]
Transcript of Supplementary Information ApoC-III Modulates Clearance of ... · cholesterol in wild-type mice...

Supplementary Information
ApoC-III Modulates Clearance of Triglyceride-Rich Lipoproteins
Through LDL Family Receptors
Philip L.S.M. Gordts1,2,*, Ryan Nock1, Ni-Huiping Son3, Bastian Ramms1,2,4, Irene Lew1, Jon
C. Gonzales1, Bryan E. Thacker1, Debapriya Basu3, Richard G. Lee5, Adam E. Mullick5,
Mark J. Graham5, Ira J. Goldberg3, Rosanne M. Crooke5, Joseph L. Witztum2 and
Jeffrey D. Esko1,*.
1Department of Cellular and Molecular Medicine, Glycobiology Research and Training Center,
University of California, San Diego, La Jolla, CA, USA
2Department of Medicine, Division of Endocrinology and Metabolism, University of California,
San Diego, La Jolla, CA, USA
3Division of Endocrinology, Diabetes and Metabolism, NYU Langone Medical Center, New York,
NY, USA
4Department of Chemistry, Biochemistry I, Bielefeld University, Bielefeld, Germany
5Ionis Pharmaceuticals, Inc., Carlsbad, CA, USA
*Corresponding authors:
Jeffrey D. Esko, Department of Cellular and Molecular Medicine, University of California, San
Diego, La Jolla, CA 92093-0687, Ph: 858/822-1100, FAX: 858/534-5611, [email protected]

Philip L.S.M. Gordts, Department of Medicine, University of California, San Diego, La Jolla, CA
92093-0687, Ph: 858/246-0994, FAX: 858/534-5611, [email protected]

SUPPLEMENTARY INFORMATION
SUPPLEMENTAL FIGURES
Figure S1. ApoC-III mediated TG reduction in wild-type mice treated with control ASO,
Ldlr ASO, LRP1 ASO and a combination of LDLR and LRP1 ASOs. (A-C) Liver expression
of (A) Ldlr, (B) Lrp1 and (C) ApoC3 RNA in wild-type mice treated with control ASO (45
mg/kg/week), Ldlr ASO (5 mg/kg/week), LRP1 ASO (5 mg/kg/week), a combination of LDLR (5
mg/kg/week) and LRP1 ASOs (5 mg/kg/week) mice, or a control ASO (45 mg/kg/week). A
separate set of mice were treated simultaneously with apoC-III ASO (10 mg/kg/week). (D)
Fasting plasma TG in wild-type mice treated for 4 weeks with the indicated ASOs. (E) Relative
changes in plasma TG levels induced by apoC-III ASO in wild-type mice treated with control
ASO, Ldlr ASO, LRP1 ASO and a combination of LDLR and LRP1 ASOs. (F) Fasting plasma
cholesterol in wild-type mice treated for 4 weeks with control or apoC-III ASO. Values represent
mean ± SEM (n = 4/group). *p < 0.05 and ** p < 0.01 compared to control ASO treated mice.
ANOVA and Bonferroni post-hoc test.
Ctrl ASO
LDLR A
SO
LRP1 A
SO
LDLR +
LRP1 A
SO
0
50
100
150
200
Liv
er
Ldlr
Ex
pre
ss
ion
(% o
f C
trl A
SO
)
Ctrl ASO
ApoC-III ASO
Ctrl ASO
LDLR A
SO
LRP1 A
SO
LDLR +
LRP1 A
SO
0
50
100
150
200
Liv
er
Apo
c-III
Ex
pre
ss
ion
(% o
f C
trl A
SO
)
Ctrl ASO
ApoC-III ASO
Ctrl ASO
LDLR A
SO
LRP1 A
SO
LDLR +
LRP1 A
SO
0
50
100
150
200
Liv
er
Lrp1
Ex
pre
ss
ion
(% o
f C
trl A
SO
)
Ctrl ASO
ApoC-III ASO
Ctrl ASO
LDLR A
SO
LRP1 A
SO
LDLR +
LRP1 A
SO
0
50
100
150
200
Tri
gly
ce
rid
e (
mg
/dl) Ctrl ASO
ApoC-III ASO
Ctrl ASO
LDLR A
SO
LRP1 A
SO
LDLR +
LRP1 A
SO
0
100
200
300
400
Ch
ole
ste
rol (m
g/d
l) Ctrl ASO
ApoC-III ASO
-40
-30
-20
-10
0
10
Ch
an
ge
in
pla
sm
a t
rig
lyc
eri
de
s
(% o
f C
trl A
SO
)
Ctrl ASO
LDLR ASO
LRP1 ASO
LDLR + LRP1 ASO
A B C
D
** ** ** ** ** ** ** ** *
F
* **
*
***
Figure S1 - Gordts et al.
E

Figure S2. Impact of ApoC-III ASO on body weight of chow fed mutant mice. (A-F)
Bodyweight changes of indicated mice over the 4-week apoC-III ASO treatment. Values
represent mean ± SEM. ANOVA and Bonferroni post-hoc test.
CBA
Figure S2 - Gordts et al
FED
0 1 2 3 4
0
10
20
30
40
Weeks on treatment
Bo
dy
we
igh
t (g
)
Wild-type
Ctrl ASO
ApoC-III ASO
0 1 2 3 4
0
10
20
30
40
Weeks on treatment
Bo
dy
we
igh
t (g
)
Ldlr-/-Lrp1f/fAlbCre+
Ctrl ASO
ApoC-III ASO
0 1 2 3 4
0
10
20
30
40
Weeks on treatment
Bo
dy
we
igh
t (g
)
Ldlr-/-
Ctrl ASO
ApoC-III ASO
0 1 2 3 4
0
10
20
30
40
Weeks on treatment
Bo
dyw
eig
ht
(g)
Ldlr-/-Ndst1f/fAlbCre+
Ctrl ASO
ApoC-III ASO
0 1 2 3 4
0
10
20
30
40
Weeks on treatment
Bo
dy
we
igh
t (g
)
Ndst1f/fAlbCre+
Ctrl ASO
ApoC-III ASO
0 1 2 3 4
0
10
20
30
40
Weeks on treatment
Bo
dy
we
igh
t (g
)
Ndst1f/fLrp1f/fAlbCre+
Ctrl ASO
ApoC-III ASO

Figure S3. Impact of ApoC-III ASO on plasma cholesterol levels in high fat diet fed mutant
mice. Relative changes in fasting plasma cholesterol levels induced by apoC-III ASO in mutant
mice.
-60
-40
-20
0
20
Ndst1f/fAlbCre+Wild-type
Ndst1f/fLrp1f/fAlbCre+
Ldlr-/-Ndst1f/fAlbCre+
Ldlr-/-
Ldlr-/-Lrp1f/fAlbCre+
Ch
an
ge
in
pla
sm
a c
ho
les
tero
l
(% o
f C
on
tro
l A
SO
) Figure S3 - Gordts et al.

Figure S4. Impact of ApoC-III ASO on body weight of high fat diet fed mutant mice. (A-F)
Bodyweight changes of indicated mice over the 5-week apoC-III ASO treatment. Values
represent mean ± SEM. ANOVA and Bonferroni post-hoc test.
CBA
Figure S3 - Gordts et al
FED
0 1 2 3 4 5
0
10
20
30
40
50
Weeks on treatment
Bo
dy
we
igh
t (g
)
Wild-type
Ctrl ASO
ApoC-III ASO
0 1 2 3 4 5
0
10
20
30
40
50
Weeks on treatment
Bo
dyw
eig
ht
(g)
Ldlr-/-Ndst1f/fAlbCre+
Ctrl ASO
ApoC-III ASO
0 1 2 3 4 5
0
10
20
30
40
50
Weeks on treatment
Bo
dy
we
igh
t (g
)
Ndst1f/fAlbCre+
Ctrl ASO
ApoC-III ASO
0 1 2 3 4 5
0
10
20
30
40
50
Weeks on treatment
Bo
dy
we
igh
t (g
)
Ldlr-/-
Ctrl ASO
ApoC-III ASO
0 1 2 3 4 5
0
10
20
30
40
50
Weeks on treatment
Bo
dyw
eig
ht
(g)
Ndst1f/fLrp1f/fAlbCre+
Ctrl ASO
ApoC-III ASO
0 1 2 3 4 5
0
10
20
30
40
50
Weeks on treatment
Bo
dy
we
igh
t (g
)
Ldlr-/-Lrp1f/fAlbCre+
Ctrl ASO
ApoC-III ASO

Figure S5. Characterization of the tamoxifen inducible LPL-deficient mice. (A) Liver,
skeletal muscle, white adipose tissue (WAT) and heart expression of Lpl and apoc-III mRNA
relative to 18s in Lplfl/fl mice treated with (iLpldf) or without tamoxifen to induce inactivation of LPL
expression 2 weeks after tamoxifen administration (n = 4-8/group). (B) Plasma, skeletal muscle,
WAT and heart LPL activity levels 5 min after intravenous heparin (5 U/mouse) injection or a 30
min incubation in Lplfl/fl mice and Lplfl/fl mice treated with tamoxifen (iLpldf) (n = 3/group). In
addition similar LPL activity measurements were obtained in heart homogenates (heart hom.) in
the absence of heparin. (C) Fasting plasma triglyceride and (D) cholesterol levels in Lplfl/fl mice
and Lplfl/fl mice treated with tamoxifen (iLpldf) on a chow diet or a high-fat diet. Plasma lipid levels
were measured 2 weeks after the last tamoxifen administration. (E) FPLC profiles of lipoprotein
TG in plasma from pooled fasted Lplfl/fl mice and Lplfl/fl mice treated with tamoxifen to induce
A B
C D
Figure S5 - Gordts et al
Liv
er
Muscle
WAT
Heart
0
50
100
150
Tis
su
e L
PL
ex
pre
ssio
n
(% o
f L
plfl
/fl )
Lplfl/fl
iLpldf
*** *** **
Chow diet HF diet
0
500
1000
1500
Tri
gly
ce
rid
es (
mg
/dl) Lplfl/fl
iLpldf
***
**
Chow diet HF diet
0
50
100
150
Ch
ole
ste
ro
l (m
g/d
l) Lplfl/fl
iLpldf
**
0 5 10 15 20 25 30 35 40 45
0
10
20
30
Fraction
Tri
gly
ce
rid
e (
mg
/dl)
Lplfl/fliLpldf
0 5 10 15 20 25 30 35 40 45
0
1
2
3
4
5
Fraction
Ch
ole
ste
rol (m
g/d
l)
iLpldf Lplfl/fl
CR/VLDL
IDL/LDL HDL
CR/VLDL
IDL/LDL
HDL
E F
Pla
sm
a
Muscle
WAT
Heart
Heart H
om
.
0
50
100
150
Tis
su
e L
PL
acti
vit
y
(% o
f L
plfl/
fl )
Lplfl/fl
iLpldf
**
** ***** **

inactivation of LPL expression (iLpldf) on a chow diet (n = 3 per group). (F) FPLC profiles of
lipoprotein cholesterol in plasma from fasted Lplfl/fl mice and Lplfl/fl mice treated with tamoxifen
(iLpldf) on a chow diet. The elution positions of chylomicron remnant (CR)/very low-density
lipoprotein (VLDL), intermediate density lipoprotein (IDL)/low-density lipoprotein (LDL), and
high-density lipoprotein (HDL) are indicated. Values represent mean ± SEM. *p < 0.01, **p <
0.005 and ***p < 0.001 compared to Lplfl/fl mice. ANOVA and Bonferroni post-hoc test.
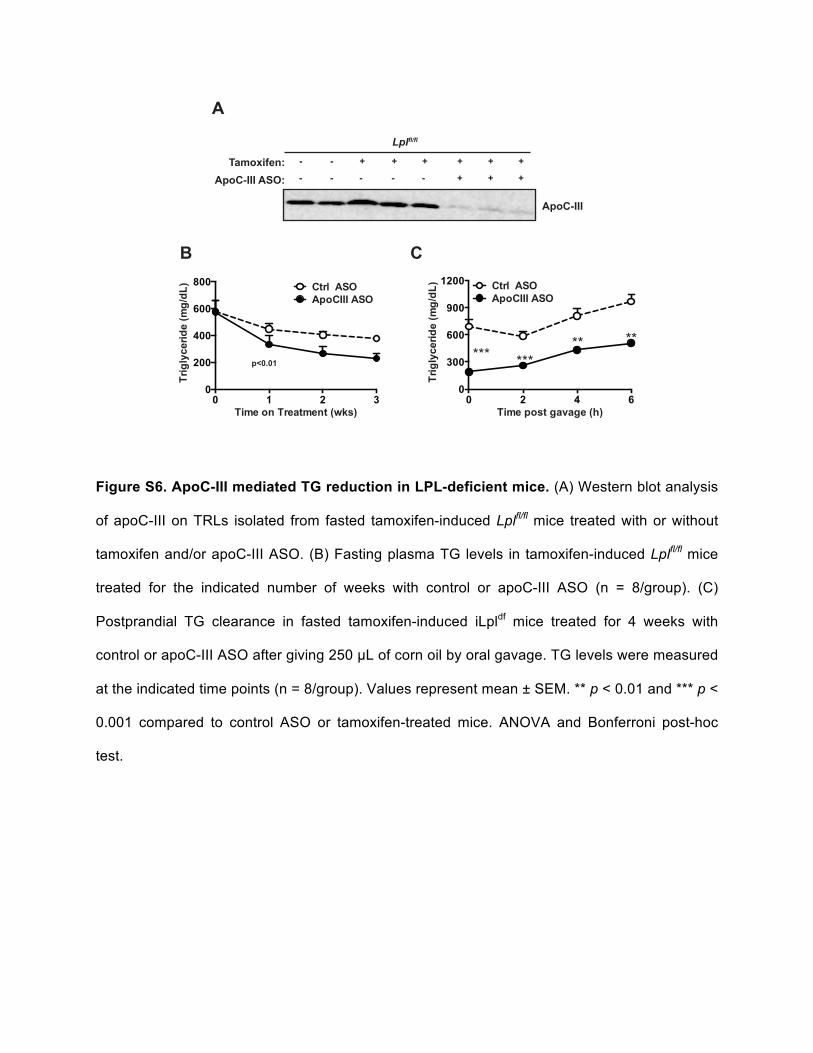
Figure S6. ApoC-III mediated TG reduction in LPL-deficient mice. (A) Western blot analysis
of apoC-III on TRLs isolated from fasted tamoxifen-induced Lplfl/fl mice treated with or without
tamoxifen and/or apoC-III ASO. (B) Fasting plasma TG levels in tamoxifen-induced Lplfl/fl mice
treated for the indicated number of weeks with control or apoC-III ASO (n = 8/group). (C)
Postprandial TG clearance in fasted tamoxifen-induced iLpldf mice treated for 4 weeks with
control or apoC-III ASO after giving 250 µL of corn oil by oral gavage. TG levels were measured
at the indicated time points (n = 8/group). Values represent mean ± SEM. ** p < 0.01 and *** p <
0.001 compared to control ASO or tamoxifen-treated mice. ANOVA and Bonferroni post-hoc
test.
B C
A
ApoC-III
Tamoxifen:
ApoC-III ASO:
- - + + + + + +
- - - - - + + +
Lplfl/fl
p<0.01
** ********
Figure S6 - Gordts et al
0 1 2 3
0
200
400
600
800
Time on Treatment (wks)
Tri
gly
ce
rid
e (
mg
/dL
)
Ctrl ASO
ApoCIII ASO
0 2 4 6
0
300
600
900
1200
Time post gavage (h)
Tri
gly
ce
rid
e (
mg
/dL
) Ctrl ASO
ApoCIII ASO

Fig. S7. [3H]Retinol labeled TRL lipid Composition. (A) Analysis of triglyceride, cholesterol
esters (CE) and free cholesterol (FC) levels per mg protein, ratio of free cholesterol to
cholesterol esters, ratio of triglycerides to cholesterol esters and (B) retinol counts per µg protein
of TRLs isolated 3 hours after corn oil gavage with 250 µl corn oil containing 5 µCi [3H]Retinol]
from Ldlr-/-Ndst1fl/flAlbCre+ mice on a chow diet treated for 4 weeks with control ASO or ApoC-III
ASO. TRLs were prepared by ultracentrifugation (δ = 1.006 g/mL) (n = 3-6 mice per treatment
group). T-test, ANOVA and Bonferroni post-hoc test.
B
Figure S7 - Gordts et al
TG CE FCTG/C
EFC/C
E0
200
400
600
800
0
2
4
6
8
10
g / m
g pr
otei
n
Control ASOApoC-III ASO
Ratio
[3H]Retinol0
200
400
600
800
1000
cpm
/ g
prot
ein
Control ASOApoC-III ASO
A
Fig. S8. TRL Apolipoprotein Composition. (A) SDS-PAGE analysis of plasma TRLs from
indicated mice on a chow diet. TRLs were prepared by ultracentrifugation (δ = 1.006 g/mL) and
pooled samples (n = 2-5 mice per pool) were separated on 4-12% SDS-PAGE gradient gels.
The proteins were visualized using silver stain. The positions of apoB-100, apoB-48, apoE and
apoCs are indicated on the right side. The lane on the left side contains protein MW markers.
(B-C) Western blot analysis for apoC-III of pooled TRLs (5 µg) isolated from fasted mutant mice
(n = 2-5/pool) on (B) a chow diet and (C) a high fat diet.
A
B
C

SUPPLEMENTAL TABLES
Table S1 Murine Antisense Oligonucleotide Sequences
Ionis number Name Target Gene Sequence
ION 141923 Control ASO N.A. (scramble) 5’-CCTTCCCTGAAGGTTCCTCC
ION 440726 apoC-III ASO apoC-III 5'-CCAGCTTTATTAGGGACAGC-3'
ION 713852 LDLR ASO Ldlr 5'-CTTTATCTTTAACCTC-3'
ION 793588 LRP1 ASO Lrp1 5'-CCCAGTAGATGTTGCCTGCA-3'

Table S2 PCR Primers
Gene Forward primer Reverse primer
18s 5'-CCATCCAATCGGTAGTAGCG-3' 5'-GTAACCCGTTGAACCCCATT-3'
Apoc-III 5’-TGCAGGGCTACATGGAACAA-3’ 5’-TCGGACTCCTGCACGCTACTT-3’
Ldlr 5'-GACCGCAGCGAGTACACCA-3' 5'-TCACCTCCGTGTCGAGAGC-3'
Lpl 5'-GCTGGTGGGAAATGATGTG-3' 5'-TGGACGTTGTCTAGGGGGTA-3'
Lrp1 5'-TGGTCTGATGTGCGGACTCA-3' 5'-AACAGATTTCGGGAGACCCA -3'
Tbp 5’-GAAGCTGCGGTACAATTCCAG-3’ 5’-CCCCTTGTACCCTTCACCAAT-3’


![16th APOC Goa, India - asiapacificoptometry.orgasiapacificoptometry.org/doc/16th-APOC-Goa-India.pdf16th APOC Goa, India - Come to India Education - Conference Programme [new] - Invited](https://static.fdocuments.in/doc/165x107/5b2738237f8b9a42708b4b3f/16th-apoc-goa-india-apoc-goa-india-come-to-india-education-conference-programme.jpg)