Supplementary Information 20160324 Atlas of Malignant Haematology, vol. 1 Acute Leukaemia. CRC...
4
Supplementary Information Gab2 is Essential for Bcr-Abl Mediated Leukemic Transformation and Hydronephrosis in a Chronic Myeloid Leukemia Mouse Model Material and Methods Mice Gab2 -/- mice 1 were bred with ScltTA or TRE-BCR-ABL1 mice 2 , all on a mixed C57/BL6 x 129SV background, to generate Gab2 -/+ /ScltTA and Gab2 -/+ /TRE-BCR-ABL1 animals (Figure 1A). Both F1 genotypes were mated in the presence of tetracycline hydrochloride (0.5 g/L; Sigma-Aldrich, Germany) to prevent Bcr-Abl expression during embryogenesis. 2 Double transgenic (ScltTA/TRE-BCR-ABL1) offspring with all three Gab2 genotypes (Gab2 -/- ; Gab2 -/+ ; Gab2 +/+ ) were identified by PCR as described previously 1, 2 and used for this study. C57BL/6 WT mice were obtained from Janvier Labs. Mice were raised under specific-pathogen free conditions (12 h light/dark cycles), with standard food and water ad libitum. All animal experimentation was approved by local authorities (Regierungspräsidium Freiburg; G-14/53 and G-15/018). Bone marrow transplantation (BMT) C57BL/6 WT recipients underwent myeloablative total body irradiation (TBI) (10 Gy, split doses of 2 x 5 Gy, 4 hours apart) followed by i.v. injection of 5 x 10 6 bone marrow (BM) cells of ScltTA/TRE-BCR-ABL1 mice with all three Gab2 genotypes (Gab2 -/- ; Gab2 -/+ ; Gab2 +/+ ) or Bcr-Abl negative controls. The donors received tetracycline hydrochloride until BM isolation leading to Bcr-Abl expression only in the newly developing hematopoietic system. Recipients were used at the age of 8 weeks, the donors were 16 weeks old. Only sex-matched donor-recipient pairs were used. Baytril (enrofloxacin) was added to the drinking water at 0.5 mg/ml for 4 weeks after transplantation to minimize infection-related death. Development of CML and mast cell phenotype were monitored 2 weeks after BMT and then every 4 weeks. Hematological analysis If not stated otherwise, blood was analyzed using the scil Vet ABC Hematology Analyzer (scil animal care company, USA). Formalin fixed and paraffin embedded tissue sections from kidney and de-calcified bone marrow were stained with hematoxylin & eosin or Giemsa solution according to standard protocols as well as in a chloroacetoesterase (CAE) reaction, as described elsewhere. 3 Amount of mast cells in the bone marrow was semi-quantitatively assessed in 5% increments using CAE stained tissue sections. Air-dried smears of peripheral blood were stained with May-Gruenwald-Giemsa (MGG) solution according to a standard protocol and five hemograms were prepared for each group of mice.
Transcript of Supplementary Information 20160324 Atlas of Malignant Haematology, vol. 1 Acute Leukaemia. CRC...

Supplementary Information
Gab2 is Essential for Bcr-Abl Mediated Leukemic Transformation and
Hydronephrosis in a Chronic Myeloid Leukemia Mouse Model
Material and Methods
Mice
Gab2-/- mice1 were bred with ScltTA or TRE-BCR-ABL1 mice2, all on a mixed C57/BL6 x 129SV background,
to generate Gab2-/+/ScltTA and Gab2-/+/TRE-BCR-ABL1 animals (Figure 1A). Both F1 genotypes were mated
in the presence of tetracycline hydrochloride (0.5 g/L; Sigma-Aldrich, Germany) to prevent Bcr-Abl
expression during embryogenesis.2 Double transgenic (ScltTA/TRE-BCR-ABL1) offspring with all three Gab2
genotypes (Gab2-/-; Gab2-/+; Gab2+/+) were identified by PCR as described previously1, 2 and used for this
study. C57BL/6 WT mice were obtained from Janvier Labs. Mice were raised under specific-pathogen free
conditions (12 h light/dark cycles), with standard food and water ad libitum. All animal experimentation
was approved by local authorities (Regierungspräsidium Freiburg; G-14/53 and G-15/018).
Bone marrow transplantation (BMT)
C57BL/6 WT recipients underwent myeloablative total body irradiation (TBI) (10 Gy, split doses of 2 x 5 Gy,
4 hours apart) followed by i.v. injection of 5 x 10⁶ bone marrow (BM) cells of ScltTA/TRE-BCR-ABL1 mice
with all three Gab2 genotypes (Gab2-/-; Gab2-/+; Gab2+/+) or Bcr-Abl negative controls. The donors received
tetracycline hydrochloride until BM isolation leading to Bcr-Abl expression only in the newly developing
hematopoietic system. Recipients were used at the age of 8 weeks, the donors were 16 weeks old. Only
sex-matched donor-recipient pairs were used. Baytril (enrofloxacin) was added to the drinking water at
0.5 mg/ml for 4 weeks after transplantation to minimize infection-related death. Development of CML and
mast cell phenotype were monitored 2 weeks after BMT and then every 4 weeks.
Hematological analysis
If not stated otherwise, blood was analyzed using the scil Vet ABC Hematology Analyzer (scil animal care
company, USA). Formalin fixed and paraffin embedded tissue sections from kidney and de-calcified bone
marrow were stained with hematoxylin & eosin or Giemsa solution according to standard protocols as well
as in a chloroacetoesterase (CAE) reaction, as described elsewhere.3 Amount of mast cells in the bone
marrow was semi-quantitatively assessed in 5% increments using CAE stained tissue sections. Air-dried
smears of peripheral blood were stained with May-Gruenwald-Giemsa (MGG) solution according to a
standard protocol and five hemograms were prepared for each group of mice.
Supplementary Figures
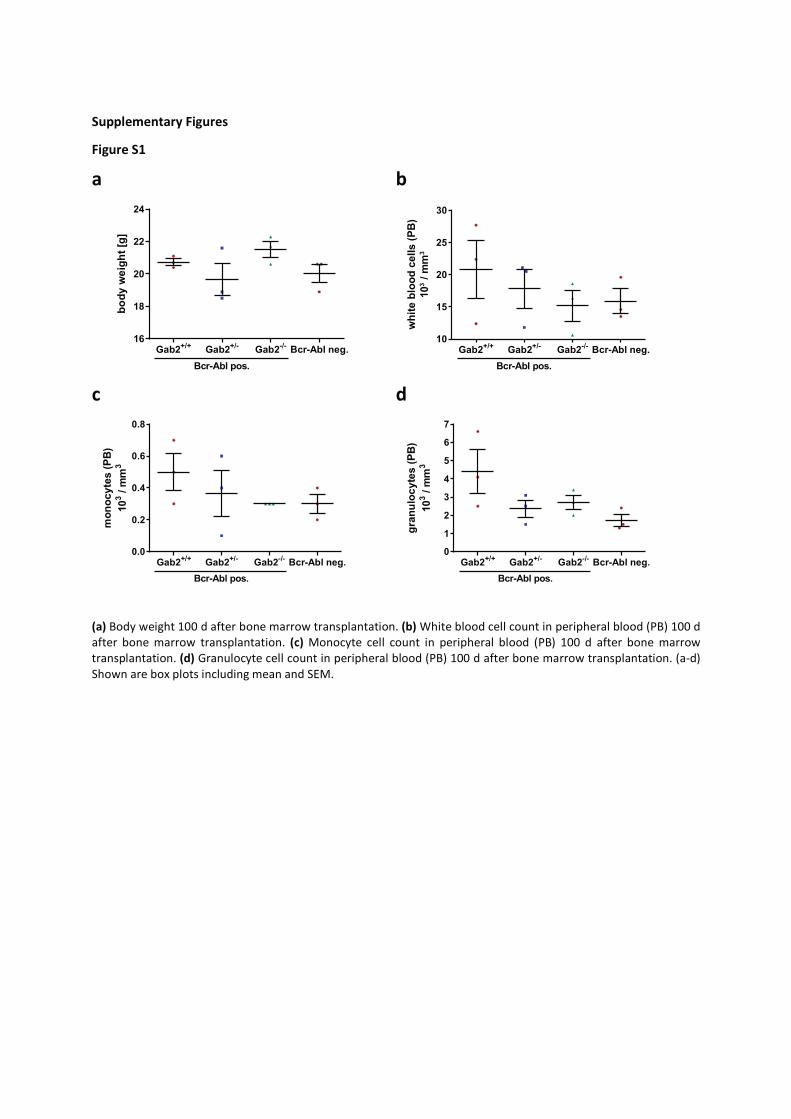
Figure S1
a b
c d
(a) Body weight 100 d after bone marrow transplantation. (b) White blood cell count in peripheral blood (PB) 100 d
after bone marrow transplantation. (c) Monocyte cell count in peripheral blood (PB) 100 d after bone marrow
transplantation. (d) Granulocyte cell count in peripheral blood (PB) 100 d after bone marrow transplantation. (a-d)
Shown are box plots including mean and SEM.
Gab2+/+
Gab2+/-
Gab2-/-
Bcr-Abl neg.16
18
20
22
24
bo
dy
we
igh
t [g
]
Bcr-Abl pos.
Gab2+/+
Gab2+/-
Gab2-/-
Bcr-Abl neg.10
15
20
25
30
wh
ite b
loo
d c
ells (
PB
)
10
3 / m
m3
Bcr-Abl pos.
Gab2+/+
Gab2+/-
Gab2-/-
Bcr-Abl neg.0.0
0.2
0.4
0.6
0.8
mo
no
cyte
s (
PB
)
10
3 /
mm
3
Bcr-Abl pos.
Gab2+/+
Gab2+/-
Gab2-/-
Bcr-Abl neg.0
1
2
3
4
5
6
7
gra
nu
loc
yte
s (
PB
)
10
3 /
mm
3
Bcr-Abl pos.

Figure S2
a b
c
d e
(a) Platelet count 200 d after Tet withdrawal. Shown is a box plot including mean and SEM. (b) Body weight 200 d
after Tet withdrawal. Shown is a box plot including mean and SEM. Statistics were calculated using one-way ANOVA
with uncorrected Fisher´s LSD (c) Chloroacetoesterase staining of bone marrow sections from Bcr-Abl expressing
mice with the indicated Gab2 genotypes 200 d after Tet withdrawal. Mast cells are highlighted (red arrows). (d)
Giemsa staining of kidney sections from Bcr-Abl expressing mice with the indicated Gab2 genotypes 200 d after Tet
withdrawal. Renal parenchyma (blue arrows), renal pelvis (red arrows) and urothelium (black arrows) are highlighted.
Note the dilated renal pelvis associated with the thinning of renal parenchyma. (e) Observed hydronephrosis
phenotype in Bcr-Abl expressing mice with Gab2+/+ and Gab+/- genotypes. Kidneys (white arrows) are highlighted. (a-
e) Tetracycline was removed from the drinking water after weaning around 3 to 4 weeks after birth.
Gab2+/+ Gab2+/- Gab2-/- Bcr-Abl neg.0
400
800
1200
1600
pla
tele
ts (
PB
)
10
3 / m
m3
Bcr-Abl pos.
*******
Gab2+/+
Gab2+/-
Gab2-/-
Bcr-Abl neg.10
20
30
40
50
bo
dy w
eig
ht
[g]
**
Bcr-Abl pos.
Supplementary References
1. Wada T, Nakashima T, Oliveira-dos-Santos AJ, Gasser J, Hara H, Schett G, et al. The molecular
scaffold Gab2 is a crucial component of RANK signaling and osteoclastogenesis. Nat Med 2005 Apr;
11(4): 394-399.
2. Koschmieder S, Gottgens B, Zhang P, Iwasaki-Arai J, Akashi K, Kutok JL, et al. Inducible chronic
phase of myeloid leukemia with expansion of hematopoietic stem cells in a transgenic model of
BCR-ABL leukemogenesis. Blood 2005 Jan 1; 105(1): 324-334.
3. Mufti GJ, Flandrin G, Schaefer H-E, Sandberg AA, Kanfer EJ. An Atlas of Malignant Haematology,
vol. 1 Acute Leukaemia. CRC Press, 1996.