Supplementary Financial Information Q3 2012REVISED FROM Q3 2012 Notes to Users The financial...
42
Amy Cairncross Vice-President & Head, Investor Relations (416) 955-7803 [email protected] Karen McCarthy Director, Investor Relations (416) 955-7809 [email protected] Lynda Gauthier Director, Investor Relations (416) 955-7808 [email protected] Robert Colangelo Associate Director, Investor Relations (416) 955-2049 [email protected] Supplementary Financial Information Issued November 16, 2012 to reflect changes to business segments announced on September 11, 2012 Refer to the Table of contents for new and revised pages Q3 2012 For the period ended July 31, 2012 (UNAUDITED) For further information, please contact: www.rbc.com/investorrelations
Transcript of Supplementary Financial Information Q3 2012REVISED FROM Q3 2012 Notes to Users The financial...
Amy Cairncross Vice-President & Head, Investor Relations (416) 955-7803 [email protected]
Karen McCarthy Director, Investor Relations (416) 955-7809 [email protected]
Lynda Gauthier Director, Investor Relations (416) 955-7808 [email protected]
Robert Colangelo Associate Director, Investor Relations (416) 955-2049 [email protected]
Supplementary Financial Information
Issued November 16, 2012 to reflect changes to business segments announced on September 11, 2012Refer to the Table of contents for new and revised pages
Q3 2012
For the period ended July 31, 2012(UNAUDITED)
For further information, please contact:
www.rbc.com/investorrelations
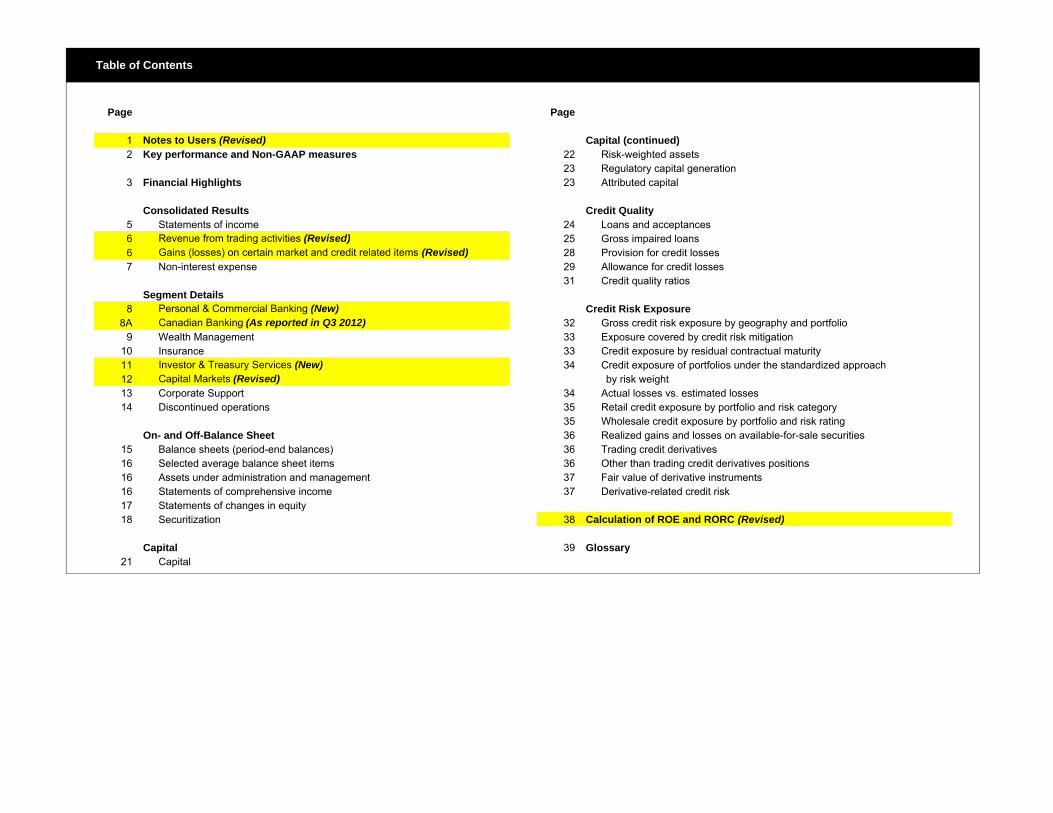
Table of Contents
Page Page
1 Notes to Users (Revised) Capital (continued)2 Key performance and Non-GAAP measures 22 Risk-weighted assets
23 Regulatory capital generation3 Financial Highlights 23 Attributed capital
Consolidated Results Credit Quality5 Statements of income 24 Loans and acceptances6 Revenue from trading activities (Revised) 25 Gross impaired loans 6 Gains (losses) on certain market and credit related items (Revised) 28 Provision for credit losses7 Non-interest expense 29 Allowance for credit losses
31 Credit quality ratiosSegment Details
8 Personal & Commercial Banking (New) Credit Risk Exposure8A Canadian Banking (As reported in Q3 2012) 32 Gross credit risk exposure by geography and portfolio
9 Wealth Management 33 Exposure covered by credit risk mitigation10 Insurance 33 Credit exposure by residual contractual maturity11 Investor & Treasury Services (New) 34 Credit exposure of portfolios under the standardized approach12 Capital Markets (Revised) by risk weight13 Corporate Support 34 Actual losses vs. estimated losses14 Discontinued operations 35 Retail credit exposure by portfolio and risk category
35 Wholesale credit exposure by portfolio and risk ratingOn- and Off-Balance Sheet 36 Realized gains and losses on available-for-sale securities
15 Balance sheets (period-end balances) 36 Trading credit derivatives16 Selected average balance sheet items 36 Other than trading credit derivatives positions16 Assets under administration and management 37 Fair value of derivative instruments16 Statements of comprehensive income 37 Derivative-related credit risk17 Statements of changes in equity 18 Securitization 38 Calculation of ROE and RORC (Revised)
Capital 39 Glossary21 Capital
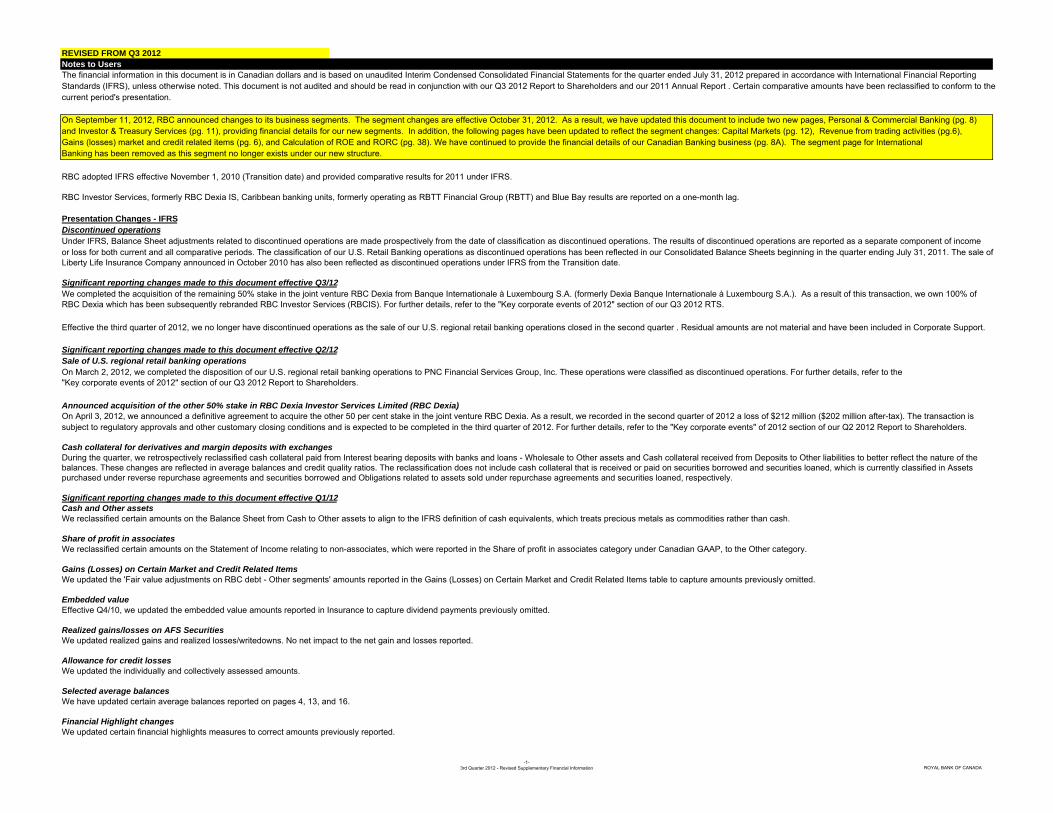
REVISED FROM Q3 2012Notes to UsersThe financial information in this document is in Canadian dollars and is based on unaudited Interim Condensed Consolidated Financial Statements for the quarter ended July 31, 2012 prepared in accordance with International Financial ReportingStandards (IFRS), unless otherwise noted. This document is not audited and should be read in conjunction with our Q3 2012 Report to Shareholders and our 2011 Annual Report . Certain comparative amounts have been reclassified to conform to thecurrent period's presentation.
On September 11, 2012, RBC announced changes to its business segments. The segment changes are effective October 31, 2012. As a result, we have updated this document to include two new pages, Personal & Commercial Banking (pg. 8)and Investor & Treasury Services (pg. 11), providing financial details for our new segments. In addition, the following pages have been updated to reflect the segment changes: Capital Markets (pg. 12), Revenue from trading activities (pg.6),Gains (losses) market and credit related items (pg. 6), and Calculation of ROE and RORC (pg. 38). We have continued to provide the financial details of our Canadian Banking business (pg. 8A). The segment page for InternationalBanking has been removed as this segment no longer exists under our new structure.
RBC adopted IFRS effective November 1, 2010 (Transition date) and provided comparative results for 2011 under IFRS.
RBC Investor Services, formerly RBC Dexia IS, Caribbean banking units, formerly operating as RBTT Financial Group (RBTT) and Blue Bay results are reported on a one-month lag.
Presentation Changes - IFRSDiscontinued operationsUnder IFRS, Balance Sheet adjustments related to discontinued operations are made prospectively from the date of classification as discontinued operations. The results of discontinued operations are reported as a separate component of incomeor loss for both current and all comparative periods. The classification of our U.S. Retail Banking operations as discontinued operations has been reflected in our Consolidated Balance Sheets beginning in the quarter ending July 31, 2011. The sale ofLiberty Life Insurance Company announced in October 2010 has also been reflected as discontinued operations under IFRS from the Transition date.
Significant reporting changes made to this document effective Q3/12We completed the acquisition of the remaining 50% stake in the joint venture RBC Dexia from Banque Internationale à Luxembourg S.A. (formerly Dexia Banque Internationale à Luxembourg S.A.). As a result of this transaction, we own 100% ofRBC Dexia which has been subsequently rebranded RBC Investor Services (RBCIS). For further details, refer to the "Key corporate events of 2012" section of our Q3 2012 RTS.
Effective the third quarter of 2012, we no longer have discontinued operations as the sale of our U.S. regional retail banking operations closed in the second quarter . Residual amounts are not material and have been included in Corporate Support.
Significant reporting changes made to this document effective Q2/12Sale of U.S. regional retail banking operationsOn March 2, 2012, we completed the disposition of our U.S. regional retail banking operations to PNC Financial Services Group, Inc. These operations were classified as discontinued operations. For further details, refer to the "Key corporate events of 2012" section of our Q3 2012 Report to Shareholders.
Announced acquisition of the other 50% stake in RBC Dexia Investor Services Limited (RBC Dexia)On April 3, 2012, we announced a definitive agreement to acquire the other 50 per cent stake in the joint venture RBC Dexia. As a result, we recorded in the second quarter of 2012 a loss of $212 million ($202 million after-tax). The transaction is subject to regulatory approvals and other customary closing conditions and is expected to be completed in the third quarter of 2012. For further details, refer to the "Key corporate events" of 2012 section of our Q2 2012 Report to Shareholders.
Cash collateral for derivatives and margin deposits with exchanges During the quarter, we retrospectively reclassified cash collateral paid from Interest bearing deposits with banks and loans - Wholesale to Other assets and Cash collateral received from Deposits to Other liabilities to better reflect the nature of thebalances. These changes are reflected in average balances and credit quality ratios. The reclassification does not include cash collateral that is received or paid on securities borrowed and securities loaned, which is currently classified in Assetspurchased under reverse repurchase agreements and securities borrowed and Obligations related to assets sold under repurchase agreements and securities loaned, respectively.
Significant reporting changes made to this document effective Q1/12Cash and Other assetsWe reclassified certain amounts on the Balance Sheet from Cash to Other assets to align to the IFRS definition of cash equivalents, which treats precious metals as commodities rather than cash.
Share of profit in associatesWe reclassified certain amounts on the Statement of Income relating to non-associates, which were reported in the Share of profit in associates category under Canadian GAAP, to the Other category.
Gains (Losses) on Certain Market and Credit Related Items We updated the 'Fair value adjustments on RBC debt - Other segments' amounts reported in the Gains (Losses) on Certain Market and Credit Related Items table to capture amounts previously omitted.
Embedded valueEffective Q4/10, we updated the embedded value amounts reported in Insurance to capture dividend payments previously omitted.
Realized gains/losses on AFS SecuritiesWe updated realized gains and realized losses/writedowns. No net impact to the net gain and losses reported.
Allowance for credit lossesWe updated the individually and collectively assessed amounts.
Selected average balancesWe have updated certain average balances reported on pages 4, 13, and 16.
Financial Highlight changesWe updated certain financial highlights measures to correct amounts previously reported.
-1-3rd Quarter 2012 - Revised Supplementary Financial Information ROYAL BANK OF CANADA
AS REPORTED IN Q3 2012Key performance and Non-GAAP measuresManagement measures and evaluates the performance of our consolidated operations and each of our segments based on a number of different measures including net income and non-GAAP measures. For details, refer to the 'How we measure and report our business segments' section in our Q3 2012 Report to Shareholders and 2011 Annual Report. Readers are cautioned that key performance measures and non-GAAP measures do not have any standardized meaning prescribed by GAAP and therefore may not be comparable to similar measures presented by other companies.
Adjusted basis measuresAdjusted basis measures such as adjusted net income available to common shareholders, adjusted diluted earnings per share (EPS) and adjusted ROE are calculated by adding back to net income the after-tax amount of amortization of other intangibles, any goodwill impairment, the dilutive impact of exchangeable shares, and significant items. These adjusting charges exclude the amortization of computer software intangibles.
Attributed capital (Economic capital)An estimate of the amount of equity capital required to underpin risks. It is calculated by estimating the level of capital that is necessary to support our various businesses, given their risks, consistentwith our desired solvency standard and credit ratings.
Economic profit Economic profit is net income (loss) after non-controlling interests excluding the after-tax effect of amortization of other intangibles, less a capital charge for use of attributed capital.
Return on equity (ROE)Business segment return on equity is calculated as net income available to common shareholders divided by Average attributed capital for the period and using methods that are intended to approximate the averageof the daily balances for the period. Corporate Support also includes average unattributed capital.
Return on risk capital (RORC)Net income available to common shareholders divided by average risk capital. Business segment RORC is calculated as net income available to common shareholders divided by average risk capital for the period.
Risk capitalRisk capital includes credit, market (trading and non-trading), insurance-specific, operational, business and fixed assets risk capital.
Unattributed capitalUnattributed capital represents common equity in excess of common equity attributed to our business segments and is reported in the Corporate Support segment.
-2-3rd Quarter 2012 - Revised Supplementary Financial Information ROYAL BANK OF CANADA

AS REPORTED IN Q3 2012FINANCIAL HIGHLIGHTS IFRS IFRS(Millions of Canadian dollars, except percentage and per share amounts) Q3/12 Q2/12 Q1/12 Q4/11 Q3/11 Q2/11 Q1/11 2012 2011 2010 2009
9 months
SELECTED INCOME STATEMENT INFORMATION 3,289 3,031 3,003 2,957 2,889 2,716 2,795 9,323 11,357 10,338 10,705 4,467 3,893 4,571 3,735 4,008 4,115 4,423 12,931 16,281 15,744 15,736
Total revenue 7,756 6,924 7,574 6,692 6,897 6,831 7,218 22,254 27,638 26,082 26,441 Provision for credit losses (PCL) 324 348 267 276 320 273 264 939 1,133 1,240 2,167 Insurance policyholder benefits, claims and acquisition expense 1,000 640 1,211 867 1,081 843 567 2,851 3,358 3,546 3,042 Non-interest expense (NIE) 3,759 3,857 3,671 3,530 3,417 3,551 3,669 11,287 14,167 13,469 13,436 Net income from continuing operations 2,240 1,563 1,876 1,609 1,683 1,682 1,996 5,679 6,970 n.a. n.a.Net income from continuing operations - CGAAP n.a. n.a. n.a. n.a. n.a. n.a. n.a. n.a. n.a. 5,732 5,681 Net loss from discontinued operations - (30) (21) (38) (389) (51) (48) (51) (526) (509) (1,823) Net income 2,240 1,533 1,855 1,571 1,294 1,631 1,948 5,628 6,444 5,223 3,858
(24) (25) (25) (25) (25) (25) (26) (74) (101) n.a. n.a.Preferred dividends (64) (65) (64) (65) (64) (64) (65) (193) (258) (258) (233)
Net income available to common shareholders 2,152 1,443 1,766 1,481 1,205 1,542 1,857 5,361 6,085 4,965 3,625 Add: Dilutive impact of exchangeable shares 14 13 13 13 20 22 23 40 78 n.a. n.a.Net income available to common shareholders including dilutive impact of exchangeable shares 2,166 1,456 1,779 1,494 1,225 1,564 1,880 5,401 6,163 n.a. n.a.
PROFITABILITY MEASURESCONSOLIDATEDEarnings per share (EPS) - basic $1.49 $1.00 $1.23 $1.03 $0.84 $1.08 $1.30 $3.72 $4.25 $3.49 $2.59
$1.47 $0.99 $1.22 $1.02 $0.83 $1.06 $1.27 $3.68 $4.19 $3.46 $2.57Return on common equity (ROE) 22.7 % 16.1 % 19.7 % 17.1 % 14.5% 19.9% 23.7% 19.6% 18.7 % 14.9% 11.9%Return on risk capital (RORC) 35.1 % 24.2 % 27.5 % 24.2 % 22.4% 31.3% 37.5% 29.0% 28.4 % 25.4% 19.5%Return on assets 1.09 % 0.79 % 0.91 % 0.76 % 0.67 % 0.88% 1.01% 0.93% 0.83 % 0.76% 0.55%Return on risk-weighted assets (RWA) 3.20 % 2.33 % 2.58 % 2.29 % 1.93 % 2.60% 2.98% 2.71% 2.44 % 2.03% 1.50%
CONTINUING OPERATIONS
$1.49 $1.02 $1.24 $1.06 $1.11 $1.12 $1.34 $3.75 $4.62 $3.85 $3.90$1.47 $1.01 $1.23 $1.05 $1.10 $1.10 $1.31 $3.71 $4.55 $3.82 $3.86
Return on common equity (ROE) 22.7 % 16.5 % 20.0 % 17.5 % 19.2% 20.5% 24.4% 19.7% 20.3 % 16.5% 17.9%Return on risk capital (RORC) 35.1 % 25.1 % 29.3 % 26.3% 32.1% 35.8% 43.1% 29.9% 33.7 % 31.5% 33.2%Return on assets 1.09 % 0.82 % 0.95 % 0.80% 0.90% 0.95% 1.08% 0.95% 0.93 % 0.88% 0.87%Efficiency ratio 48.5% 55.7% 48.5% 52.7% 49.5% 52.0% 50.8% 50.7% 51.3% 51.6% 50.8%
KEY RATIOSDiluted EPS growth 1 33.6 % (8.2)% (6.1)% n.a. n.a. n.a. n.a. 6.0 % n.a. (1.0)% n.a.Revenue growth 1 12.5 % 1.4 % 4.9 % n.a. n.a. n.a. n.a. 6.0 % n.a. (1.4)% n.a.NIE growth 1, 2 10.0 % 8.6 % 0.1 % n.a. n.a. n.a. n.a. 6.0 % n.a. 0.2 % n.a.PCL on impaired loans as a % of Average net loans and acceptances 0.34 % 0.39 % 0.30 % 0.31 % 0.37 % 0.34 % 0.32 % 0.34 % 0.33 % 0.40 % 0.72 %Net interest margin (total average assets) 1.61 % 1.58 % 1.52 % 1.47 % 1.55 % 1.53% 1.52 % 1.57 % 1.52 % 1.59 % 1.64 %Net interest margin (total average assets)
excluding Trading Assets, Trading NII and Insurance Assets 2.43 % 2.28 % 2.26 % 2.29 % 2.34% 2.34 % 2.39 % 2.32 % 2.34 % 2.45 % 2.32 %Non-interest income as % of total revenue 57.6 % 56.2 % 60.4 % 55.8 % 58.1 % 60.2 % 61.3 % 58.1 % 58.9 % 60.4 % 59.5 %Effective tax rate 16.2 % 24.8 % 22.6 % 20.3 % 19.0 % 22.3 % 26.6 % 20.9 % 22.4 % 25.5 % 25.8 %
SHARE INFORMATIONCommon shares outstanding (000s) 3 - end of period 1,444,300 1,442,843 1,440,857 1,438,376 1,436,757 1,428,830 1,425,901 1,444,300 1,438,376 1,424,922 1,417,610
1,443,457 1,441,761 1,439,252 1,437,023 1,435,131 1,426,504 1,424,094 1,441,488 1,430,772 1,420,719 1,398,675 1,469,513 1,467,063 1,467,527 1,465,927 1,474,261 1,472,344 1,473,955 1,467,964 1,471,493 1,433,754 1,412,126
Treasury shares held - preferred (000s) 63 31 (4) 6 (50) 67 60 63 6 86 65 (261) 382 (295) (146) 1,379 230 1,305 (261) (146) 1,719 2,127
Stock options outstanding (000s) 13,306 13,531 14,421 14,413 14,917 15,584 16,945 13,306 14,413 15,659 17,877 Stock options exercisable (000s) 7,546 7,734 8,557 8,688 9,175 9,783 11,124 7,546 8,688 10,170 12,806 Dividends declared per common share 0.57$ 0.57$ 0.54$ 0.54$ 0.54$ 0.50$ 0.50$ 1.68$ 2.08$ 2.00$ 2.00$ Dividend yield 4.3% 4.1% 4.4% 4.5% 3.9% 3.5% 3.7% 4.4% 3.9% 3.6% 4.8%Dividend payout ratio from continuing operations 38% 56% 44% 51% 49% 45% 37% 45% 45% 52% 52%Common dividends - 824 822 778 777 776 713 713 2,424 2,979 2,843 2,819 Preferred dividends - 64 65 64 65 64 64 65 193 258 258 233 Book value per share 26.56$ 25.38$ 25.09$ 24.25$ 23.28$ 22.53$ 22.22$ 26.56$ 24.25$ 23.99$ 22.67$ Common share price (RY on TSX) - High 57.09$ 59.13$ 54.87$ 52.06$ 60.25$ 61.53$ 56.32$ 59.13$ 61.53$ 62.89$ 58.50$
48.70$ 52.45$ 43.30$ 44.38$ 50.94$ 53.77$ 50.78$ 43.30$ 44.38$ 48.85$ 25.52$ 51.38$ 57.09$ 52.37$ 48.62$ 51.40$ 59.60$ 53.68$ 51.38$ 48.62$ 54.39$ 54.80$
Market capitalization (TSX) 74,208 82,372 75,458 69,934 73,849 85,158 76,542 74,208 69,934 77,502 77,685 Market price to book value 1.93 2.25 2.09 2.00 2.21 2.65 2.42 1.93 2.00 2.27 2.42
1 Growth rates are calculated based on earnings from continuing operations in the same period a year ago.2 Q2 2012 includes the goodwill and intangibles writedown of $161 million (before- and after- tax) as well as the other acquisition costs of $15 million (before- and after-tax) related to our previously announced acquisition of RBC Dexia. Excluding these items, NIE growth was 3.7%. 3 Common shares outstanding at the end of the period does not include treasury shares held. Average common shares outstanding does not include treasury shares held.
- diluted
Earnings per share (EPS) - basic - diluted
Non-interest incomeNet interest income
Less: Non-controlling interest
CGAAPIFRS
- average (basic) - average (diluted)
- Low - Close, end of period
- common (000s)
-3-3rd Quarter 2012 - Revised Supplementary Financial Information ROYAL BANK OF CANADA

AS REPORTED IN Q3 2012FINANCIAL HIGHLIGHTS continued IFRS(Millions of Canadian dollars, except percentage and per share amounts or otherwise noted) Q3/12 Q2/12 Q1/12 Q4/11 Q3/11 Q2/11 Q1/11 2012 2011 2010 2009
9 months
CAPITAL MEASURES - CONSOLIDATEDTier 1 capital ratio 13.0% 13.2% 12.2% 13.3% 13.2% 13.6% 13.2% 13.0% 13.3% 13.0% 13.0%Total capital ratio 15.0% 15.2% 14.5% 15.3% 15.2% 15.7% 15.3% 15.0% 15.3% 14.4% 14.2%Assets-to-capital multiple 16.7X 16.8X 16.6X 16.1X 16.4X 16.3X 16.5X 16.7X 16.1X 16.5X 16.3XTier 1 common ratio 10.3% 10.4% 9.6% 10.6% 10.3% 10.3% 9.9% 10.3% 10.6% 9.8% 9.2%Risk-weighted assets ($ billions) 278.4 267.1 285.5 267.8 261.0 253.2 256.0 278.4 267.8 260.5 244.8 Gross-adjusted assets ($ billions) 729.0 714.6 717.5 684.6 675.0 673.4 668.0 729.0 684.6 647.5 591.1
IFRS IFRSQ3/12 Q2/12 Q1/12 Q4/11 Q3/11 Q2/11 Q1/11 2012 2011 2010 2009
9 months
SELECTED BALANCE SHEET INFORMATIONAverage loans and acceptances 1 377,700 366,300 359,300 352,000 339,000 349,100 347,200 367,700 346,900 272,700 264,400 Total assets 824,394 800,371 815,016 793,833 772,141 768,249 761,972 824,394 793,833 726,206 654,989 Average assets 815,000 787,800 814,500 823,700 767,600 759,000 764,600 805,900 778,900 683,000 695,300 Average earning assets 1 643,400 629,900 618,800 623,800 612,500 625,200 622,200 630,700 620,900 518,900 489,300 Deposits 1 502,804 495,875 489,827 479,102 473,767 478,508 477,789 502,804 479,102 414,561 378,457 Common equity 38,357 36,625 36,159 34,889 33,419 32,190 31,651 38,357 34,889 34,140 32,095 Average common equity 37,700 36,400 35,600 34,400 33,050 31,850 31,000 36,600 32,600 33,250 30,450
MARKET RISK MEASURES - NON TRADING BANKING ACTIVITIESBefore-tax impact of 1% increase in rates on:
Net interest income risk 2 329 340 331 307 191 204 122 329 307 93 339 Economic value of equity (529) (463) (383) (454) (417) (290) (394) (529) (454) (484) (230)
Before-tax impact of 1% decrease in rates on:Net interest income risk 2 (240) (212) (173) (161) (158) (203) (147) (240) (161) (98) (112) Economic value of equity 426 374 351 412 344 211 309 426 412 425 214
OTHER INFORMATION Number of employees (full-time equivalent)
Canada 52,835 50,264 50,197 50,219 50,830 50,430 50,808 52,835 50,219 49,792 48,793 US 7,752 7,298 7,413 7,588 7,650 7,463 7,480 7,752 7,588 7,449 7,409 Other 14,552 10,639 10,727 10,673 10,585 10,347 10,083 14,552 10,673 9,906 9,778
Total 75,139 68,201 68,337 68,480 69,065 68,240 68,371 75,139 68,480 67,147 65,980
Number of banking branches Canada 1,232 1,227 1,221 1,214 1,211 1,212 1,210 1,232 1,214 1,209 1,197 Other 123 124 124 124 124 124 130 123 124 127 126
Total 1,355 1,351 1,345 1,338 1,335 1,336 1,340 1,355 1,338 1,336 1,323
Number of automated teller machines (ATM) 4,948 4,819 4,704 4,626 4,610 4,591 4,571 4,948 4,626 4,557 4,544
ADJUSTED BASIS MEASURES - Continuing Ops Net income available to common shareholders including dilutive impact of exchangeable shares 2,166 1,456 1,779 1,494 1,225 1,564 1,880 5,401 6,163 4,965 3,625 Less: Net loss from discontinued operations - (30) (21) (38) (389) (51) (48) (51) (526) (509) (1,823) Net income available to common shareholders from continuing operations
including dilutive impact of exchangeable shares 2,166 1,486 1,800 1,532 1,614 1,615 1,928 5,452 6,689 5,474 5,448
AdjustmentsAdd: After-tax effect of amortization of other intangibles 29 28 29 31 32 31 29 86 123 127 141 Loss on announced acquisition of RBC Dexia Investor Services Limited 11 202 - - - - - 213 - - - Release of tax uncertainty provisions (181) - - - - - - (181) - - - Mortgage prepayment interest (92) - - - - - - (92) - - - Adjusted net income available to common shareholders 1,933 1,716 1,829 1,563 1,646 1,646 1,957 5,478 6,812 5,601 5,589
Adjusted EPS 1.33$ 1.18$ 1.26$ 1.08$ 1.13$ 1.14$ 1.36$ 3.77$ 4.71$ 3.94$ 4.00$ Adjusted diluted EPS 1.31$ 1.17$ 1.25$ 1.07$ 1.12$ 1.12$ 1.33$ 3.73$ 4.63$ 3.91$ 3.96$ Adjusted ROE 20.2% 19.0% 20.3% 17.9% 19.5% 20.9% 24.8% 19.8% 20.7% 16.9% 18.4%
ECONOMIC PROFIT - Continuing OpsNet income from continuing operations 2,240 1,563 1,876 1,609 1,683 1,682 1,996 5,679 6,970 5,732 5,681
Non-controlling interests (24) (25) (25) (25) (25) (25) (26) (74) (101) n.a. n.a.After-tax effect of amortization of other intangibles 29 28 29 31 32 31 29 86 123 127 141 Goodwill and intangibles writedown 7 161 - - - - - 168 - - - Capital Charge (966) (904) (882) (893) (824) (749) (747) (2,752) (3,213) (3,318) (3,046)
Economic Profit 1,286 823 998 722 866 939 1,252 3,107 3,779 2,541 2,776
1 The classification of our U.S. Retail Banking operations as discontinued operations will be reflected in our Consolidated Balance Sheets beginning in the quarter ending July 31, 2011 The sale of Liberty Life Insurance Company announced in October 2010 will be reflected as discontinued operations under IFRS from the Transition date.
2 Amounts represent the 12-month Net interest income exposure to an instantaneous and sustained shift in interest rates
IFRS
CGAAP
CGAAP
CGAAPIFRS
-4-3rd Quarter 2012 - Revised Supplementary Financial Information ROYAL BANK OF CANADA
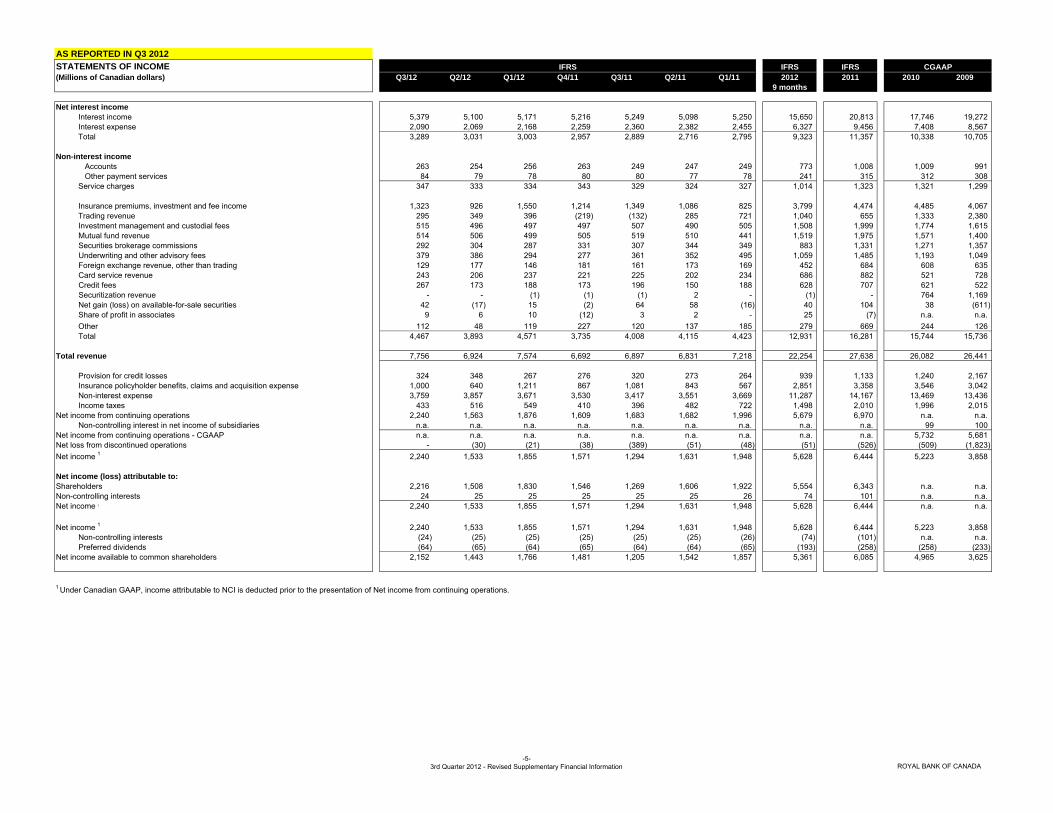
AS REPORTED IN Q3 2012STATEMENTS OF INCOME IFRS IFRS(Millions of Canadian dollars) Q3/12 Q2/12 Q1/12 Q4/11 Q3/11 Q2/11 Q1/11 2012 2011 2010 2009
9 months
Net interest income Interest income 5,379 5,100 5,171 5,216 5,249 5,098 5,250 15,650 20,813 17,746 19,272 Interest expense 2,090 2,069 2,168 2,259 2,360 2,382 2,455 6,327 9,456 7,408 8,567 Total 3,289 3,031 3,003 2,957 2,889 2,716 2,795 9,323 11,357 10,338 10,705
Non-interest income Accounts 263 254 256 263 249 247 249 773 1,008 1,009 991 Other payment services 84 79 78 80 80 77 78 241 315 312 308 Service charges 347 333 334 343 329 324 327 1,014 1,323 1,321 1,299
Insurance premiums, investment and fee income 1,323 926 1,550 1,214 1,349 1,086 825 3,799 4,474 4,485 4,067 Trading revenue 295 349 396 (219) (132) 285 721 1,040 655 1,333 2,380 Investment management and custodial fees 515 496 497 497 507 490 505 1,508 1,999 1,774 1,615 Mutual fund revenue 514 506 499 505 519 510 441 1,519 1,975 1,571 1,400 Securities brokerage commissions 292 304 287 331 307 344 349 883 1,331 1,271 1,357 Underwriting and other advisory fees 379 386 294 277 361 352 495 1,059 1,485 1,193 1,049 Foreign exchange revenue, other than trading 129 177 146 181 161 173 169 452 684 608 635 Card service revenue 243 206 237 221 225 202 234 686 882 521 728 Credit fees 267 173 188 173 196 150 188 628 707 621 522 Securitization revenue - - (1) (1) (1) 2 - (1) - 764 1,169 Net gain (loss) on available-for-sale securities 42 (17) 15 (2) 64 58 (16) 40 104 38 (611) Share of profit in associates 9 6 10 (12) 3 2 - 25 (7) n.a. n.a.Other 112 48 119 227 120 137 185 279 669 244 126 Total 4,467 3,893 4,571 3,735 4,008 4,115 4,423 12,931 16,281 15,744 15,736
Total revenue 7,756 6,924 7,574 6,692 6,897 6,831 7,218 22,254 27,638 26,082 26,441
Provision for credit losses 324 348 267 276 320 273 264 939 1,133 1,240 2,167 Insurance policyholder benefits, claims and acquisition expense 1,000 640 1,211 867 1,081 843 567 2,851 3,358 3,546 3,042 Non-interest expense 3,759 3,857 3,671 3,530 3,417 3,551 3,669 11,287 14,167 13,469 13,436 Income taxes 433 516 549 410 396 482 722 1,498 2,010 1,996 2,015
Net income from continuing operations 2,240 1,563 1,876 1,609 1,683 1,682 1,996 5,679 6,970 n.a. n.a.Non-controlling interest in net income of subsidiaries n.a. n.a. n.a. n.a. n.a. n.a. n.a. n.a. n.a. 99 100
Net income from continuing operations - CGAAP n.a. n.a. n.a. n.a. n.a. n.a. n.a. n.a. n.a. 5,732 5,681 Net loss from discontinued operations - (30) (21) (38) (389) (51) (48) (51) (526) (509) (1,823) Net income 1 2,240 1,533 1,855 1,571 1,294 1,631 1,948 5,628 6,444 5,223 3,858
Net income (loss) attributable to:Shareholders 2,216 1,508 1,830 1,546 1,269 1,606 1,922 5,554 6,343 n.a. n.a.Non-controlling interests 24 25 25 25 25 25 26 74 101 n.a. n.a.Net income 1 2,240 1,533 1,855 1,571 1,294 1,631 1,948 5,628 6,444 n.a. n.a.
Net income 1 2,240 1,533 1,855 1,571 1,294 1,631 1,948 5,628 6,444 5,223 3,858 Non-controlling interests (24) (25) (25) (25) (25) (25) (26) (74) (101) n.a. n.a.Preferred dividends (64) (65) (64) (65) (64) (64) (65) (193) (258) (258) (233)
Net income available to common shareholders 2,152 1,443 1,766 1,481 1,205 1,542 1,857 5,361 6,085 4,965 3,625
1 Under Canadian GAAP, income attributable to NCI is deducted prior to the presentation of Net income from continuing operations.
CGAAPIFRS
-5-3rd Quarter 2012 - Revised Supplementary Financial Information ROYAL BANK OF CANADA
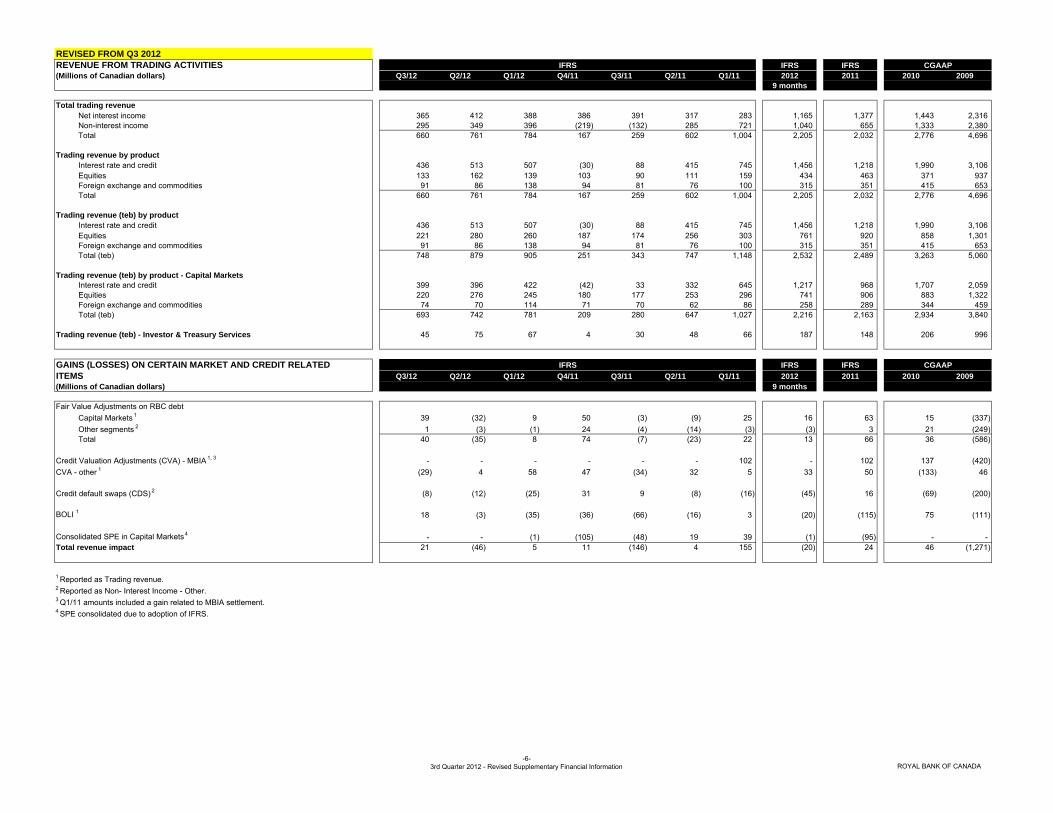
REVISED FROM Q3 2012REVENUE FROM TRADING ACTIVITIES IFRS IFRS(Millions of Canadian dollars) Q3/12 Q2/12 Q1/12 Q4/11 Q3/11 Q2/11 Q1/11 2012 2011 2010 2009
9 months
Total trading revenueNet interest income 365 412 388 386 391 317 283 1,165 1,377 1,443 2,316 Non-interest income 295 349 396 (219) (132) 285 721 1,040 655 1,333 2,380 Total 660 761 784 167 259 602 1,004 2,205 2,032 2,776 4,696
Trading revenue by productInterest rate and credit 436 513 507 (30) 88 415 745 1,456 1,218 1,990 3,106 Equities 133 162 139 103 90 111 159 434 463 371 937 Foreign exchange and commodities 91 86 138 94 81 76 100 315 351 415 653 Total 660 761 784 167 259 602 1,004 2,205 2,032 2,776 4,696
Trading revenue (teb) by productInterest rate and credit 436 513 507 (30) 88 415 745 1,456 1,218 1,990 3,106 Equities 221 280 260 187 174 256 303 761 920 858 1,301 Foreign exchange and commodities 91 86 138 94 81 76 100 315 351 415 653 Total (teb) 748 879 905 251 343 747 1,148 2,532 2,489 3,263 5,060
Trading revenue (teb) by product - Capital MarketsInterest rate and credit 399 396 422 (42) 33 332 645 1,217 968 1,707 2,059 Equities 220 276 245 180 177 253 296 741 906 883 1,322 Foreign exchange and commodities 74 70 114 71 70 62 86 258 289 344 459 Total (teb) 693 742 781 209 280 647 1,027 2,216 2,163 2,934 3,840
Trading revenue (teb) - Investor & Treasury Services 45 75 67 4 30 48 66 187 148 206 996
GAINS (LOSSES) ON CERTAIN MARKET AND CREDIT RELATED IFRS IFRSITEMS Q3/12 Q2/12 Q1/12 Q4/11 Q3/11 Q2/11 Q1/11 2012 2011 2010 2009(Millions of Canadian dollars) 9 months
Fair Value Adjustments on RBC debtCapital Markets 1 39 (32) 9 50 (3) (9) 25 16 63 15 (337) Other segments 2 1 (3) (1) 24 (4) (14) (3) (3) 3 21 (249) Total 40 (35) 8 74 (7) (23) 22 13 66 36 (586)
Credit Valuation Adjustments (CVA) - MBIA 1, 3 - - - - - - 102 - 102 137 (420) CVA - other 1 (29) 4 58 47 (34) 32 5 33 50 (133) 46
Credit default swaps (CDS) 2 (8) (12) (25) 31 9 (8) (16) (45) 16 (69) (200)
BOLI 1 18 (3) (35) (36) (66) (16) 3 (20) (115) 75 (111)
Consolidated SPE in Capital Markets 4 - - (1) (105) (48) 19 39 (1) (95) - - Total revenue impact 21 (46) 5 11 (146) 4 155 (20) 24 46 (1,271)
1 Reported as Trading revenue.2 Reported as Non- Interest Income - Other.3 Q1/11 amounts included a gain related to MBIA settlement.4 SPE consolidated due to adoption of IFRS.
CGAAP
CGAAP
IFRS
IFRS
-6-3rd Quarter 2012 - Revised Supplementary Financial Information ROYAL BANK OF CANADA

AS REPORTED IN Q3 2012NON-INTEREST EXPENSE IFRS IFRS(Millions of Canadian dollars) Q3/12 Q2/12 Q1/12 Q4/11 Q3/11 Q2/11 Q1/11 2012 2011 2010 2009
9 months
Human resourcesSalaries 1,077 1,044 1,060 1,060 1,025 990 999 3,181 4,074 3,777 3,817 Variable compensation 907 948 911 684 699 872 1,045 2,766 3,300 3,335 3,505 Benefits and retention compensation 281 297 311 276 257 275 291 889 1,099 1,132 1,085 Stock-based compensation 1 48 24 47 12 48 46 82 119 188 186 73 Total Human resources 2,313 2,313 2,329 2,032 2,029 2,183 2,417 6,955 8,661 8,430 8,480
EquipmentDepreciation 65 62 63 62 58 62 59 190 241 238 232 Computer rental and maintenance 202 194 190 197 185 186 180 586 748 686 703 Office equipment rental and maintenance 4 5 5 5 6 6 4 14 21 20 23 Total Equipment 271 261 258 264 249 254 243 790 1,010 944 958
OccupancyPremises rent 122 117 115 103 111 109 106 354 429 404 389 Premises repairs and maintenance 86 89 83 98 82 85 79 258 344 308 321 Depreciation 40 38 38 40 38 35 33 116 146 143 121 Property taxes 33 30 28 27 30 28 22 91 107 105 103 Total Occupancy 281 274 264 268 261 257 240 819 1,026 960 934
CommunicationsTelecommunications 47 45 45 46 45 43 40 137 174 176 185 Postage and courier 24 28 26 23 25 28 26 78 102 99 98 Marketing and public relations 96 93 81 111 104 89 71 270 375 372 307 Stationery and printing 26 19 25 23 20 28 24 70 95 103 96 Total Communications 193 185 177 203 194 188 161 555 746 750 686
Professional fees 167 158 154 213 159 157 163 479 692 572 484
Outsourced item processing 64 70 65 64 63 73 66 199 266 278 283
Amortization of other intangibles Computer software 96 92 94 87 85 82 78 282 332 295 236 Other 34 35 35 39 38 38 34 104 149 145 157 Total Amortization of other intangibles 130 127 129 126 123 120 112 386 481 440 393
7 161 - - - - - 168 - - -
OtherBusiness and capital taxes 19 37 25 22 26 24 21 81 93 142 175 Travel and relocation 39 38 36 44 44 37 35 113 160 143 133 Employee training 9 8 8 13 9 9 8 25 39 32 34 Donations 16 13 11 22 13 12 12 40 59 55 52 Other 250 212 215 259 247 237 191 677 934 723 824 Total Other 333 308 295 360 339 319 267 936 1,285 1,095 1,218
Total non-interest expense 3,759 3,857 3,671 3,530 3,417 3,551 3,669 11,287 14,167 13,469 13,436
1 Stock-based compensation includes the cost of stock options, stock appreciation rights, performance deferred shares, deferred compensation plans and the impact of related economic hedges. 2 As a result of our announced acquisition of the other 50 percent interest in RBC Dexia Investor Services Limited, that we did not already own, we were required to revalue our existing 50 percent interest in the joint venture. This revaluation resulted in a total writedown of $168 million (before- and after-tax) of goodwill and intangibles.
Impairment of goodwill and other intangibles 2
CGAAPIFRS
-7-3rd Quarter 2012 - Revised Supplementary Financial Information ROYAL BANK OF CANADA

NEW PAGEPERSONAL & COMMERCIAL BANKING 1 IFRS IFRS(Millions of Canadian dollars, except percentage amounts) Q3/12 Q2/12 Q1/12 Q4/11 Q3/11 Q2/11 Q1/11 2012 2011 2010 2009
9 months
Income StatementNet interest income 2,391 2,165 2,203 2,176 2,131 2,065 2,143 6,759 8,515 8,095 7,596 Non-interest income 909 863 883 872 868 878 892 2,655 3,510 3,306 3,111 Total revenue 3,300 3,028 3,086 3,048 2,999 2,943 3,035 9,414 12,025 11,401 10,707 Provision for credit losses (PCL) 300 318 251 270 311 275 286 869 1,142 1,333 1,346 Non-interest expense 1,508 1,444 1,454 1,469 1,443 1,394 1,376 4,406 5,682 5,600 5,350 Income taxes 390 326 369 362 363 350 386 1,085 1,461 1,366 1,252 Non-controlling interest in net income of subsidiaries n.a. n.a. n.a. n.a. n.a. n.a. n.a. n.a. n.a. 3 6 Net income 2 1,102 940 1,012 947 882 924 987 3,054 3,740 3,099 2,753
Total revenue by businessPersonal Financial Services 1,768 1,568 1,575 1,571 1,547 1,522 1,552 4,911 6,192 5,760 5,305 Business Financial Services 736 695 721 708 696 663 683 2,152 2,750 2,557 2,457 Cards and Payment Solutions 589 554 589 572 558 560 567 1,732 2,257 2,238 2,128
Canadian Banking 3,093 2,817 2,885 2,851 2,801 2,745 2,802 8,795 11,199 10,555 9,890 Caribbean & U.S. Banking 3 207 211 201 197 198 198 233 619 826 846 817 Total 3,300 3,028 3,086 3,048 2,999 2,943 3,035 9,414 12,025 11,401 10,707
Financial ratiosReturn on equity (ROE) 4 34.2% 29.1% 30.0% 26.9% 28.7% 33.2% 35.9% 31.1% 30.9% 28.0% 27.1%Return on risk capital (RORC) 49.2% 41.3% 42.4% 37.5% 41.8% 49.6% 55.0% 44.2% 45.1% 42.9% 44.0%Net interest margin (average earning assets) 2.97% 2.82% 2.84% 2.84% 2.84% 2.88% 2.90% 2.88% 2.86% 2.86% 2.88%Efficiency ratio 45.7% 47.7% 47.1% 48.2% 48.1% 47.4% 45.3% 46.8% 47.3% 49.1% 50.0%Operating leverage 5.5 % (0.7)% (4.0)% n.a. n.a. n.a. n.a. 0.3 % n.a. 1.8% n.a
Average balances Total assets 335,200 327,500 322,600 318,400 311,200 306,600 306,100 328,400 310,700 295,200 275,500 Total earning assets 319,800 312,200 308,600 304,500 297,800 293,700 292,800 313,500 297,200 283,000 263,800 Loans and acceptances 318,000 311,700 308,300 303,500 296,300 290,900 288,300 312,700 294,800 277,900 258,700 Deposits 245,800 240,600 239,200 233,300 223,600 214,300 213,300 241,800 221,200 203,600 189,000 Attributed capital 12,550 12,850 13,050 13,550 11,850 11,100 10,600 12,800 11,800 10,800 9,850 Risk capital 8,700 9,050 9,250 9,750 8,150 7,450 6,950 9,000 8,050 7,050 6,100
Credit quality Gross impaired loans / Average net loans and acceptances 0.59% 0.66% 0.68% 0.68% 0.69% 0.70% 0.72% 0.60% 0.70% 0.77% 1.70%PCL / Average net loans and acceptances 0.38% 0.41% 0.32% 0.35% 0.42% 0.39% 0.39% 0.37% 0.39% 0.48% 0.52%Net write-offs / Average net loans and acceptances 0.36% 0.34% 0.30% 0.37% 0.37% 0.39% 0.42% 0.34% 0.38% 0.67% 0.78%
Business informationAssets under administration 5 173,600 172,300 169,400 165,900 165,800 168,300 162,100 173,600 165,900 156,000 141,500 Assets under management 2,900 2,700 2,800 2,700 2,600 2,600 2,600 2,900 2,700 2,600 3,800
Other earnings measuresNet income 1,102 940 1,012 947 882 924 987 3,054 3,740 3,099 2,753 Non-controlling interests (1) - (2) - (1) (1) (1) (3) (3) n.a. n.a.Add: After-tax effect of amortization of other intangibles 4 5 4 3 6 4 3 13 16 42 49 Cash net income 1,105 945 1,014 950 887 927 989 3,064 3,753 3,141 2,802 Less: Capital charge 326 325 338 369 325 292 289 989 1,275 1,219 1,135 Economic profit 779 620 676 581 562 635 700 2,075 2,478 1,922 1,667
1 Reported results include securitized residential mortgage and credit card loans and related amounts for income and provision for credit losses. As at Q3/12, the average securitized residential mortgage and credit card loans included were$46.1 billion and $6.1 billion, respectively. Securitized residential mortgages and credit card loans are included in Total assets, Total earning assets, Loans and acceptances, Residential mortgage, Credit cards. Under IFRS, thesetransactions are being reported on our balance sheet.
3 Includes RBTT Financial Group (RBTT). Results are reported on a one-month- lag.
5 RBC AUA includes $37.9 billion (April 30, 2012 - $36.5 billion, July 31, 2011 - $34.7 billion) of securitized mortgages and credit card loans.Canadian Banking and an increase in attributed capital for Capital Markets.
CGAAPIFRS
2 Q3/12 results include a favourable mortgage prepayment adjustment of $125 million ($92 million after-tax). Q2/11 includes a gain on the sale of the remaining VISA shares of $29 million ($21 million after-tax).
4 Effective Q1/12, we prospectively revised our capital allocation methodology to further align our allocation processes with evolving regulatory capital requirements. The revised methodology replaced the pro-rata allocation of unallocated capital that was used in 2011 and the impacts are being phased-in over fiscal 2012 in anticipation of our requirement to report under Basel III requirements in 2013. The revised methodology resulted in a reduction in attributed capital for
-8-3rd Quarter 2012 - Revised Supplementary Financial Information ROYAL BANK OF CANADA
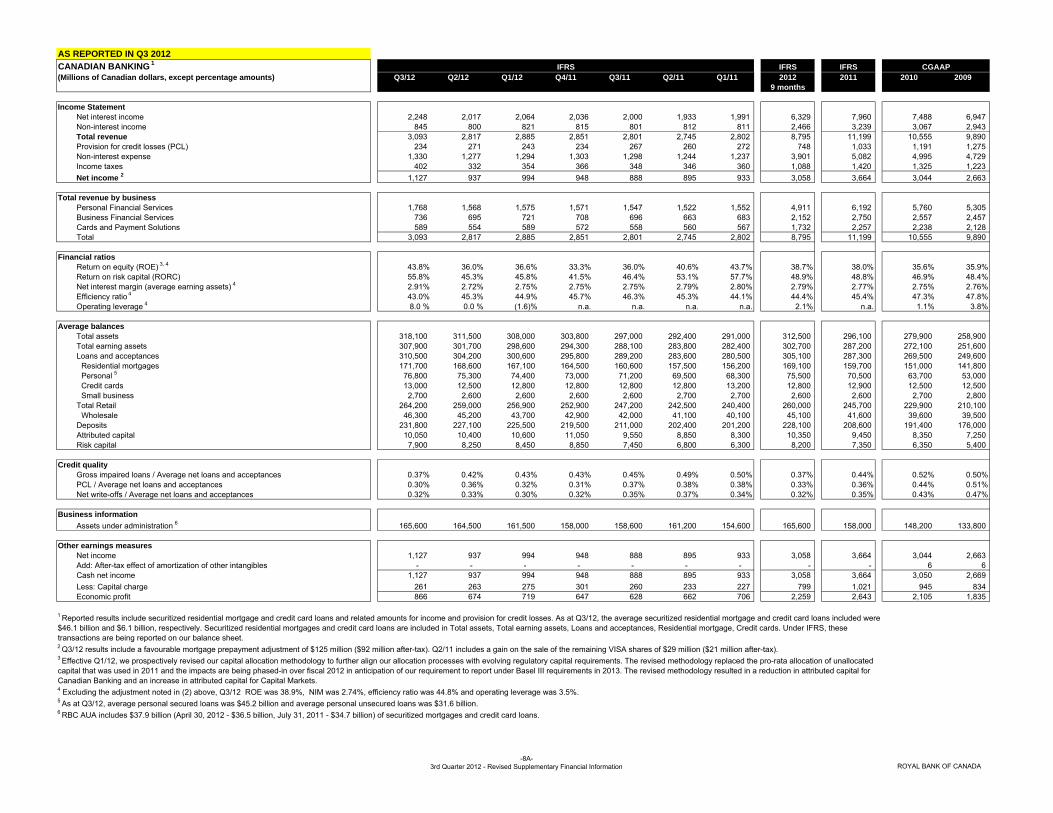
AS REPORTED IN Q3 2012CANADIAN BANKING 1 IFRS IFRS(Millions of Canadian dollars, except percentage amounts) Q3/12 Q2/12 Q1/12 Q4/11 Q3/11 Q2/11 Q1/11 2012 2011 2010 2009
9 months
Income StatementNet interest income 2,248 2,017 2,064 2,036 2,000 1,933 1,991 6,329 7,960 7,488 6,947 Non-interest income 845 800 821 815 801 812 811 2,466 3,239 3,067 2,943 Total revenue 3,093 2,817 2,885 2,851 2,801 2,745 2,802 8,795 11,199 10,555 9,890 Provision for credit losses (PCL) 234 271 243 234 267 260 272 748 1,033 1,191 1,275 Non-interest expense 1,330 1,277 1,294 1,303 1,298 1,244 1,237 3,901 5,082 4,995 4,729 Income taxes 402 332 354 366 348 346 360 1,088 1,420 1,325 1,223 Net income 2 1,127 937 994 948 888 895 933 3,058 3,664 3,044 2,663
Total revenue by businessPersonal Financial Services 1,768 1,568 1,575 1,571 1,547 1,522 1,552 4,911 6,192 5,760 5,305 Business Financial Services 736 695 721 708 696 663 683 2,152 2,750 2,557 2,457 Cards and Payment Solutions 589 554 589 572 558 560 567 1,732 2,257 2,238 2,128 Total 3,093 2,817 2,885 2,851 2,801 2,745 2,802 8,795 11,199 10,555 9,890
Financial ratiosReturn on equity (ROE) 3, 4 43.8% 36.0% 36.6% 33.3% 36.0% 40.6% 43.7% 38.7% 38.0% 35.6% 35.9%Return on risk capital (RORC) 55.8% 45.3% 45.8% 41.5% 46.4% 53.1% 57.7% 48.9% 48.8% 46.9% 48.4%Net interest margin (average earning assets) 4 2.91% 2.72% 2.75% 2.75% 2.75% 2.79% 2.80% 2.79% 2.77% 2.75% 2.76%Efficiency ratio 4 43.0% 45.3% 44.9% 45.7% 46.3% 45.3% 44.1% 44.4% 45.4% 47.3% 47.8%Operating leverage 4 8.0 % 0.0 % (1.6)% n.a. n.a. n.a. n.a. 2.1% n.a. 1.1% 3.8%
Average balances Total assets 318,100 311,500 308,000 303,800 297,000 292,400 291,000 312,500 296,100 279,900 258,900 Total earning assets 307,900 301,700 298,600 294,300 288,100 283,800 282,400 302,700 287,200 272,100 251,600 Loans and acceptances 310,500 304,200 300,600 295,800 289,200 283,600 280,500 305,100 287,300 269,500 249,600
Residential mortgages 171,700 168,600 167,100 164,500 160,600 157,500 156,200 169,100 159,700 151,000 141,800 Personal 5 76,800 75,300 74,400 73,000 71,200 69,500 68,300 75,500 70,500 63,700 53,000 Credit cards 13,000 12,500 12,800 12,800 12,800 12,800 13,200 12,800 12,900 12,500 12,500 Small business 2,700 2,600 2,600 2,600 2,600 2,700 2,700 2,600 2,600 2,700 2,800
Total Retail 264,200 259,000 256,900 252,900 247,200 242,500 240,400 260,000 245,700 229,900 210,100 Wholesale 46,300 45,200 43,700 42,900 42,000 41,100 40,100 45,100 41,600 39,600 39,500
Deposits 231,800 227,100 225,500 219,500 211,000 202,400 201,200 228,100 208,600 191,400 176,000 Attributed capital 10,050 10,400 10,600 11,050 9,550 8,850 8,300 10,350 9,450 8,350 7,250 Risk capital 7,900 8,250 8,450 8,850 7,450 6,800 6,300 8,200 7,350 6,350 5,400
Credit quality Gross impaired loans / Average net loans and acceptances 0.37% 0.42% 0.43% 0.43% 0.45% 0.49% 0.50% 0.37% 0.44% 0.52% 0.50%PCL / Average net loans and acceptances 0.30% 0.36% 0.32% 0.31% 0.37% 0.38% 0.38% 0.33% 0.36% 0.44% 0.51%Net write-offs / Average net loans and acceptances 0.32% 0.33% 0.30% 0.32% 0.35% 0.37% 0.34% 0.32% 0.35% 0.43% 0.47%
Business informationAssets under administration 6 165,600 164,500 161,500 158,000 158,600 161,200 154,600 165,600 158,000 148,200 133,800
Other earnings measuresNet income 1,127 937 994 948 888 895 933 3,058 3,664 3,044 2,663 Add: After-tax effect of amortization of other intangibles - - - - - - - - - 6 6 Cash net income 1,127 937 994 948 888 895 933 3,058 3,664 3,050 2,669 Less: Capital charge 261 263 275 301 260 233 227 799 1,021 945 834 Economic profit 866 674 719 647 628 662 706 2,259 2,643 2,105 1,835
1 Reported results include securitized residential mortgage and credit card loans and related amounts for income and provision for credit losses. As at Q3/12, the average securitized residential mortgage and credit card loans included were$46.1 billion and $6.1 billion, respectively. Securitized residential mortgages and credit card loans are included in Total assets, Total earning assets, Loans and acceptances, Residential mortgage, Credit cards. Under IFRS, thesetransactions are being reported on our balance sheet.
4 Excluding the adjustment noted in (2) above, Q3/12 ROE was 38.9%, NIM was 2.74%, efficiency ratio was 44.8% and operating leverage was 3.5%. 5 As at Q3/12, average personal secured loans was $45.2 billion and average personal unsecured loans was $31.6 billion.6 RBC AUA includes $37.9 billion (April 30, 2012 - $36.5 billion, July 31, 2011 - $34.7 billion) of securitized mortgages and credit card loans.
CGAAP
3 Effective Q1/12, we prospectively revised our capital allocation methodology to further align our allocation processes with evolving regulatory capital requirements. The revised methodology replaced the pro-rata allocation of unallocated capital that was used in 2011 and the impacts are being phased-in over fiscal 2012 in anticipation of our requirement to report under Basel III requirements in 2013. The revised methodology resulted in a reduction in attributed capital forCanadian Banking and an increase in attributed capital for Capital Markets.
2 Q3/12 results include a favourable mortgage prepayment adjustment of $125 million ($92 million after-tax). Q2/11 includes a gain on the sale of the remaining VISA shares of $29 million ($21 million after-tax).
IFRS
-8A-3rd Quarter 2012 - Revised Supplementary Financial Information ROYAL BANK OF CANADA
AS REPORTED IN Q3 2012WEALTH MANAGEMENT IFRS IFRS(Millions of Canadian dollars, except percentage amounts) Q3/12 Q2/12 Q1/12 Q4/11 Q3/11 Q2/11 Q1/11 2012 2011 2010 2009
9 months
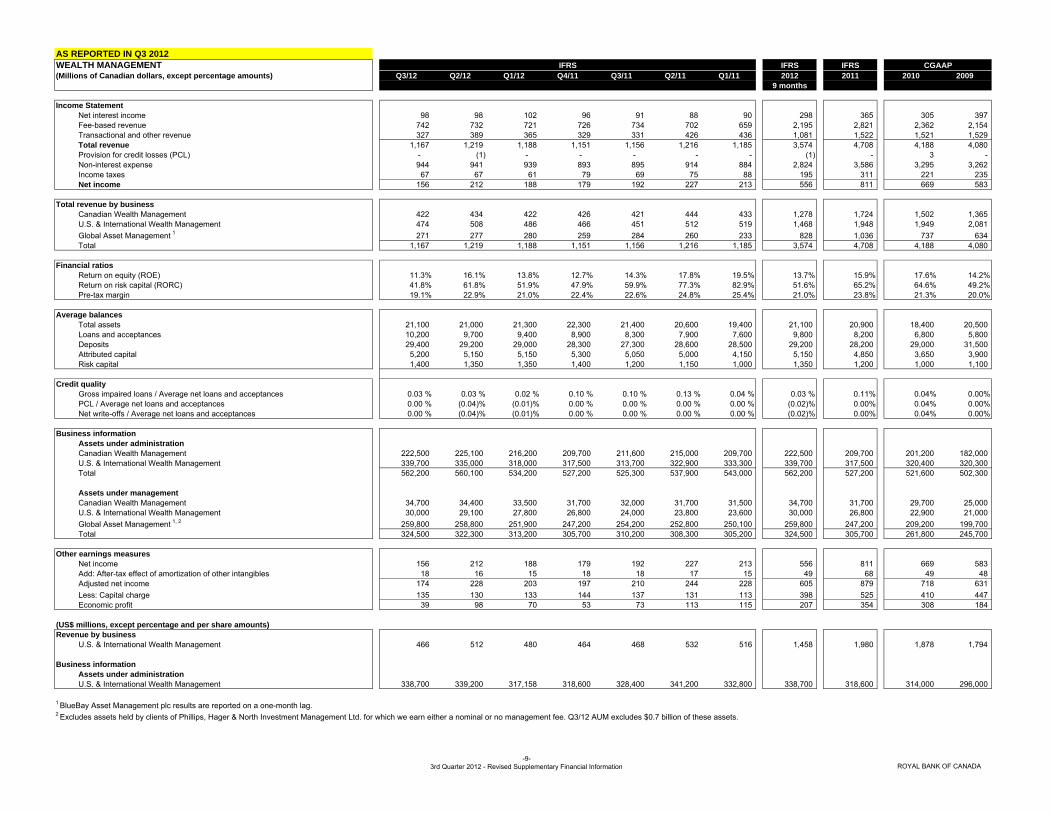
Income StatementNet interest income 98 98 102 96 91 88 90 298 365 305 397 Fee-based revenue 742 732 721 726 734 702 659 2,195 2,821 2,362 2,154 Transactional and other revenue 327 389 365 329 331 426 436 1,081 1,522 1,521 1,529 Total revenue 1,167 1,219 1,188 1,151 1,156 1,216 1,185 3,574 4,708 4,188 4,080 Provision for credit losses (PCL) - (1) - - - - - (1) - 3 - Non-interest expense 944 941 939 893 895 914 884 2,824 3,586 3,295 3,262 Income taxes 67 67 61 79 69 75 88 195 311 221 235 Net income 156 212 188 179 192 227 213 556 811 669 583
Total revenue by businessCanadian Wealth Management 422 434 422 426 421 444 433 1,278 1,724 1,502 1,365 U.S. & International Wealth Management 474 508 486 466 451 512 519 1,468 1,948 1,949 2,081 Global Asset Management 1 271 277 280 259 284 260 233 828 1,036 737 634 Total 1,167 1,219 1,188 1,151 1,156 1,216 1,185 3,574 4,708 4,188 4,080
Financial ratiosReturn on equity (ROE) 11.3% 16.1% 13.8% 12.7% 14.3% 17.8% 19.5% 13.7% 15.9% 17.6% 14.2%Return on risk capital (RORC) 41.8% 61.8% 51.9% 47.9% 59.9% 77.3% 82.9% 51.6% 65.2% 64.6% 49.2%Pre-tax margin 19.1% 22.9% 21.0% 22.4% 22.6% 24.8% 25.4% 21.0% 23.8% 21.3% 20.0%
Average balancesTotal assets 21,100 21,000 21,300 22,300 21,400 20,600 19,400 21,100 20,900 18,400 20,500 Loans and acceptances 10,200 9,700 9,400 8,900 8,300 7,900 7,600 9,800 8,200 6,800 5,800 Deposits 29,400 29,200 29,000 28,300 27,300 28,600 28,500 29,200 28,200 29,000 31,500 Attributed capital 5,200 5,150 5,150 5,300 5,050 5,000 4,150 5,150 4,850 3,650 3,900 Risk capital 1,400 1,350 1,350 1,400 1,200 1,150 1,000 1,350 1,200 1,000 1,100
Credit quality Gross impaired loans / Average net loans and acceptances 0.03 % 0.03 % 0.02 % 0.10 % 0.10 % 0.13 % 0.04 % 0.03 % 0.11% 0.04% 0.00%PCL / Average net loans and acceptances 0.00 % (0.04)% (0.01)% 0.00 % 0.00 % 0.00 % 0.00 % (0.02)% 0.00% 0.04% 0.00%Net write-offs / Average net loans and acceptances 0.00 % (0.04)% (0.01)% 0.00 % 0.00 % 0.00 % 0.00 % (0.02)% 0.00% 0.04% 0.00%
Business informationAssets under administrationCanadian Wealth Management 222,500 225,100 216,200 209,700 211,600 215,000 209,700 222,500 209,700 201,200 182,000 U.S. & International Wealth Management 339,700 335,000 318,000 317,500 313,700 322,900 333,300 339,700 317,500 320,400 320,300 Total 562,200 560,100 534,200 527,200 525,300 537,900 543,000 562,200 527,200 521,600 502,300
Assets under managementCanadian Wealth Management 34,700 34,400 33,500 31,700 32,000 31,700 31,500 34,700 31,700 29,700 25,000 U.S. & International Wealth Management 30,000 29,100 27,800 26,800 24,000 23,800 23,600 30,000 26,800 22,900 21,000 Global Asset Management 1, 2 259,800 258,800 251,900 247,200 254,200 252,800 250,100 259,800 247,200 209,200 199,700 Total 324,500 322,300 313,200 305,700 310,200 308,300 305,200 324,500 305,700 261,800 245,700
Other earnings measuresNet income 156 212 188 179 192 227 213 556 811 669 583 Add: After-tax effect of amortization of other intangibles 18 16 15 18 18 17 15 49 68 49 48 Adjusted net income 174 228 203 197 210 244 228 605 879 718 631 Less: Capital charge 135 130 133 144 137 131 113 398 525 410 447 Economic profit 39 98 70 53 73 113 115 207 354 308 184
(US$ millions, except percentage and per share amounts)Revenue by business
U.S. & International Wealth Management 466 512 480 464 468 532 516 1,458 1,980 1,878 1,794
Business informationAssets under administrationU.S. & International Wealth Management 338,700 339,200 317,158 318,600 328,400 341,200 332,800 338,700 318,600 314,000 296,000
1 BlueBay Asset Management plc results are reported on a one-month lag.2 Excludes assets held by clients of Phillips, Hager & North Investment Management Ltd. for which we earn either a nominal or no management fee. Q3/12 AUM excludes $0.7 billion of these assets.
CGAAPIFRS
-9-3rd Quarter 2012 - Revised Supplementary Financial Information ROYAL BANK OF CANADA
AS REPORTED IN Q3 2012INSURANCE IFRS IFRS(Millions of Canadian dollars, except percentage amounts) Q3/12 Q2/12 Q1/12 Q4/11 Q3/11 Q2/11 Q1/11 2012 2011 2010 2009
9 months
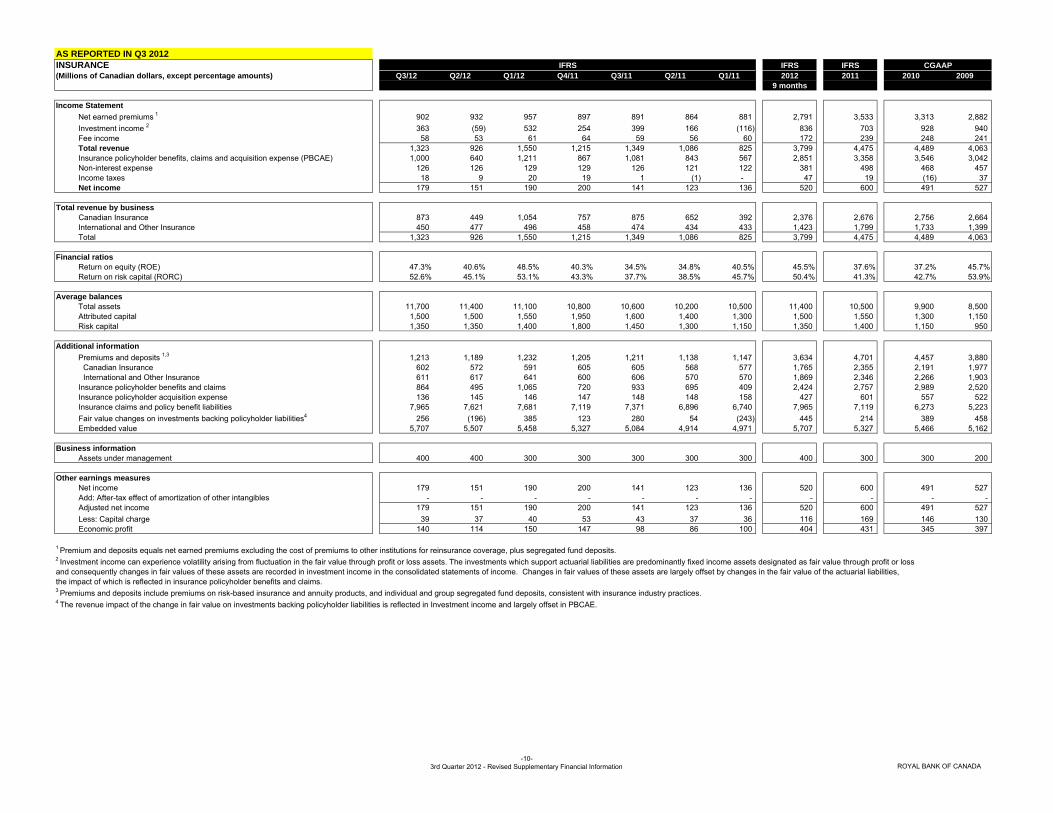
Income StatementNet earned premiums 1 902 932 957 897 891 864 881 2,791 3,533 3,313 2,882 Investment income 2 363 (59) 532 254 399 166 (116) 836 703 928 940 Fee income 58 53 61 64 59 56 60 172 239 248 241 Total revenue 1,323 926 1,550 1,215 1,349 1,086 825 3,799 4,475 4,489 4,063 Insurance policyholder benefits, claims and acquisition expense (PBCAE) 1,000 640 1,211 867 1,081 843 567 2,851 3,358 3,546 3,042 Non-interest expense 126 126 129 129 126 121 122 381 498 468 457 Income taxes 18 9 20 19 1 (1) - 47 19 (16) 37 Net income 179 151 190 200 141 123 136 520 600 491 527
Total revenue by businessCanadian Insurance 873 449 1,054 757 875 652 392 2,376 2,676 2,756 2,664 International and Other Insurance 450 477 496 458 474 434 433 1,423 1,799 1,733 1,399 Total 1,323 926 1,550 1,215 1,349 1,086 825 3,799 4,475 4,489 4,063
Financial ratiosReturn on equity (ROE) 47.3% 40.6% 48.5% 40.3% 34.5% 34.8% 40.5% 45.5% 37.6% 37.2% 45.7%Return on risk capital (RORC) 52.6% 45.1% 53.1% 43.3% 37.7% 38.5% 45.7% 50.4% 41.3% 42.7% 53.9%
Average balances Total assets 11,700 11,400 11,100 10,800 10,600 10,200 10,500 11,400 10,500 9,900 8,500 Attributed capital 1,500 1,500 1,550 1,950 1,600 1,400 1,300 1,500 1,550 1,300 1,150 Risk capital 1,350 1,350 1,400 1,800 1,450 1,300 1,150 1,350 1,400 1,150 950
Additional informationPremiums and deposits 1,3 1,213 1,189 1,232 1,205 1,211 1,138 1,147 3,634 4,701 4,457 3,880
Canadian Insurance 602 572 591 605 605 568 577 1,765 2,355 2,191 1,977 International and Other Insurance 611 617 641 600 606 570 570 1,869 2,346 2,266 1,903
Insurance policyholder benefits and claims 864 495 1,065 720 933 695 409 2,424 2,757 2,989 2,520 Insurance policyholder acquisition expense 136 145 146 147 148 148 158 427 601 557 522 Insurance claims and policy benefit liabilities 7,965 7,621 7,681 7,119 7,371 6,896 6,740 7,965 7,119 6,273 5,223 Fair value changes on investments backing policyholder liabilities 4 256 (196) 385 123 280 54 (243) 445 214 389 458 Embedded value 5,707 5,507 5,458 5,327 5,084 4,914 4,971 5,707 5,327 5,466 5,162
Business informationAssets under management 400 400 300 300 300 300 300 400 300 300 200
Other earnings measuresNet income 179 151 190 200 141 123 136 520 600 491 527 Add: After-tax effect of amortization of other intangibles - - - - - - - - - - - Adjusted net income 179 151 190 200 141 123 136 520 600 491 527 Less: Capital charge 39 37 40 53 43 37 36 116 169 146 130 Economic profit 140 114 150 147 98 86 100 404 431 345 397
1 Premium and deposits equals net earned premiums excluding the cost of premiums to other institutions for reinsurance coverage, plus segregated fund deposits.2 Investment income can experience volatility arising from fluctuation in the fair value through profit or loss assets. The investments which support actuarial liabilities are predominantly fixed income assets designated as fair value through profit or loss and consequently changes in fair values of these assets are recorded in investment income in the consolidated statements of income. Changes in fair values of these assets are largely offset by changes in the fair value of the actuarial liabilities,the impact of which is reflected in insurance policyholder benefits and claims.3 Premiums and deposits include premiums on risk-based insurance and annuity products, and individual and group segregated fund deposits, consistent with insurance industry practices. 4 The revenue impact of the change in fair value on investments backing policyholder liabilities is reflected in Investment income and largely offset in PBCAE.
CGAAPIFRS
-10-3rd Quarter 2012 - Revised Supplementary Financial Information ROYAL BANK OF CANADA

NEW PAGEINVESTOR & TREASURY SERVICES IFRS IFRS(Millions of Canadian dollars, except percentage amounts) Q3/12 1 Q2/12 1 Q1/12 Q4/11 Q3/11 Q2/11 Q1/11 2012 2011 2010 2009
9 months
Income StatementNet interest income 152 164 180 163 152 126 132 496 573 498 838 Non-interest income 152 118 145 99 128 177 165 415 569 623 1,084 Total revenue 2,3 304 282 325 262 280 303 297 911 1,142 1,121 1,922 Provision for credit losses (PCL) - - - - - - - - - 15 21 Non-interest expense 226 378 214 209 207 204 201 818 821 783 830 Income taxes 27 25 28 13 20 29 29 80 91 102 371 Non-controlling interest in net income of subsidiaries n.a. n.a. n.a. n.a. n.a. n.a. n.a. n.a. n.a. (1) 3 Net income (loss) 51 (121) 83 40 53 70 67 13 230 222 697
Financial ratiosReturn on equity (ROE) 13.9% (33.2)% 17.9% 12.0% 16.8% 22.8% 22.5% 0.4% 18.4% 19.7% 64.3%Return on risk capital (RORC) 16.1% (40.8)% 21.5% 16.3% 23.3% 31.7% 32.1% 0.5% 25.6% 25.8% 84.6%
Average balancesTotal assets 69,300 68,900 74,600 77,100 71,000 66,300 65,100 71,000 70,000 60,400 62,800 Loans and acceptances 2,000 2,000 1,500 3,000 1,700 1,900 2,500 1,800 2,300 4,800 4,900 Deposits 96,600 102,700 102,400 107,100 98,400 102,000 105,100 100,600 103,200 93,100 103,300 Attributed capital 1,400 1,500 1,800 1,200 1,200 1,200 1,150 1,550 1,200 1,050 1,050 Risk capital 1,200 1,250 1,450 900 850 850 800 1,300 850 850 800
Business informationAssets under administration 2,670,900 2,808,800 2,709,800 2,744,400 2,831,900 2,892,700 2,881,200 2,670,900 2,744,400 2,779,500 2,484,400
Other earnings measuresNet income (loss) 51 (121) 83 40 53 70 67 13 230 222 697 Non-controlling interests - - - (1) - - - - (1) n.a. n.a.Add: After-tax effect of amortization of other intangibles and goodwill impairment 13 169 8 9 8 8 8 190 33 31 31 Adjusted net income 64 48 91 48 61 78 75 203 262 253 728 Less: Capital charge 35 38 46 34 32 32 31 119 129 122 124 Economic profit 29 10 45 14 29 46 44 84 133 131 604
2 The acquisition of the remaining 50% stake in RBC Dexia closed on July 27, 2012 and was subsequently rebranded RBC Investor Services (RBCIS). Our third quarter reflects 100% of RBCIS's results from July 27, 2012 to July 31, 2012. RBCIS results are reported on a one-month lag.3 2009 trading revenue was at an elevated level mainly due to narrowing spreads, increased volumes and interest rate volatility.
CGAAPIFRS
1 Results reflect the previously announced loss of $224 million before-tax ($12 million in Q3/12, $212 million in Q2/12), a loss of $213 million after-tax ($11 million in Q3/12 and $202 million in Q2/12) related to our announced acquisition of the other 50 percent interest in RBC Dexia. For further information, refer to the Key corporate events of the 2012 section of our Q3 2012 Report to Shareholders.
-11-3rd Quarter 2012 - Revised Supplementary Financial Information ROYAL BANK OF CANADA
REVISED FROM Q3 2012CAPITAL MARKETS IFRS IFRS(Millions of Canadian dollars, except percentage amounts) Q3/12 Q2/12 Q1/12 Q4/11 Q3/11 Q2/11 Q1/11 2012 2011 2010 2009
9 months
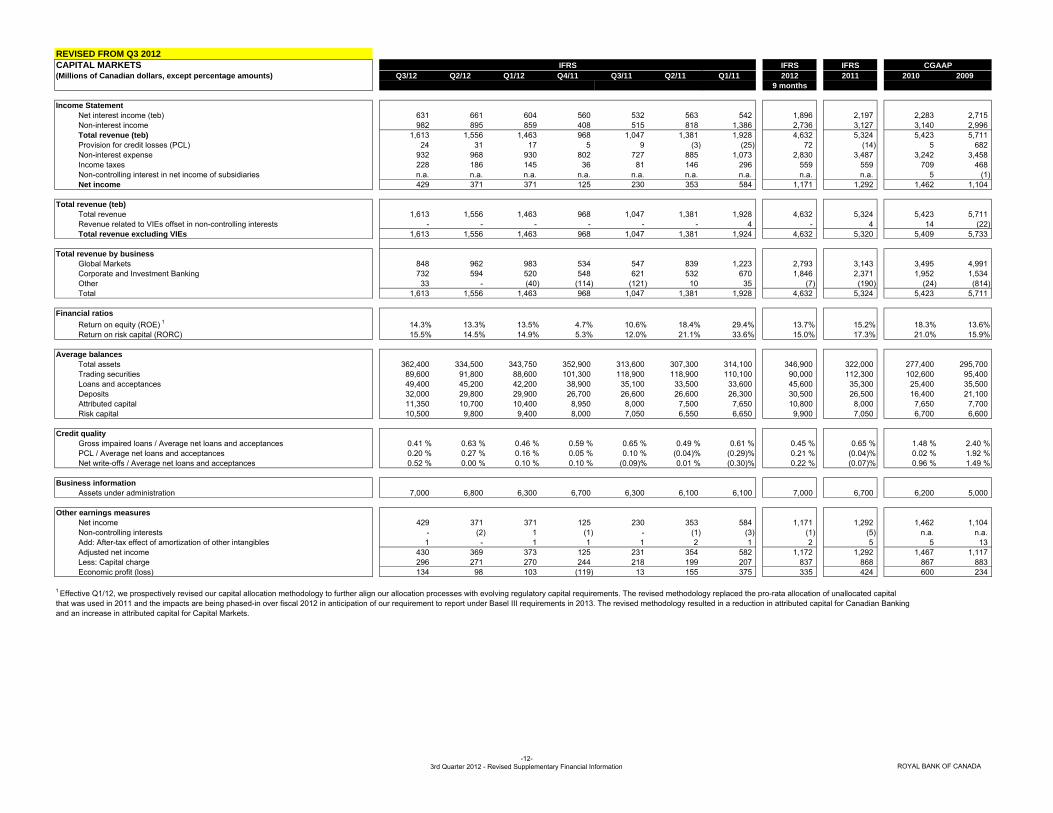
Income StatementNet interest income (teb) 631 661 604 560 532 563 542 1,896 2,197 2,283 2,715 Non-interest income 982 895 859 408 515 818 1,386 2,736 3,127 3,140 2,996 Total revenue (teb) 1,613 1,556 1,463 968 1,047 1,381 1,928 4,632 5,324 5,423 5,711 Provision for credit losses (PCL) 24 31 17 5 9 (3) (25) 72 (14) 5 682 Non-interest expense 932 968 930 802 727 885 1,073 2,830 3,487 3,242 3,458 Income taxes 228 186 145 36 81 146 296 559 559 709 468 Non-controlling interest in net income of subsidiaries n.a. n.a. n.a. n.a. n.a. n.a. n.a. n.a. n.a. 5 (1) Net income 429 371 371 125 230 353 584 1,171 1,292 1,462 1,104
Total revenue (teb)Total revenue 1,613 1,556 1,463 968 1,047 1,381 1,928 4,632 5,324 5,423 5,711 Revenue related to VIEs offset in non-controlling interests - - - - - - 4 - 4 14 (22) Total revenue excluding VIEs 1,613 1,556 1,463 968 1,047 1,381 1,924 4,632 5,320 5,409 5,733
Total revenue by businessGlobal Markets 848 962 983 534 547 839 1,223 2,793 3,143 3,495 4,991 Corporate and Investment Banking 732 594 520 548 621 532 670 1,846 2,371 1,952 1,534 Other 33 - (40) (114) (121) 10 35 (7) (190) (24) (814) Total 1,613 1,556 1,463 968 1,047 1,381 1,928 4,632 5,324 5,423 5,711
Financial ratiosReturn on equity (ROE) 1 14.3% 13.3% 13.5% 4.7% 10.6% 18.4% 29.4% 13.7% 15.2% 18.3% 13.6%Return on risk capital (RORC) 15.5% 14.5% 14.9% 5.3% 12.0% 21.1% 33.6% 15.0% 17.3% 21.0% 15.9%
Average balancesTotal assets 362,400 334,500 343,750 352,900 313,600 307,300 314,100 346,900 322,000 277,400 295,700 Trading securities 89,600 91,800 88,600 101,300 118,900 118,900 110,100 90,000 112,300 102,600 95,400 Loans and acceptances 49,400 45,200 42,200 38,900 35,100 33,500 33,600 45,600 35,300 25,400 35,500 Deposits 32,000 29,800 29,900 26,700 26,600 26,600 26,300 30,500 26,500 16,400 21,100 Attributed capital 11,350 10,700 10,400 8,950 8,000 7,500 7,650 10,800 8,000 7,650 7,700 Risk capital 10,500 9,800 9,400 8,000 7,050 6,550 6,650 9,900 7,050 6,700 6,600
Credit quality Gross impaired loans / Average net loans and acceptances 0.41 % 0.63 % 0.46 % 0.59 % 0.65 % 0.49 % 0.61 % 0.45 % 0.65 % 1.48 % 2.40 %PCL / Average net loans and acceptances 0.20 % 0.27 % 0.16 % 0.05 % 0.10 % (0.04)% (0.29)% 0.21 % (0.04)% 0.02 % 1.92 %Net write-offs / Average net loans and acceptances 0.52 % 0.00 % 0.10 % 0.10 % (0.09)% 0.01 % (0.30)% 0.22 % (0.07)% 0.96 % 1.49 %
Business informationAssets under administration 7,000 6,800 6,300 6,700 6,300 6,100 6,100 7,000 6,700 6,200 5,000
Other earnings measuresNet income 429 371 371 125 230 353 584 1,171 1,292 1,462 1,104 Non-controlling interests - (2) 1 (1) - (1) (3) (1) (5) n.a. n.a.Add: After-tax effect of amortization of other intangibles 1 - 1 1 1 2 1 2 5 5 13 Adjusted net income 430 369 373 125 231 354 582 1,172 1,292 1,467 1,117 Less: Capital charge 296 271 270 244 218 199 207 837 868 867 883 Economic profit (loss) 134 98 103 (119) 13 155 375 335 424 600 234
1 Effective Q1/12, we prospectively revised our capital allocation methodology to further align our allocation processes with evolving regulatory capital requirements. The revised methodology replaced the pro-rata allocation of unallocated capitalthat was used in 2011 and the impacts are being phased-in over fiscal 2012 in anticipation of our requirement to report under Basel III requirements in 2013. The revised methodology resulted in a reduction in attributed capital for Canadian Banking and an increase in attributed capital for Capital Markets.
CGAAPIFRS
-12-3rd Quarter 2012 - Revised Supplementary Financial Information ROYAL BANK OF CANADA
AS REPORTED IN Q3 2012CORPORATE SUPPORT IFRS IFRS(Millions of Canadian dollars) Q3/12 Q2/12 Q1/12 Q4/11 Q3/11 Q2/11 Q1/11 2012 2011 2010 2009
9 months
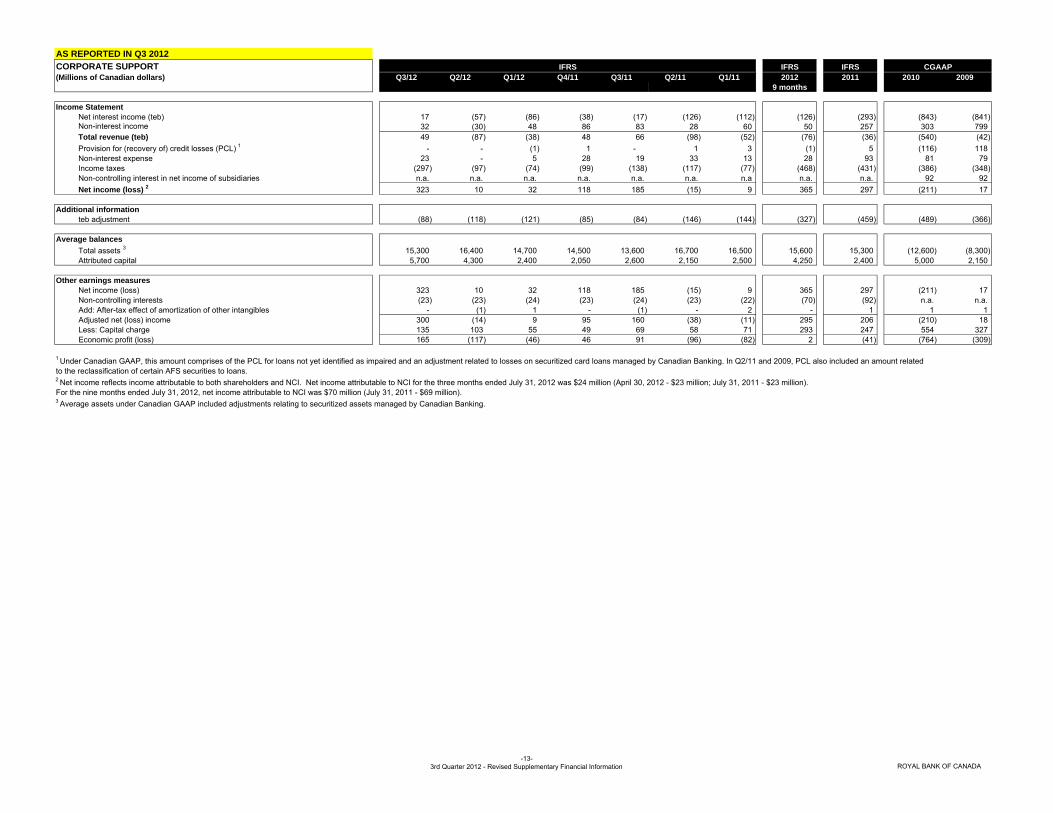
Income StatementNet interest income (teb) 17 (57) (86) (38) (17) (126) (112) (126) (293) (843) (841) Non-interest income 32 (30) 48 86 83 28 60 50 257 303 799 Total revenue (teb) 49 (87) (38) 48 66 (98) (52) (76) (36) (540) (42) Provision for (recovery of) credit losses (PCL) 1 - - (1) 1 - 1 3 (1) 5 (116) 118 Non-interest expense 23 - 5 28 19 33 13 28 93 81 79 Income taxes (297) (97) (74) (99) (138) (117) (77) (468) (431) (386) (348) Non-controlling interest in net income of subsidiaries n.a. n.a. n.a. n.a. n.a. n.a. n.a n.a. n.a. 92 92 Net income (loss) 2 323 10 32 118 185 (15) 9 365 297 (211) 17
Additional informationteb adjustment (88) (118) (121) (85) (84) (146) (144) (327) (459) (489) (366)
Average balancesTotal assets 3 15,300 16,400 14,700 14,500 13,600 16,700 16,500 15,600 15,300 (12,600) (8,300) Attributed capital 5,700 4,300 2,400 2,050 2,600 2,150 2,500 4,250 2,400 5,000 2,150
Other earnings measuresNet income (loss) 323 10 32 118 185 (15) 9 365 297 (211) 17 Non-controlling interests (23) (23) (24) (23) (24) (23) (22) (70) (92) n.a. n.a.Add: After-tax effect of amortization of other intangibles - (1) 1 - (1) - 2 - 1 1 1 Adjusted net (loss) income 300 (14) 9 95 160 (38) (11) 295 206 (210) 18 Less: Capital charge 135 103 55 49 69 58 71 293 247 554 327 Economic profit (loss) 165 (117) (46) 46 91 (96) (82) 2 (41) (764) (309)
1 Under Canadian GAAP, this amount comprises of the PCL for loans not yet identified as impaired and an adjustment related to losses on securitized card loans managed by Canadian Banking. In Q2/11 and 2009, PCL also included an amount relatedto the reclassification of certain AFS securities to loans.2 Net income reflects income attributable to both shareholders and NCI. Net income attributable to NCI for the three months ended July 31, 2012 was $24 million (April 30, 2012 - $23 million; July 31, 2011 - $23 million). For the nine months ended July 31, 2012, net income attributable to NCI was $70 million (July 31, 2011 - $69 million).3 Average assets under Canadian GAAP included adjustments relating to securitized assets managed by Canadian Banking.
CGAAPIFRS
-13-3rd Quarter 2012 - Revised Supplementary Financial Information ROYAL BANK OF CANADA

AS REPORTED IN Q3 2012DISCONTINUED OPERATIONS 1 IFRS IFRS(Millions of Canadian dollars, except percentage amounts) Q3/12 Q2/12 Q1/12 Q4/11 Q3/11 Q2/11 Q1/11 2012 2011 2010 2009
9 months
Income StatementNet interest income - 46 154 160 161 173 189 200 683 639 836 Non-interest income - 10 58 (10) 3 215 120 68 328 1,725 1,830 Total revenue - 56 212 150 164 388 309 268 1,011 2,364 2,666 Provision for credit losses (PCL) - 34 83 15 92 108 111 117 326 621 1,246 Insurance policyholder benefits, claims and acquisitions expense (PBCAE) - - - - - 178 62 - 240 1,562 1,567 Non-interest expense - 73 185 199 206 208 221 258 834 922 1,124 Goodwill impairment charge - - - - - - - - - - 1,000 Income taxes - (18) (28) (20) (52) (46) (37) (46) (155) (348) (448) Net (loss) - (33) (28) (44) (82) (60) (48) (61) (234) (393) (1,823) Gain (loss) on sale 2 - 3 7 6 (307) 9 - 10 (292) (116) - Net loss from discontinued operations - (30) (21) (38) (389) (51) (48) (51) (526) (509) (1,823)
Average balancesTotal assets - 8,100 26,450 27,700 26,200 31,300 32,900 11,500 29,500 34,300 40,600 Total earning assets - 6,400 20,990 25,000 23,600 28,000 29,200 9,100 26,400 28,300 34,400 Loans and acceptances - 5,100 16,100 17,100 16,600 17,300 18,300 7,100 17,300 20,100 25,400 Deposits - 5,600 17,900 21,100 19,600 19,000 19,300 7,800 19,700 18,900 22,400
Credit qualityGross impaired loans / Average net loans and acceptances - 1.31% 7.68% 7.58% 8.15% 8.29% 8.87% - 7.47% 11.28% 10.37%PCL / Average net loans and acceptances - 2.75% 2.04% 0.36% 2.20% 2.57% 2.39% - 1.88% 3.02% 4.78%Net write-offs / Average net loans and acceptances - 3.21% 2.41% 1.99% 2.96% 3.46% 2.97% - 2.84% 3.10% 3.05%
Other informationNumber of employees (full-time equivalent) - 15 4,756 4,763 4,801 4,836 5,000 - 4,763 4,979 5,206 Number of banking branches - - 422 424 424 423 426 - 424 426 438 Number of automated teller machines (ATM) - - 469 469 470 470 476 - 469 476 486
U.S. banking loansRetail
Residential mortgages - - 1,936 1,897 1,851 1,812 1,931 - 1,897 2,042 2,185 Home equity - - 3,578 3,579 3,474 3,448 3,689 - 3,579 3,818 4,108 Lot loans - - 484 501 506 524 587 - 501 622 801 Credit cards - - 223 214 197 190 194 - 214 193 193 Other - - 229 226 216 208 222 - 226 216 228
Total retail - - 6,450 6,417 6,244 6,182 6,623 - 6,417 6,891 7,515
WholesaleCommercial loans - - 9,989 10,249 9,988 10,140 10,897 - 10,249 11,151 12,542 Residential builder finance loans - - 430 463 505 554 633 - 463 699 1,140 RBC Real Estate Finance Inc. (REFI) - 84 94 121 144 166 225 - 121 251 642 Other - - - - - - - - - 688 1,193
Total wholesale - 84 10,513 10,833 10,637 10,860 11,755 - 10,833 12,789 15,517
Total U.S. banking loans - 84 16,963 17,250 16,881 17,042 18,378 - 17,250 19,680 23,032
Capital Ratios for Significant Banking SubsidiaryRBC Bank (USA) 3
Tier 1 capital ratio - - 12.9% 12.8% 13.0% 12.7% 12.3% - 12.8% 12.6% 9.9%Total capital ratio - - 16.1% 15.9% 15.9% 15.8% 15.4% - 15.9% 15.8% 13.2%
1 On April 29, 2011, we completed the divestiture of Liberty Life Insurance Company (Liberty Life), our U.S. life insurance business, to Athene Holding Ltd for US$628 million (C$ 641 million). As a result of this transaction, we classified the results of Liberty Life as discontinued operations. As well, on June 20, 2011, we announced a definitive agreement to sell our U.S. regional retail banking operations to PNC Financial Services Group, Inc. Discontinued operations also includes the results of our U.S. builder financeloans portfolio, as this loan portfolio is being wound down. Comparative financial information, starting from 2009, has been restated to reflect these results of operations as discontinued operations. Under IFRS, Balance Sheet adjustments related to discontinued operations are made prospectively from the date of classification as discontinued operations (U.S. Retail Banking in Q3/11, Liberty Life at November 1, 2010). The results of discontinued operations are reported as a separate component of incomeor loss for both current and all comparative periods.2 Our estimated loss on sale of our U.S. regional retail banking operations was $304 million after taxes. Goodwill impairment was taken on transition to IFRS, which decreased Retained Earnings by $1.3 billion.3 This table is a Basel II Pillar 3 disclosure requirement. Ratios have been calculated using guidelines issued by the U.S. Federal Reserve Board under Basel I. RBC Bank USA was sold and the sale transaction was completed in Q2/12.
CGAAPIFRS
-14-3rd Quarter 2012 - Revised Supplementary Financial Information ROYAL BANK OF CANADA
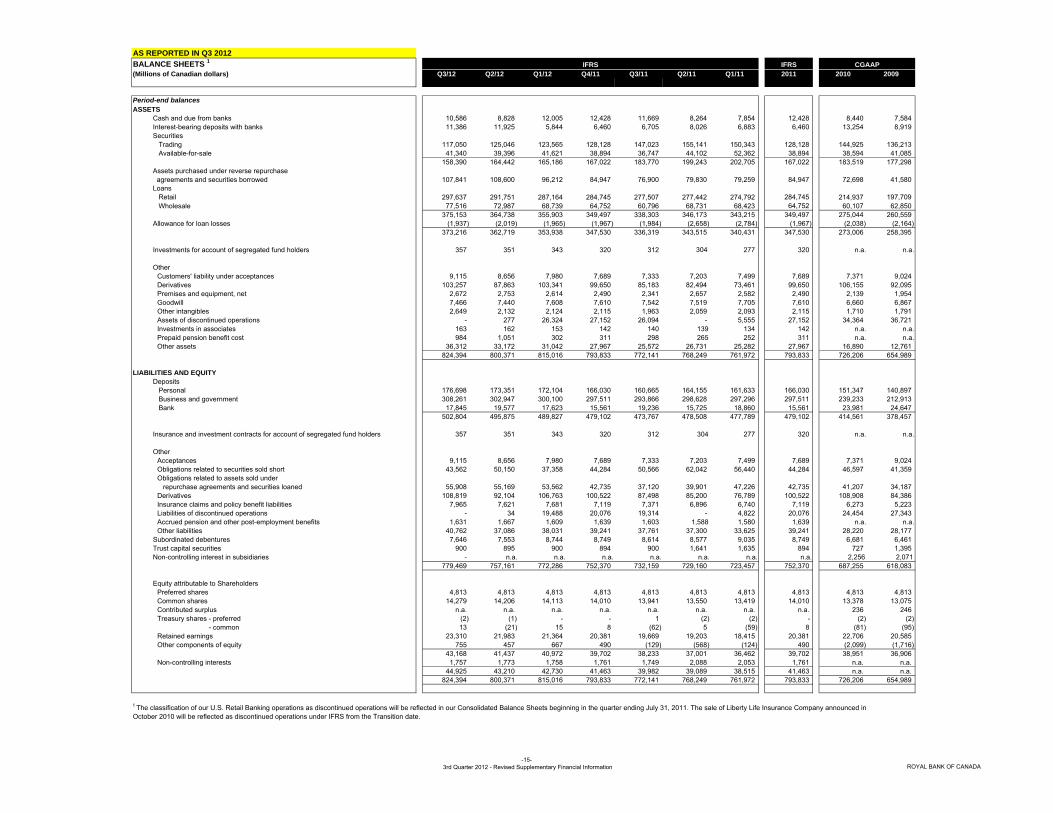
AS REPORTED IN Q3 2012BALANCE SHEETS 1 IFRS(Millions of Canadian dollars) Q3/12 Q2/12 Q1/12 Q4/11 Q3/11 Q2/11 Q1/11 2011 2010 2009
Period-end balancesASSETS
Cash and due from banks 10,586 8,828 12,005 12,428 11,669 8,264 7,854 12,428 8,440 7,584 Interest-bearing deposits with banks 11,386 11,925 5,844 6,460 6,705 8,026 6,883 6,460 13,254 8,919 Securities Trading 117,050 125,046 123,565 128,128 147,023 155,141 150,343 128,128 144,925 136,213 Available-for-sale 41,340 39,396 41,621 38,894 36,747 44,102 52,362 38,894 38,594 41,085
158,390 164,442 165,186 167,022 183,770 199,243 202,705 167,022 183,519 177,298 Assets purchased under reverse repurchase agreements and securities borrowed 107,841 108,600 96,212 84,947 76,900 79,830 79,259 84,947 72,698 41,580 Loans Retail 297,637 291,751 287,164 284,745 277,507 277,442 274,792 284,745 214,937 197,709 Wholesale 77,516 72,987 68,739 64,752 60,796 68,731 68,423 64,752 60,107 62,850
375,153 364,738 355,903 349,497 338,303 346,173 343,215 349,497 275,044 260,559 Allowance for loan losses (1,937) (2,019) (1,965) (1,967) (1,984) (2,658) (2,784) (1,967) (2,038) (2,164)
373,216 362,719 353,938 347,530 336,319 343,515 340,431 347,530 273,006 258,395
Investments for account of segregated fund holders 357 351 343 320 312 304 277 320 n.a. n.a.
Other Customers' liability under acceptances 9,115 8,656 7,980 7,689 7,333 7,203 7,499 7,689 7,371 9,024 Derivatives 103,257 87,863 103,341 99,650 85,183 82,494 73,461 99,650 106,155 92,095 Premises and equipment, net 2,672 2,753 2,614 2,490 2,341 2,657 2,582 2,490 2,139 1,954 Goodwill 7,466 7,440 7,608 7,610 7,542 7,519 7,705 7,610 6,660 6,867 Other intangibles 2,649 2,132 2,124 2,115 1,963 2,059 2,093 2,115 1,710 1,791 Assets of discontinued operations - 277 26,324 27,152 26,094 - 5,555 27,152 34,364 36,721 Investments in associates 163 162 153 142 140 139 134 142 n.a. n.a. Prepaid pension benefit cost 984 1,051 302 311 298 265 252 311 n.a. n.a. Other assets 36,312 33,172 31,042 27,967 25,572 26,731 25,282 27,967 16,890 12,761
824,394 800,371 815,016 793,833 772,141 768,249 761,972 793,833 726,206 654,989
LIABILITIES AND EQUITYDeposits Personal 176,698 173,351 172,104 166,030 160,665 164,155 161,633 166,030 151,347 140,897 Business and government 308,261 302,947 300,100 297,511 293,866 298,628 297,296 297,511 239,233 212,913 Bank 17,845 19,577 17,623 15,561 19,236 15,725 18,860 15,561 23,981 24,647
502,804 495,875 489,827 479,102 473,767 478,508 477,789 479,102 414,561 378,457
Insurance and investment contracts for account of segregated fund holders 357 351 343 320 312 304 277 320 n.a. n.a.
OtherAcceptances 9,115 8,656 7,980 7,689 7,333 7,203 7,499 7,689 7,371 9,024 Obligations related to securities sold short 43,562 50,150 37,358 44,284 50,566 62,042 56,440 44,284 46,597 41,359 Obligations related to assets sold under repurchase agreements and securities loaned 55,908 55,169 53,562 42,735 37,120 39,901 47,226 42,735 41,207 34,187 Derivatives 108,819 92,104 106,763 100,522 87,498 85,200 76,789 100,522 108,908 84,386 Insurance claims and policy benefit liabilities 7,965 7,621 7,681 7,119 7,371 6,896 6,740 7,119 6,273 5,223 Liabilities of discontinued operations - 34 19,488 20,076 19,314 - 4,822 20,076 24,454 27,343 Accrued pension and other post-employment benefits 1,631 1,667 1,609 1,639 1,603 1,588 1,580 1,639 n.a. n.a. Other liabilities 40,762 37,086 38,031 39,241 37,761 37,300 33,625 39,241 28,220 28,177
Subordinated debentures 7,646 7,553 8,744 8,749 8,614 8,577 9,035 8,749 6,681 6,461 Trust capital securities 900 895 900 894 900 1,641 1,635 894 727 1,395 Non-controlling interest in subsidiaries - n.a. n.a. n.a. n.a. n.a. n.a. n.a. 2,256 2,071
779,469 757,161 772,286 752,370 732,159 729,160 723,457 752,370 687,255 618,083
Equity attributable to ShareholdersPreferred shares 4,813 4,813 4,813 4,813 4,813 4,813 4,813 4,813 4,813 4,813 Common shares 14,279 14,206 14,113 14,010 13,941 13,550 13,419 14,010 13,378 13,075 Contributed surplus n.a. n.a. n.a. n.a. n.a. n.a. n.a. n.a. 236 246 Treasury shares - preferred (2) (1) - - 1 (2) (2) - (2) (2) - common 13 (21) 15 8 (62) 5 (59) 8 (81) (95) Retained earnings 23,310 21,983 21,364 20,381 19,669 19,203 18,415 20,381 22,706 20,585 Other components of equity 755 457 667 490 (129) (568) (124) 490 (2,099) (1,716)
43,168 41,437 40,972 39,702 38,233 37,001 36,462 39,702 38,951 36,906 Non-controlling interests 1,757 1,773 1,758 1,761 1,749 2,088 2,053 1,761 n.a. n.a.
44,925 43,210 42,730 41,463 39,982 39,089 38,515 41,463 n.a. n.a.824,394 800,371 815,016 793,833 772,141 768,249 761,972 793,833 726,206 654,989
1 The classification of our U.S. Retail Banking operations as discontinued operations will be reflected in our Consolidated Balance Sheets beginning in the quarter ending July 31, 2011. The sale of Liberty Life Insurance Company announced in October 2010 will be reflected as discontinued operations under IFRS from the Transition date.
IFRS CGAAP
-15-3rd Quarter 2012 - Revised Supplementary Financial Information ROYAL BANK OF CANADA

AS REPORTED IN Q3 2012SELECTED AVERAGE BALANCE SHEET ITEMS 1 IFRS IFRS 2
(Millions of Canadian dollars) Q3/12 Q2/12 Q1/12 Q4/11 Q3/11 Q2/11 Q1/11 2012 2011 2010 20099 months
Securities 158,400 164,600 165,300 179,400 194,300 206,700 200,000 162,800 195,000 186,600 179,200 Assets purchased under reverse repurchase agreements and securities borrowed 108,300 100,400 95,500 91,800 80,300 76,000 81,000 101,400 82,400 57,500 44,500 Total loans 3 368,800 358,000 351,500 344,200 331,600 341,600 339,700 359,400 339,300 264,700 254,200 Retail 3 304,800 298,800 296,100 290,200 283,300 284,300 281,300 299,900 284,800 214,200 194,800 Wholesale 3 65,900 61,200 57,500 56,000 50,300 60,100 61,300 61,500 56,900 52,700 61,300 Customers' liability under acceptances 8,900 8,300 7,800 7,800 7,400 7,500 7,500 8,300 7,600 8,000 10,200 Average earning assets 643,400 629,900 618,800 623,800 612,500 625,200 622,200 630,700 620,900 518,900 489,300 Total assets 815,000 787,800 814,500 823,700 767,600 759,000 764,600 805,900 778,900 683,000 695,300 Deposits 493,800 492,700 490,000 482,700 465,700 476,000 474,900 492,100 474,800 391,800 399,700 Common equity 37,700 36,400 35,600 34,400 33,050 31,850 31,000 36,600 32,600 33,250 30,450 Total equity 42,200 41,000 39,500 39,000 38,600 37,850 36,800 40,900 38,100 37,900 34,500
ASSETS UNDER ADMINISTRATION AND MANAGEMENT IFRS IFRS(Millions of Canadian dollars) Q3/12 Q2/12 Q1/12 Q4/11 Q3/11 Q2/11 Q1/11 2012 2011 2010 2009
9 months
Assets under administration - RBC 4
Institutional 150,000 151,200 148,400 153,600 153,100 158,500 163,000 150,000 153,600 154,300 126,000 Personal 495,100 492,700 484,100 470,300 467,600 475,800 472,800 495,100 470,300 457,700 459,500 Retail mutual funds 97,700 95,300 77,400 75,900 76,700 78,000 75,400 97,700 75,900 71,800 63,300 Total assets under administration 742,800 739,200 709,900 699,800 697,400 712,300 711,200 742,800 699,800 683,800 648,800
2,670,900 2,808,800 2,709,800 2,744,400 2,831,900 2,892,700 2,881,200 2,670,900 2,744,400 2,779,500 2,484,400
Assets under management - RBC 4
Institutional 132,700 130,200 124,700 124,200 125,700 120,600 121,800 132,700 124,200 85,700 78,000 Personal 70,100 69,000 67,100 64,100 64,100 63,900 64,900 70,100 64,100 61,700 51,600 Retail mutual funds 125,000 126,200 124,500 120,400 123,300 126,700 121,400 125,000 120,400 117,300 120,100 Total assets under management 327,800 325,400 316,300 308,700 313,100 311,200 308,100 327,800 308,700 264,700 249,700
STATEMENTS OF COMPREHENSIVE INCOME IFRS IFRS(Millions of Canadian dollars) Q3/12 Q2/12 Q1/12 Q4/11 Q3/11 Q2/11 Q1/11 2012 2011 2010 2009
9 months
Net income 2,240 1,533 1,855 1,571 1,294 1,631 1,948 5,628 6,444 5,223 3,858
Other comprehensive income (loss), net of taxes
Net change in unrealized gains (losses) on available-for-sale securitiesNet unrealized gains (losses) on available-for-sale securities 121 (68) 57 (52) 191 29 (198) 110 (30) 441 662 Reclassification of net (gains) losses on available-for-sale securities to income (12) 25 (14) (2) 31 (49) 33 (1) 13 (261) 330
109 (43) 43 (54) 222 (20) (165) 109 (17) 180 992
Foreign currency translation adjustmentsUnrealized foreign currency translation gains (losses) 244 (326) 51 1,132 141 (1,402) (496) (31) (625) (1,785) (2,973) Net foreign currency translation (losses) gains from hedging activities (124) 216 (3) (647) (63) 943 484 89 717 1,479 2,399 Reclassification of losses (gains) on foreign currency translation to income 11 (1) 1 (1) - - - 11 (1) (5) 2
131 (111) 49 484 78 (459) (12) 69 91 (311) (572)
Net change in cash flow hedgesNet gains (losses) on derivatives designated as cash flow hedges 49 (64) 67 142 98 16 42 52 298 (334) 156 Reclassification of losses (gains) on derivatives designated as cash flow
hedges to income 9 8 19 47 41 19 25 36 132 82 (38) 58 (56) 86 189 139 35 67 88 430 (252) 118
Total other comprehensive income (loss), net of taxes 298 (210) 178 619 439 (444) (110) 266 504 (383) 538
Total comprehensive income 2,538 1,323 2,033 2,190 1,733 1,187 1,838 5,894 6,948 4,840 4,396
Total comprehensive income attributable to:Shareholders 2,514 1,298 2,007 2,164 1,709 1,161 1,813 5,819 6,847 n.a. n.a.Non-controlling interests 24 25 26 26 24 26 25 75 101 n.a. n.a.
2,538 1,323 2,033 2,190 1,733 1,187 1,838 5,894 6,948 n.a. n.a.
5 The acquisition of the remaining 50% stake in RBC Dexia closed on July 27, 2012 and was subsequently rebranded RBC Investor Services (RBCIS). Our third quarter reflects 100% of RBCIS's results from July 27, 2012 to July 31, 2012.
4 Amounts include securitized residential mortgages and credit cards. RBC AUA includes $37.9 billion (April 30, 2012 - $36.5 billion, July 31, 2011 - $34.7 billion) of securitized mortgages and credit card loans.
CGAAPIFRS
1 Calculated using methods intended to approximate the average of the daily balances for the period, as applicable.2 IFRS 2011 averages are calculated based on Q1/11 and Q2/11 consolidated Balance Sheet amounts, and Q3/11 and Q4/11 continuing operations amounts.3 Average total loans are reported net of allowance for loan losses. Average retail and wholesale balances are reported on a gross basis (before deducting allowance for loan losses).
Assets under administration - RBCIS 5
CGAAP
CGAAP
IFRS
IFRS
-16-3rd Quarter 2012 - Revised Supplementary Financial Information ROYAL BANK OF CANADA

AS REPORTED IN Q3 2012STATEMENTS OF CHANGES IN EQUITY IFRS IFRS(Millions of Canadian dollars) Q3/12 Q2/12 Q1/12 Q4/11 Q3/11 Q2/11 Q1/11 2012 2011 2010 2009
9 months
Preferred sharesBalance at beginning of period 4,813 4,813 4,813 4,813 4,813 4,813 4,813 4,813 4,813 4,813 2,663 Issued - - - - - - - - - - 2,150 Balance at end of period 4,813 4,813 4,813 4,813 4,813 4,813 4,813 4,813 4,813 4,813 4,813
Common sharesBalance at beginning of period 14,206 14,113 14,010 13,941 13,550 13,419 13,378 14,010 13,378 13,075 10,384 Issued 73 93 103 69 391 131 41 269 632 303 2,691 Balance at end of period 14,279 14,206 14,113 14,010 13,941 13,550 13,419 14,279 14,010 13,378 13,075
Contributed surplus Balance at beginning of period n.a. n.a. n.a. n.a. n.a. n.a. n.a. n.a. n.a. 246 242 Renounced stock appreciation rights n.a. n.a. n.a. n.a. n.a. n.a. n.a. n.a. n.a. - (7) Share-based compensation awards n.a. n.a. n.a. n.a. n.a. n.a. n.a. n.a. n.a. (9) (11) Other n.a. n.a. n.a. n.a. n.a. n.a. n.a. n.a. n.a. (1) 22 Balance at end of period n.a. n.a. n.a. n.a. n.a. n.a. n.a. n.a. n.a. 236 246
Treasury shares - preferredBalance at beginning of period (1) - - 1 (2) (2) (2) - (2) (2) (5) Sales 25 24 29 22 25 20 30 78 97 129 2,757 Purchases (26) (25) (29) (23) (22) (20) (30) (80) (95) (129) (2,754) Balance at end of period (2) (1) - - 1 (2) (2) (2) - (2) (2)
Treasury shares - commonBalance at beginning of period (21) 15 8 (62) 5 (59) (81) 8 (81) (95) (104) Sales 1,169 1,444 1,795 1,778 1,366 1,778 1,152 4,408 6,074 6,814 12,212 Purchases (1,135) (1,480) (1,788) (1,708) (1,433) (1,714) (1,130) (4,403) (5,985) (6,800) (12,203) Balance at end of period 13 (21) 15 8 (62) 5 (59) 13 8 (81) (95)
Retained earningsBalance at beginning of period 21,983 21,364 20,381 19,669 19,203 18,415 17,287 20,381 17,287 20,585 19,816 Transition adjustment - Financial instruments - - - - - - - - - - 66 Net income attributable to Shareholders 2,216 1,508 1,830 1,546 1,269 1,606 1,922 5,554 6,343 5,223 3,858 Preferred share dividends (64) (65) (64) (65) (64) (64) (65) (193) (258) (258) (233) Common share dividends (824) (822) (778) (777) (776) (713) (713) (2,424) (2,979) (2,843) (2,819) Share-based compensation awards - - (1) (16) (1) (2) (14) (1) (33) n.a. n.a.Other (1) (2) (4) 24 38 (39) (2) (7) 21 (1) (103) Balance at end of period 23,310 21,983 21,364 20,381 19,669 19,203 18,415 23,310 20,381 22,706 20,585
Other components of equityTransition adjustment - Financial instruments - - - - - - - - - 59 59 Unrealized gains and losses on available-for-sale securities 367 258 302 259 314 92 111 367 259 104 (76) Unrealized foreign currency translation gains and losses, net of hedging activities 140 9 119 71 (414) (491) (32) 140 71 (1,685) (1,374) Gains and losses on derivatives designated as cash flow hedges 248 190 246 160 (29) (169) (203) 248 160 (577) (325) Balance at end of period 755 457 667 490 (129) (568) (124) 755 490 (2,099) (1,716)
Total retained earnings and other components of equity 24,065 22,440 22,031 20,871 19,540 18,635 18,291 24,065 20,871 20,607 18,869
43,168 41,437 40,972 39,702 38,233 37,001 36,462 43,168 39,702 38,951 36,906
Non-controlling interestsBalance at beginning of period 1,773 1,758 1,761 1,749 2,088 2,053 2,094 1,761 2,094 n.a. n.a.Purchases of treasury shares - - - - (324) - - - (324) n.a. n.a.Dividends (46) - (46) - (47) - (46) (92) (93) n.a. n.a.Net income attributable to Non-controlling interests 24 25 25 25 25 25 26 74 101 n.a. n.a.Net change in unrealized gains (losses) on available-for-sales securities - - 1 - - (2) - 1 (2) n.a. n.a.Foreign currency translation adjustments - (1) 1 2 - (2) (1) - (1) n.a. n.a.Other 6 (9) 16 (15) 7 14 (20) 13 (14) n.a. n.a.Balance at end of period 1,757 1,773 1,758 1,761 1,749 2,088 2,053 1,757 1,761 n.a. n.a.
Total equity 44,925 43,210 42,730 41,463 39,982 39,089 38,515 44,925 41,463 38,951 36,906
CGAAPIFRS
-17-3rd Quarter 2012 - Revised Supplementary Financial Information ROYAL BANK OF CANADA

AS REPORTED IN Q3 2012SECURITIZATION 1
(Millions of Canadian dollars) Q3/12 Q2/12 Q1/12 Q4/11 Q3/11 Q2/11 Q1/11 2012 2011 2010 20099 months
Credit card loans 2
Opening balance 4,923 3,930 3,930 3,063 3,204 2,333 3,265 3,930 3,265 3,870 4,120 Securitized 1,216 993 - 867 - 1,257 - 2,209 2,124 1,283 - Reversal of prior securitizations - - - - (141) (386) (932) - (1,459) (1,888) (250) Closing balance 6,139 4,923 3,930 3,930 3,063 3,204 2,333 6,139 3,930 3,265 3,870
Commercial mortgages 2
Opening balance 1,472 1,504 1,531 1,560 1,588 1,661 1,705 1,531 1,705 1,916 2,159 Amortization (20) (32) (27) (29) (28) (73) (44) (79) (174) (211) (243) Closing balance 1,452 1,472 1,504 1,531 1,560 1,588 1,661 1,452 1,531 1,705 1,916
Bond participation certificates - sold Opening balance 702 735 735 723 761 906 935 735 935 1,105 1,243 Sold - - - - - - - - - - 15 Other 3 2 (33) - 12 (38) (145) (29) (31) (200) (170) (153) Closing balance 704 702 735 735 723 761 906 704 735 935 1,105
Bond participation certificates - retained Opening balance 6 6 6 6 17 19 19 6 19 55 87 Sold - - - - - - - - - - (15) Other 3 - - - - (11) (2) - - (13) (36) (17) Closing balance 6 6 6 6 6 17 19 6 6 19 55
U.S. Residential mortgages - sold 2, 4
Opening balance - 1,478 1,265 1,065 937 823 667 1,265 667 429 308 Sold - 70 257 193 144 181 198 327 716 345 229 Amortization - (20) (50) (39) (24) (19) (29) (70) (111) (75) (73) Other 3, 5 - (1,528) 6 46 8 (48) (13) (1,522) (7) (32) (35) Closing balance - - 1,478 1,265 1,065 937 823 - 1,265 667 429
U.S. residential mortgages securitized and not administered by the bank 4 - - - - - - 137 - 137 409 340
1 Beginning Q1/12, revised OSFI regulatory guidelines resulted in the exclusion of Canadian residential mortgages under the National Housing Act (NHA) mortgage-backed securities (MBS) program from regulatory securitization reporting. Under the revised guidelines, we are no longer reporting: MBS sold, MBS retained, and Impact of securitizations on net income before income taxes.2 The amounts include assets that we have securitized but continue to service.3 Other primarily relates to foreign exchange translation gains and losses. For bond participation certificates, maturity of bonds is also included in this category. 4 Amounts relate to discontinued operations.5 In Q2/12, Other includes the value of U.S. residential mortgages sold to PNC Financial Services Group, Inc.
-18-3rd Quarter 2012 - Revised Supplementary Financial Information ROYAL BANK OF CANADA
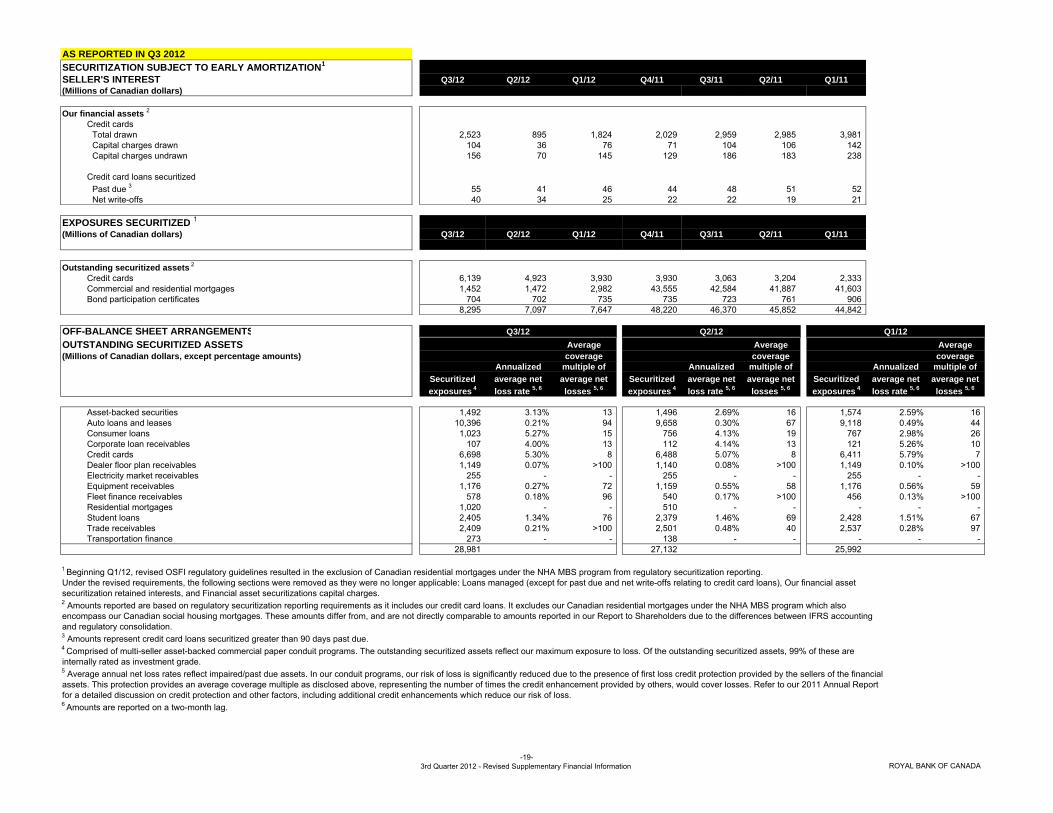
AS REPORTED IN Q3 2012SECURITIZATION SUBJECT TO EARLY AMORTIZATION 1SELLER'S INTEREST Q3/12 Q2/12 Q1/12 Q4/11 Q3/11 Q2/11 Q1/11(Millions of Canadian dollars)
Our financial assets 2Credit cards
Total drawn 2,523 895 1,824 2,029 2,959 2,985 3,981 Capital charges drawn 104 36 76 71 104 106 142 Capital charges undrawn 156 70 145 129 186 183 238
Credit card loans securitizedPast due 3 55 41 46 44 48 51 52 Net write-offs 40 34 25 22 22 19 21
EXPOSURES SECURITIZED 1(Millions of Canadian dollars) Q3/12 Q2/12 Q1/12 Q4/11 Q3/11 Q2/11 Q1/11
Outstanding securitized assets 2
Credit cards 6,139 4,923 3,930 3,930 3,063 3,204 2,333 Commercial and residential mortgages 1,452 1,472 2,982 43,555 42,584 41,887 41,603 Bond participation certificates 704 702 735 735 723 761 906
8,295 7,097 7,647 48,220 46,370 45,852 44,842
OFF-BALANCE SHEET ARRANGEMENTSOUTSTANDING SECURITIZED ASSETS Average Average Average(Millions of Canadian dollars, except percentage amounts) coverage coverage coverage
Annualized multiple of Annualized multiple of Annualized multiple of Securitized average net average net Securitized average net average net Securitized average net average net exposures 4 loss rate 5, 6 losses 5, 6 exposures 4 loss rate 5, 6 losses 5, 6 exposures 4 loss rate 5, 6 losses 5, 6
Asset-backed securities 1,492 3.13% 13 1,496 2.69% 16 1,574 2.59% 16 Auto loans and leases 10,396 0.21% 94 9,658 0.30% 67 9,118 0.49% 44 Consumer loans 1,023 5.27% 15 756 4.13% 19 767 2.98% 26 Corporate loan receivables 107 4.00% 13 112 4.14% 13 121 5.26% 10 Credit cards 6,698 5.30% 8 6,488 5.07% 8 6,411 5.79% 7 Dealer floor plan receivables 1,149 0.07% >100 1,140 0.08% >100 1,149 0.10% >100Electricity market receivables 255 - - 255 - - 255 - - Equipment receivables 1,176 0.27% 72 1,159 0.55% 58 1,176 0.56% 59 Fleet finance receivables 578 0.18% 96 540 0.17% >100 456 0.13% >100Residential mortgages 1,020 - - 510 - - - - - Student loans 2,405 1.34% 76 2,379 1.46% 69 2,428 1.51% 67 Trade receivables 2,409 0.21% >100 2,501 0.48% 40 2,537 0.28% 97 Transportation finance 273 - - 138 - - - - -
28,981 27,132 25,992
securitization retained interests, and Financial asset securitizations capital charges.
encompass our Canadian social housing mortgages. These amounts differ from, and are not directly comparable to amounts reported in our Report to Shareholders due to the differences between IFRS accountingand regulatory consolidation.
internally rated as investment grade.
for a detailed discussion on credit protection and other factors, including additional credit enhancements which reduce our risk of loss.
Q3/12 Q2/12
1 Beginning Q1/12, revised OSFI regulatory guidelines resulted in the exclusion of Canadian residential mortgages under the NHA MBS program from regulatory securitization reporting. Under the revised requirements, the following sections were removed as they were no longer applicable: Loans managed (except for past due and net write-offs relating to credit card loans), Our financial asset
Q1/12
2 Amounts reported are based on regulatory securitization reporting requirements as it includes our credit card loans. It excludes our Canadian residential mortgages under the NHA MBS program which also
6 Amounts are reported on a two-month lag.
4 Comprised of multi-seller asset-backed commercial paper conduit programs. The outstanding securitized assets reflect our maximum exposure to loss. Of the outstanding securitized assets, 99% of these are
3 Amounts represent credit card loans securitized greater than 90 days past due.
5 Average annual net loss rates reflect impaired/past due assets. In our conduit programs, our risk of loss is significantly reduced due to the presence of first loss credit protection provided by the sellers of the financial assets. This protection provides an average coverage multiple as disclosed above, representing the number of times the credit enhancement provided by others, would cover losses. Refer to our 2011 Annual Report
-19-3rd Quarter 2012 - Revised Supplementary Financial Information ROYAL BANK OF CANADA

AS REPORTED IN Q3 2012
RETAINED OR PURCHASED 1, 2, 3 Banking Trading Banking Trading Banking Trading (Millions of Canadian dollars) book book book book 4 book 4 book 4
Asset-backed securities 3,625 - 3,468 - 3,641 - Auto loans and leases 12,246 144 12,060 21 11,038 10 Commercial mortgages - 190 - 77 - 42 Consumer loans 1,023 - 756 - 767 - Credit cards 8,357 259 8,143 19 7,539 33 Dealer floor plan receivables 1,220 - 1,176 - 1,185 - Equipment receivables 1,142 - 1,159 - 1,176 - Residential mortgages 1,889 485 1,160 857 962 856 Student loans 6,803 51 6,810 36 8,526 80 Trade receivables 2,624 - 2,636 - 2,625 - Other 1,726 184 1,515 170 1,386 205
Total securitization and resecuritization exposures retained or purchased 40,655 1,313 38,883 1,180 38,845 1,226
SECURITIZATION AND RESECURITIZATION EXPOSURESRETAINED OR PURCHASED 1, 2, 3, 5
(Millions of Canadian dollars)Capital Capital Capital Capital Capital
Exposure charges Exposure charges Exposure charges Exposure charges Exposure charges
≤ 10% - - 2,747 18 26,744 155 29,491 173 200 1 > 10% ≤ 20% 1,058 17 1,218 17 3,749 43 6,025 77 556 8 > 20% ≤ 50% - - 507 16 2,876 69 3,383 85 186 5 > 50% ≤ 100% - - 80 4 183 9 263 13 9 1 > 100% ≤ 650% - - 791 406 - - 791 406 2 - > 650% < 1250% - - - - - - - - 10 4 1250 / Deduction - - 549 549 153 153 702 702 350 406
1,058 17 5,892 1,010 33,705 429 40,655 1,456 1,313 425
SECURITIZATION AND RESECURITIZATION EXPOSURESRETAINED OR PURCHASED 1, 2, 3, 5
(Millions of Canadian dollars)Capital Capital Capital Capital
Exposure charges Exposure 4 charges Exposure charges Exposure 4 charges
≤ 10% 29,592 173 140 1 27,509 160 266 2 > 10% ≤ 20% 5,243 65 351 6 7,026 98 248 3 > 20% ≤ 50% 2,918 74 156 5 2,901 78 191 6 > 50% ≤ 100% 331 18 80 5 230 13 89 6 > 100% ≤ 650% 178 86 6 3 405 163 7 3 > 650% < 1250% - - - - - - - - 1250 / Deduction 621 621 447 501 774 774 425 495
38,883 1,037 1,180 521 38,845 1,286 1,226 515
RESECURITIZATION EXPOSURES RETAINED OR PURCHASED 1, 2, 3
(Millions of Canadian dollars) Banking Trading Banking Trading Banking Trading book book book book 4 book book 4
AAA to AA- 2,970 110 2,744 115 2,653 104 A+ to A- - - 36 7 36 15 BBB+ to BB- - - - - - - BB- and below 153 17 151 - 154 - Unrated - - - 16 - -
Total resecuritization exposures retained or purchased 3,123 127 2,931 138 2,843 119
1 The amounts reported are based on the regulatory securitization reporting requirements. It includes our credit card loans. It excludes our Canadian residential mortgages under the NHA MBS program which also encompass ourCanadian social housing mortgages. These amounts differ from, and are not directly comparable to amounts reported in our Report to Shareholders due to the differences between IFRS accounting and regulatory consolidation.2 Amounts reflect regulatory exposure values.3 Securitization exposures include securities, liquidity facilities, protection provided to securitization positions, other commitments and credit enhancements.4 Comparative amounts presented have been revised from those previously reported.5 Includes securitization exposures deducted entirely from Tier 1 capital and other exposures deducted from total capital. Capital charges for Standardized approach deductions are net of ACL and partial write-offs. Capital chargesfor Rating based approach and Internal assessment approach are gross of ACL and partial write-offs.
Total securitization and resecuritization exposures retained or purchased
Q3/12
Q3/12Banking book Trading book
Standardized approach Rating based approach Internal assessment approach Total Standardized approach
SECURITIZATION AND RESECURITIZATION EXPOSURES Q3/12
Securitization exposures retained or purchased
Q3/12
Q2/12
Q2/12Trading bookBanking book
Q2/12
Total
Total securitization and resecuritization exposures retained or purchased
Q2/12
Total Total Total
Q1/12
Q1/12
Q1/12 Q1/12Banking book Trading book
-20-3rd Quarter 2012 - Revised Supplementary Financial Information ROYAL BANK OF CANADA
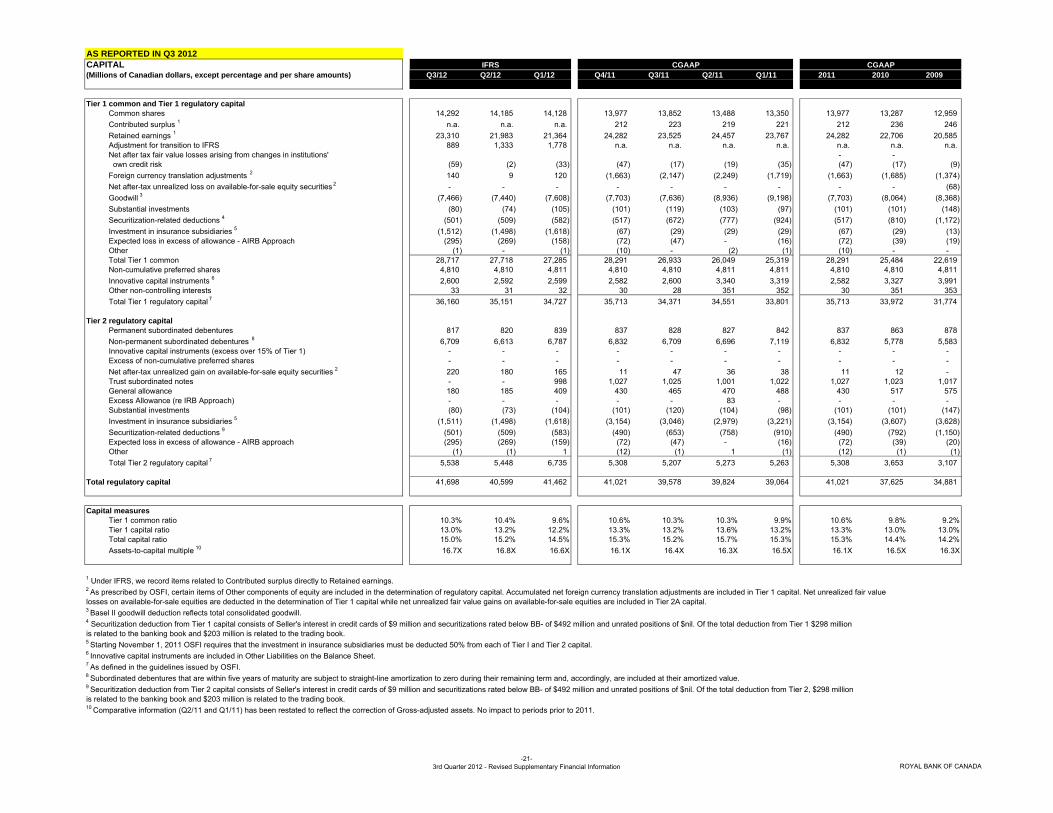
AS REPORTED IN Q3 2012CAPITAL (Millions of Canadian dollars, except percentage and per share amounts) Q3/12 Q2/12 Q1/12 Q4/11 Q3/11 Q2/11 Q1/11 2011 2010 2009
Tier 1 common and Tier 1 regulatory capital Common shares 14,292 14,185 14,128 13,977 13,852 13,488 13,350 13,977 13,287 12,959 Contributed surplus 1 n.a. n.a. n.a. 212 223 219 221 212 236 246 Retained earnings 1 23,310 21,983 21,364 24,282 23,525 24,457 23,767 24,282 22,706 20,585 Adjustment for transition to IFRS 889 1,333 1,778 n.a. n.a. n.a. n.a. n.a. n.a. n.a.Net after tax fair value losses arising from changes in institutions' - -
own credit risk (59) (2) (33) (47) (17) (19) (35) (47) (17) (9) Foreign currency translation adjustments 2 140 9 120 (1,663) (2,147) (2,249) (1,719) (1,663) (1,685) (1,374) Net after-tax unrealized loss on available-for-sale equity securities 2 - - - - - - - - - (68) Goodwill 3 (7,466) (7,440) (7,608) (7,703) (7,636) (8,936) (9,198) (7,703) (8,064) (8,368) Substantial investments (80) (74) (105) (101) (119) (103) (97) (101) (101) (148) Securitization-related deductions 4 (501) (509) (582) (517) (672) (777) (924) (517) (810) (1,172) Investment in insurance subsidiaries 5 (1,512) (1,498) (1,618) (67) (29) (29) (29) (67) (29) (13) Expected loss in excess of allowance - AIRB Approach (295) (269) (158) (72) (47) - (16) (72) (39) (19) Other (1) - (1) (10) - (2) (1) (10) - - Total Tier 1 common 28,717 27,718 27,285 28,291 26,933 26,049 25,319 28,291 25,484 22,619 Non-cumulative preferred shares 4,810 4,810 4,811 4,810 4,810 4,811 4,811 4,810 4,810 4,811 Innovative capital instruments 6 2,600 2,592 2,599 2,582 2,600 3,340 3,319 2,582 3,327 3,991 Other non-controlling interests 33 31 32 30 28 351 352 30 351 353 Total Tier 1 regulatory capital 7 36,160 35,151 34,727 35,713 34,371 34,551 33,801 35,713 33,972 31,774
Tier 2 regulatory capitalPermanent subordinated debentures 817 820 839 837 828 827 842 837 863 878 Non-permanent subordinated debentures 8 6,709 6,613 6,787 6,832 6,709 6,696 7,119 6,832 5,778 5,583 Innovative capital instruments (excess over 15% of Tier 1) - - - - - - - - - - Excess of non-cumulative preferred shares - - - - - - - - - - Net after-tax unrealized gain on available-for-sale equity securities 2 220 180 165 11 47 36 38 11 12 - Trust subordinated notes - - 998 1,027 1,025 1,001 1,022 1,027 1,023 1,017 General allowance 180 185 409 430 465 470 488 430 517 575 Excess Allowance (re IRB Approach) - - - - - 83 - - - - Substantial investments (80) (73) (104) (101) (120) (104) (98) (101) (101) (147) Investment in insurance subsidiaries 5 (1,511) (1,498) (1,618) (3,154) (3,046) (2,979) (3,221) (3,154) (3,607) (3,628) Securitization-related deductions 9 (501) (509) (583) (490) (653) (758) (910) (490) (792) (1,150) Expected loss in excess of allowance - AIRB approach (295) (269) (159) (72) (47) - (16) (72) (39) (20) Other (1) (1) 1 (12) (1) 1 (1) (12) (1) (1) Total Tier 2 regulatory capital 7 5,538 5,448 6,735 5,308 5,207 5,273 5,263 5,308 3,653 3,107
Total regulatory capital 41,698 40,599 41,462 41,021 39,578 39,824 39,064 41,021 37,625 34,881
Capital measuresTier 1 common ratio 10.3% 10.4% 9.6% 10.6% 10.3% 10.3% 9.9% 10.6% 9.8% 9.2%Tier 1 capital ratio 13.0% 13.2% 12.2% 13.3% 13.2% 13.6% 13.2% 13.3% 13.0% 13.0%Total capital ratio 15.0% 15.2% 14.5% 15.3% 15.2% 15.7% 15.3% 15.3% 14.4% 14.2%Assets-to-capital multiple 10 16.7X 16.8X 16.6X 16.1X 16.4X 16.3X 16.5X 16.1X 16.5X 16.3X
1 Under IFRS, we record items related to Contributed surplus directly to Retained earnings.2 As prescribed by OSFI, certain items of Other components of equity are included in the determination of regulatory capital. Accumulated net foreign currency translation adjustments are included in Tier 1 capital. Net unrealized fair value losses on available-for-sale equities are deducted in the determination of Tier 1 capital while net unrealized fair value gains on available-for-sale equities are included in Tier 2A capital.3 Basel II goodwill deduction reflects total consolidated goodwill.4 Securitization deduction from Tier 1 capital consists of Seller's interest in credit cards of $9 million and securitizations rated below BB- of $492 million and unrated positions of $nil. Of the total deduction from Tier 1 $298 million is related to the banking book and $203 million is related to the trading book.5 Starting November 1, 2011 OSFI requires that the investment in insurance subsidiaries must be deducted 50% from each of Tier I and Tier 2 capital. 6 Innovative capital instruments are included in Other Liabilities on the Balance Sheet.7 As defined in the guidelines issued by OSFI. 8 Subordinated debentures that are within five years of maturity are subject to straight-line amortization to zero during their remaining term and, accordingly, are included at their amortized value.9 Securitization deduction from Tier 2 capital consists of Seller's interest in credit cards of $9 million and securitizations rated below BB- of $492 million and unrated positions of $nil. Of the total deduction from Tier 2, $298 million is related to the banking book and $203 million is related to the trading book.10 Comparative information (Q2/11 and Q1/11) has been restated to reflect the correction of Gross-adjusted assets. No impact to periods prior to 2011.
CGAAPCGAAPIFRS
-21-3rd Quarter 2012 - Revised Supplementary Financial Information ROYAL BANK OF CANADA
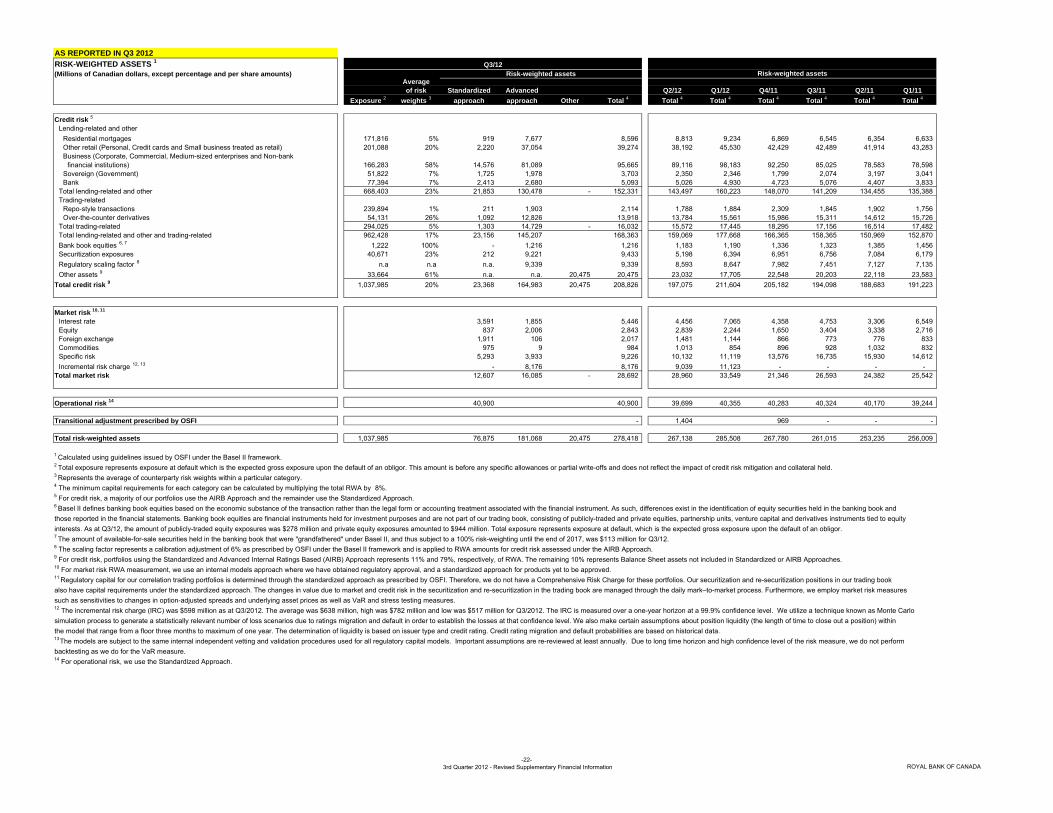
AS REPORTED IN Q3 2012RISK-WEIGHTED ASSETS 1(Millions of Canadian dollars, except percentage and per share amounts)
Averageof risk Standardized Advanced Q2/12 Q1/12 Q4/11 Q3/11 Q2/11 Q1/11
Exposure 2 weights 3 approach approach Other Total 4 Total 4 Total 4 Total 4 Total 4 Total 4 Total 4
Credit risk 5
Lending-related and otherResidential mortgages 171,816 5% 919 7,677 8,596 8,813 9,234 6,869 6,545 6,354 6,633 Other retail (Personal, Credit cards and Small business treated as retail) 201,088 20% 2,220 37,054 39,274 38,192 45,530 42,429 42,489 41,914 43,283 Business (Corporate, Commercial, Medium-sized enterprises and Non-bank
financial institutions) 166,283 58% 14,576 81,089 95,665 89,116 98,183 92,250 85,025 78,583 78,598 Sovereign (Government) 51,822 7% 1,725 1,978 3,703 2,350 2,346 1,799 2,074 3,197 3,041 Bank 77,394 7% 2,413 2,680 5,093 5,026 4,930 4,723 5,076 4,407 3,833
Total lending-related and other 668,403 23% 21,853 130,478 - 152,331 143,497 160,223 148,070 141,209 134,455 135,388 Trading-related
Repo-style transactions 239,894 1% 211 1,903 2,114 1,788 1,884 2,309 1,845 1,902 1,756 Over-the-counter derivatives 54,131 26% 1,092 12,826 13,918 13,784 15,561 15,986 15,311 14,612 15,726
Total trading-related 294,025 5% 1,303 14,729 - 16,032 15,572 17,445 18,295 17,156 16,514 17,482 Total lending-related and other and trading-related 962,428 17% 23,156 145,207 168,363 159,069 177,668 166,365 158,365 150,969 152,870 Bank book equities 6, 7 1,222 100% - 1,216 1,216 1,183 1,190 1,336 1,323 1,385 1,456 Securitization exposures 40,671 23% 212 9,221 9,433 5,198 6,394 6,951 6,756 7,084 6,179 Regulatory scaling factor 8 n.a n.a n.a. 9,339 9,339 8,593 8,647 7,982 7,451 7,127 7,135 Other assets 9 33,664 61% n.a. n.a. 20,475 20,475 23,032 17,705 22,548 20,203 22,118 23,583
Total credit risk 9 1,037,985 20% 23,368 164,983 20,475 208,826 197,075 211,604 205,182 194,098 188,683 191,223
Market risk 10, 11
Interest rate 3,591 1,855 5,446 4,456 7,065 4,358 4,753 3,306 6,549 Equity 837 2,006 2,843 2,839 2,244 1,650 3,404 3,338 2,716 Foreign exchange 1,911 106 2,017 1,481 1,144 866 773 776 833 Commodities 975 9 984 1,013 854 896 928 1,032 832 Specific risk 5,293 3,933 9,226 10,132 11,119 13,576 16,735 15,930 14,612 Incremental risk charge 12, 13 - 8,176 8,176 9,039 11,123 - - - -
Total market risk 12,607 16,085 - 28,692 28,960 33,549 21,346 26,593 24,382 25,542
Operational risk 14 40,900 40,900 39,699 40,355 40,283 40,324 40,170 39,244
Transitional adjustment prescribed by OSFI - 1,404 969 - - -
Total risk-weighted assets 1,037,985 76,875 181,068 20,475 278,418 267,138 285,508 267,780 261,015 253,235 256,009
1 Calculated using guidelines issued by OSFI under the Basel II framework. 2 Total exposure represents exposure at default which is the expected gross exposure upon the default of an obligor. This amount is before any specific allowances or partial write-offs and does not reflect the impact of credit risk mitigation and collateral held.3 Represents the average of counterparty risk weights within a particular category.4 The minimum capital requirements for each category can be calculated by multiplying the total RWA by 8%.5 For credit risk, a majority of our portfolios use the AIRB Approach and the remainder use the Standardized Approach. 6 Basel II defines banking book equities based on the economic substance of the transaction rather than the legal form or accounting treatment associated with the financial instrument. As such, differences exist in the identification of equity securities held in the banking book and those reported in the financial statements. Banking book equities are financial instruments held for investment purposes and are not part of our trading book, consisting of publicly-traded and private equities, partnership units, venture capital and derivatives instruments tied to equityinterests. As at Q3/12, the amount of publicly-traded equity exposures was $278 million and private equity exposures amounted to $944 million. Total exposure represents exposure at default, which is the expected gross exposure upon the default of an obligor.
8 The scaling factor represents a calibration adjustment of 6% as prescribed by OSFI under the Basel II framework and is applied to RWA amounts for credit risk assessed under the AIRB Approach.9 For credit risk, portfolios using the Standardized and Advanced Internal Ratings Based (AIRB) Approach represents 11% and 79%, respectively, of RWA. The remaining 10% represents Balance Sheet assets not included in Standardized or AIRB Approaches.
11 Regulatory capital for our correlation trading portfolios is determined through the standardized approach as prescribed by OSFI. Therefore, we do not have a Comprehensive Risk Charge for these portfolios. Our securitization and re-securitization positions in our trading book also have capital requirements under the standardized approach. The changes in value due to market and credit risk in the securitization and re-securitization in the trading book are managed through the daily mark–to-market process. Furthermore, we employ market risk measuressuch as sensitivities to changes in option-adjusted spreads and underlying asset prices as well as VaR and stress testing measures.
simulation process to generate a statistically relevant number of loss scenarios due to ratings migration and default in order to establish the losses at that confidence level. We also make certain assumptions about position liquidity (the length of time to close out a position) within the model that range from a floor three months to maximum of one year. The determination of liquidity is based on issuer type and credit rating. Credit rating migration and default probabilities are based on historical data.13
The models are subject to the same internal independent vetting and validation procedures used for all regulatory capital models. Important assumptions are re-reviewed at least annually. Due to long time horizon and high confidence level of the risk measure, we do not perform backtesting as we do for the VaR measure.14 For operational risk, we use the Standardized Approach.
Q3/12Risk-weighted assetsRisk-weighted assets
12 The incremental risk charge (IRC) was $598 million as at Q3/2012. The average was $638 million, high was $782 million and low was $517 million for Q3/2012. The IRC is measured over a one-year horizon at a 99.9% confidence level. We utilize a technique known as Monte Carlo
7 The amount of available-for-sale securities held in the banking book that were "grandfathered" under Basel II, and thus subject to a 100% risk-weighting until the end of 2017, was $113 million for Q3/12.
10 For market risk RWA measurement, we use an internal models approach where we have obtained regulatory approval, and a standardized approach for products yet to be approved.
-22-3rd Quarter 2012 - Revised Supplementary Financial Information ROYAL BANK OF CANADA
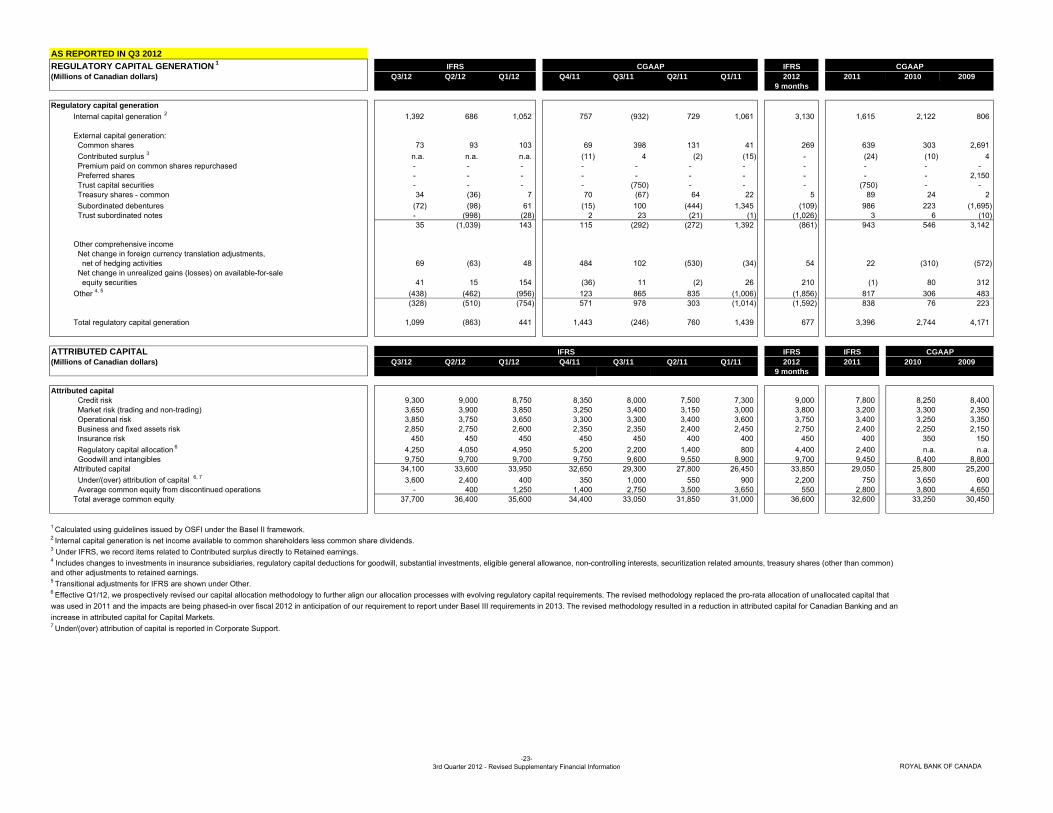
AS REPORTED IN Q3 2012REGULATORY CAPITAL GENERATION 1 IFRS(Millions of Canadian dollars) Q3/12 Q2/12 Q1/12 Q4/11 Q3/11 Q2/11 Q1/11 2012 2011 2010 2009
9 months
Regulatory capital generation Internal capital generation 2 1,392 686 1,052 757 (932) 729 1,061 3,130 1,615 2,122 806
External capital generation:Common shares 73 93 103 69 398 131 41 269 639 303 2,691 Contributed surplus 3 n.a. n.a. n.a. (11) 4 (2) (15) - (24) (10) 4 Premium paid on common shares repurchased - - - - - - - - - - - Preferred shares - - - - - - - - - - 2,150 Trust capital securities - - - - (750) - - - (750) - - Treasury shares - common 34 (36) 7 70 (67) 64 22 5 89 24 2 Subordinated debentures (72) (98) 61 (15) 100 (444) 1,345 (109) 986 223 (1,695) Trust subordinated notes - (998) (28) 2 23 (21) (1) (1,026) 3 6 (10)
35 (1,039) 143 115 (292) (272) 1,392 (861) 943 546 3,142
Other comprehensive incomeNet change in foreign currency translation adjustments,
net of hedging activities 69 (63) 48 484 102 (530) (34) 54 22 (310) (572) Net change in unrealized gains (losses) on available-for-sale
equity securities 41 15 154 (36) 11 (2) 26 210 (1) 80 312 Other 4, 5 (438) (462) (956) 123 865 835 (1,006) (1,856) 817 306 483
(328) (510) (754) 571 978 303 (1,014) (1,592) 838 76 223
Total regulatory capital generation 1,099 (863) 441 1,443 (246) 760 1,439 677 3,396 2,744 4,171
ATTRIBUTED CAPITAL IFRS IFRS(Millions of Canadian dollars) Q3/12 Q2/12 Q1/12 Q4/11 Q3/11 Q2/11 Q1/11 2012 2011 2010 2009
9 months
Attributed capitalCredit risk 9,300 9,000 8,750 8,350 8,000 7,500 7,300 9,000 7,800 8,250 8,400 Market risk (trading and non-trading) 3,650 3,900 3,850 3,250 3,400 3,150 3,000 3,800 3,200 3,300 2,350 Operational risk 3,850 3,750 3,650 3,300 3,300 3,400 3,600 3,750 3,400 3,250 3,350 Business and fixed assets risk 2,850 2,750 2,600 2,350 2,350 2,400 2,450 2,750 2,400 2,250 2,150 Insurance risk 450 450 450 450 450 400 400 450 400 350 150 Regulatory capital allocation 6 4,250 4,050 4,950 5,200 2,200 1,400 800 4,400 2,400 n.a. n.a.Goodwill and intangibles 9,750 9,700 9,700 9,750 9,600 9,550 8,900 9,700 9,450 8,400 8,800
Attributed capital 34,100 33,600 33,950 32,650 29,300 27,800 26,450 33,850 29,050 25,800 25,200 Under/(over) attribution of capital 6, 7 3,600 2,400 400 350 1,000 550 900 2,200 750 3,650 600 Average common equity from discontinued operations - 400 1,250 1,400 2,750 3,500 3,650 550 2,800 3,800 4,650
Total average common equity 37,700 36,400 35,600 34,400 33,050 31,850 31,000 36,600 32,600 33,250 30,450
1 Calculated using guidelines issued by OSFI under the Basel II framework.2 Internal capital generation is net income available to common shareholders less common share dividends.3 Under IFRS, we record items related to Contributed surplus directly to Retained earnings.4 Includes changes to investments in insurance subsidiaries, regulatory capital deductions for goodwill, substantial investments, eligible general allowance, non-controlling interests, securitization related amounts, treasury shares (other than common)and other adjustments to retained earnings.5 Transitional adjustments for IFRS are shown under Other.6 Effective Q1/12, we prospectively revised our capital allocation methodology to further align our allocation processes with evolving regulatory capital requirements. The revised methodology replaced the pro-rata allocation of unallocated capital that was used in 2011 and the impacts are being phased-in over fiscal 2012 in anticipation of our requirement to report under Basel III requirements in 2013. The revised methodology resulted in a reduction in attributed capital for Canadian Banking and an increase in attributed capital for Capital Markets.7 Under/(over) attribution of capital is reported in Corporate Support.
IFRS
IFRS
CGAAP
CGAAP
CGAAP
-23-3rd Quarter 2012 - Revised Supplementary Financial Information ROYAL BANK OF CANADA
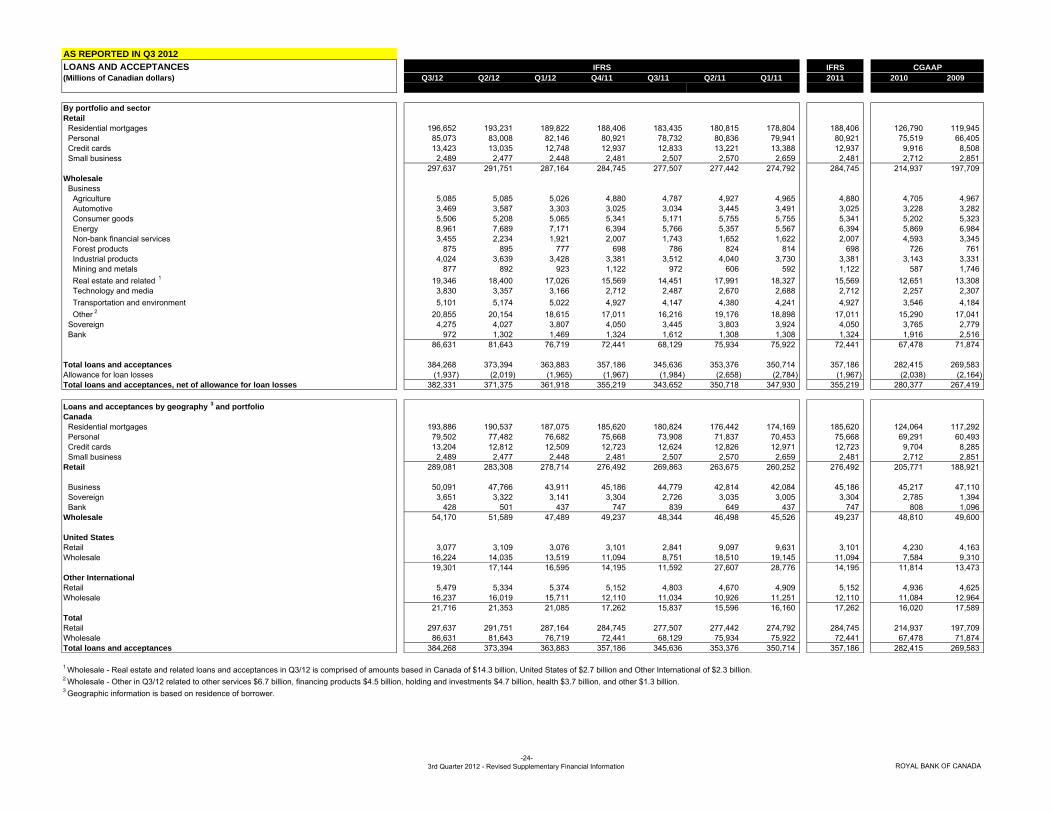
AS REPORTED IN Q3 2012LOANS AND ACCEPTANCES IFRS(Millions of Canadian dollars) Q3/12 Q2/12 Q1/12 Q4/11 Q3/11 Q2/11 Q1/11 2011 2010 2009
By portfolio and sectorRetail
Residential mortgages 196,652 193,231 189,822 188,406 183,435 180,815 178,804 188,406 126,790 119,945 Personal 85,073 83,008 82,146 80,921 78,732 80,836 79,941 80,921 75,519 66,405 Credit cards 13,423 13,035 12,748 12,937 12,833 13,221 13,388 12,937 9,916 8,508 Small business 2,489 2,477 2,448 2,481 2,507 2,570 2,659 2,481 2,712 2,851
297,637 291,751 287,164 284,745 277,507 277,442 274,792 284,745 214,937 197,709 Wholesale
BusinessAgriculture 5,085 5,085 5,026 4,880 4,787 4,927 4,965 4,880 4,705 4,967 Automotive 3,469 3,587 3,303 3,025 3,034 3,445 3,491 3,025 3,228 3,282 Consumer goods 5,506 5,208 5,065 5,341 5,171 5,755 5,755 5,341 5,202 5,323 Energy 8,961 7,689 7,171 6,394 5,766 5,357 5,567 6,394 5,869 6,984 Non-bank financial services 3,455 2,234 1,921 2,007 1,743 1,652 1,622 2,007 4,593 3,345 Forest products 875 895 777 698 786 824 814 698 726 761 Industrial products 4,024 3,639 3,428 3,381 3,512 4,040 3,730 3,381 3,143 3,331 Mining and metals 877 892 923 1,122 972 606 592 1,122 587 1,746 Real estate and related 1 19,346 18,400 17,026 15,569 14,451 17,991 18,327 15,569 12,651 13,308 Technology and media 3,830 3,357 3,166 2,712 2,487 2,670 2,688 2,712 2,257 2,307 Transportation and environment 5,101 5,174 5,022 4,927 4,147 4,380 4,241 4,927 3,546 4,184 Other 2 20,855 20,154 18,615 17,011 16,216 19,176 18,898 17,011 15,290 17,041
Sovereign 4,275 4,027 3,807 4,050 3,445 3,803 3,924 4,050 3,765 2,779 Bank 972 1,302 1,469 1,324 1,612 1,308 1,308 1,324 1,916 2,516
86,631 81,643 76,719 72,441 68,129 75,934 75,922 72,441 67,478 71,874
Total loans and acceptances 384,268 373,394 363,883 357,186 345,636 353,376 350,714 357,186 282,415 269,583 Allowance for loan losses (1,937) (2,019) (1,965) (1,967) (1,984) (2,658) (2,784) (1,967) (2,038) (2,164) Total loans and acceptances, net of allowance for loan losses 382,331 371,375 361,918 355,219 343,652 350,718 347,930 355,219 280,377 267,419
Loans and acceptances by geography 3 and portfolioCanada
Residential mortgages 193,886 190,537 187,075 185,620 180,824 176,442 174,169 185,620 124,064 117,292 Personal 79,502 77,482 76,682 75,668 73,908 71,837 70,453 75,668 69,291 60,493 Credit cards 13,204 12,812 12,509 12,723 12,624 12,826 12,971 12,723 9,704 8,285 Small business 2,489 2,477 2,448 2,481 2,507 2,570 2,659 2,481 2,712 2,851
Retail 289,081 283,308 278,714 276,492 269,863 263,675 260,252 276,492 205,771 188,921
Business 50,091 47,766 43,911 45,186 44,779 42,814 42,084 45,186 45,217 47,110 Sovereign 3,651 3,322 3,141 3,304 2,726 3,035 3,005 3,304 2,785 1,394 Bank 428 501 437 747 839 649 437 747 808 1,096
Wholesale 54,170 51,589 47,489 49,237 48,344 46,498 45,526 49,237 48,810 49,600
United StatesRetail 3,077 3,109 3,076 3,101 2,841 9,097 9,631 3,101 4,230 4,163 Wholesale 16,224 14,035 13,519 11,094 8,751 18,510 19,145 11,094 7,584 9,310
19,301 17,144 16,595 14,195 11,592 27,607 28,776 14,195 11,814 13,473 Other InternationalRetail 5,479 5,334 5,374 5,152 4,803 4,670 4,909 5,152 4,936 4,625 Wholesale 16,237 16,019 15,711 12,110 11,034 10,926 11,251 12,110 11,084 12,964
21,716 21,353 21,085 17,262 15,837 15,596 16,160 17,262 16,020 17,589 TotalRetail 297,637 291,751 287,164 284,745 277,507 277,442 274,792 284,745 214,937 197,709 Wholesale 86,631 81,643 76,719 72,441 68,129 75,934 75,922 72,441 67,478 71,874 Total loans and acceptances 384,268 373,394 363,883 357,186 345,636 353,376 350,714 357,186 282,415 269,583
1 Wholesale - Real estate and related loans and acceptances in Q3/12 is comprised of amounts based in Canada of $14.3 billion, United States of $2.7 billion and Other International of $2.3 billion.2 Wholesale - Other in Q3/12 related to other services $6.7 billion, financing products $4.5 billion, holding and investments $4.7 billion, health $3.7 billion, and other $1.3 billion.3 Geographic information is based on residence of borrower.
CGAAPIFRS
-24-3rd Quarter 2012 - Revised Supplementary Financial Information ROYAL BANK OF CANADA

AS REPORTED IN Q3 2012GROSS IMPAIRED LOANS IFRS(Millions of Canadian dollars) Q3/12 Q2/12 Q1/12 Q4/11 Q3/11 Q2/11 Q1/11 2011 2010 2009
Gross impaired loans by portfolio and sectorRetail
Residential mortgages 662 714 769 719 744 872 885 719 691 533 Personal 276 296 288 289 269 372 407 289 278 290 Small business 33 36 40 40 44 46 46 40 49 59
971 1,046 1,097 1,048 1,057 1,290 1,338 1,048 1,018 882 Wholesale
BusinessAgriculture 57 60 65 75 75 73 66 75 74 79 Automotive 23 32 38 38 43 61 63 38 97 36 Consumer goods 95 104 87 91 82 115 119 91 91 111 Energy 8 8 10 33 38 28 43 33 104 100 Non-bank financial services 2 2 1 13 12 47 50 13 28 197 Forest products 23 21 31 27 26 49 51 27 49 47 Industrial products 85 95 40 38 84 114 128 38 102 143 Mining and metals 1 5 4 4 5 7 10 4 8 18 Real estate and related 1 359 421 452 464 428 1,328 1,477 464 560 422 Technology and media 122 116 52 47 48 58 60 47 68 114 Transportation and environment 21 106 111 105 103 46 68 105 52 20 Other 2 352 314 300 311 271 411 429 311 385 514
Sovereign - - 1 - - - - - 9 10 Bank 2 33 34 33 32 32 34 33 34 62
1,150 1,317 1,226 1,279 1,247 2,369 2,598 1,279 1,661 1,873
Total gross impaired loans 2,121 2,363 2,323 2,327 2,304 3,659 3,936 2,327 2,679 2,755
Individually assessed 823 1,004 904 940 893 1,779 1,963 940 n.a. n.a.Collectively assessed 1,298 1,359 1,419 1,387 1,411 1,880 1,973 1,387 n.a. n.a.
Total gross impaired loans 2,121 2,363 2,323 2,327 2,304 3,659 3,936 2,327 n.a. n.a.
Gross impaired loans by geography 3 and portfolioCanada
Residential mortgages 481 541 584 567 582 606 599 567 544 441 Personal 197 208 204 188 188 183 186 188 174 173 Small business 33 36 40 40 44 46 46 40 49 59
Retail 711 785 828 795 814 835 831 795 767 673
Business 498 579 483 513 579 611 662 513 771 839 Sovereign - - - - - - - - - - Bank - - - - - - - - - -
Wholesale 498 579 483 513 579 611 662 513 771 839
Total - Canada 1,209 1,364 1,311 1,308 1,393 1,446 1,493 1,308 1,538 1,512
United StatesRetail 7 8 6 6 6 205 238 6 - - Wholesale 172 128 106 116 74 1,331 1,511 116 364 719
179 136 112 122 80 1,536 1,749 122 364 719 Other International
Retail 253 253 263 247 237 250 269 247 251 209 Wholesale 480 610 637 650 594 427 425 650 526 315
733 863 900 897 831 677 694 897 777 524 Total
Retail 971 1,046 1,097 1,048 1,057 1,290 1,338 1,048 1,018 882 Wholesale 1,150 1,317 1,226 1,279 1,247 2,369 2,598 1,279 1,661 1,873
Total gross impaired loans 2,121 2,363 2,323 2,327 2,304 3,659 3,936 2,327 2,679 2,755
1 Wholesale - Real estate and related Gross Impaired Loans in Q3/12 is comprised of loans based in Canada of $161 million, United States of $Nil and Other International of $198 million.2 Wholesale - Other in Q3/12 related to financing products $51 million, other services $106 million, holding and investments $25 million, health $17 million and other $153 million.3 Geographic information is based on residence of borrower.
CGAAPIFRS
-25-3rd Quarter 2012 - Revised Supplementary Financial Information ROYAL BANK OF CANADA

AS REPORTED IN Q3 2012GROSS IMPAIRED LOANS continued IFRS(Millions of Canadian dollars) Q3/12 Q2/12 Q1/12 Q4/11 Q3/11 Q2/11 Q1/11 2011 2010 2009
Changes in gross impaired loansBalance at beginning of period
Retail 1,046 1,097 1,048 1,057 1,290 1,338 1,240 1,240 882 595 Wholesale 1,317 1,226 1,279 1,247 2,369 2,598 2,951 2,951 1,873 1,140
2,363 2,323 2,327 2,304 3,659 3,936 4,191 4,191 2,755 1,735 Balance at beginning of period - discontinued operations
Retail - - - - (205) - - (222) n.a. n.a.Wholesale - - - - (1,228) - - (1,409) n.a. n.a.
- - - - (1,433) - - (1,631) n.a. n.a.New impaired 2
Retail 189 249 330 290 283 402 485 1,278 1,526 1,621 Wholesale 72 222 48 121 228 227 228 542 1,056 3,207
261 471 378 411 511 629 713 1,820 2,582 4,828 Repayments, return to performing status, sold and other 1
Retail 8 (17) (21) (23) (27) (112) (62) (127) (322) (291) Wholesale (62) (95) (56) (20) (79) (309) (410) (570) (790) (1,669)
(54) (112) (77) (43) (106) (421) (472) (697) (1,112) (1,960) Net impaired loan formation 1
Retail 197 232 309 267 256 290 423 1,151 1,204 1,330 Wholesale 10 127 (8) 101 149 (82) (182) (28) 266 1,538
207 359 301 368 405 208 241 1,123 1,470 2,868 Write-offs
Retail (272) (283) (260) (276) (284) (338) (325) (1,121) (1,068) (1,043) Wholesale (177) (36) (45) (69) (43) (147) (171) (235) (478) (805)
(449) (319) (305) (345) (327) (485) (496) (1,356) (1,546) (1,848) Balance at end of period
Retail 971 1,046 1,097 1,048 1,057 1,290 1,338 1,048 1,018 882 Wholesale 1,150 1,317 1,226 1,279 1,247 2,369 2,598 1,279 1,661 1,873
2,121 2,363 2,323 2,327 2,304 3,659 3,936 2,327 2,679 2,755
Net impaired loans by geography 2 and portfolioCanada
Residential mortgages 441 495 533 520 533 556 546 520 497 402 Personal 111 115 112 100 100 97 92 100 86 79 Small business 20 22 24 25 27 28 29 25 31 37 Retail 572 632 669 645 660 681 667 645 614 518
Business 330 402 317 334 368 407 449 334 564 577 Sovereign - - - - - - - - - - Bank - - - - - - - - - - Wholesale 330 402 317 334 368 407 449 334 564 577
United StatesRetail 6 7 5 5 5 168 194 5 - - Wholesale 129 90 86 91 63 1,148 1,285 91 279 468
135 97 91 96 68 1,316 1,479 96 279 468 Other International
Retail 145 166 182 167 157 170 184 167 168 135 Wholesale 362 407 459 480 427 302 286 480 333 194
507 573 641 647 584 472 470 647 501 329 Total
Retail 723 805 856 817 822 1,019 1,045 817 782 653 Wholesale 821 899 862 905 858 1,857 2,020 905 1,176 1,239
Total Net Impaired Loans 1,544 1,704 1,718 1,722 1,680 2,876 3,065 1,722 1,958 1,892
1 Net impaired loan formation for Canadian Banking and certain Caribbean Banking retail and wholesale portfolios are generally allocated to New impaired as Repayment, return to performing status, sold and other adjustments, as amounts are notreasonably determinable. There is no impact to total net impaired loan formation amounts.2 Geographic information is based on residence of borrower, net of allowance for impaired loans.
CGAAPIFRS
-26-3rd Quarter 2012 - Revised Supplementary Financial Information ROYAL BANK OF CANADA
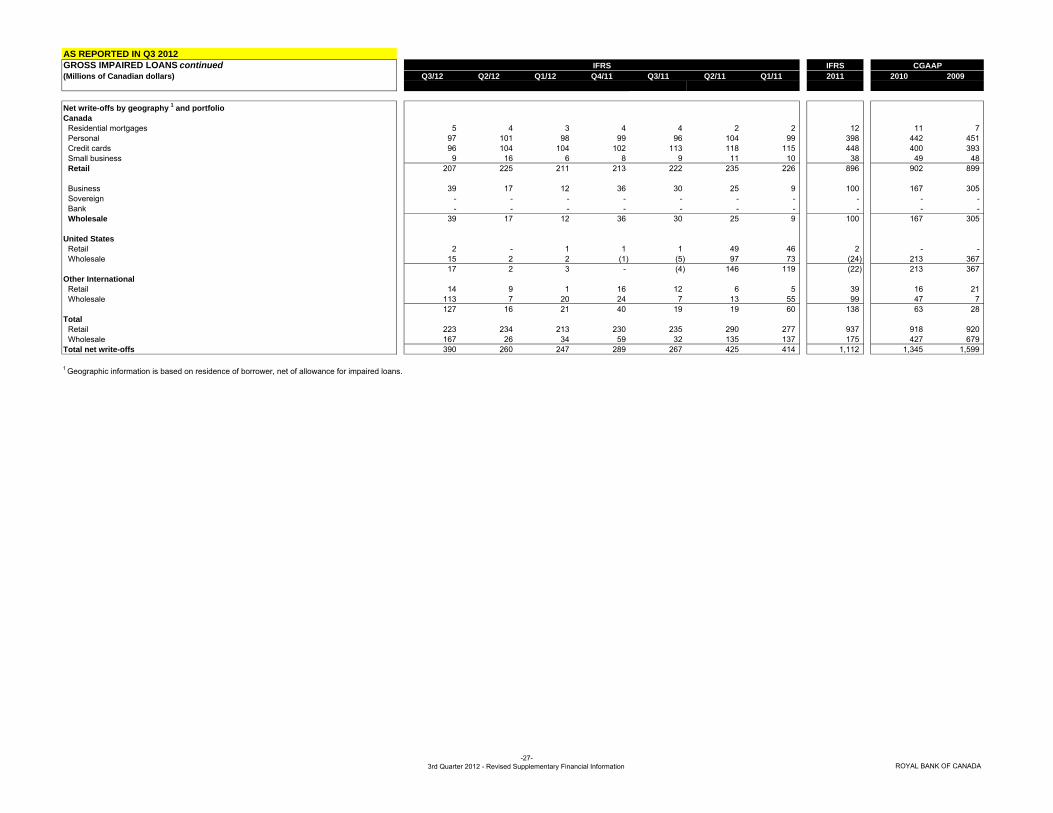
AS REPORTED IN Q3 2012GROSS IMPAIRED LOANS continued IFRS(Millions of Canadian dollars) Q3/12 Q2/12 Q1/12 Q4/11 Q3/11 Q2/11 Q1/11 2011 2010 2009
Net write-offs by geography 1 and portfolioCanada
Residential mortgages 5 4 3 4 4 2 2 12 11 7 Personal 97 101 98 99 96 104 99 398 442 451 Credit cards 96 104 104 102 113 118 115 448 400 393 Small business 9 16 6 8 9 11 10 38 49 48 Retail 207 225 211 213 222 235 226 896 902 899
Business 39 17 12 36 30 25 9 100 167 305 Sovereign - - - - - - - - - - Bank - - - - - - - - - - Wholesale 39 17 12 36 30 25 9 100 167 305
United StatesRetail 2 - 1 1 1 49 46 2 - - Wholesale 15 2 2 (1) (5) 97 73 (24) 213 367
17 2 3 - (4) 146 119 (22) 213 367 Other International
Retail 14 9 1 16 12 6 5 39 16 21 Wholesale 113 7 20 24 7 13 55 99 47 7
127 16 21 40 19 19 60 138 63 28 Total
Retail 223 234 213 230 235 290 277 937 918 920 Wholesale 167 26 34 59 32 135 137 175 427 679
Total net write-offs 390 260 247 289 267 425 414 1,112 1,345 1,599
1 Geographic information is based on residence of borrower, net of allowance for impaired loans.
CGAAPIFRS
-27-3rd Quarter 2012 - Revised Supplementary Financial Information ROYAL BANK OF CANADA
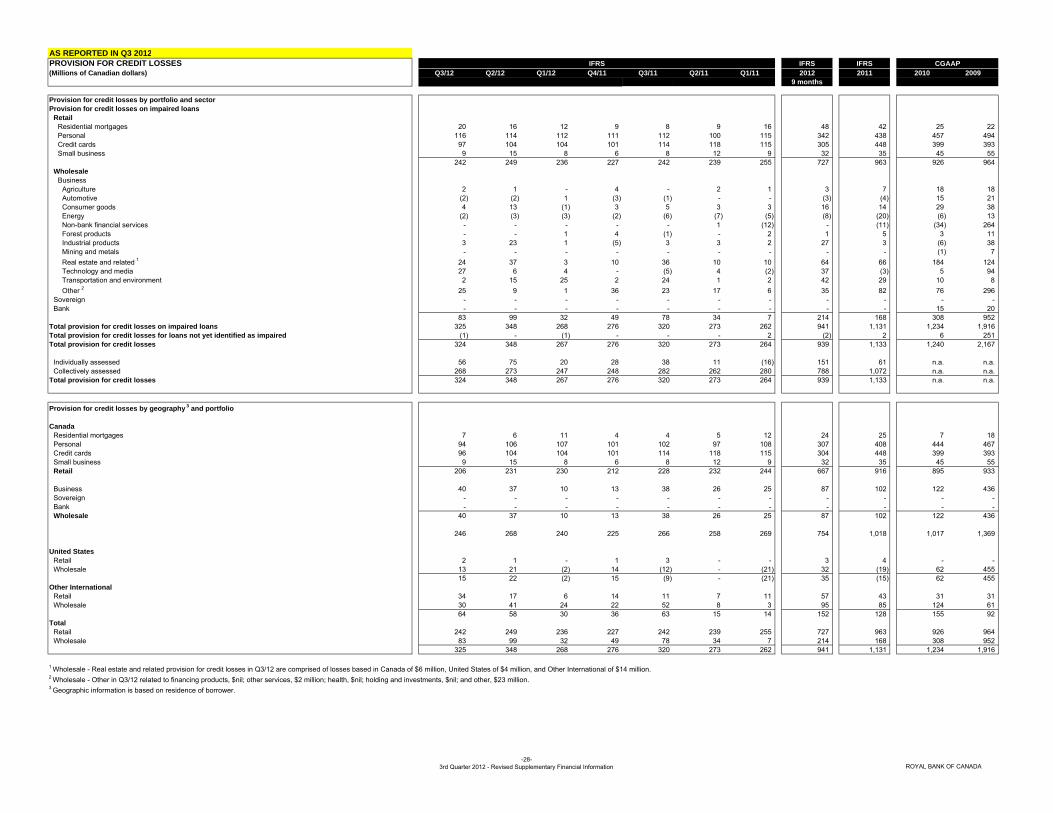
AS REPORTED IN Q3 2012PROVISION FOR CREDIT LOSSES IFRS IFRS(Millions of Canadian dollars) Q3/12 Q2/12 Q1/12 Q4/11 Q3/11 Q2/11 Q1/11 2012 2011 2010 2009
9 months
Provision for credit losses by portfolio and sectorProvision for credit losses on impaired loans
RetailResidential mortgages 20 16 12 9 8 9 16 48 42 25 22 Personal 116 114 112 111 112 100 115 342 438 457 494 Credit cards 97 104 104 101 114 118 115 305 448 399 393 Small business 9 15 8 6 8 12 9 32 35 45 55
242 249 236 227 242 239 255 727 963 926 964 Wholesale
BusinessAgriculture 2 1 - 4 - 2 1 3 7 18 18 Automotive (2) (2) 1 (3) (1) - - (3) (4) 15 21 Consumer goods 4 13 (1) 3 5 3 3 16 14 29 38 Energy (2) (3) (3) (2) (6) (7) (5) (8) (20) (6) 13 Non-bank financial services - - - - - 1 (12) - (11) (34) 264 Forest products - - 1 4 (1) - 2 1 5 3 11 Industrial products 3 23 1 (5) 3 3 2 27 3 (6) 38 Mining and metals - - - - - - - - - (1) 7 Real estate and related 1 24 37 3 10 36 10 10 64 66 184 124 Technology and media 27 6 4 - (5) 4 (2) 37 (3) 5 94 Transportation and environment 2 15 25 2 24 1 2 42 29 10 8 Other 2 25 9 1 36 23 17 6 35 82 76 296
Sovereign - - - - - - - - - - - Bank - - - - - - - - - 15 20
83 99 32 49 78 34 7 214 168 308 952 Total provision for credit losses on impaired loans 325 348 268 276 320 273 262 941 1,131 1,234 1,916 Total provision for credit losses for loans not yet identified as impaired (1) - (1) - - - 2 (2) 2 6 251 Total provision for credit losses 324 348 267 276 320 273 264 939 1,133 1,240 2,167
Individually assessed 56 75 20 28 38 11 (16) 151 61 n.a. n.a.Collectively assessed 268 273 247 248 282 262 280 788 1,072 n.a. n.a.
Total provision for credit losses 324 348 267 276 320 273 264 939 1,133 n.a. n.a.
Provision for credit losses by geography 3 and portfolio
CanadaResidential mortgages 7 6 11 4 4 5 12 24 25 7 18 Personal 94 106 107 101 102 97 108 307 408 444 467 Credit cards 96 104 104 101 114 118 115 304 448 399 393 Small business 9 15 8 6 8 12 9 32 35 45 55 Retail 206 231 230 212 228 232 244 667 916 895 933
Business 40 37 10 13 38 26 25 87 102 122 436 Sovereign - - - - - - - - - - - Bank - - - - - - - - - - - Wholesale 40 37 10 13 38 26 25 87 102 122 436
246 268 240 225 266 258 269 754 1,018 1,017 1,369
United StatesRetail 2 1 - 1 3 - - 3 4 - - Wholesale 13 21 (2) 14 (12) - (21) 32 (19) 62 455
15 22 (2) 15 (9) - (21) 35 (15) 62 455 Other International
Retail 34 17 6 14 11 7 11 57 43 31 31 Wholesale 30 41 24 22 52 8 3 95 85 124 61
64 58 30 36 63 15 14 152 128 155 92 Total
Retail 242 249 236 227 242 239 255 727 963 926 964 Wholesale 83 99 32 49 78 34 7 214 168 308 952
325 348 268 276 320 273 262 941 1,131 1,234 1,916
1 Wholesale - Real estate and related provision for credit losses in Q3/12 are comprised of losses based in Canada of $6 million, United States of $4 million, and Other International of $14 million.2 Wholesale - Other in Q3/12 related to financing products, $nil; other services, $2 million; health, $nil; holding and investments, $nil; and other, $23 million.3 Geographic information is based on residence of borrower.
CGAAPIFRS
-28-3rd Quarter 2012 - Revised Supplementary Financial Information ROYAL BANK OF CANADA
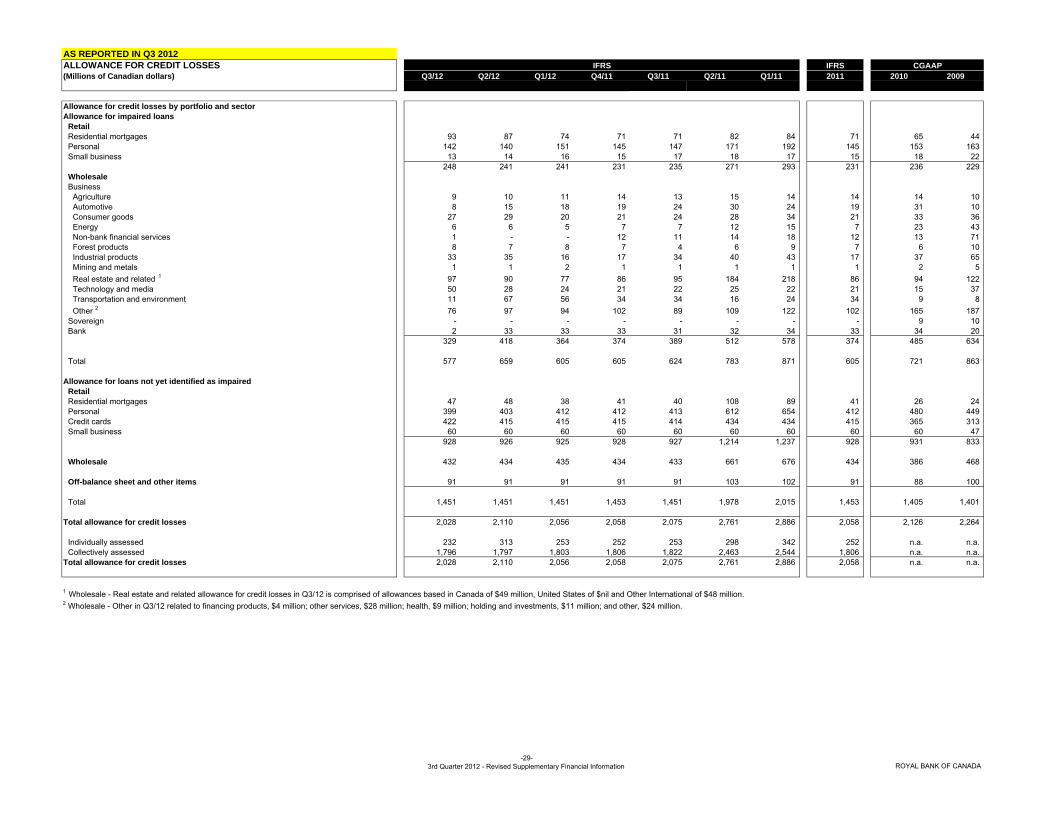
AS REPORTED IN Q3 2012ALLOWANCE FOR CREDIT LOSSES IFRS(Millions of Canadian dollars) Q3/12 Q2/12 Q1/12 Q4/11 Q3/11 Q2/11 Q1/11 2011 2010 2009
Allowance for credit losses by portfolio and sectorAllowance for impaired loans
RetailResidential mortgages 93 87 74 71 71 82 84 71 65 44 Personal 142 140 151 145 147 171 192 145 153 163 Small business 13 14 16 15 17 18 17 15 18 22
248 241 241 231 235 271 293 231 236 229 WholesaleBusiness
Agriculture 9 10 11 14 13 15 14 14 14 10 Automotive 8 15 18 19 24 30 24 19 31 10 Consumer goods 27 29 20 21 24 28 34 21 33 36 Energy 6 6 5 7 7 12 15 7 23 43 Non-bank financial services 1 - - 12 11 14 18 12 13 71 Forest products 8 7 8 7 4 6 9 7 6 10 Industrial products 33 35 16 17 34 40 43 17 37 65 Mining and metals 1 1 2 1 1 1 1 1 2 5 Real estate and related 1 97 90 77 86 95 184 218 86 94 122 Technology and media 50 28 24 21 22 25 22 21 15 37 Transportation and environment 11 67 56 34 34 16 24 34 9 8 Other 2 76 97 94 102 89 109 122 102 165 187
Sovereign - - - - - - - - 9 10 Bank 2 33 33 33 31 32 34 33 34 20
329 418 364 374 389 512 578 374 485 634
Total 577 659 605 605 624 783 871 605 721 863
Allowance for loans not yet identified as impairedRetailResidential mortgages 47 48 38 41 40 108 89 41 26 24 Personal 399 403 412 412 413 612 654 412 480 449 Credit cards 422 415 415 415 414 434 434 415 365 313 Small business 60 60 60 60 60 60 60 60 60 47
928 926 925 928 927 1,214 1,237 928 931 833
Wholesale 432 434 435 434 433 661 676 434 386 468
Off-balance sheet and other items 91 91 91 91 91 103 102 91 88 100
Total 1,451 1,451 1,451 1,453 1,451 1,978 2,015 1,453 1,405 1,401
Total allowance for credit losses 2,028 2,110 2,056 2,058 2,075 2,761 2,886 2,058 2,126 2,264
Individually assessed 232 313 253 252 253 298 342 252 n.a. n.a.Collectively assessed 1,796 1,797 1,803 1,806 1,822 2,463 2,544 1,806 n.a. n.a.
Total allowance for credit losses 2,028 2,110 2,056 2,058 2,075 2,761 2,886 2,058 n.a. n.a.
1 Wholesale - Real estate and related allowance for credit losses in Q3/12 is comprised of allowances based in Canada of $49 million, United States of $nil and Other International of $48 million.2 Wholesale - Other in Q3/12 related to financing products, $4 million; other services, $28 million; health, $9 million; holding and investments, $11 million; and other, $24 million.
CGAAPIFRS
-29-3rd Quarter 2012 - Revised Supplementary Financial Information ROYAL BANK OF CANADA
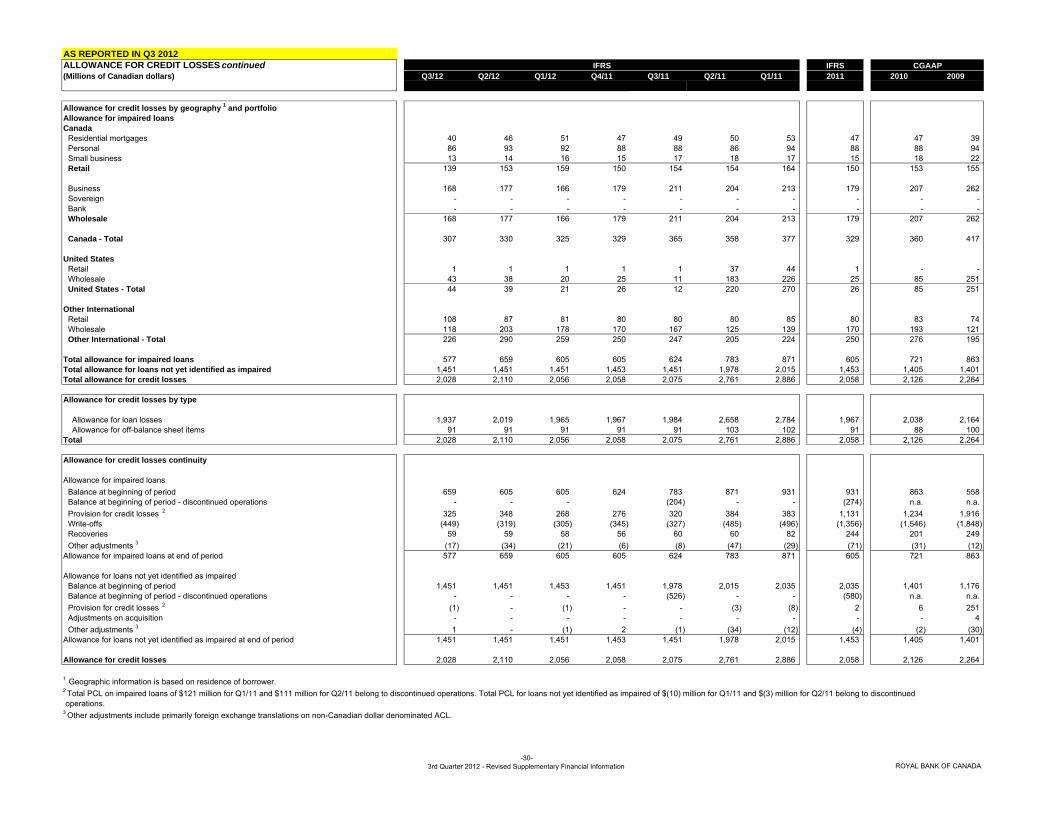
AS REPORTED IN Q3 2012ALLOWANCE FOR CREDIT LOSSES continued IFRS(Millions of Canadian dollars) Q3/12 Q2/12 Q1/12 Q4/11 Q3/11 Q2/11 Q1/11 2011 2010 2009
Allowance for credit losses by geography 1 and portfolioAllowance for impaired loans Canada
Residential mortgages 40 46 51 47 49 50 53 47 47 39 Personal 86 93 92 88 88 86 94 88 88 94 Small business 13 14 16 15 17 18 17 15 18 22 Retail 139 153 159 150 154 154 164 150 153 155
Business 168 177 166 179 211 204 213 179 207 262 Sovereign - - - - - - - - - - Bank - - - - - - - - - - Wholesale 168 177 166 179 211 204 213 179 207 262
Canada - Total 307 330 325 329 365 358 377 329 360 417
United StatesRetail 1 1 1 1 1 37 44 1 - - Wholesale 43 38 20 25 11 183 226 25 85 251 United States - Total 44 39 21 26 12 220 270 26 85 251
Other InternationalRetail 108 87 81 80 80 80 85 80 83 74 Wholesale 118 203 178 170 167 125 139 170 193 121 Other International - Total 226 290 259 250 247 205 224 250 276 195
Total allowance for impaired loans 577 659 605 605 624 783 871 605 721 863 Total allowance for loans not yet identified as impaired 1,451 1,451 1,451 1,453 1,451 1,978 2,015 1,453 1,405 1,401 Total allowance for credit losses 2,028 2,110 2,056 2,058 2,075 2,761 2,886 2,058 2,126 2,264
Allowance for credit losses by type
Allowance for loan losses 1,937 2,019 1,965 1,967 1,984 2,658 2,784 1,967 2,038 2,164 Allowance for off-balance sheet items 91 91 91 91 91 103 102 91 88 100 Total 2,028 2,110 2,056 2,058 2,075 2,761 2,886 2,058 2,126 2,264
Allowance for credit losses continuity
Allowance for impaired loansBalance at beginning of period 659 605 605 624 783 871 931 931 863 558 Balance at beginning of period - discontinued operations - - - (204) - - (274) n.a. n.a.Provision for credit losses 2 325 348 268 276 320 384 383 1,131 1,234 1,916 Write-offs (449) (319) (305) (345) (327) (485) (496) (1,356) (1,546) (1,848) Recoveries 59 59 58 56 60 60 82 244 201 249 Other adjustments 3 (17) (34) (21) (6) (8) (47) (29) (71) (31) (12)
Allowance for impaired loans at end of period 577 659 605 605 624 783 871 605 721 863
Allowance for loans not yet identified as impairedBalance at beginning of period 1,451 1,451 1,453 1,451 1,978 2,015 2,035 2,035 1,401 1,176 Balance at beginning of period - discontinued operations - - - - (526) - - (580) n.a. n.a.Provision for credit losses 2 (1) - (1) - - (3) (8) 2 6 251 Adjustments on acquisition - - - - - - - - - 4 Other adjustments 3 1 - (1) 2 (1) (34) (12) (4) (2) (30)
Allowance for loans not yet identified as impaired at end of period 1,451 1,451 1,451 1,453 1,451 1,978 2,015 1,453 1,405 1,401
Allowance for credit losses 2,028 2,110 2,056 2,058 2,075 2,761 2,886 2,058 2,126 2,264
1 Geographic information is based on residence of borrower.2 Total PCL on impaired loans of $121 million for Q1/11 and $111 million for Q2/11 belong to discontinued operations. Total PCL for loans not yet identified as impaired of $(10) million for Q1/11 and $(3) million for Q2/11 belong to discontinued operations.3 Other adjustments include primarily foreign exchange translations on non-Canadian dollar denominated ACL.
CGAAPIFRS
-30-3rd Quarter 2012 - Revised Supplementary Financial Information ROYAL BANK OF CANADA
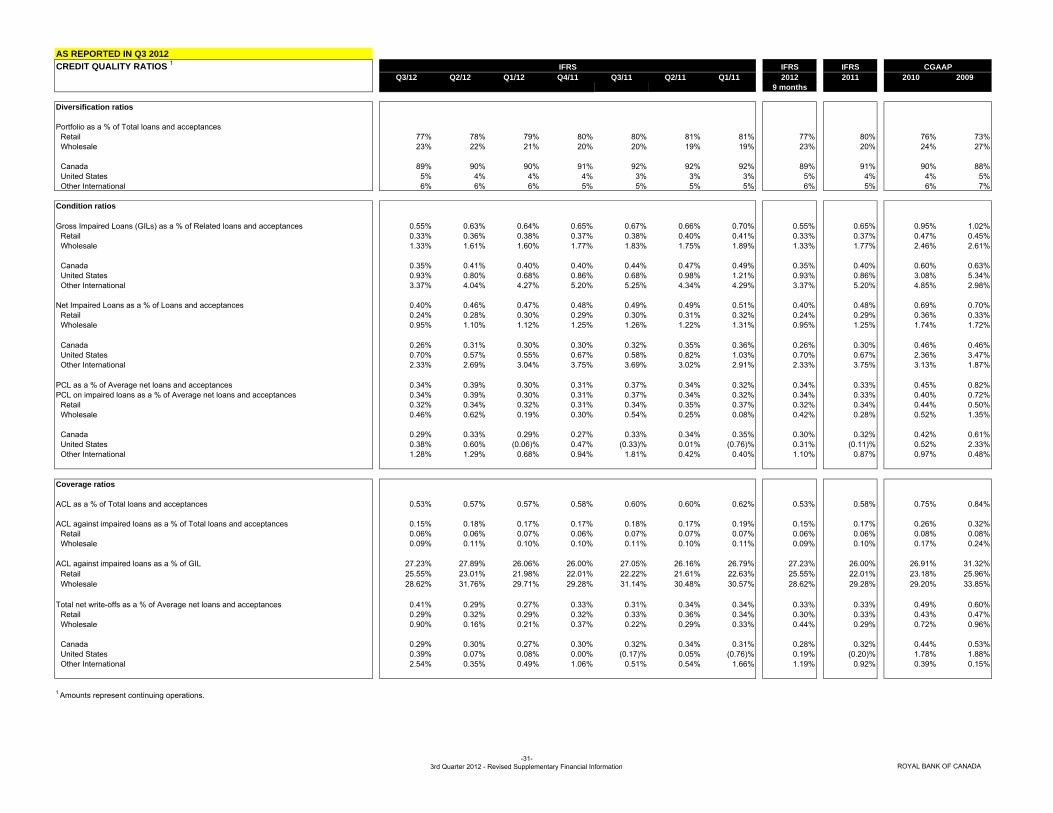
AS REPORTED IN Q3 2012CREDIT QUALITY RATIOS 1 IFRS IFRS
Q3/12 Q2/12 Q1/12 Q4/11 Q3/11 Q2/11 Q1/11 2012 2011 2010 20099 months
Diversification ratios
Portfolio as a % of Total loans and acceptancesRetail 77% 78% 79% 80% 80% 81% 81% 77% 80% 76% 73%Wholesale 23% 22% 21% 20% 20% 19% 19% 23% 20% 24% 27%
Canada 89% 90% 90% 91% 92% 92% 92% 89% 91% 90% 88%United States 5% 4% 4% 4% 3% 3% 3% 5% 4% 4% 5%Other International 6% 6% 6% 5% 5% 5% 5% 6% 5% 6% 7%
Condition ratios
Gross Impaired Loans (GILs) as a % of Related loans and acceptances 0.55% 0.63% 0.64% 0.65% 0.67% 0.66% 0.70% 0.55% 0.65% 0.95% 1.02%Retail 0.33% 0.36% 0.38% 0.37% 0.38% 0.40% 0.41% 0.33% 0.37% 0.47% 0.45%Wholesale 1.33% 1.61% 1.60% 1.77% 1.83% 1.75% 1.89% 1.33% 1.77% 2.46% 2.61%
Canada 0.35% 0.41% 0.40% 0.40% 0.44% 0.47% 0.49% 0.35% 0.40% 0.60% 0.63%United States 0.93% 0.80% 0.68% 0.86% 0.68% 0.98% 1.21% 0.93% 0.86% 3.08% 5.34%Other International 3.37% 4.04% 4.27% 5.20% 5.25% 4.34% 4.29% 3.37% 5.20% 4.85% 2.98%
Net Impaired Loans as a % of Loans and acceptances 0.40% 0.46% 0.47% 0.48% 0.49% 0.49% 0.51% 0.40% 0.48% 0.69% 0.70%Retail 0.24% 0.28% 0.30% 0.29% 0.30% 0.31% 0.32% 0.24% 0.29% 0.36% 0.33%Wholesale 0.95% 1.10% 1.12% 1.25% 1.26% 1.22% 1.31% 0.95% 1.25% 1.74% 1.72%
Canada 0.26% 0.31% 0.30% 0.30% 0.32% 0.35% 0.36% 0.26% 0.30% 0.46% 0.46%United States 0.70% 0.57% 0.55% 0.67% 0.58% 0.82% 1.03% 0.70% 0.67% 2.36% 3.47%Other International 2.33% 2.69% 3.04% 3.75% 3.69% 3.02% 2.91% 2.33% 3.75% 3.13% 1.87%
PCL as a % of Average net loans and acceptances 0.34% 0.39% 0.30% 0.31% 0.37% 0.34% 0.32% 0.34% 0.33% 0.45% 0.82%PCL on impaired loans as a % of Average net loans and acceptances 0.34% 0.39% 0.30% 0.31% 0.37% 0.34% 0.32% 0.34% 0.33% 0.40% 0.72%
Retail 0.32% 0.34% 0.32% 0.31% 0.34% 0.35% 0.37% 0.32% 0.34% 0.44% 0.50%Wholesale 0.46% 0.62% 0.19% 0.30% 0.54% 0.25% 0.08% 0.42% 0.28% 0.52% 1.35%
Canada 0.29% 0.33% 0.29% 0.27% 0.33% 0.34% 0.35% 0.30% 0.32% 0.42% 0.61%United States 0.38% 0.60% (0.06)% 0.47% (0.33)% 0.01% (0.76)% 0.31% (0.11)% 0.52% 2.33%Other International 1.28% 1.29% 0.68% 0.94% 1.81% 0.42% 0.40% 1.10% 0.87% 0.97% 0.48%
Coverage ratios
ACL as a % of Total loans and acceptances 0.53% 0.57% 0.57% 0.58% 0.60% 0.60% 0.62% 0.53% 0.58% 0.75% 0.84%
ACL against impaired loans as a % of Total loans and acceptances 0.15% 0.18% 0.17% 0.17% 0.18% 0.17% 0.19% 0.15% 0.17% 0.26% 0.32%Retail 0.06% 0.06% 0.07% 0.06% 0.07% 0.07% 0.07% 0.06% 0.06% 0.08% 0.08%Wholesale 0.09% 0.11% 0.10% 0.10% 0.11% 0.10% 0.11% 0.09% 0.10% 0.17% 0.24%
ACL against impaired loans as a % of GIL 27.23% 27.89% 26.06% 26.00% 27.05% 26.16% 26.79% 27.23% 26.00% 26.91% 31.32%Retail 25.55% 23.01% 21.98% 22.01% 22.22% 21.61% 22.63% 25.55% 22.01% 23.18% 25.96%Wholesale 28.62% 31.76% 29.71% 29.28% 31.14% 30.48% 30.57% 28.62% 29.28% 29.20% 33.85%
Total net write-offs as a % of Average net loans and acceptances 0.41% 0.29% 0.27% 0.33% 0.31% 0.34% 0.34% 0.33% 0.33% 0.49% 0.60%Retail 0.29% 0.32% 0.29% 0.32% 0.33% 0.36% 0.34% 0.30% 0.33% 0.43% 0.47%Wholesale 0.90% 0.16% 0.21% 0.37% 0.22% 0.29% 0.33% 0.44% 0.29% 0.72% 0.96%
Canada 0.29% 0.30% 0.27% 0.30% 0.32% 0.34% 0.31% 0.28% 0.32% 0.44% 0.53%United States 0.39% 0.07% 0.08% 0.00% (0.17)% 0.05% (0.76)% 0.19% (0.20)% 1.78% 1.88%Other International 2.54% 0.35% 0.49% 1.06% 0.51% 0.54% 1.66% 1.19% 0.92% 0.39% 0.15%
1 Amounts represent continuing operations.
CGAAPIFRS
-31-3rd Quarter 2012 - Revised Supplementary Financial Information ROYAL BANK OF CANADA

AS REPORTED IN Q3 2012GROSS CREDIT RISK EXPOSURE BY GEOGRAPHYAND PORTFOLIO 1, 2
(Millions of Canadian dollars) Over- Q3/12 Q2/12 Q1/12 Q4/11 Q3/11 Q2/11 Q1/11Undrawn Repo-style the-counter Total Total Total Total Total Total Total
Outstanding commitments Other 3 transactions 4, 5 derivatives 5, 6
Credit risk exposure by geography 7 and portfolio
CanadaResidential mortgages 193,886 27 - - - 193,913 190,572 187,100 185,633 180,844 176,457 174,185 Personal 79,502 68,239 24 - - 147,765 144,176 141,433 148,911 145,203 140,826 137,948 Credit cards 13,204 21,027 - - - 34,231 33,261 37,002 39,233 42,554 41,967 45,765 Small business 2,489 3,853 38 - - 6,380 6,286 6,186 6,691 6,578 6,532 6,499 Retail 289,081 93,146 62 - - 382,289 374,295 371,721 380,468 375,179 365,782 364,397
Business 50,091 22,235 10,884 42,165 4,529 129,904 128,322 110,185 111,664 107,178 105,694 109,624 Sovereign 3,651 3,490 15,772 12,440 3,481 38,834 37,616 35,429 27,838 28,378 28,237 28,765 Bank 428 66 32,046 24,320 2,363 59,223 35,995 42,012 41,299 43,359 49,327 46,851 Wholesale 54,170 25,791 58,702 78,925 10,373 227,961 201,933 187,626 180,801 178,915 183,258 185,240
Total Canada 343,251 118,937 58,764 78,925 10,373 610,250 576,228 559,347 561,269 554,094 549,040 549,637
United StatesResidential mortgages 273 - - - - 273 264 2,233 2,227 2,142 2,114 2,350 Personal 2,770 252 6 - - 3,028 3,063 9,094 8,733 8,447 8,802 9,274 Credit cards 34 226 - - - 260 256 665 653 583 571 585 Small business - - - - - - - - - - - - Retail 3,077 478 6 - - 3,561 3,583 11,992 11,613 11,172 11,487 12,209
Business 16,177 24,229 8,560 52,544 5,690 107,200 93,111 105,285 89,148 72,114 66,640 77,807 Sovereign - 1,124 2,051 354 1,542 5,071 5,192 6,232 5,438 3,763 4,387 3,710 Bank 47 246 7,786 30,225 4,577 42,881 40,629 41,767 41,125 39,128 31,268 28,991 Wholesale 16,224 25,599 18,397 83,123 11,809 155,152 138,932 153,284 135,711 115,005 102,295 110,508
Total United States 19,301 26,077 18,403 83,123 11,809 158,713 142,515 165,276 147,324 126,177 113,782 122,717
Other InternationalResidential mortgages 2,493 - - - - 2,493 2,430 2,458 2,465 2,336 2,286 2,408 Personal 2,801 309 9 - - 3,119 3,040 3,074 2,946 2,688 2,497 2,577 Credit cards 185 138 - - - 323 308 335 344 353 339 368 Small business - - - - - - - - - - - - Retail 5,479 447 9 - - 5,935 5,778 5,867 5,755 5,377 5,122 5,353
Business 15,116 8,384 5,888 38,984 5,206 73,578 80,555 81,175 68,397 61,685 67,271 59,356 Sovereign 624 324 17,065 6,841 3,762 28,616 24,243 20,484 22,721 21,502 18,813 18,153 Bank 497 144 31,133 32,021 22,981 86,776 79,138 88,745 79,579 81,015 83,724 73,533 Wholesale 16,237 8,852 54,086 77,846 31,949 188,970 183,936 190,404 170,697 164,202 169,808 151,042
Total Other International 21,716 9,299 54,095 77,846 31,949 194,905 189,714 196,271 176,452 169,579 174,930 156,395
Total exposure 384,268 154,313 131,262 239,894 54,131 963,868 908,457 920,894 885,045 849,850 837,752 828,749
1 Amounts prior to Q2/12 represent consolidated (combined continuing and discontinued) operations.2 Gross credit risk exposure is before allowance for loan losses. Exposure to Basel II asset classes of qualifying revolving retail and other retail are largely included within Personal and Credit cards, while home equity lines of credit are included in Personal.3 Includes contingent liabilities such as letters of credit and guarantees, available-for-sale debt securities and deposits with financial institutions.4 Includes repurchase and reverse repurchase agreements and securities borrowing and lending transactions.5 For trading-related credit risk, we use statistical models to derive a credit risk exposure profile by modeling the potential value of the portfolio or trades with each counterparty over its life to estimate expected credit risk exposure and expected loss.The model takes into account wrong-way risk which arises when default risk and credit exposure increase together, in which case we use the worst case exposure value. 6 Credit equivalent amount after factoring in master netting agreements.7 Based on country of residence of borrower.
IFRS
Loans and acceptances
IFRSLending-related and other Trading-related
-32-3rd Quarter 2012 - Revised Supplementary Financial Information ROYAL BANK OF CANADA
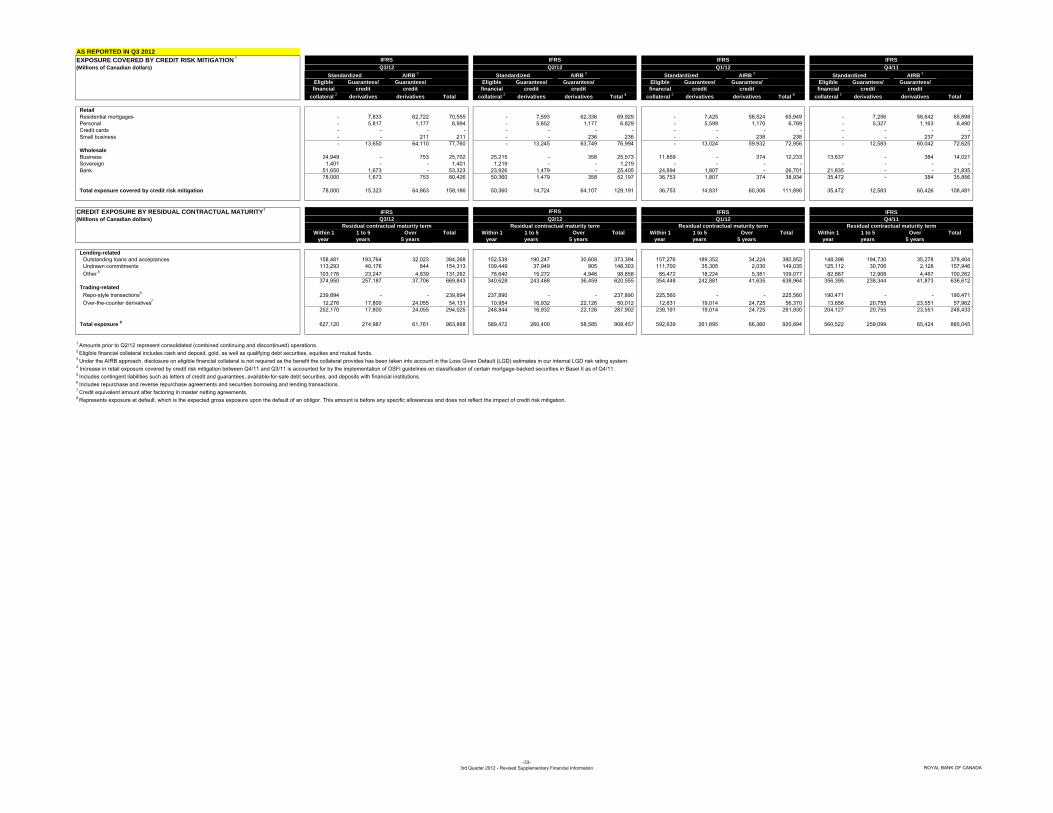
AS REPORTED IN Q3 2012EXPOSURE COVERED BY CREDIT RISK MITIGATION 1(Millions of Canadian dollars)
AIRB 3 AIRB 3 AIRB 3 AIRB 3
Eligible Guarantees/ Guarantees/ Eligible Guarantees/ Guarantees/ Eligible Guarantees/ Guarantees/ Eligible Guarantees/ Guarantees/financial credit credit financial credit credit financial credit credit financial credit credit
collateral 2 derivatives derivatives Total collateral 2 derivatives derivatives Total 4 collateral 2 derivatives derivatives Total 4 collateral 2 derivatives derivatives Total
RetailResidential mortgages - 7,833 62,722 70,555 - 7,593 62,336 69,929 - 7,425 58,524 65,949 - 7,256 58,642 65,898 Personal - 5,817 1,177 6,994 - 5,652 1,177 6,829 - 5,599 1,170 6,769 - 5,327 1,163 6,490 Credit cards - - - - - - - - - - - - - - - - Small business - - 211 211 - - 236 236 - - 238 238 - - 237 237
- 13,650 64,110 77,760 - 13,245 63,749 76,994 - 13,024 59,932 72,956 - 12,583 60,042 72,625 WholesaleBusiness 24,949 - 753 25,702 25,215 - 358 25,573 11,859 - 374 12,233 13,637 - 384 14,021 Sovereign 1,401 - - 1,401 1,219 - - 1,219 - - - - - - - - Bank 51,650 1,673 - 53,323 23,926 1,479 - 25,405 24,894 1,807 - 26,701 21,835 - - 21,835
78,000 1,673 753 80,426 50,360 1,479 358 52,197 36,753 1,807 374 38,934 35,472 - 384 35,856
Total exposure covered by credit risk mitigation 78,000 15,323 64,863 158,186 50,360 14,724 64,107 129,191 36,753 14,831 60,306 111,890 35,472 12,583 60,426 108,481
CREDIT EXPOSURE BY RESIDUAL CONTRACTUAL MATURITY 1(Millions of Canadian dollars)
Within 1 1 to 5 Over Total Within 1 1 to 5 Over Total Within 1 1 to 5 Over Total Within 1 1 to 5 Over Totalyear years 5 years year years 5 years year years 5 years year years 5 years
Lending-relatedOutstanding loans and acceptances 158,481 193,764 32,023 384,268 152,539 190,247 30,608 373,394 157,276 189,352 34,224 380,852 148,396 194,730 35,278 378,404 Undrawn commitments 113,293 40,176 844 154,313 109,449 37,949 905 148,303 111,700 35,305 2,030 149,035 125,112 30,706 2,128 157,946 Other 5 103,176 23,247 4,839 131,262 78,640 15,272 4,946 98,858 85,472 18,224 5,381 109,077 82,887 12,908 4,467 100,262
374,950 257,187 37,706 669,843 340,628 243,468 36,459 620,555 354,448 242,881 41,635 638,964 356,395 238,344 41,873 636,612 Trading-related
Repo-style transactions 6 239,894 - - 239,894 237,890 - - 237,890 225,560 - - 225,560 190,471 - - 190,471 Over-the-counter derivatives 7 12,276 17,800 24,055 54,131 10,954 16,932 22,126 50,012 12,631 19,014 24,725 56,370 13,656 20,755 23,551 57,962
252,170 17,800 24,055 294,025 248,844 16,932 22,126 287,902 238,191 19,014 24,725 281,930 204,127 20,755 23,551 248,433
Total exposure 8 627,120 274,987 61,761 963,868 589,472 260,400 58,585 908,457 592,639 261,895 66,360 920,894 560,522 259,099 65,424 885,045
1 Amounts prior to Q2/12 represent consolidated (combined continuing and discontinued) operations.2 Eligible financial collateral includes cash and deposit, gold, as well as qualifying debt securities, equities and mutual funds.3 Under the AIRB approach, disclosure on eligible financial collateral is not required as the benefit the collateral provides has been taken into account in the Loss Given Default (LGD) estimates in our internal LGD risk rating system.4 Increase in retail exposure covered by credit risk mitigation between Q4/11 and Q3/11 is accounted for by the implementation of OSFI guidelines on classification of certain mortgage-backed securities in Basel II as of Q4/11.5 Includes contingent liabilities such as letters of credit and guarantees, available-for-sale debt securities, and deposits with financial institutions.6 Includes repurchase and reverse repurchase agreements and securities borrowing and lending transactions.7 Credit equivalent amount after factoring in master netting agreements.8 Represents exposure at default, which is the expected gross exposure upon the default of an obligor. This amount is before any specific allowances and does not reflect the impact of credit risk mitigation.
IFRS IFRS IFRS IFRSQ3/12 Q2/12 Q1/12 Q4/11
Standardized Standardized Standardized Standardized
IFRS IFRS IFRS IFRSQ3/12 Q2/12 Q1/12 Q4/11
Residual contractual maturity term Residual contractual maturity term Residual contractual maturity term Residual contractual maturity term
-33-3rd Quarter 2012 - Revised Supplementary Financial Information ROYAL BANK OF CANADA
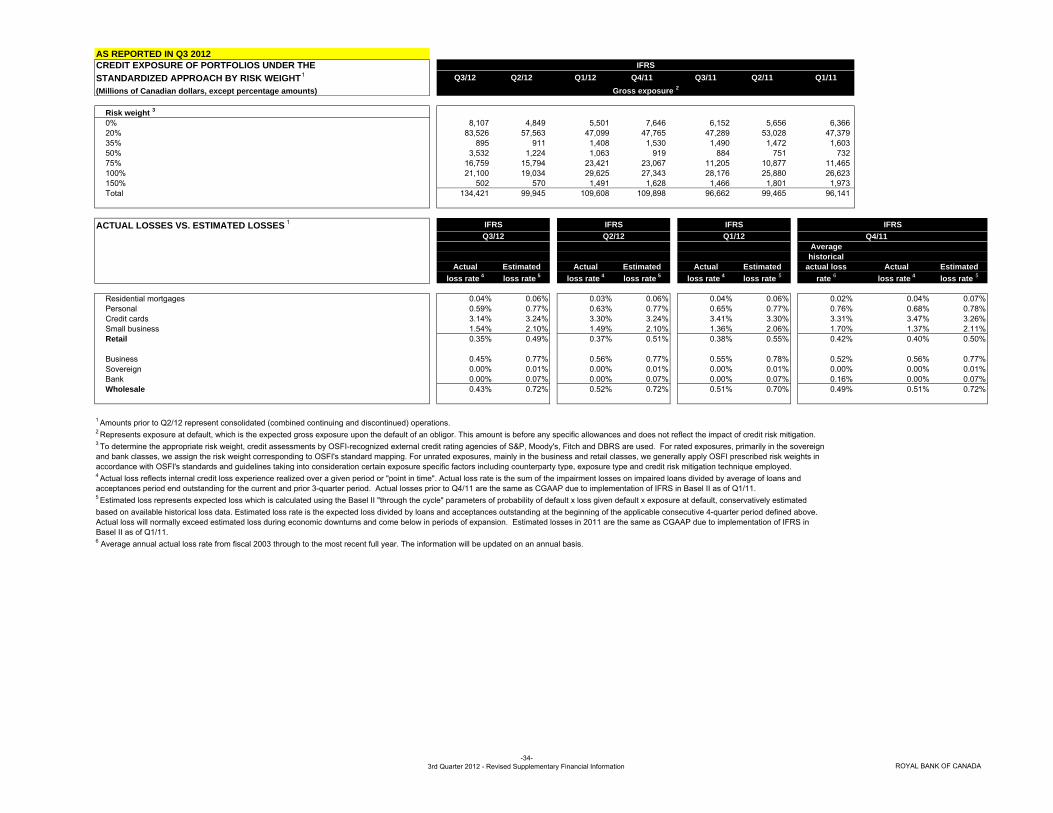
AS REPORTED IN Q3 2012CREDIT EXPOSURE OF PORTFOLIOS UNDER THE STANDARDIZED APPROACH BY RISK WEIGHT 1 Q3/12 Q2/12 Q1/12 Q4/11 Q3/11 Q2/11 Q1/11(Millions of Canadian dollars, except percentage amounts)
Risk weight 3
0% 8,107 4,849 5,501 7,646 6,152 5,656 6,366 20% 83,526 57,563 47,099 47,765 47,289 53,028 47,379 35% 895 911 1,408 1,530 1,490 1,472 1,603 50% 3,532 1,224 1,063 919 884 751 732 75% 16,759 15,794 23,421 23,067 11,205 10,877 11,465 100% 21,100 19,034 29,625 27,343 28,176 25,880 26,623 150% 502 570 1,491 1,628 1,466 1,801 1,973 Total 134,421 99,945 109,608 109,898 96,662 99,465 96,141
ACTUAL LOSSES VS. ESTIMATED LOSSES 1Q4/11
Averagehistorical
Actual Estimated Actual Estimated Actual Estimated actual loss Actual Estimatedloss rate 4 loss rate 5 loss rate 4 loss rate 5 loss rate 4 loss rate 5 rate 6 loss rate 4 loss rate 5
Residential mortgages 0.04% 0.06% 0.03% 0.06% 0.04% 0.06% 0.02% 0.04% 0.07%Personal 0.59% 0.77% 0.63% 0.77% 0.65% 0.77% 0.76% 0.68% 0.78%Credit cards 3.14% 3.24% 3.30% 3.24% 3.41% 3.30% 3.31% 3.47% 3.26%Small business 1.54% 2.10% 1.49% 2.10% 1.36% 2.06% 1.70% 1.37% 2.11%Retail 0.35% 0.49% 0.37% 0.51% 0.38% 0.55% 0.42% 0.40% 0.50%
Business 0.45% 0.77% 0.56% 0.77% 0.55% 0.78% 0.52% 0.56% 0.77%Sovereign 0.00% 0.01% 0.00% 0.01% 0.00% 0.01% 0.00% 0.00% 0.01%Bank 0.00% 0.07% 0.00% 0.07% 0.00% 0.07% 0.16% 0.00% 0.07%Wholesale 0.43% 0.72% 0.52% 0.72% 0.51% 0.70% 0.49% 0.51% 0.72%
1 Amounts prior to Q2/12 represent consolidated (combined continuing and discontinued) operations.
and bank classes, we assign the risk weight corresponding to OSFI's standard mapping. For unrated exposures, mainly in the business and retail classes, we generally apply OSFI prescribed risk weights in accordance with OSFI's standards and guidelines taking into consideration certain exposure specific factors including counterparty type, exposure type and credit risk mitigation technique employed.
acceptances period end outstanding for the current and prior 3-quarter period. Actual losses prior to Q4/11 are the same as CGAAP due to implementation of IFRS in Basel II as of Q1/11.
based on available historical loss data. Estimated loss rate is the expected loss divided by loans and acceptances outstanding at the beginning of the applicable consecutive 4-quarter period defined above. Actual loss will normally exceed estimated loss during economic downturns and come below in periods of expansion. Estimated losses in 2011 are the same as CGAAP due to implementation of IFRS in Basel II as of Q1/11.6 Average annual actual loss rate from fiscal 2003 through to the most recent full year. The information will be updated on an annual basis.
2 Represents exposure at default, which is the expected gross exposure upon the default of an obligor. This amount is before any specific allowances and does not reflect the impact of credit risk mitigation.3 To determine the appropriate risk weight, credit assessments by OSFI-recognized external credit rating agencies of S&P, Moody's, Fitch and DBRS are used. For rated exposures, primarily in the sovereign
4 Actual loss reflects internal credit loss experience realized over a given period or "point in time". Actual loss rate is the sum of the impairment losses on impaired loans divided by average of loans and
5 Estimated loss represents expected loss which is calculated using the Basel II "through the cycle" parameters of probability of default x loss given default x exposure at default, conservatively estimated
IFRSQ2/12
IFRS
Gross exposure 2
IFRSQ1/12
IFRSIFRSQ3/12
-34-3rd Quarter 2012 - Revised Supplementary Financial Information ROYAL BANK OF CANADA

AS REPORTED IN Q3 2012RETAIL CREDIT EXPOSUREBY PORTFOLIO AND RISK CATEGORY 1(Millions of Canadian dollars, except percentage) Residential Credit Small Residential Credit Small
mortgages Personal cards business Total mortgages Personal cards business Total
Low risk (0.00%-1.00%) 164,302 131,141 27,898 3,184 326,525 160,679 127,492 25,375 3,111 316,657 Medium risk (1.10%-6.40%) 24,882 18,952 5,932 2,177 51,943 24,887 18,718 7,233 2,183 53,021 High risk (6.50%-99.99%) 6,833 3,543 984 986 12,346 6,986 3,773 1,217 956 12,932 Impaired (100%) 662 276 - 33 971 714 296 - 36 1,046 Total exposure 2 196,679 153,912 34,814 6,380 391,785 193,266 150,279 33,825 6,286 383,656
WHOLESALE CREDIT EXPOSUREBY PORTFOLIO AND RISK RATING 1
(Millions of Canadian dollars, except percentage) Undrawn Average Average Average Undrawn Average Average Averagecommitments probability loss given exposure Average commitments probability loss given exposure Average
Total (Notional of default at default risk Total (Notional of default at default riskexposure 3 amount) default 4 rate 4 rate 4 weight 4 exposure 3 amount) default 4 rate 4 rate 4 weight 4
(%) (%) (%) (%) (%) (%) (%) (%)
INTERNAL RATING 5
Business 1-4 7,422 8,196 0.02% 20.83% 62.23% 10.18% 7,403 8,053 0.02% 20.67% 61.94% 10.39%5-7 14,026 20,378 0.07% 41.10% 61.22% 25.52% 13,246 20,269 0.07% 41.84% 60.51% 25.73%8-10 41,917 45,198 0.27% 40.35% 60.18% 52.69% 40,291 42,789 0.27% 39.77% 60.34% 52.31%11-13 48,704 35,819 1.20% 32.43% 36.72% 74.48% 44,327 33,607 1.18% 32.34% 34.59% 75.50%14-16 20,838 13,645 3.93% 34.00% 47.27% 97.20% 19,120 12,469 3.90% 32.48% 36.61% 94.33%17-20 2,177 1,417 14.11% 34.80% 37.00% 149.31% 1,900 1,283 13.85% 31.61% 35.72% 135.44%21-22 1,148 85 100.00% 31.20% 96.73% 1,284 147 100.00% 35.49% 128.69%
Total Business 136,232 124,738 2.17% 35.40% 55.19% 64.10% 127,571 118,617 2.30% 35.04% 54.12% 63.48%
Sovereign 1-4 3,798 10,883 0.01% 14.71% 33.43% 1.50% 3,872 11,358 0.01% 14.99% 32.45% 1.51%5-7 3,751 3,911 0.03% 32.73% 39.24% 8.26% 3,485 3,725 0.03% 34.31% 41.18% 8.32%8-10 1,333 1,297 0.16% 33.80% 55.81% 38.71% 1,396 1,065 0.14% 31.00% 57.77% 36.11%11-13 312 379 0.99% 22.29% 39.52% 51.86% 187 487 1.00% 33.06% 35.35% 30.21%14-16 18 11 4.74% 34.08% 25.61% 99.64% 25 8 4.47% 34.27% 22.13% 95.34%17-20 1 3 29.84% 0.51% 24.20% 100.99% 2 3 26.33% 11.97% 22.85% 123.84%21-22 - - - -
Total Sovereign 9,213 16,484 0.09% 25.10% 37.43% 11.54% 8,967 16,646 0.08% 25.42% 37.19% 10.43%
Bank1-4 102 111 0.03% 44.94% 9.62% 7.57% 74 101 0.03% 44.99% 9.69% 17.03%5-7 1,002 1,396 0.05% 41.95% 46.38% 14.41% 815 690 0.05% 40.86% 48.82% 13.60%8-10 182 394 0.13% 44.95% 38.01% 22.82% 550 458 0.15% 38.75% 37.93% 20.63%11-13 69 300 0.34% 29.48% 19.99% 49.80% 80 249 0.35% 38.69% 13.79% 43.65%14-16 69 131 1.27% 49.31% 37.11% 115.70% 32 87 1.04% 39.11% 35.37% 64.61%17-20 2 10 9.97% 5.32% 9.91% 20.55% 3 17 10.00% 8.73% 10.00% 34.10%21-22 2 - 100.00% 45.00% 188.19% 33 - 100.00% 25.00% 50.00%
Total Bank 1,428 2,342 0.29% 42.25% 41.35% 21.85% 1,587 1,602 2.22% 39.79% 40.48% 19.53%
asset classes of qualifying revolving retail and other retail are largely included within Personal and Credit cards, while home equity lines of credit are included in Personal.
impact of credit risk mitigation.
expected to be drawn in the event of a default.
2 Total exposure represents exposure at default, which is the expected gross exposure upon the default of an obligor. This amount is before any specific allowances and does not reflect the impact of credit risk mitigation such as guarantees. Exposure under Basel II
3 Total exposure includes loans and acceptances outstanding and undrawn commitments and represents exposure at default, which is the expected gross exposure upon the default of an obligor. This amount is before any specific allowances and does not reflect the
4 Represents the exposure-weighted average of probability of default, loss given default rate, exposure at default (EAD) rate and risk weight within each internal rating. EAD rate is a percentage of undrawn commitments (notional amount) that is currently undrawn but
5 Ratings 8-10 or above are regarded as investment grade while ratings 11-13 or below to 17-20 inclusive are non-investment grade. Ratings 21-22 represent impaired/default.
IFRS IFRSQ3/12 Q2/12
IFRS IFRSQ3/12 Q2/12
-35-3rd Quarter 2012 - Revised Supplementary Financial Information ROYAL BANK OF CANADA

AS REPORTED IN Q3 2012REALIZED GAINS AND LOSSES ON AVAILABLE-FOR-SALE IFRSSECURITIES Q3/12 Q2/12 Q1/12 Q4/11 Q3/11 Q2/11 Q1/11 2011 2010 2009(Millions of Canadian dollars)
Realized gains 59 53 38 31 84 125 68 308 366 290 Realized losses and writedowns (17) (69) (17) (25) (13) (67) (89) (194) (320) (895) Net gains (losses) on Available-for-sale securities 42 (16) 21 6 71 58 (21) 114 46 (605) Less: Amount booked in Insurance premium, investment and fee income - 1 6 8 7 - (5) 10 8 6 Net gains (losses) on Available-for-sale securities net of Insurance premium, investment and fee income 42 (17) 15 (2) 64 58 (16) 104 38 (611)
TRADING CREDIT DERIVATIVES 1(Millions of Canadian dollars) Q3/12 Q2/12 Q1/12 Q4/11 Q3/11 Q2/11 Q1/11
Notional amountProtection purchased 8,785 8,691 9,554 24,284 24,726 24,313 24,007 Protection sold 6,742 7,410 8,311 21,352 22,748 21,578 22,533
Fair value 2
Positive 379 436 496 599 668 750 867 Negative 402 435 517 815 709 781 918
Replacement cost 3 167 195 258 291 378 319 390
OTHER THAN TRADING CREDIT DERIVATIVES POSITIONS 4
(NOTIONAL AMOUNT AND FAIR VALUE) Q3/12 Q2/12 Q1/12 Q4/11 Q3/11 Q2/11 Q1/11(Millions of Canadian dollars)
Notional amountAutomotive 90 133 135 135 129 128 135 Energy 90 89 90 140 215 213 225 Non-bank financial services 929 936 876 887 953 698 703 Mining & metals - - - - - - 40 Real estate & related - - 20 68 66 66 68 Technology & media 15 15 15 15 14 - - Transportation & environment 296 269 313 321 291 290 205 Other 5 20 45 45 45 43 43 45 Sovereign 60 60 61 76 92 92 98 Bank 216 212 216 214 205 203 215
Net protection purchased 1,716 1,759 1,771 1,901 2,008 1,733 1,734 Offsetting protection sold related to the same reference entity - - - - - - - Gross protection purchased 1,716 1,759 1,771 1,901 2,008 1,733 1,734
Net protection sold - - - - - - - Offsetting protection purchased related to the same reference entity - - - - - - - Gross protection sold - - - - - - -
Gross protection purchased and sold (notional amount) 1,716 1,759 1,771 1,901 2,008 1,733 1,734
Fair value 2
Positive 17 20 24 41 12 4 6 Negative 23 26 21 19 28 37 28
1 Comprises credit default swaps, total return swaps and credit default baskets. As at Q3/12, over 97% of our net exposures are with investment grade counterparties.2 Gross fair value before netting.3 Replacement cost includes the impact of netting but excludes collateral.4 Comprises credit default swaps.5 As at Q3/12, Other related to health $20 million, and other $nil million.
IFRS
IFRS
IFRS
CGAAP
-36-3rd Quarter 2012 - Revised Supplementary Financial Information ROYAL BANK OF CANADA

AS REPORTED IN Q3 2012FAIR VALUE OF DERIVATIVE INSTRUMENTS (Millions of Canadian dollars)
Positive Negative Positive Negative Positive Negative Positive Negative
Held or issued for trading purposes 129,618 136,368 107,490 113,736 125,370 131,074 115,209 117,568
Held or issued for other than trading purposes 4,142 1,885 4,180 1,548 5,383 1,789 4,629 1,867
Total gross fair values before netting1 133,760 138,253 111,670 115,284 130,753 132,863 119,838 119,435 Impact of master netting agreements
With intent to settle net or simultaneously 2 (29,854) (29,433) (23,215) (23,180) (26,815) (26,100) (19,440) (18,913) Without intent to settle net or simultaneously3 (75,416) (75,416) (63,714) (63,714) (74,024) (74,024) (70,630) (70,630)
Total 28,490 33,404 24,741 28,390 29,914 32,739 29,768 29,892
DERIVATIVE-RELATED CREDIT RISK (Millions of Canadian dollars)
Credit Risk- Credit Risk- Credit Risk- Credit Risk-Notional Replacement equivalent adjusted Notional Replacement equivalent adjusted Notional Replacement equivalent adjusted Notional Replacement equivalent adjustedamount 5 cost amount balance 6 amount 5 cost amount balance 6 amount 5 cost amount balance 6 amount 5 cost amount balance 6
Interest rate contractsForward rate agreements 593,582 90 284 93 550,445 51 330 88 807,566 186 640 151 908,107 173 782 184 Swaps 4,260,001 17,343 14,422 6,019 4,148,016 14,725 15,723 6,182 4,131,034 17,974 18,355 7,123 4,358,674 15,275 18,058 6,666 Options purchased 109,173 234 424 154 112,372 184 331 120 105,998 199 339 118 97,584 198 344 121
4,962,756 17,667 15,130 6,266 4,810,833 14,960 16,384 6,390 5,044,598 18,359 19,334 7,392 5,364,365 15,646 19,184 6,971 Foreign exchange contracts
Forward contracts 950,907 3,559 8,134 2,068 826,191 2,388 6,775 1,588 844,004 3,535 8,029 1,929 899,779 4,623 9,325 2,187 Swaps 523,554 2,636 11,712 2,914 524,027 2,102 12,242 2,999 500,445 2,803 12,528 3,027 512,700 3,125 13,567 3,232 Options purchased 33,908 1,096 1,846 653 31,453 1,088 1,807 617 34,223 1,244 2,031 707 35,857 1,310 2,116 738
1,508,369 7,291 21,692 5,635 1,381,671 5,578 20,824 5,204 1,378,672 7,582 22,588 5,663 1,448,336 9,058 25,008 6,157
Credit derivatives 6 15,527 167 598 261 16,102 195 452 195 17,866 258 556 246 45,775 548 1,226 399 Other contracts 7 80,063 1,007 3,952 1,756 82,529 1,669 4,492 1,995 79,912 1,583 4,407 2,199 69,449 1,322 4,553 2,401
Total derivatives 8 6,566,715 26,132 41,372 13,918 6,291,135 22,402 42,152 13,784 6,521,048 27,782 46,885 15,500 6,927,925 26,574 49,971 15,928
DERIVATIVE-RELATED CREDIT RISK (Millions of Canadian dollars)
Credit Risk- Credit Risk- Credit Risk-Notional Replacement equivalent adjusted Notional Replacement equivalent adjusted Notional Replacement equivalent adjustedamount 5 cost amount balance 6 amount 5 cost amount balance 6 amount 5 cost amount balance 6
Interest rate contractsForward rate agreements 879,754 121 742 185 858,048 51 699 127 709,506 47 544 106 Swaps 4,332,261 12,040 16,522 5,965 4,079,764 9,536 14,290 4,905 4,010,381 9,588 14,449 4,986 Options purchased 68,060 147 232 84 90,415 101 343 143 87,132 356 567 255
5,280,075 12,308 17,496 6,234 5,028,227 9,688 15,332 5,175 4,807,019 9,991 15,560 5,347 Foreign exchange contracts
Forward contracts 817,504 3,997 8,531 1,992 831,400 4,748 9,014 2,124 862,454 3,135 8,024 1,873 Swaps 502,103 4,550 14,734 3,429 488,338 5,670 15,390 3,455 484,951 3,395 13,402 3,128 Options purchased 34,297 1,254 2,006 664 52,364 1,212 2,078 672 39,068 1,096 1,834 615
1,353,904 9,801 25,271 6,085 1,372,102 11,630 26,482 6,251 1,386,473 7,626 23,260 5,616
Credit derivatives 6 47,613 402 1,152 372 46,039 340 1,080 390 46,895 410 917 353 Other contracts 7 83,741 1,421 4,692 2,565 80,814 1,895 5,148 2,796 57,978 3,425 6,522 4,292
Total derivatives 8 6,765,333 23,932 48,611 15,256 6,527,182 23,553 48,042 14,612 6,298,365 21,452 46,259 15,608
2 Impact of offsetting derivative assets and liabilities on contracts where we have both (a) unconditional and legally enforceable netting agreement in place and (b) we intend to settle the contracts on either a net basis or simultaneously. The right of setoff is considered unconditional if its exercise is not contingent upon the occurrence of a future event; it is considered conditional if it becomes exercisable only upon the occurrence of a future event, such as bankruptcy, insolvency, default, or change in control. For Q3/12, the net derivative balance was further netted by $421 million against the margins balance.3 Additional impact of offsetting credit exposures on contracts where we have a legally enforceable master netting agreement in place but do not intend to settle the contracts on a net basis or simultaneously. 4 As at Q3/12, the notional amounts exclude exchange traded of $460.9 billion, over-the-counter options written of $176.9 billion, and non-trading credit derivatives of $1.7 billion.
6 Comprises credit default swaps, total return swaps and credit default baskets. The above excludes credit derivatives issued for other-than-trading purposes related to bought and sold protection with a replacement cost of $17 million as at Q3/12. 7 Comprises precious metal, commodity stable value and equity-linked derivative contracts. 8 As at Q3/12, the total credit equivalent amount after netting includes collateral applied of $12.8 billion.
5 Calculated using guidelines issued by OSFI under the BASEL II framework.
IFRS IFRS CGAAPQ3/11 Q2/11 Q1/11
1 For the remaining instruments, these adjustments are determined on a pooled basis and thus, have been excluded. As at Q3/12, positive fair values exclude market and credit valuation adjustments of $649 million.
Q3/12 Q2/12 Q1/12 Q4/11IFRS IFRS IFRS IFRS
Fair value Fair value Fair value Fair valueQ3/12 Q2/12 Q1/12 Q4/11IFRS IFRS IFRS IFRS
-37-3rd Quarter 2012 - Revised Supplementary Financial Information ROYAL BANK OF CANADA

REVISED FROM Q3 2012CALCULATION OF ROE AND RORC IFRS IFRS(Millions of Canadian dollars, except percentage and per share amounts) Q3/12 Q2/12 Q1/12 Q4/11 Q3/11 Q2/11 Q1/11 2012 2011 2010 2009
9 months
Personal & Commercial BankingNet income available to common shareholders 1,079 917 987 921 858 901 964 2,983 3,644 3,016 2,678 Average risk capital 8,700 9,050 9,250 9,750 8,150 7,450 6,950 9,000 8,050 7,050 6,100
Add: Average goodwill and other intangibles 3,850 3,800 3,800 3,800 3,700 3,650 3,650 3,800 3,750 3,750 3,750 Average attributed capital 12,550 12,850 13,050 13,550 11,850 11,100 10,600 12,800 11,800 10,800 9,850 ROE 1 34.2% 29.1% 30.0% 26.9% 28.7% 33.2% 35.9% 31.1% 30.9% 28.0% 27.1%RORC 49.2% 41.3% 42.4% 37.5% 41.8% 49.6% 55.0% 44.2% 45.1% 42.9% 44.0%
Canadian BankingNet income available to common shareholders 1,110 918 975 927 870 877 916 3,003 3,590 2,979 2,607 Average risk capital 7,900 8,250 8,450 8,850 7,450 6,800 6,300 8,200 7,350 6,350 5,400
Add: Average goodwill and other intangibles 2,150 2,150 2,150 2,200 2,100 2,050 2,000 2,150 2,100 2,000 1,850 Average attributed capital 10,050 10,400 10,600 11,050 9,550 8,850 8,300 10,350 9,450 8,350 7,250 ROE 1 43.8% 36.0% 36.6% 33.3% 36.0% 40.6% 43.7% 38.7% 38.0% 35.6% 35.9%RORC 55.8% 45.3% 45.8% 41.5% 46.4% 53.1% 57.7% 48.9% 48.8% 46.9% 48.4%
Wealth ManagementNet income available to common shareholders 147 203 179 169 182 217 204 529 772 640 553 Average risk capital 1,400 1,350 1,350 1,400 1,200 1,150 1,000 1,350 1,200 1,000 1,100
Add: Average goodwill and other intangibles 3,800 3,800 3,800 3,900 3,850 3,850 3,150 3,800 3,650 2,650 2,800 Average attributed capital 5,200 5,150 5,150 5,300 5,050 5,000 4,150 5,150 4,850 3,650 3,900 ROE 11.3% 16.1% 13.8% 12.7% 14.3% 17.8% 19.5% 13.7% 15.9% 17.6% 14.2%RORC 41.8% 61.8% 51.9% 47.9% 59.9% 77.3% 82.9% 51.6% 65.2% 64.6% 49.2%
InsuranceNet income available to common shareholders 176 148 187 196 138 120 133 511 587 481 518 Average risk capital 1,350 1,350 1,400 1,800 1,450 1,300 1,150 1,350 1,400 1,150 950
Add: Average goodwill and other intangibles 150 150 150 150 150 100 150 150 150 150 200 Average attributed capital 3 1,500 1,500 1,550 1,950 1,600 1,400 1,300 1,500 1,550 1,300 1,150 ROE 1 47.3% 40.6% 48.5% 40.3% 34.5% 34.8% 40.5% 45.5% 37.6% 37.2% 45.7%RORC 52.6% 45.1% 53.1% 43.3% 37.7% 38.5% 45.7% 50.4% 41.3% 42.7% 53.9%
Investor & Treasury ServicesNet income available to common shareholders 49 (124) 79 37 51 67 64 4 219 214 688 Average risk capital 1,200 1,250 1,450 900 850 850 800 1,300 850 850 800
Add: Average goodwill and other intangibles 200 250 350 300 350 350 350 250 350 200 250 Average attributed capital 3 1,400 1,500 1,800 1,200 1,200 1,200 1,150 1,550 1,200 1,050 1,050 ROE 1 13.9% (33.2)% 17.9% 12.0% 16.8% 22.8% 22.5% 0.4% 18.4% 19.7% 64.3%RORC 16.1% (40.8)% 21.5% 16.3% 23.3% 31.7% 32.1% 0.5% 25.6% 25.8% 84.6%
Capital MarketsNet income available to common shareholders 410 350 353 108 215 337 565 1,113 1,225 1,401 1,045 Average risk capital 10,500 9,800 9,400 8,000 7,050 6,550 6,650 9,900 7,050 6,700 6,600
Add: Average goodwill and other intangibles 850 900 1,000 950 950 950 1,000 900 950 950 1,100 Average attributed capital 3 11,350 10,700 10,400 8,950 8,000 7,500 7,650 10,800 8,000 7,650 7,700 ROE 1 14.3% 13.3% 13.5% 4.7% 10.6% 18.4% 29.4% 13.7% 15.2% 18.3% 13.6%RORC 15.5% 14.5% 14.9% 5.3% 12.0% 21.1% 33.6% 15.0% 17.3% 21.0% 15.9%
Corporate Support 2, 3
Net income available to common shareholders 291 (21) 2 88 150 (49) (25) 272 164 (278) (34) Average risk capital and other 2,100 1,900 2,000 1,700 1,600 1,600 1,600 2,050 1,650 1,350 1,550
Add: Average under/(over) attribution of capital 3,600 2,400 400 350 1,000 550 900 2,200 750 3,650 600 Average attributed capital 5,700 4,300 2,400 2,050 2,600 2,150 2,500 4,250 2,400 5,000 2,150
RBCNet income from continuing operations 2,240 1,563 1,876 1,609 1,683 1,682 1,996 5,679 6,970 n.a. n.a.Net income from continuing operations - CGAAP n.a. n.a. n.a. n.a. n.a. n.a. n.a. n.a. n.a. 5,732 5,681 Net (loss) from discontinued operations - (30) (21) (38) (389) (51) (48) (51) (526) (509) (1,823) Net income 2,240 1,533 1,855 1,571 1,294 1,631 1,948 5,628 6,444 5,223 3,858 Net income available to common shareholders 2,152 1,443 1,766 1,481 1,205 1,542 1,857 5,361 6,085 4,965 3,625 Average risk capital 3 24,350 24,300 25,500 24,300 21,400 20,200 19,600 24,700 21,400 19,500 18,600 Average risk capital from continuing operations 3 24,350 23,900 24,250 22,900 19,700 18,250 17,550 24,150 19,600 17,400 16,400 Average common equity 37,700 36,400 35,600 34,400 33,050 31,850 31,000 36,600 32,600 33,250 30,450 ROE 1 22.7% 16.1% 19.7% 17.1% 14.5% 19.9% 23.7% 19.6% 18.7% 14.9% 11.9%ROE from continuing operations 1 22.7% 16.5% 20.0% 17.5% 19.2% 20.5% 24.4% 19.7% 20.3% 16.5% 17.9%RORC 2 35.1% 24.2% 27.5% 24.2% 22.4% 31.3% 37.5% 29.0% 28.4% 25.4% 19.5%RORC from continuing operations 2 35.1% 25.1% 29.3% 26.3% 32.1% 35.8% 43.1% 29.9% 33.7% 31.5% 33.2%
1 Business segment ROE is based on Average attributed capital. Under/(over) attribution of capital is reported in Corporate Support2 We do not report ROE and RORC for Corporate Support as they are considered not meaningful.3 Effective Q3/12 discontinued operations are included in Corporate Support.
CGAAPIFRS
-38-3rd Quarter 2012 - Supplementary Financial Information ROYAL BANK OF CANADA

AS REPORTED IN Q3 2012GlossaryDefinition Calculations (continued)Assets under administration (AUA)Assets administered by us, which are beneficially owned by clients. Services provided in respect of assets Average common equityunder administration are of an administrative nature, including safekeeping, collecting investment income, Calculated using methods intended to approximate the average of the daily balances for the period. settling purchase and sale transactions, and record keeping. For the business segments, calculated using methods intended to approximate the average of the
daily attributed capital for the period.Assets under management (AUM)Assets managed by us, which are beneficially owned by clients. Services provided in respect of assets Average earning assetsunder management include the selection of investments and the provision of investment advice. We have The average carrying value of deposits with banks, securities, assets purchased under reverse repurchaseassets under management that are also administered by us and included in assets under administration. agreements and certain securities borrowed, and loans based on daily balances for the period.
Embedded value Average risk capitalThe sum of the value of equity held in our Insurance segment and the value of in-force business (existing policies). Calculated using methods intended to approximate the average of the daily risk capital balances
for the period. Average risk capital includes Credit, Market (trading and non-trading), Insurance, Operational, Goodwill and intangibles Business and Fixed Asset risk capital.Goodwill represents the excess of the price paid for the business acquired over the fair value of the net Average attributed capital includes risk capital plus the Goodwill and Intangible capital. identifiable assets acquired. An intangible asset is an identifiable non-monetary asset without physical substance.
Capital chargeGross-adjusted assets (GAA) Calculated by multiplying the cost of capital by the amount of average common equity. The cost of capitalGAA are used in the calculation of the Assets-to-Capital multiple. They represent our total assets including is a proxy for the after-tax return that we estimate to be required by shareholders for the use of their capital.specified off-balance sheet items and net of prescribed deductions. Off balance sheet items for this calculation The cost of capital is regularly reviewed and adjusted from time to time based on prevailing market conditions.are direct credit substitutes, including letters of credit and guarantees, transaction-related contingencies, trade-related contingencies and sale and repurchase agreements. Common equity
Common equity includes common shares, common treasury shares, retained earnings and otherTaxable equivalent basis (teb) components of equity.Income from certain specified tax-advantaged sources is increased to a level that would make it comparableto income from taxable sources. There is an offsetting adjustment in the tax provision, thereby generating Diluted EPSthe same after-tax net income. We record teb adjustments in Capital Markets and record elimination Diluted EPS is net income from continuing operations attributable to common shareholders divided adjustments in Corporate Support. by the average diluted shares outstanding. Both net income and number of shares outstanding have
been adjusted for the impact of exchangeable shares.Total trading revenueTotal trading revenue is comprised of trading related revenue recorded in Net interest income and Dividend yieldNon-interest income. Dividends per common share divided by the average of the high and low share prices in the relevant period.
Ratios Market capitalizationCapital ratios End of period common shares outstanding multiplied by the closing common share price on the Toronto The percentage of risk-adjusted assets supported by capital, using the guidelines of OSFI Stock Exchange.based on standards issued by the Bank for International Settlements and GAAP financial information.
Net interest margin (average assets)Efficiency ratio Net interest income as a percentage of total average assets.Non-interest expense as a percentage of total revenue.
Net interest margin (average earning assets)Return on assets Net interest income as a percentage of total average earning assets.Net income as a percentage of average assets.
Net write-offsTier 1 common ratio Gross write-offs less recoveries of amounts previously written off.Tier 1 capital less qualifying other non-controlling interests, less Innovative Tier 1 capital instruments less preferred shares (both net of treasury shares) divided by risk-weighted assets. This ratio is calculated Risk-weighted assets (RWA) - Basel IIconsistent with a stress testing measure used by the U.S. Federal Reserve for U.S. banks in determining Used in the calculation of risk-based capital ratios as defined by the guidelines issued by OSFI based oncapital adequacy under certain adverse scenarios, except that our calculation of Tier 1 common ratio is Basel II effective November 1, 2007 and on the “Enhancements to the Basel II framework” issued by the based on the Basel II methodology. Basel Committee on Banking Supervision (BCBS) and adopted by OSFI effective November 2011. A
majority of our credit risk portfolios use AIRB Approach and the remainder uses Standardized Approach for Calculations the calculation of RWA based on the total exposure (i.e. exposure at default, and counterparty risk weights). Assets-to-capital multiple For market risk measurement we use the internal models approach for products with regulatory approval and Total assets plus specified off balance sheet items, as defined by the Office of the Superintendent of a standardised approach for all other products. For Operational risk, we use the Standardised Approach. Financial Institutions Canada (OSFI), dividend by total regulatory capital. In addition, Basel II requires a transitional capital floor adjustment.
Adjusted ROE n.a.Adjusted net income divided by average capital. Not applicable
Average balances (assets, loans and acceptances, and deposits)Calculated using methods intended to approximate the average of the daily balances for the period.
-39-3rd Quarter 2012 - Revised Supplementary Financial Information ROYAL BANK OF CANADA