Supplementary Financial Information - Canada - RBC · GAAP Supplementary financial ... factors in...
28
Nabanita Merchant - Senior Vice President (416) 955-7803 Dave Mun - Senior IR Professional (416) 955-7808 www.rbc.com/investorrelations for further information, contact: Supplementary Financial Information 1st Quarter 2006 (UNAUDITED) Investor Relations Department Fax - (416) 955-7800
Transcript of Supplementary Financial Information - Canada - RBC · GAAP Supplementary financial ... factors in...

Nabanita Merchant - Senior Vice President (416) 955-7803Dave Mun - Senior IR Professional (416) 955-7808
www.rbc.com/investorrelations
for further information, contact:
Supplementary Financial Information
1st Quarter 2006(UNAUDITED)
Investor Relations Department
Fax - (416) 955-7800

Table of Contents
Page Page
1 Notes to Users Capital and Liquidity 15 Capital
2 Glossary 16 Risk adjusted assets17 Interest rate sensitivity position
3-4 Financial HighlightsCredit Quality
Consolidated Results 18 Loans and acceptances5 Income statement 19-20 Gross impaired loans 5 Revenue from trading activities 20 Net impaired loans6 Non-interest expense 20 Net write-offs7 Other earnings measures 21 Provision for credit losses
22 Allowance for credit lossesSegment Details 23 Credit quality ratios
8 RBC Canadian Personal and Business9 RBC US and International Personal and Business Other items
10 RBC Capital Markets 24 Goodwill11 Corporate Support 24 Business realignment charges11 Discontinued Operations 24 Securities market value surplus
On and Off Balance Sheet 25 ROE and RORC Reconciliation12 Balance sheet (period-end balances)13 Selected on and off balance sheet items 26 U.S. GAAP Reconciliation 13 Net foreign currency translation adjustments13 Retained earnings13 Assets under administration and management14 Loan securitization

Non-GAAP financial measures
Significant reporting changes made to this document in Q1/06Changes to transfer pricing methodology
Notes to Users
This document is not audited and should be read in conjunction with our Report to Shareholders and Quarterly Results slides for Q1/06, the audited annualconsolidated financial statements and accompanying management's discussion & analysis for the year ended October 31, 2005 and the Glossary on page 2 of thisdocument. Certain comparative amounts have been reclassified to conform to the current period's presentations. Starting Q2/05, we no longer produce a USGAAP Supplementary financial information. Please refer to page 26 of this document for a detailed reconciliation to the US GAAP results.
Management measures and evaluates the performance of our consolidated operations and each of our segments based on a number of different measures including netincome and non-GAAP measures including segment return on equity (ROE), return on risk capital (RORC) and economic profit. Readers are cautioned that non-GAAPfinancial measures do not have any standardized meaning prescribed by GAAP and therefore may not be comparable to similar measures presented by other companies.Further explanations of non-GAAP financial measures are provided in the Glossary on page 2.
In Q1 2006, we made changes to our transfer pricing methodologies. Segment results for 2005 and 2004 have been reclassified to reflect these changes. For details on howwe manage our business segments, refer to page 12 of the Q1 2006 Report to Shareholders.
-1-1st Quarter 2006 - Supplementary Financial Information ROYAL BANK OF CANADA

Non-GAAP financial Measures
CalculationsCash basis measures Average balances (assets, loans and acceptance, and deposits)
Calculated using methods intended to approximate the average of the daily balances for the period,
Average common equity
Capital ratiosAverage risk capitalCalculated using methods intended to approximate the average of the daily risk capital balances for the period.
Risk capital Average earning assets
Return on risk capital (RORC)Market capitalizationEnd of period common shares outstanding multiplied by the closing common share price.
Attributed equity Net interest margin (average assets)Attributed equity includes risk capital plus the net amounts of goodwill and intangibles capital. Net interest income divided by average assets.
Return on equity (ROE) Net interest margin (average earning assets)Net interest margin divided by average earning assets.
Net write-offsGross write offs less recoveries of amounts previously written off.
Goodwill and intangiblesRepresents our net investment in goodwill and intangibles. Operating leverage
Unattributed common equity
Risk-adjusted assets
Capital charge
RatiosEfficiency ratio
Economic profit Non-interest expenses as a percentage of total revenue.
Return on assetsNet income divided by average assets.
Taxable equivalent basis (TEB)Return on common equity (ROE)
Return on risk capital (RORC)Net income available to common shareholders divided by attributed risk capital. Refer to page 25 for RORCreconciliation.
Capital ratios that are filed with the regulators are calculated in accordance with the Office of the Superintendentof Financial Institutions Canada (OSFI).
Net income available to common shareholders divided by average common equity for the period. Refer to page25 for ROE reconciliation.
Unattributed common equity represents common equity in excess of common equity attributed to our threeoperating segments and is reported in the Corporate Support segment.
Economic profit is net income available to common shareholders excluding the after-tax effect of amortization ofgoodwill and intangibles, less a capital charge for use of attributed equity.
Net interest income from Canadian taxable dividends in our RBC Capital Markets segment are grossed up totheir effective taxable equivalent value. Net interest income and total revenue are presented on a taxableequivalent basis in the RBC Capital Markets segment. Total revenue, Efficiency ratio and Net interest margin atthe consolidated level are also presented on a taxable equivalent basis.
Calculated as the difference between year-over-year growth in revenue and the year-over-year growth in non-interest expense.
Used in the calculation of risk-based capital ratios. The face value of assets is discounted using risk-weightingfactors in order to reflect a comparable risk per dollar among all types of assets. The risk inherent in off-balancesheet instruments is also recognized, first by determining a credit equivalent amount, and then by applyingappropriate risk-weighting factors.
Calculated by multiplying the cost of equity by the amount of average common equity. The cost of equity is aproxy for the after-tax return that we estimate to be required by shareholders for the use of their capital. Thecost of equity is regularly reviewed and adjusted from time to time based on prevailing market conditions
Calculated as the average of the month-end common equity balances for the period. For the operatingsegments, calculated using methods intended to approximate the average of the daily attributed equity balancesfor the period.
Calculated using methods intended to approximate the average of the daily earning asset balances for the period.Earning assets include deposits with other banks, securities, assets purchased under reverse repurchaseagreements and securities borrowed and loans.
Cash basis measures such as cash net income, cash diluted EPS and cash ROE are calculated by adding backto net income the after-tax amount of amortization of goodwill and other intangibles. These non-cash chargesdo not deplete our cash reserves. We believe these measures provide investors with supplemental informationthat may be useful to them in comparing results to our peers.
These non-GAAP financial measures are not defined by GAAP and do not have standardized meanings. They may not be comparable to similar measures used by other companies. Refer to Performance and non-GAAP measuressection and Economic Capital section in the Annual Report for further discussions on Risk capital, Return on risk capital, Attributed equity, Return on equity, Unattributed common equity and Taxable equivalent basis.
Glossary
Risk capital includes credit, market (trading and non-trading), insurance-specific, operational, business andfixed assets risk capital.
Business segment return on equity is calculated as net income available to common shareholders divided byaverage attributed equity for the period. Corporate Support also includes average unattributed equity. Refer topage 25 for reconciliation.
Business segment return on risk capital is calculated as net income available to common shareholders divided by average attributed risk capital for the period. Refer to page 25 for reconciliation.
-2-1st Quarter 2006 - Supplementary Financial Information ROYAL BANK OF CANADA

FINANCIAL HIGHLIGHTS(C$ MM) Q1/06 Q4/05 Q3/05 Q2/05 Q1/05 Q4/04 Q3/04 Q2/04 Q1/04 2005 2004 2003 2002
SELECTED INCOME STATEMENT INFORMATIONTotal revenue 4,978 4,815 4,938 4,689 4,773 4,570 4,508 4,442 4,282 19,215 17,802 16,988 17,092 Provision for (recovery of) credit losses (PCL) 47 103 128 116 108 97 125 149 (25) 455 346 721 1,065Insurance policyholder benefits, claims and acquisition expense 652 740 681 622 582 589 575 508 452 2,625 2,124 1,696 1,535Non-interest expense 2,769 3,329 2,741 2,664 2,654 2,734 2,675 2,682 2,742 11,388 10,833 10,165 10,420Net income from continuing operations 1,172 543 1,001 916 977 687 771 759 806 3,437 3,023 2,955 2,702Net income (loss) from discontinued operations (1) (21) (22) (9) 2 (173) (28) 1 (20) (50) (220) 13 N/ANet Income 1,171 522 979 907 979 514 743 760 786 3,387 2,803 2,968 2,702Net income available to common shareholders 1,161 515 968 895 971 507 734 752 779 3,349 2,772 2,937 2,664
PROFITABILITY MEASURESTotalEarnings per share (EPS) - basic $1.81 $0.80 $1.51 $1.40 $1.52 $0.79 $1.14 $1.16 $1.20 $5.22 $4.29 $4.44 $3.96 - diluted $1.78 $0.79 $1.48 $1.37 $1.50 $0.78 $1.12 $1.14 $1.18 $5.13 $4.23 $4.39 $3.93Return on common equity (ROE) 1 23.9% 10.6% 20.0% 19.9% 21.9% 11.3% 16.1% 16.8% 17.8% 18.0% 15.6% 16.7% 15.8%Return on risk capital (RORC) 1 37.9% 17.3% 33.4% 32.4% 34.6% 17.6% 25.4% 27.3% 28.3% 29.3% 24.6% 26.5% 23.3%Return on assets 0.97% 0.44% 0.85% 0.85% 0.91% 0.48% 0.69% 0.73% 0.76% 0.76% 0.67% 0.76% 0.74%Return on risk adjusted assets 2.28% 1.05% 2.04% 1.96% 2.07% 1.12% 1.62% 1.72% 1.79% 1.77% 1.56% 1.77% 1.61%
Continuing OperationsEarnings per share (EPS) - basic $1.81 $0.83 $1.54 $1.41 $1.52 $1.06 $1.18 $1.16 $1.23 $5.30 $4.63 $4.42 $3.96 - diluted $1.78 $0.82 $1.51 $1.38 $1.50 $1.05 $1.16 $1.14 $1.21 $5.21 $4.57 $4.37 $3.93Return on common equity (ROE) 1 23.6% 10.9% 20.2% 19.9% 21.6% 15.1% 16.6% 17.1% 18.3% 18.1% 16.8% 16.7% 15.8%Return on risk capital (RORC) 1 38.0% 18.1% 34.1% 32.7% 34.5% 23.6% 26.4% 27.3% 29.0% 29.7% 26.5% 26.4% 23.3%Efficiency ratio 55.6% 69.1% 55.5% 56.8% 55.6% 59.8% 59.3% 60.4% 64.0% 59.3% 60.9% 59.8% 61.0%Efficiency ratio (teb) 1 55.2% 68.7% 55.2% 56.5% 55.3% 59.6% 59.2% 60.2% 63.8% 58.9% 60.7% 59.7% 60.8%
Discontinued OperationsEarnings per share (EPS) - basic $0.00 ($0.03) ($0.03) ($0.01) $0.00 ($0.27) ($0.04) $0.00 ($0.03) ($0.08) ($0.34) $0.02 N/A - diluted $0.00 ($0.03) ($0.03) ($0.01) $0.00 ($0.27) ($0.04) $0.00 ($0.03) ($0.08) ($0.34) $0.02 N/A
SELECTED BALANCE SHEET INFORMATION Average loans and acceptances 198,700 194,500 187,800 182,500 179,400 176,500 174,800 170,000 166,500 186,100 171,900 166,800 171,200 Total assets 487,874 469,521 463,325 434,873 424,029 426,222 423,612 421,247 413,984 469,521 426,222 399,847 375,474 Average assets 480,000 469,600 456,600 436,300 425,500 422,600 427,400 424,200 411,600 447,100 421,400 390,700 364,000 Deposits 314,872 306,860 304,497 283,492 280,020 270,959 277,492 271,585 265,167 306,860 270,959 259,145 243,476 Common equity 19,538 19,149 19,410 18,974 18,121 17,372 18,192 18,324 17,639 19,149 17,372 17,543 17,238 Average common equity 19,300 19,350 19,150 18,400 17,600 17,900 18,200 18,150 17,400 18,600 17,800 17,550 16,800 Average risk capital 1 12,150 11,800 11,500 11,350 11,150 11,450 11,500 11,200 10,950 11,450 11,300 11,000 11,450
KEY RATIOS
Diluted EPS growth 2 18.7% 1.3% 32.1% 20.2% 27.1% (29.7)% (3.4)% 14.0 % 5.4 % 21.3 % (3.6)% 11.7 % 11.6 %Diluted EPS growth 2 - continuing operations 18.7% (21.9)% 30.2% 21.1% 24.0% (9.5)% 1.8 % 16.3 % 10.0 % 14.0 % 4.6 % 11.2 % 11.6 %Revenue growth 2 - continuing operations 4.3% 5.4% 9.5% 5.6% 11.5% 6.2% 4.1% 10.3% (0.9)% 7.9% 4.8 % (0.6)% 7.7 %NIE growth 2 - continuing operations 4.3% 21.8% 2.5% (0.7)% (3.2)% 6.8 % 4.7 % 7.3 % 7.5 % 5.1 % 6.6 % (2.4)% 7.2 %Operating leverage 2 0.0% (16.4)% 7.0% 6.3% 14.7% (0.6)% (0.6)% 3.0% (8.4)% 2.8 % (1.8)% 1.8 % 0.5 %Specific PCL to average loans and acceptances 3 - continuing operations 0.20% 0.20% 0.28% 0.24% 0.12% 0.27% 0.28% 0.36% 0.30% 0.21% 0.30% 0.43% 0.62%
CAPITAL MEASURES 4
Tier 1 capital ratio 9.5% 9.6% 9.7% 9.5% 9.2% 8.9% 9.1% 9.3% 9.3% 9.6% 8.9% 9.7% 9.3%Total capital ratio 12.8% 13.1% 13.4% 12.8% 12.7% 12.4% 12.7% 12.9% 12.9% 13.1% 12.4% 12.8% 12.7%Risk adjusted assets ($ billions) 204.2 197.0 190.9 190.1 187.3 183.4 183.0 179.5 174.4 197.0 183.4 166.9 165.6
1 These measures are non-GAAP financial measures. Refer to "Notes to Users" for further discussion.2 Growth rates are calculated based on earnings from continuing operations in the same period a year ago.3 A $52 million transfer of the allocated specific allowance to the allocated general allowance during Q1/05 decreased this ratio by 0.11% or 0.03% for fiscal 2005.4 Calculated using guidelines issued by OSFI. N/A: Comparable information not available for 2002.
-3-1st Quarter 2006 - Supplementary Financial Information ROYAL BANK OF CANADA

FINANCIAL HIGHLIGHTS continued(C$ MM) Q1/06 Q4/05 Q3/05 Q2/05 Q1/05 Q4/04 Q3/04 Q2/04 Q1/04 2005 2004 2003 2002
SHARE INFORMATIONFirst preferred shares outstanding (000s) - end of period Non-cumulative series J - - - - - - - - - - - - 12,000 US$ Non-cumulative series K - - - - - - - - - - - - 10,000 Non-cumulative series N 1 12,000 12,000 12,000 12,000 12,000 12,000 12,000 12,000 12,000 12,000 12,000 12,000 12,000 Non-cumulative series O 6,000 6,000 6,000 6,000 6,000 6,000 6,000 6,000 6,000 6,000 6,000 6,000 6,000 US$ Non-cumulative series P - - 4,000 4,000 4,000 4,000 4,000 4,000 4,000 - 4,000 4,000 4,000 Non-cumulative series S 10,000 10,000 10,000 10,000 10,000 10,000 10,000 10,000 10,000 10,000 10,000 10,000 10,000 Non-cumulative series W 12,000 12,000 12,000 12,000 12,000 - - - - 12,000 - - - Common shares outstanding (000s) - end of period 2 645,491 646,751 647,238 646,401 644,824 644,748 649,066 653,280 655,963 646,751 644,748 656,021 665,257 - average (basic) 642,167 644,214 643,102 640,842 638,681 642,117 646,019 648,676 650,044 641,717 646,732 662,080 672,571 - average (diluted) 652,189 654,169 653,023 651,800 649,118 650,805 654,275 657,520 658,738 652,340 655,508 669,016 678,120Treasury shares held - preferred (000s) 118 91 - - - - - - - 91 - - - - common (000s) 3,112 3,526 3,519 3,682 5,094 4,863 4,709 4,243 6,951 3,526 4,863 - - Shares repurchased (000s) 2,202 1,950 - - 1,005 4,743 4,566 3,780 1,512 2,955 14,601 14,539 14,293 ($ MM) 193 163 - - 63 289 272 237 94 226 892 852 764Stock options outstanding (000s) 18,148 18,241 19,751 20,605 22,249 22,372 22,828 23,303 24,463 18,241 22,372 24,803 28,479 Stock options exercisable (000s) 15,429 14,432 15,935 16,732 18,315 16,401 16,847 17,259 18,305 14,432 16,401 15,415 14,050
COMMON SHARE PERFORMANCEBook value per share $30.42 $29.77 $30.15 $29.52 $28.33 $27.15 $28.23 $28.23 $27.18 $29.77 $27.15 $26.74 $25.91Common share price - High (intraday) $93.00 $86.68 $79.70 $75.25 $64.40 $63.77 $61.88 $65.64 $65.90 $86.68 $65.90 $65.00 $58.89 - Low (intraday) $82.58 $74.39 $73.51 $62.76 $60.90 $58.94 $58.04 $60.56 $60.26 $60.90 $58.04 $53.26 $45.05 - Close $89.07 $83.33 $77.40 $74.95 $63.10 $63.40 $61.50 $60.95 $63.19 $83.33 $63.40 $63.48 $54.41Market capitalization ($ MM) 57,494 53,894 50,096 48,448 40,688 40,877 39,918 39,817 41,450 53,894 40,877 41,644 36,197 P/E ratio (4-quarters trailing earnings) 3 16.2 15.7 14.9 14.5 13.8 14.5 13.2 13.7 14.2 14.4 14.7 13.5 13.2Market price to book value 2.93 2.80 2.57 2.54 2.23 2.34 2.18 2.16 2.33 2.80 2.34 2.37 2.10
DIVIDEND INFORMATIONDividends per share $0.64 $0.64 $0.61 $0.55 $0.55 $0.52 $0.52 $0.52 $0.46 $2.35 $2.02 $1.72 $1.52Dividend yield 2.9% 3.2% 3.2% 3.2% 3.5% 3.4% 3.5% 3.3% 2.9% 3.2% 3.3% 2.9% 2.9%Dividend payout ratio 35% 80% 41% 39% 36% 66% 46% 45% 38% 45% 47% 39% 38%Dividend payout ratio - continuing operations 35% 77% 40% 39% 36% 49% 44% 45% 37% 44% 44% 39% 38%Common dividends ($ MM) 412 414 393 353 352 333 336 336 298 1,512 1,303 1,137 1,022Preferred dividends ($ MM) 10 11 11 12 8 7 9 8 7 42 31 31 38
OTHER INFORMATION (Continuing operations)Number of employees (full time equivalent) 4
Canada 45,651 46,401 46,822 46,047 46,880 46,386 47,313 44,829 45,022 46,401 46,386 44,950 44,639 US 9,815 9,684 9,723 9,787 9,801 10,814 10,875 10,746 10,460 9,684 10,814 12,159 11,104 Other 3,963 3,927 4,082 3,969 3,986 3,803 3,777 3,698 3,687 3,927 3,803 3,703 3,806 Total 59,429 60,012 60,627 59,803 60,667 61,003 61,965 59,273 59,169 60,012 61,003 60,812 59,549
Number of bank branches 5
Canada 1,105 1,104 1,102 1,102 1,101 1,098 1,107 1,107 1,105 1,104 1,098 1,104 1,117 US 273 273 273 270 268 275 272 270 264 273 275 240 236 Other 43 42 42 42 42 42 42 42 42 42 42 42 42 Total 1,421 1,419 1,417 1,414 1,411 1,415 1,421 1,419 1,411 1,419 1,415 1,386 1,395
Number of automated banking machines 4,268 4,277 4,321 4,367 4,400 4,432 4,419 4,433 4,465 4,277 4,432 4,469 4,572
1 As a result of adopting CICA Handbook Section 3860 Financial Instruments - Disclosure and Presentation, Series N preferred shares are reclassified as liabilities effective November 1, 2004. Refer to "Notes to Users" for further discussion.2 Includes Treasury shares (shares acquired and held by subsidiaries for reasons other than cancellation).3 Average of high and low common share price for the period divided by diluted earnings per share.4 Q1/06 number of employees reflects changes due to our acquisition of Abacus Financial Services Group Limited and the creation of RBC Dexia Investor Services (RBC Dexia IS). Total number of employees excludes employees of RBC Dexia IS.5 Bank branches which provide full or limited banking services dealing directly with clients.
-4-1st Quarter 2006 - Supplementary Financial Information ROYAL BANK OF CANADA

INCOME STATEMENT(C$ MM) Q1/06 Q4/05 Q3/05 Q2/05 Q1/05 Q4/04 Q3/04 Q2/04 Q1/04 2005 2004 2003 2002
Continuing operations
Net interest income Interest income 5,060 4,626 4,283 4,094 3,955 3,634 3,494 3,321 3,417 16,958 13,866 13,899 14,450Interest expense 3,296 2,869 2,626 2,432 2,261 2,030 1,860 1,761 1,817 10,188 7,468 7,563 7,677Total 1,764 1,757 1,657 1,662 1,694 1,604 1,634 1,560 1,600 6,770 6,398 6,336 6,773
Non-interest income Accounts 223 232 217 212 207 204 200 208 200 868 812 855 847 Other payment services 71 74 72 69 70 72 71 70 64 285 277 267 241 Service charges 294 306 289 281 277 276 271 278 264 1,153 1,089 1,122 1,088
Insurance premiums, investment and fee income 858 798 886 813 773 790 792 675 613 3,270 2,870 2,356 2,043 Trading revenue 458 308 452 373 461 394 358 385 426 1,594 1,563 1,908 1,689 Investment management and custodial fees 315 340 313 311 291 265 287 298 276 1,255 1,126 1,098 1,153 Securities brokerage commissions 309 300 274 307 282 260 262 320 324 1,163 1,166 1,031 1,187 Mutual fund revenue 261 259 245 233 225 218 216 214 202 962 850 673 723 Underwriting and other advisory fees 219 233 251 266 276 217 214 275 212 1,026 918 813 755 Card service revenue 145 152 158 127 142 155 150 124 126 579 555 518 496 Foreign exchange revenue, other than trading 96 118 109 88 92 74 72 112 73 407 331 279 276 Credit fees 56 48 46 41 52 50 51 48 49 187 198 227 223 Securitization revenue 49 83 65 51 86 54 24 59 63 285 200 165 174 Gain (loss) on sale of investment account securities 43 14 36 26 15 (31) 24 23 4 91 20 31 (111) Other 1 111 99 157 110 107 244 153 71 50 473 518 431 623 Total 3,214 3,058 3,281 3,027 3,079 2,966 2,874 2,882 2,682 12,445 11,404 10,652 10,319
Total revenue 4,978 4,815 4,938 4,689 4,773 4,570 4,508 4,442 4,282 19,215 17,802 16,988 17,092
Provision for (recovery of) credit losses (PCL) 47 103 128 116 108 97 125 149 (25) 455 346 721 1,065 Insurance policyholder benefits, claims and acquisition expense 652 740 681 622 582 589 575 508 452 2,625 2,124 1,696 1,535Non-interest expense 2,769 3,329 2,741 2,664 2,654 2,734 2,675 2,682 2,742 11,388 10,833 10,165 10,420Business re-alignment charges - 40 1 2 2 177 - - - 45 177 - - Income taxes 332 90 392 353 443 282 358 344 303 1,278 1,287 1,439 1,365Non-controlling interest 6 (30) (6) 16 7 4 4 - 4 (13) 12 12 5
Net income from continuing operations 1,172 543 1,001 916 977 687 771 759 806 3,437 3,023 2,955 2,702Net Income (loss) from discontinued operations (1) (21) (22) (9) 2 (173) (28) 1 (20) (50) (220) 13 N/ANet income 1,171 522 979 907 979 514 743 760 786 3,387 2,803 2,968 2,702 Preferred dividends (10) (11) (11) (12) (8) (7) (9) (8) (7) (42) (31) (31) (38)Net gain on redemption of preferred shares - 4 - - - - - - - 4 - - - Net income available to common shareholders 1,161 515 968 895 971 507 734 752 779 3,349 2,772 2,937 2,664
Revenue from Trading Activities
Total Trading revenueNet interest income 7 13 (76) 39 45 47 66 81 92 21 286 109 128Non-interest income 458 308 452 373 461 394 358 385 426 1,594 1,563 1,908 1,689Total 465 321 376 412 506 441 424 466 518 1,615 1,849 2,017 1,817
Trading revenue by productEquity 125 46 97 71 141 155 93 146 133 355 527 541 657 Fixed income and money markets 264 233 251 268 273 228 264 241 311 1,025 1,044 1,175 896 Foreign exchange contracts 2 76 42 28 73 92 58 67 79 74 235 278 301 264 Total 465 321 376 412 506 441 424 466 518 1,615 1,849 2,017 1,817
Key Ratios - continuing operationsNet interest margin as % of average assets 1.46% 1.49% 1.45% 1.57% 1.59% 1.52% 1.54% 1.51% 1.56% 1.52% 1.53% 1.63% 1.86%Net interest margin (teb) as % of average assets 3 1.49% 1.52% 1.47% 1.59% 1.61% 1.54% 1.55% 1.52% 1.57% 1.55% 1.54% 1.64% 1.87%Net interest margin (teb) as % of average earning assets 3 1.72% 1.78% 1.72% 1.88% 1.89% 1.80% 1.82% 1.82% 1.88% 1.82% 1.83% 1.97% 2.22%Non-interest income as % of total revenue (teb) 3 64.1% 63.1% 66.1% 64.2% 64.2% 64.7% 63.6% 64.7% 62.4% 64.4% 63.9% 62.6% 60.3%Effective tax rate 22.0% 14.9% 28.3% 27.5% 31.0% 29.0% 31.6% 31.2% 27.2% 27.2% 29.8% 32.7% 33.5%
1Includes net gain on credit derivatives of $29 million in 2003 and $33 million in 2002.2Includes commodity and precious metals.3These measures are non-GAAP financial measures. Refer to "Notes to Uses" for further discussion. -5-
1st Quarter 2006 - Supplementary Financial Information ROYAL BANK OF CANADA

NON-INTEREST EXPENSE(C$ MM) Q1/06 Q4/05 Q3/05 Q2/05 Q1/05 Q4/04 Q3/04 Q2/04 Q1/04 2005 2004 2003 2002
Human resourcesSalaries 782 782 799 768 806 820 798 790 791 3,155 3,199 3,138 3,191 Variable compensation 662 580 587 562 580 557 566 610 550 2,309 2,283 2,102 2,131 Acquisition retention compensation 1 5 4 6 5 5 9 9 13 20 36 84 158 Benefits related 1 280 252 269 283 279 264 267 263 265 1,083 1,059 893 783 Stock-based compensation 2 86 27 65 80 28 48 35 21 20 200 124 80 52 Total Human resources 1,811 1,646 1,724 1,699 1,698 1,694 1,675 1,693 1,639 6,767 6,701 6,297 6,315
EquipmentDepreciation 77 80 82 82 80 78 77 67 72 324 294 296 304 Computer rental and maintenance 147 153 155 148 136 150 140 138 129 592 557 514 522 Office equipment rental and maintenance 7 12 10 10 12 13 11 17 14 44 55 72 67 Total Equipment 231 245 247 240 228 241 228 222 215 960 906 882 893
OccupancyPremises rent 85 86 84 86 85 94 99 91 86 341 370 353 395 Premises repairs and maintenance 54 58 54 61 52 62 56 50 50 225 218 191 177 Depreciation 21 23 22 22 23 24 23 23 23 90 93 95 103 Property taxes 22 23 28 22 20 25 23 19 17 93 84 82 84 Total Occupancy 182 190 188 191 180 205 201 183 176 749 765 721 759
CommunicationsTelecommunications 46 51 51 48 54 57 59 61 66 204 243 297 328 Postage and courier 23 24 23 25 25 24 26 29 20 97 99 107 121 Marketing and public relations 55 76 57 58 50 76 60 56 38 241 230 205 211 Stationery and printing 22 23 24 21 22 25 25 27 23 90 100 98 108 Total Communications 146 174 155 152 151 182 170 173 147 632 672 707 768
Professional fees 137 170 132 113 114 144 117 120 93 529 474 444 416
Outsourced item processing 73 73 73 78 72 72 74 79 69 296 294 292 306
Amortization of other intangibles 14 (1) 16 16 19 16 16 21 16 50 69 71 72
OtherBusiness and capital taxes 42 48 29 54 42 41 40 39 33 173 153 143 129 Travel and relocation 32 40 36 30 30 39 37 35 29 136 140 135 144 Employee training 9 12 9 8 8 13 9 10 7 37 39 39 46 Donations 12 13 10 9 11 13 9 8 12 43 42 38 41 Other 3 80 719 122 74 101 74 99 99 306 1,016 578 396 531 Total Other 175 832 206 175 192 180 194 191 387 1,405 952 751 891
Total non-interest expense 2,769 3,329 2,741 2,664 2,654 2,734 2,675 2,682 2,742 11,388 10,833 10,165 10,420
1Includes pension expense of $99 million in Q1/06 ($83 million in Q4/05, $89 million in Q1/05).2Stock-based compensation includes the cost of stock options, stock appreciation rights, performance deferred shares and deferred compensation plans.3In Q4/05, includes $29 million for recognition of claims against the Enron Corp. (Enron) bankruptcy estate. It also includes reserves for Enron litigation of $591 million. In Q3/05, includes $31 million to settle MegaClaims lawsuit brought by Enron against us and a number of other financial institutions. In Q1/04, includes Cooperative Centrale Raiffeisen-Boerenleenbank, B.A. (Rabobank) settlement costs, net of compensation (recorded in variable compensation) and net of tax expenses.
-6-1st Quarter 2006 - Supplementary Financial Information ROYAL BANK OF CANADA
OTHER EARNINGS MEASURES(C$ MM) Q1/06 Q4/05 Q3/05 Q2/05 Q1/05 Q4/04 Q3/04 Q2/04 Q1/04 2005 2004 2003 2002
Total Revenue (teb) 1 - continuing operationsNet interest income 1,764 1,757 1,657 1,662 1,694 1,604 1,634 1,560 1,600 6,770 6,398 6,336 6,773 Tax equivalent basis (teb) adjustment 1 37 33 25 27 24 17 11 13 14 109 55 35 34 Net interest income (teb) 1 1,801 1,790 1,682 1,689 1,718 1,621 1,645 1,573 1,614 6,879 6,453 6,371 6,807 Non-interest income 3,214 3,058 3,281 3,027 3,079 2,966 2,874 2,882 2,682 12,445 11,404 10,652 10,319 Total revenue (teb) 1 5,015 4,848 4,963 4,716 4,797 4,587 4,519 4,455 4,296 19,324 17,857 17,023 17,126
Cash Basis Measures 1
Net income 1,171 522 979 907 979 514 743 760 786 3,387 2,803 2,968 2,702 After-tax effect of amortization of other intangibles3 12 (3) 20 14 14 145 15 18 13 45 191 59 64 Cash Net income 1 1,183 519 999 921 993 659 758 778 799 3,432 2,994 3,027 2,766
Cash Diluted EPS 1 1.80 0.78 1.51 1.39 1.52 1.00 1.15 1.17 1.20 5.20 4.52 4.48 4.02 Cash ROE 1 24.0% 10.4% 20.3% 20.1% 22.1% 14.5% 16.4% 17.3% 18.1% 18.2% 16.6% 17.1% 16.2%
Economic Profit 1, 2
Net income 1,171 522 979 907 979 514 743 760 786 3,387 2,803 2,968 2,702 After-tax effect of amortization of other intangibles 3 12 (3) 20 14 14 145 15 18 13 45 191 59 64 Capital charge 4 (496) (496) (494) (461) (452) (457) (466) (454) (444) (1,903) (1,821) (1,855) (2,054) Economic Profit 1 687 23 505 460 541 202 292 324 355 1,529 1,173 1,172 712
1These measures are non-GAAP financial measures. Refer to "Notes to Users" for further discussion.2Economic profit is defined in the Glossary.3 Includes $130 million RBC Mortgage goodwill impairment charge in Q4/04.4Capital charge is defined in the Glossary.
-7-1st Quarter 2006 - Supplementary Financial Information ROYAL BANK OF CANADA

RBC CANADIAN PERSONAL AND BUSINESS 1
(C$ MM) Q1/06 Q4/05 Q3/05 Q2/05 Q1/05 Q4/04 Q3/04 Q2/04 Q1/04 2005 2004 2003 2002
Income Statement Net interest income 1,428 1,410 1,367 1,268 1,276 1,239 1,219 1,195 1,202 5,321 4,855 4,784 4,814 Non-interest income 1,870 1,823 1,885 1,760 1,710 1,664 1,670 1,554 1,470 7,178 6,358 5,573 5,316 Total revenue 3,298 3,233 3,252 3,028 2,986 2,903 2,889 2,749 2,672 12,499 11,213 10,357 10,130 Provision for credit losses (PCL) 142 138 143 158 103 114 108 141 47 542 410 482 541 Insurance policyholder benefits, claims and acquisition expense 652 740 681 622 582 589 575 508 452 2,625 2,124 1,696 1,535 Non-interest expense 1,502 1,511 1,454 1,492 1,415 1,488 1,436 1,361 1,345 5,872 5,630 5,379 5,391 Business realignment charges - 6 - 1 - 63 - - - 7 63 - - Other 2 333 334 295 231 289 201 247 237 258 1,149 943 956 988 Net income 669 504 679 524 597 448 523 502 570 2,304 2,043 1,844 1,675
Total Revenue by business linesPersonal Banking 869 889 890 799 810 772 777 772 773 3,388 3,094 3,122 N/ABusiness and Commercial Banking 526 514 529 482 486 483 480 459 466 2,011 1,888 1,849 N/ACards and Payment Solutions 404 410 394 340 351 358 352 317 314 1,495 1,341 1,170 N/AWealth Management 641 619 551 575 549 498 487 525 505 2,294 2,015 1,860 N/AGlobal Insurance 858 801 888 832 790 792 793 676 614 3,311 2,875 2,356 N/ATotal 3,298 3,233 3,252 3,028 2,986 2,903 2,889 2,749 2,672 12,499 11,213 10,357 10,130
Financial ratiosReturn on equity (ROE) 3 30.0% 22.8% 31.1% 25.5% 29.1% 20.9% 24.4% 25.6% 28.1% 27.1% 24.7% 22.3% 20.6%Return on risk capital (RORC) 3 41.5% 31.7% 44.8% 37.3% 43.0% 31.0% 37.8% 38.6% 43.5% 39.1% 37.6% 34.3% 31.3%Net interest margin (average assets) 3.19% 3.21% 3.22% 3.17% 3.14% 3.12% 3.13% 3.27% 3.25% 3.18% 3.19% 3.43% 3.47%Efficiency ratio 45.5% 46.7% 44.7% 49.3% 47.4% 51.3% 49.7% 49.5% 50.3% 47.0% 50.2% 51.9% 53.2%Operating leverage (excluding Global Insurance) 4 3.6 % 13.1 % 10.4 % (4.3)% 2.2 % (7.4)% (2.6)% 6.9 % 1.2 % 5.5 % (0.5)% 0.1 % (5.6)%
Average BalancesAssets 177,600 174,500 168,600 164,200 161,400 158,100 154,800 148,800 147,200 167,200 152,200 139,600 138,700 Loans and acceptances 160,600 157,700 151,800 147,700 145,500 142,400 138,400 134,700 133,500 150,700 137,100 126,900 127,200 Residential mortgage 84,100 82,800 79,300 77,400 76,200 74,700 72,100 69,400 70,500 78,900 71,700 66,500 62,900 Personal 33,900 33,300 32,100 30,500 29,400 28,900 27,800 26,500 25,600 31,300 27,200 24,500 24,200
Personal secured loans 10,400 9,800 9,200 8,800 8,000 7,600 7,000 6,300 5,800 8,900 6,600 5,000 4,200 Personal unsecured loans 23,500 23,500 22,900 21,700 21,400 21,300 20,800 20,200 19,800 22,400 20,600 19,500 20,000
Credit cards 9,500 9,100 8,900 8,600 8,500 8,100 8,000 7,900 7,700 8,800 7,900 6,900 6,200 Business and government loans (includes acceptances) 33,100 32,500 31,500 31,200 31,400 30,700 30,500 30,900 29,700 31,700 30,300 29,000 33,900 Deposits 142,700 140,300 139,300 137,400 138,000 136,400 135,200 132,000 131,500 138,800 133,700 126,400 122,600 Attributed equity 8,750 8,700 8,600 8,350 8,100 8,450 8,450 7,950 8,000 8,450 8,200 8,200 8,050 Risk capital 3 6,350 6,250 5,950 5,700 5,500 5,700 5,450 5,250 5,200 5,850 5,400 5,350 5,300
Credit quality Gross impaired loans / Average loans and acceptances 0.32% 0.31% 0.35% 0.35% 0.37% 0.44% 0.48% 0.54% 0.55% 0.33% 0.46% 0.59% 0.68%PCL / Average loans and acceptances 0.35% 0.35% 0.37% 0.44% 0.28% 0.32% 0.31% 0.43% 0.14% 0.36% 0.30% 0.38% 0.43%Net write-offs / Average loans and acceptances 0.35% 0.41% 0.36% 0.42% 0.34% 0.41% 0.40% 0.46% 0.36% 0.38% 0.41% 0.45% 0.54%
Global InsuranceNet earned premiums 666 630 657 668 609 670 656 568 488 2,564 2,382 1,965 1,767 Investment income 142 109 150 137 144 99 118 89 107 540 413 298 167 Fee income 50 62 81 27 37 23 19 19 19 207 80 93 109 Total revenue 858 801 888 832 790 792 793 676 614 3,311 2,875 2,356 2,043 Insurance policyholder benefits, claims and acquisition expense 652 740 681 622 582 589 575 508 452 2,625 2,124 1,696 1,535Non-interest expense 116 131 126 118 126 137 139 114 111 501 501 483 437Business realignment charges - (1) - - - 8 - - - (1) 8 - - Net income (loss) before taxes 90 (69) 81 92 82 58 79 54 51 186 242 177 71
Insurance claims and policy benefit liabilities 7,150 7,117 6,914 6,860 6,728 6,488 6,258 5,031 4,790 7,117 6,488 4,775 2,407
Business informationAssets under administration 5 189,000 174,100 170,000 166,000 159,700 152,500 153,800 153,900 148,200 174,100 152,500 141,100 N/AAssets under management 69,400 63,400 61,900 57,700 54,900 52,300 51,200 50,900 49,600 63,400 52,300 48,300 N/A
Other earnings measuresNet income 669 504 679 524 597 448 523 502 570 2,304 2,043 1,844 1,675 After-tax effect of amortization of other intangibles 1 2 2 2 1 2 2 2 2 7 8 8 7 Cash Net income 3 670 506 681 526 598 450 525 504 572 2,311 2,051 1,852 1,682 Capital charge (232) (230) (227) (215) (214) (223) (223) (205) (211) (886) (862) (892) (1,006) Economic Profit 3 438 276 454 311 384 227 302 299 361 1,425 1,189 960 676
1 In Q1/06, we made changes to our transfer pricing methodologies and have reclassified 2005 and 2004 results. This change impacted the following line items: net interest income, non-interest income, total revenue, net income, return on equity, return on risk capital, net interest margin, efficiency ratio, operating leverage, and economic profit. Refer to "Notes to Users" for further discussion on transfer pricing methodologies.2 Includes income taxes and non-controlling interest. 3 These measures are non-GAAP financial measures. Refer to "Notes to Users" for further discussion and page 25 for ROE and RORC reconciliation.4 Defined as the difference between revenue growth rate and non-interest expense growth rate for the segment excluding Global Insurance due to the nature of its business.5 Assets under administration has been restated for periods 2003 to 2005 to remove the effects of assets administered by two business lines.N/A: Comparable information not available for 2002. -8-
1st Quarter 2006 - Supplementary Financial Information ROYAL BANK OF CANADA

RBC U.S. AND INTERNATIONAL PERSONAL AND BUSINESS1, 4
Q1/06 Q4/05 Q3/05 Q2/05 Q1/05 Q4/04 Q3/04 Q2/04 Q1/04 2005 2004 2003 2002All amounts are for continuing operations only(C$ MM) Income Statement
Net interest income 279 277 289 274 268 252 259 243 235 1,108 989 1,119 1,181 Non-interest income 459 431 430 432 432 411 437 453 466 1,725 1,767 1,780 2,070 Total revenue 738 708 719 706 700 663 696 696 701 2,833 2,756 2,899 3,251 Provision for credit losses (PCL) 10 4 18 15 14 19 22 20 19 51 80 78 84 Non-interest expense 594 536 569 575 546 578 577 636 569 2,226 2,360 2,348 2,762 Business re-alignment charges - (2) - - - 23 - - - (2) 23 - - Other2 33 35 50 30 42 6 22 7 33 157 68 133 89 Net income 101 135 82 86 98 37 75 33 80 401 225 340 316
Total Revenue by business linesWealth Management 469 429 435 428 418 406 406 443 420 1,710 1,675 1,685 N/ABanking 269 279 284 278 282 257 290 253 281 1,123 1,081 1,214 N/ATotal 738 708 719 706 700 663 696 696 701 2,833 2,756 2,899 3,251
Financial ratiosReturn on equity (ROE) 3 13.1% 17.2% 9.7% 10.2% 11.9% 4.0% 7.4% 3.1% 8.3% 12.1% 5.7% 9.4% 8.7%Return on risk capital (RORC) 3 21.2% 28.4% 16.0% 16.8% 20.0% 6.8% 12.7% 5.1% 13.9% 20.2% 9.6% 16.9% 15.0%Net interest margin (average assets) 3.00% 2.95% 2.90% 2.94% 2.95% 2.75% 2.64% 2.69% 2.56% 2.93% 2.66% 2.94% 3.15%
Average BalancesAssets 36,900 37,300 39,600 38,200 36,000 36,500 39,100 36,800 36,500 37,800 37,200 38,100 37,500 Loans and acceptances 20,600 20,500 21,700 20,500 19,500 19,100 20,000 19,100 17,200 20,500 18,800 18,800 20,400 Deposits 31,900 31,900 35,000 34,100 32,100 31,900 34,300 34,300 32,000 33,300 33,100 32,100 29,700 Attributed equity 3,000 3,100 3,300 3,400 3,250 3,650 3,950 3,950 3,800 3,250 3,800 3,550 3,550 Risk capital 3 1,850 1,850 2,000 2,050 1,900 2,150 2,300 2,450 2,250 1,950 2,300 1,950 2,050
Credit qualityGross impaired loans / Average loans and acceptances 0.81% 0.79% 0.84% 0.81% 0.89% 1.15% 1.07% 1.24% 1.26% 0.79% 1.17% 1.14% 1.24%PCL / Average loans and acceptances 0.19% 0.08% 0.33% 0.30% 0.28% 0.40% 0.44% 0.43% 0.44% 0.25% 0.43% 0.41% 0.41%Net write-offs / Average loans and acceptances 0.24% 0.24% 0.23% 0.11% 0.24% 0.29% 0.26% 0.37% 0.37% 0.21% 0.32% 0.38% 0.32%
Business informationAssets under administration 287,300 234,300 246,900 252,200 248,600 233,700 251,900 263,200 259,400 234,300 233,700 241,200 N/AAssets under management 41,800 42,300 43,000 44,200 43,600 41,300 44,400 44,300 42,700 42,300 41,300 40,500 N/A
Other earnings measuresNet income 101 135 82 86 98 37 75 33 80 401 225 340 316 After-tax effect of amortization of other intangibles 10 (5) 12 12 15 12 13 17 11 34 53 51 54 Cash Net income 3 111 130 94 98 113 49 88 50 91 435 278 391 370 Capital charge (80) (83) (86) (86) (86) (96) (104) (102) (100) (341) (402) (385) (444) Economic Profit 3 31 47 8 12 27 (47) (16) (52) (9) 94 (124) 6 (74)
(US$ MM) Income Statement
Net interest income 242 236 233 222 221 199 194 182 179 912 754 779 N/A Non-interest income 397 367 349 350 358 325 325 338 356 1,424 1,344 1,244 N/ATotal revenue 639 603 582 572 579 524 519 520 535 2,336 2,098 2,023 N/A Provision for credit losses (PCL) 9 3 14 12 12 16 16 15 14 41 61 55 N/A Non-interest expense 514 455 461 466 453 456 430 475 435 1,835 1,796 1,638 N/A Business re-alignment charges - (2) - - - 19 - - - (2) 19 - N/A Other 2 28 33 41 24 33 4 17 5 25 131 51 93 N/ANet income 88 114 66 70 81 29 56 25 61 331 171 237 N/A
Total Revenue by business linesWealth Management 406 366 352 347 346 321 303 331 321 1,411 1,276 1,177 N/ABanking 233 237 230 225 233 203 216 189 214 925 822 846 N/ATotal 639 603 582 572 579 524 519 520 535 2,336 2,098 2,023 N/A
Average BalancesAssets 31,900 31,700 32,100 30,900 29,700 28,900 29,100 27,500 27,900 31,100 28,400 26,600 N/ALoans and acceptances 17,800 17,400 17,600 16,600 16,100 15,100 14,900 14,200 13,200 16,900 14,400 13,100 N/ADeposits 27,600 27,100 28,300 27,600 26,500 25,200 25,500 25,700 24,400 27,400 25,200 22,400 N/AAttributed equity 2,600 2,600 2,650 2,750 2,650 2,900 2,950 2,950 2,900 2,650 2,900 2,500 N/ARisk capital 3 1,600 1,600 1,600 1,650 1,600 1,700 1,700 1,800 1,700 1,600 1,750 1,350 N/A
Business informationAssets under administration 252,300 198,400 201,700 200,400 200,300 191,800 189,400 191,800 195,800 198,400 191,800 182,900 N/AAssets under management 36,700 35,800 35,100 35,100 35,200 33,800 33,400 32,300 32,200 35,800 33,800 30,700 N/A
1 In Q1/06, we made changes to our transfer pricing methodologies and have reclassified 2005 and 2004 results. This change impacted the following line items: net interest income, total revenue, other, net income, return on equity, return on risk capital, net interest margin and economic profit. Refer to "Notes to Users" for further discussion on transfer pricing methodologies.2Includes income taxes and non-controlling interest. 3These measures are non-GAAP financial measures. Refer to "Notes to Users" for further discussion and page 25 for ROE and RORC reconciliation.4For 2002, US and International Personal and Business financial results include discontinued operations.N/A: Comparable information not available for 2002.
-9-1st Quarter 2006 - Supplementary Financial Information ROYAL BANK OF CANADA

RBC CAPITAL MARKETS 1(C$ MM) Q1/06 4 Q4/05 Q3/05 Q2/05 Q1/05 Q4/04 Q3/04 Q2/04 Q1/04 2005 2004 2003 2002
Income Statement Net interest income 120 114 52 146 186 174 211 196 211 498 792 576 603 Non-interest income 851 789 929 807 884 782 715 803 748 3,409 3,048 3,135 2,935 Total revenue 971 903 981 953 1,070 956 926 999 959 3,907 3,840 3,711 3,538 Provision for (recovery of) credit losses (PCL) (85) (25) (18) (46) (2) (28) 3 (2) (81) (91) (108) 189 475 Non-interest expense 682 1,247 696 614 700 662 664 678 827 3,257 2,831 2,442 2,253 Business realignment charges - 1 - - - 27 - - - 1 27 - - Other2 44 (260) 50 95 109 83 68 91 32 (6) 274 386 222 Net income 330 (60) 253 290 263 212 191 232 181 746 816 694 588
Total Revenue (teb) 3
Net interest income 120 114 52 146 186 174 211 196 211 498 792 576 603 Taxable equivalent basis (teb) adjustment 3 37 33 25 27 24 17 11 13 14 109 55 35 34 Net interest income (teb) 3 157 147 77 173 210 191 222 209 225 607 847 611 637 Non-interest income 851 789 929 807 884 782 715 803 748 3,409 3,048 3,135 2,935 Total Revenue (teb) 3 1,008 936 1,006 980 1,094 973 937 1,012 973 4,016 3,895 3,746 3,572
Total Revenue (teb) by business line 3
Global Markets 569 469 554 544 643 551 556 554 569 2,210 2,230 2,109 1,925 Global Investment Banking and Equity Markets 274 243 246 238 252 224 208 276 233 979 941 857 1,054 Institutional & Investor Services 84 128 130 127 115 109 120 120 106 500 455 418 396 Other 81 96 76 71 84 89 53 62 65 327 269 362 197 Total 1,008 936 1,006 980 1,094 973 937 1,012 973 4,016 3,895 3,746 3,572
Financial ratiosReturn on equity (ROE) 3 30.2 % (5.9)% 24.5% 28.6% 24.8% 20.1% 17.4% 22.1% 17.6% 17.9% 19.3% 15.6% 12.8%Return on risk capital (RORC) 3 38.1 % (7.7)% 32.4% 37.6% 32.4% 26.8% 23.5% 30.8% 23.3% 23.4% 26.0% 20.9% 16.5%
Average BalancesAssets 252,700 243,500 235,400 222,200 215,600 215,100 219,400 225,900 216,300 229,200 219,200 200,800 178,400 Loans and acceptances 20,500 19,300 17,500 16,700 16,800 17,400 19,300 19,000 18,700 17,600 18,600 25,000 28,100 Deposits 115,900 113,700 99,600 92,600 89,400 89,900 89,800 86,000 87,700 98,900 88,400 80,800 74,200 Attributed equity 4,300 4,150 4,050 4,150 4,200 4,150 4,350 4,250 4,050 4,100 4,200 4,400 4,500 Risk capital 3 3,400 3,200 3,050 3,150 3,200 3,150 3,200 3,050 3,050 3,150 3,100 3,300 3,500
Credit quality Gross impaired loans / Average loans and acceptances 0.55 % 0.61 % 0.90 % 1.38 % 2.07 % 2.33 % 2.85 % 3.56 % 4.52 % 0.67 % 2.18 % 3.15 % 4.17 %PCL / Average loans and acceptances (1.65)% (0.51)% (0.41)% (1.14)% (0.04)% (0.64)% 0.06 % (0.04)% (1.73)% (0.52)% (0.58)% 0.76 % 1.69 %Net write-offs / Average loans and acceptances (0.55)% 0.38 % 0.25 % (0.01)% (0.18)% 1.32 % 0.77 % 2.33 % (0.09)% 0.12 % 1.07 % 0.78 % 1.81 %
Business informationAssets under administration - RBC 5 - 1,361,100 1,310,100 1,294,500 1,265,700 1,202,900 1,183,400 1,186,100 1,163,500 1,361,100 1,202,900 1,096,200 N/A - RBC Dexia IS 6 1,738,100 - - - - - - - - - - - -
Other earnings measuresNet income 330 (60) 253 290 263 212 191 232 181 746 816 694 588 After-tax effect of amortization of other intangibles 1 - - - 1 - (1) 1 - 1 - - 2 Cash Net income 3 331 (60) 253 290 264 212 190 233 181 747 816 694 590 Capital charge (114) (108) (107) (105) (111) (110) (115) (110) (107) (431) (442) (479) (562) Economic Profit 3 217 (168) 146 185 153 102 75 123 74 316 374 215 28
1 In Q1/06, we made changes to our transfer pricing methodologies and have reclassified 2005 and 2004 results. This change impacted the following line items: net interest income, net interest income(teb), total revenue, total revenue(teb), other net income, return on equity, return on risk capital and economic profit. Refer to "Notes to Users" for further discussion on transfer pricing methodologies.2 Includes income taxes and non-controlling interest. 3 These measures are non-GAAP financial measures. Refer to "Notes to Users" for further discussion and page 25 for ROE and RORC reconciliation.4 The revenue disclosed under Institutional & Investor Services (IIS) as well as segment non interest income, non-interest expense, net income, ROE and RORC reflect only two months of results from November 1, 2005 to January 2, 2006, as this business was combined with the institutional investor service business of Dexia Banque Internationale a Luxembourg (Dexia) on January 2, 2006, forming a new company RBC Dexia IS. As RBC Dexia IS reports on a calendar quarter, there is a one month lag in the reporting of its earnings. For this reason, no earnings for RBC Dexia IS were recorded in the quarter ended January 31, 2006. Given the similarity of these businesses, in future quarters, management will disclose the revenue from our prior business, IIS, and our 50% proportionate ownership of RBC Dexia IS on the same line for comparative purposes. Comparative amounts in prior periods will only represent earnings for IIS.5 As a result of the creation of RBC Dexia IS, all of our Assets under administration were transferred to RBC Dexia IS. Assets under administration contributed by RBC to RBC Dexia IS on January 2, 2006, were $1.4 trillion.6 This amount represents the opening balance as at January 2, 2006, of Assets under administration belonging to RBC Dexia IS, of which RBC has a 50% ownership interest.N/A: Comparable information not available for 2002.
-10-1st Quarter 2006 - Supplementary Financial Information ROYAL BANK OF CANADA
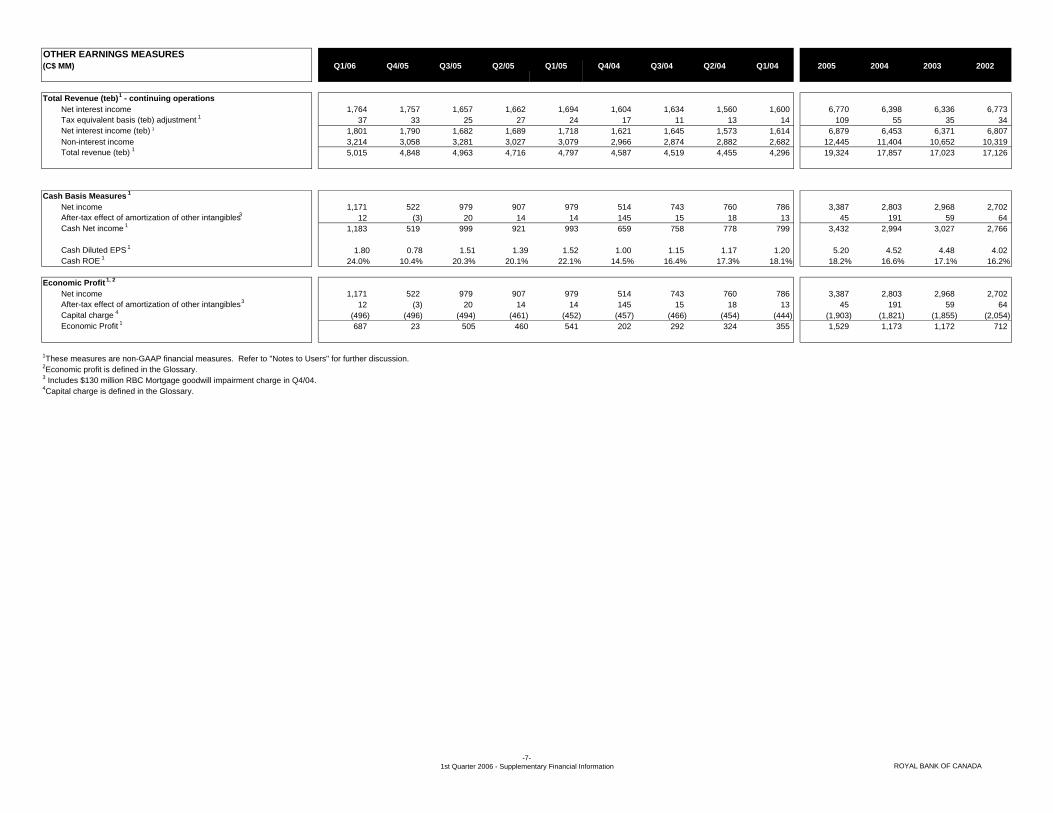
CORPORATE SUPPORT 1(C$ MM) Q1/06 Q4/05 Q3/05 Q2/05 Q1/05 Q4/04 Q3/04 Q2/04 Q1/04 2005 2004 2003 2002
Income Statement Net interest income (63) (44) (51) (26) (36) (61) (55) (74) (48) (157) (238) (143) 175 Non-interest income 34 15 37 28 53 109 52 72 (2) 133 231 164 (2) Total revenue (29) (29) (14) 2 17 48 (3) (2) (50) (24) (7) 21 173 Provision for (recovery of) credit losses (PCL) (20) (14) (15) (11) (7) (8) (8) (10) (10) (47) (36) (28) (35) Non-interest expense (9) 35 22 (17) (7) 6 (2) 7 1 33 12 (4) 14 Business realignment charges - 35 1 1 2 64 - - - 39 64 - - Other 2 (72) (49) (9) 13 10 (4) 25 9 (16) (35) 14 (24) 71 Net income (loss) 72 (36) (13) 16 19 (10) (18) (8) (25) (14) (61) 77 123
Average BalancesAssets 12,500 12,900 11,100 10,000 10,200 10,200 10,100 9,700 8,500 11,100 9,600 9,200 9,400 Loans and acceptances (3,000) (3,000) (3,300) (2,400) (2,300) (2,400) (2,700) (2,800) (2,900) (2,800) (2,800) (2,100) (1,400) Attributed equity 3,250 3,400 3,200 2,500 2,050 1,650 1,450 2,000 1,550 2,800 1,600 1,400 700
Other earnings measuresNet income (loss) 72 (36) (13) 16 19 (10) (18) (8) (25) (14) (61) 77 123 After-tax effect of amortization of other intangibles - - - - 1 1 1 (2) - 1 - - 1 Cash Net income 3 72 (36) (13) 16 20 (9) (17) (10) (25) (13) (61) 77 124 Capital charge (70) (75) (74) (55) (41) (28) (24) (37) (26) (245) (115) (99) (42) Economic Profit 3 2 (111) (87) (39) (21) (37) (41) (47) (51) (258) (176) (22) 82
DISCONTINUED OPERATIONS 4(C$ MM) Q1/06 Q4/05 Q3/05 Q2/05 Q1/05 Q4/04 Q3/04 Q2/04 Q1/04 2005 2004 2003 2002
Income Statement Net interest income 2 3 6 7 12 17 32 17 27 28 93 122 N/A Non-interest income 1 - 40 38 43 13 (10) 49 8 121 60 148 N/ATotal revenue 3 3 46 45 55 30 22 66 35 149 153 270 N/A Non-interest expense 5 37 64 57 53 78 68 65 65 211 276 244 N/A Business realignment charges - 2 9 2 - 15 - - - 13 15 - N/A Goodwill impairment - - 4 - - 130 - - - 4 130 - N/A Other 2 (1) (15) (9) (5) - (20) (18) - (10) (29) (48) 13 N/ANet income (loss) (1) (21) (22) (9) 2 (173) (28) 1 (20) (50) (220) 13 N/A
Average BalancesAssets 300 1,400 1,900 1,700 2,300 2,700 4,000 3,000 3,100 1,800 3,200 3,000 N/ALoans and acceptances 100 1,000 1,500 1,300 2,000 2,300 3,500 2,500 2,700 1,500 2,800 2,700 N/A
Other earnings measuresNet income (loss) (1) (21) (22) (9) 2 (173) (28) 1 (20) (50) (220) 13 N/A After-tax effect of amortization of other intangibles - - 6 - (4) 130 - - - 2 130 - N/ACash Net income 3 (1) (21) (16) (9) (2) (43) (28) 1 (20) (48) (90) 13 N/ACapital charge - - - - - - - - - - - - N/AEconomic Profit 3 (1) (21) (16) (9) (2) (43) (28) 1 (20) (48) (90) 13 N/A
1 In Q1/06, we made changes to our transfer pricing methodologies and have reclassified 2005 and 2004 results. This change impacted the following line items: net interest income, non-interest income, total revenue, other, net income and economic profit. Refer to "Notes to Users" for further discussion on transfer pricing methodologies.2 Includes income taxes and non-controlling interest.3 These measures are non-GAAP financial measures. Refer to "Notes to Users" for further discussion and page 25 for ROE and RORC reconciliation.4 For 2002, financial results of discontinued operations are included in RBC U.S. and International Personal and Business segment.
-11-1st Quarter 2006 - Supplementary Financial Information ROYAL BANK OF CANADA
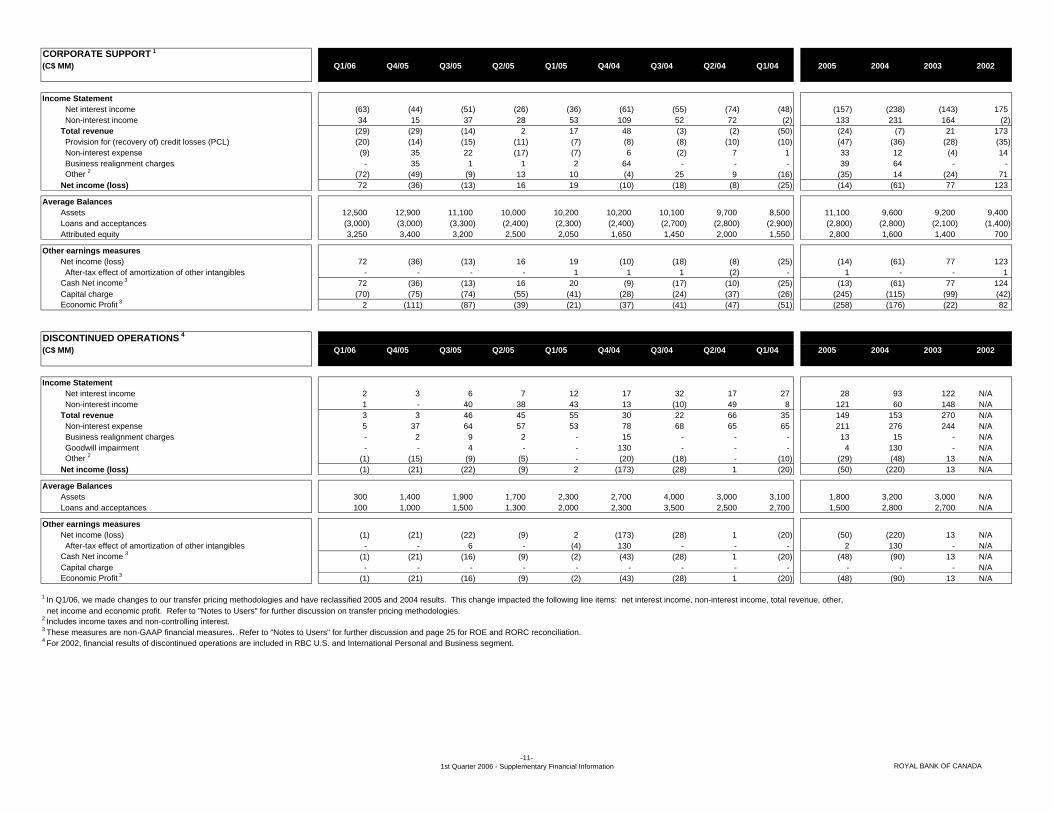
BALANCE SHEET(C$ MM) Q1/06 Q4/05 Q3/05 Q2/05 Q1/05 Q4/04 Q3/04 Q2/04 Q1/04 2005 2004 2003 2002
Period-end balancesASSETS
Cash and due from banks 4,682 5,001 5,287 4,136 4,309 3,711 6,199 4,208 4,197 5,001 3,711 2,887 2,534Interest-bearing deposits with banks 10,913 5,237 6,476 7,043 6,814 6,267 5,339 3,311 4,809 5,237 6,267 3,126 4,125Securities Trading account 131,551 125,760 117,545 101,808 99,248 89,322 90,902 92,006 95,009 125,760 89,322 87,532 75,601 Investment account 33,433 34,060 37,462 37,102 36,837 38,923 45,376 43,222 43,095 34,060 38,923 41,074 32,469 Loan substitute 674 675 675 675 675 701 301 304 312 675 701 325 394Total Securities 165,658 160,495 155,682 139,585 136,760 128,946 136,579 135,532 138,416 160,495 128,946 128,931 108,464 Assets purchased under reverse repurchase agreements and securities borrowed 47,564 42,973 44,471 43,581 36,932 46,949 45,884 45,786 38,468 42,973 46,949 41,182 38,929Loans Residential mortgage 1 91,776 91,043 88,029 84,552 82,654 81,998 79,725 76,905 76,495 91,043 81,998 75,790 72,840 Personal 41,337 41,045 40,628 39,275 37,753 36,848 35,843 34,503 32,852 41,045 36,848 32,186 30,588 Credit card 1 5,468 6,200 6,013 5,791 6,817 6,456 6,307 5,917 5,403 6,200 6,456 4,816 4,914 Business and government 55,615 53,626 52,381 49,779 49,757 47,258 50,202 50,130 50,483 53,626 47,258 49,657 59,431Total loans 194,196 191,914 187,051 179,397 176,981 172,560 172,077 167,455 165,233 191,914 172,560 162,449 167,773 Allowance for loan losses (1,439) (1,498) (1,569) (1,612) (1,638) (1,644) (1,693) (1,739) (1,846) (1,498) (1,644) (2,055) (2,203)Total loans, net of allowance for loan losses 192,757 190,416 185,482 177,785 175,343 170,916 170,384 165,716 163,387 190,416 170,916 160,394 165,570 Customers' liability under acceptances 7,951 7,074 7,005 6,654 5,960 6,184 6,499 6,191 5,693 7,074 6,184 5,943 8,051Derivative-related amounts 38,237 38,834 38,677 36,415 36,902 38,897 30,227 34,280 38,350 38,834 38,897 35,616 30,258Premises and equipment 1,736 1,708 1,722 1,753 1,767 1,738 1,738 1,754 1,734 1,708 1,738 1,648 1,653Goodwill 4,157 4,203 4,278 4,412 4,337 4,280 4,610 4,741 4,518 4,203 4,280 4,356 5,004Other intangibles 704 409 475 511 522 521 568 592 576 409 521 566 665Assets of operations held for sale 2 178 263 1,625 1,657 1,804 2,457 2,925 3,796 2,523 263 2,457 3,688 - Other assets 13,337 12,908 12,145 11,341 12,579 15,356 12,660 15,340 11,313 12,908 15,356 11,510 10,221Total assets 487,874 469,521 463,325 434,873 424,029 426,222 423,612 421,247 413,984 469,521 426,222 399,847 375,474
LIABILITIES AND SHAREHOLDERS' EQUITYDeposits Personal 111,880 111,618 112,370 114,308 113,097 111,256 113,298 111,758 109,116 111,618 111,256 106,709 101,892 Business and government 160,221 160,593 156,970 143,351 140,583 133,823 133,719 131,793 130,092 160,593 133,823 129,860 119,581 Bank 42,771 34,649 35,157 25,833 26,340 25,880 30,475 28,034 25,959 34,649 25,880 22,576 22,003Total deposits 314,872 306,860 304,497 283,492 280,020 270,959 277,492 271,585 265,167 306,860 270,959 259,145 243,476 Acceptances 7,951 7,074 7,005 6,654 5,960 6,184 6,499 6,191 5,693 7,074 6,184 5,943 8,051Obligations related to securities sold short 35,856 32,391 34,202 32,181 28,854 25,005 24,915 20,776 25,337 32,391 25,005 22,855 19,110Obligations related to assets sold under repurchase agreements and securities loaned 28,841 23,381 20,998 19,572 16,802 26,473 22,530 28,464 23,352 23,381 26,473 24,496 24,056Derivative-related amounts 42,668 42,592 42,391 41,229 41,248 42,201 32,845 37,512 40,607 42,592 42,201 37,775 32,137Insurance claims and policy benefit liabilities 7,150 7,117 6,914 6,860 6,728 6,488 6,258 5,031 4,790 7,117 6,488 4,775 2,407Liabilities of operations held for sale 2 37 40 50 47 59 62 51 57 74 40 62 50 - Other liabilities 18,584 18,408 15,680 14,557 15,390 20,172 23,155 21,634 20,470 18,408 20,172 17,850 19,405Subordinated debentures 8,116 8,167 8,839 8,101 8,190 8,116 8,440 8,423 7,639 8,167 8,116 6,243 6,614Trust capital securities 1,399 1,400 1,392 1,400 1,400 2,300 2,290 2,297 2,270 1,400 2,300 2,300 1,400Preferred share liabilities 300 300 300 300 300 300 300 300 300 300 300 300 989Non-controlling interest in subsidiaries 1,865 1,944 815 674 125 58 113 121 114 1,944 58 40 35Shareholders' equity Preferred shares 700 700 832 832 832 532 532 532 532 700 532 532 556 Common shares 7,189 7,170 7,126 7,091 7,021 6,988 7,023 7,058 7,055 7,170 6,988 7,018 6,979 Contributed surplus 3 299 265 254 242 210 169 167 140 130 265 169 85 78 Retained earnings 14,284 13,704 13,748 13,173 12,628 12,065 12,128 11,953 11,734 13,704 12,065 11,333 10,235 Treasury shares - preferred (3) (2) - - - - - - - (2) - - - - common (199) (216) (215) (227) (312) (294) (284) (257) (431) (216) (294) - - Net foreign currency translation adjustments (2,035) (1,774) (1,503) (1,305) (1,426) (1,556) (842) (570) (849) (1,774) (1,556) (893) (54) Total shareholders' equity 20,235 19,847 20,242 19,806 18,953 17,904 18,724 18,856 18,171 19,847 17,904 18,075 17,794
Total liabilities and shareholders' equity 487,874 469,521 463,325 434,873 424,029 426,222 423,612 421,247 413,984 469,521 426,222 399,847 375,474
1Reflects amounts that have been securitized. Refer to the Loan securitization information on page 14.2Relates to assets and liabilities of discontinued operations (RBC Mortgage Company)3Previously referred to as Additional paid in capital. Reflects amounts pertaining to renounced Stock Appreciation Rights, options granted on acquisitions, certain stock-based compensation awards and other treasury shares transactions.
-12-1st Quarter 2006 - Supplementary Financial Information ROYAL BANK OF CANADA

SELECTED ON AND OFF BALANCE SHEET ITEMS(C$ MM) Q1/06 Q4/05 Q3/05 Q2/05 Q1/05 Q4/04 Q3/04 Q2/04 Q1/04 2005 2004 2003 2002
SELECTED AVERAGE BALANCE SHEET ITEMS1, 4
Securities 172,000 157,000 152,400 143,200 140,100 134,200 141,400 140,400 134,800 148,200 137,700 113,400 101,600Assets purchased under reverse repurchase agreements and securities borrowed 47,100 47,400 47,500 41,500 41,100 48,200 45,600 41,800 40,000 44,400 43,900 42,400 37,000Total loans2 190,500 187,500 181,300 176,300 173,400 170,200 168,600 164,100 160,700 179,700 165,900 159,900 162,700 Residential mortgage2 91,100 89,400 86,000 83,200 82,100 80,500 77,900 75,900 76,000 85,200 77,600 72,200 69,700 Personal 2 42,400 42,000 41,600 40,000 38,600 37,700 36,300 34,200 31,400 40,600 34,900 31,000 29,800 Credit card 2 6,500 6,200 5,900 6,700 6,800 6,400 6,100 5,600 5,200 6,400 5,800 5,400 4,500 Business and government 2 52,000 51,400 49,300 48,000 47,700 47,300 50,000 50,300 50,200 49,100 49,400 53,600 61,000Customers' liability under acceptances 8,200 7,000 6,500 6,200 6,000 6,300 6,200 5,900 5,800 6,400 6,000 6,900 8,500Earning assets3 414,800 398,800 387,900 368,200 360,200 358,700 359,900 351,600 342,300 378,900 353,000 323,100 306,400Total assets 480,000 469,600 456,600 436,300 425,500 422,600 427,400 424,200 411,600 447,100 421,400 390,700 364,000Deposits 310,500 304,100 291,900 281,300 275,300 273,000 272,000 266,600 261,200 288,200 268,200 250,800 240,400Common equity 19,300 19,350 19,150 18,400 17,600 17,900 18,200 18,150 17,400 18,600 17,800 17,550 16,800Total equity 19,900 20,200 19,900 19,200 18,500 18,700 19,000 19,000 18,200 19,500 18,600 18,800 18,500
NET FOREIGN CURRENCY TRANSLATION ADJUSTMENTSBalance at beginning of period (1,774) (1,503) (1,305) (1,426) (1,556) (842) (570) (849) (893) (1,556) (893) (54) (38)Unrealized foreign currency translation gain (loss) (613) (650) (713) 325 419 (1,643) (586) 623 265 (619) (1,341) (2,988) (59)Foreign currency gain (loss) from hedging activities 352 379 515 (204) (289) 929 314 (344) (221) 401 678 2,149 43Balance at end of period (2,035) (1,774) (1,503) (1,305) (1,426) (1,556) (842) (570) (849) (1,774) (1,556) (893) (54)
RETAINED EARNINGSBalance at beginning of period 13,704 13,748 13,173 12,628 12,065 12,128 11,953 11,734 11,333 12,065 11,333 10,235 9,206Net income 1,171 522 979 907 979 514 743 760 786 3,387 2,803 2,968 2,702 Preferred share dividends (10) (11) (11) (12) (8) (7) (9) (8) (7) (42) (31) (31) (38) Common share dividends (412) (414) (393) (353) (352) (333) (336) (336) (298) (1,512) (1,303) (1,137) (1,022)Premium paid on common shares purchased for cancellation (169) (141) - - (53) (237) (223) (197) (78) (194) (735) (698) (612)Issuance costs - - - 3 (3) - - - - - - (4) (1) Cumulative effect of adopting AcG 17, Equity-linked Deposit Contracts - - - - - - - - (2) - (2) - - Balance at end of period 14,284 13,704 13,748 13,173 12,628 12,065 12,128 11,953 11,734 13,704 12,065 11,333 10,235
Assets Under Administration - RBCInstitutional 5 92,800 1,371,300 1,329,400 1,321,200 1,286,200 1,217,500 1,205,000 1,212,400 1,202,800 1,371,300 1,217,500 1,133,400 1,005,000Personal 6 383,500 344,200 347,300 343,300 342,300 328,200 341,500 350,300 331,700 344,200 328,200 309,300 326,700Retail mutual funds 5 - 54,000 50,300 48,200 45,500 43,400 42,600 40,500 36,600 54,000 43,400 35,800 34,200Total assets under administration 476,300 1,769,500 1,727,000 1,712,700 1,674,000 1,589,100 1,589,100 1,603,200 1,571,100 1,769,500 1,589,100 1,478,500 1,365,900
Assets Under Administration - RBC Dexia IS 7 1,738,100 - - - - - - - - - - - -
Assets Under ManagementInstitutional 24,000 23,300 23,300 22,800 22,200 20,600 21,900 20,600 19,600 23,300 20,600 20,100 19,100Personal 15,600 16,300 16,100 16,400 15,800 15,400 15,900 16,900 17,100 16,300 15,400 17,700 20,300Retail mutual funds 71,600 66,100 65,500 62,700 60,500 57,600 57,800 57,700 55,600 66,100 57,600 51,000 51,400Total assets under management 111,200 105,700 104,900 101,900 98,500 93,600 95,600 95,200 92,300 105,700 93,600 88,800 90,800
1Calculated using methods intended to approximate the average of the daily balances for the period. Average common equity is calculated as the average of the month-end balances for the period. 2Average total loans are reported net of allowance for loan losses. Average residential mortgage, personal, credit card and business and government balances are reported on a gross basis (before deducting allowance for loan losses).3Average earning assets are defined in the Glossary.4 All amounts are for continued operations except Total assets which includes assets of discontinued operations shown on page 11.5 As a result of the creation of RBC Dexia IS, all of our Assets under administration were transferred to RBC Dexia IS. Assets under administration contributed by RBC to RBC Dexia on January 2, 2006, were $1.4 trillion.6 Assets under administration has been restated for periods 2003 to 2005 to remove the effects of assets administered by two business lines.7This amount represents the opening balance as at January 2, 2006 of Assets under administration belonging to RBC Dexia IS, of which RBC has a 50% ownership interest.
-13-1st Quarter 2006 - Supplementary Financial Information ROYAL BANK OF CANADA

LOAN SECURITIZATION (C$ MM) Q1/06 Q4/05 Q3/05 Q2/05 Q1/05 Q4/04 Q3/04 Q2/04 Q1/04 2005 2004 2003 2002
Credit card loansOpening balance 3,100 3,100 3,100 1,900 1,900 1,900 2,158 2,546 2,675 1,900 2,675 1,675 2,100 Securitized 1,200 - - 1,200 - - - - - 1,200 - 1,000 - Reversal of prior securitizations - - - - - - (258) (388) (129) - (775) - (425) Closing balance 4,300 3,100 3,100 3,100 1,900 1,900 1,900 2,158 2,546 3,100 1,900 2,675 1,675
Commercial mortgagesOpening balance 1,237 765 770 599 603 366 258 260 129 603 129 - - Created - 479 - 176 - 242 111 - 133 655 486 131 - Amortization (9) (7) (5) (5) (4) (5) (3) (2) (2) (21) (12) (2) - Closing balance 1,228 1,237 765 770 599 603 366 258 260 1,237 603 129 -
Mortgage-backed securities - soldOpening balance 9,561 7,820 7,255 7,315 5,983 5,470 4,697 3,756 2,936 5,983 2,936 2,416 1,361 Sold 1,533 1,814 638 - 1,300 500 799 1,000 775 3,752 3,074 610 1,708 Proceeds reinvested in revolving securitizations 707 700 530 335 374 395 370 209 228 1,939 1,202 1,268 301 Amortization (929) (773) (603) (395) (342) (382) (396) (268) (183) (2,113) (1,229) (1,358) (954) Closing balance 10,872 9,561 7,820 7,255 7,315 5,983 5,470 4,697 3,756 9,561 5,983 2,936 2,416
Mortgage-backed securities - retained1
Opening balance 2,654 3,057 3,491 3,033 3,068 3,186 3,550 3,180 3,276 3,068 3,276 3,065 3,079 Created 3,169 2,567 1,036 1,008 1,847 1,026 1,079 1,795 1,077 6,458 4,977 4,084 3,734 Sold (1,533) (1,814) (638) - (1,300) (500) (799) (1,000) (775) (3,752) (3,074) (610) (1,708) Proceeds reinvested in revolving securitizations (707) (700) (530) (335) (374) (395) (370) (209) (228) (1,939) (1,202) (1,268) (301) Amortization (474) (456) (302) (215) (208) (249) (274) (216) (170) (1,181) (909) (1,995) (1,739) Closing balance 3,109 2,654 3,057 3,491 3,033 3,068 3,186 3,550 3,180 2,654 3,068 3,276 3,065
Impact of securitizations on net incomeNet interest income (86) (75) (68) (53) (43) (43) (38) (50) (47) (239) (178) (133) (124) Non-interest income 2 41 78 61 41 75 41 16 58 41 255 156 106 132 Provision for credit losses 20 14 14 11 7 8 8 10 10 46 36 29 33 Net income (25) 17 7 (1) 39 6 (14) 18 4 62 14 2 41
1Mortgage-backed securities - retained are reported as securities on the Balance Sheet. 2Excludes the impact of liquidity, credit and administration fees earned on the securitization of client or third-party assets that are recorded in securitization revenue.
-14-1st Quarter 2006 - Supplementary Financial Information ROYAL BANK OF CANADA

CAPITAL(C$ MM) Q1/06 Q4/05 Q3/05 Q2/05 Q1/05 Q4/04 Q3/04 Q2/04 Q1/04 2005 2004 2003 2002
Tier 1 capital 1
Common shareholders' equity 19,496 19,117 19,368 18,962 18,112 17,349 18,192 18,324 17,639 19,115 17,349 17,543 17,238Non-cumulative preferred shares 994 995 1,132 1,132 1,132 832 832 832 832 997 832 832 1,545Innovative capital instruments 2,907 2,835 2,292 2,299 2,285 2,300 2,291 2,297 2,259 2,835 2,300 2,300 1,400Other Non-controlling interests in subsidiaries 27 28 28 28 28 27 29 29 28 28 27 27 29Goodwill (4,033) (4,074) (4,230) (4,366) (4,293) (4,236) (4,705) (4,836) (4,610) (4,074) (4,236) (4,443) (4,832)Total Tier 1 capital 19,391 18,901 18,590 18,055 17,264 16,272 16,639 16,646 16,148 18,901 16,272 16,259 15,380
Tier 2 capital 1
Permanent subordinated debentures 864 874 868 908 972 954 999 412 397 874 954 396 467Non-permanent subordinated debentures 7,195 7,234 7,909 7,161 7,187 7,131 7,407 7,978 7,242 7,234 7,131 5,847 6,147General allowances 1,224 1,286 1,287 1,299 1,284 1,227 1,264 1,269 1,264 1,286 1,227 1,407 1,420Innovative capital instruments (excess over 15% Tier 1) 581 567 - - - - - - - 567 - - - Total Tier 2 capital 9,864 9,961 10,064 9,368 9,443 9,312 9,670 9,659 8,903 9,961 9,312 7,650 8,034
Total regulatory capital 1
Total Tier 1 and Tier 2 capital 29,255 28,862 28,654 27,423 26,707 25,584 26,309 26,305 25,051 28,862 25,584 23,909 23,414Substantial investments/investments in insurance subsidiaries/other 1 (3,152) (3,049) (3,145) (3,033) (2,913) (2,851) (3,117) (3,132) (2,631) (3,049) (2,851) (2,535) (2,402)Total regulatory capital 26,103 25,813 25,509 24,390 23,794 22,733 23,192 23,173 22,420 25,813 22,733 21,374 21,012
Capital ratios 1
Tier 1 capital ratio 9.5% 9.6% 9.7% 9.5% 9.2% 8.9% 9.1% 9.3% 9.3% 9.6% 8.9% 9.7% 9.3%Total capital ratio 12.8% 13.1% 13.4% 12.8% 12.7% 12.4% 12.7% 12.9% 12.9% 13.1% 12.4% 12.8% 12.7%
Capital generationInternal capital generation 2 749 97 575 542 619 174 398 416 481 1,833 1,469 1,801 1,643
External capital generation: - common shares (150) (97) 35 70 (19) (272) (258) (194) (41) (11) (765) (659) (602) - contributed surplus 34 11 12 32 41 2 27 10 45 96 84 7 45 - preferred shares - (132) - - 300 - - - - 168 - (645) (468) - treasury shares 16 (3) 12 85 (18) (10) (27) 174 (431) 76 (294) - - - subordinated debentures (6) (627) 773 (106) 50 (199) 63 730 1,388 90 1,982 (100) 133 Total external capital generation before TruCS (106) (848) 832 81 354 (479) (195) 720 961 419 1,007 (1,397) (892) RBC TruCS issued 3 - 1,104 - - - - - - - 1,104 - 900 - Total external capital generation (106) 256 832 81 354 (479) (195) 720 961 1,523 1,007 (497) (892) Total capital generation 643 353 1,407 623 973 (305) 203 1,136 1,442 3,356 2,476 1,304 751
Average common equity (allocated by risk type)Credit risk 5,500 5,300 5,000 5,000 4,950 5,300 5,200 5,100 5,100 5,100 5,200 5,500 5,900 Market risk (trading and non-trading) 2,400 2,350 2,300 2,200 2,000 2,150 2,200 2,000 1,900 2,200 2,100 1,600 1,500 Operational risk 2,300 2,400 2,350 2,350 2,400 2,200 2,250 2,250 2,200 2,350 2,200 2,150 1,600 Business and fixed assets risk 1,700 1,550 1,600 1,600 1,600 1,650 1,650 1,700 1,600 1,600 1,650 1,750 1,850 Insurance risk 250 200 250 200 200 150 200 150 150 200 150 600 600 Risk capital 12,150 11,800 11,500 11,350 11,150 11,450 11,500 11,200 10,950 11,450 11,300 11,600 11,450 Goodwill and intangibles 4,450 4,650 4,950 5,000 4,950 5,250 5,800 5,400 5,350 4,850 5,400 5,550 5,250 Total economic capital 16,600 16,450 16,450 16,350 16,100 16,700 17,300 16,600 16,300 16,300 16,700 17,150 16,700 Unattributed equity 2,700 2,900 2,700 2,050 1,500 1,200 900 1,550 1,100 2,300 1,100 400 100 Total average common equity 19,300 19,350 19,150 18,400 17,600 17,900 18,200 18,150 17,400 18,600 17,800 17,550 16,800
1Calculated using guidelines issued by OSFI.2Internal capital generation is net income available to common shareholders less common dividends.3 In Q4/05, we issued $1.2 billion of RBC TruCS, of which $96 million was not initially recognized as regulatory capital due to OSFI constraints.
-15-1st Quarter 2006 - Supplementary Financial Information ROYAL BANK OF CANADA

RISK ADJUSTED ASSETS 1
(C$ MM) Balance Contract/ CreditSheet Notional Current Equivalent Q1/06 Q4/05 Q3/05 Q2/05 Q1/05 Q4/04 Q3/04 Q2/04 Q1/04
On-balance sheet assetsCash resources 15,594 2,544 1,830 1,909 1,720 2,128 1,833 3,149 2,341 2,388Securities 165,658 6,150 5,326 4,254 4,646 3,759 7,092 5,420 5,627 5,824Residential mortgages 2
Insured 33,722 375 385 386 384 369 390 399 384 381 Conventional 58,109 26,562 25,592 24,020 26,078 25,150 24,561 23,759 22,929 22,271Other loans and acceptances 2
Issued or guaranteed by Canadian or other OECD governments 15,715 3,151 2,991 2,110 1,199 3,364 2,828 2,926 3,657 3,349 Other 140,736 97,266 95,639 94,512 93,032 91,874 88,412 90,595 88,309 84,919Other assets 58,287 9,786 7,014 7,222 7,123 6,753 7,852 6,976 7,846 5,819Total 487,821 145,834 138,777 134,413 134,182 133,397 132,968 133,224 131,093 124,951
Off-balance sheet credit instruments Guarantees and standby letters of credit - Financial (excluding securities lending) 3 15,756 15,756 10,861 10,329 9,526 11,909 12,620 12,627 12,744 14,601 15,512 - Non-financial 4,271 2,135 1,779 1,825 1,551 1,515 1,481 1,503 1,677 1,595 1,558 Documentary and commercial letters of credit 698 140 50 56 61 49 34 46 148 141 178 Securities lending 28,221 28,221 2,787 2,299 2,099 1,570 629 2,158 1,943 1,287 1,550 Commitments to extend credit: Less than/equal to 1 year 20,736 - - - - - - - - - - Greater than 1 year 32,885 16,443 14,595 14,968 15,207 13,564 14,819 13,828 14,371 13,158 14,199 Uncommitted amounts 45,167 - - - - - - - - - - Liquidity facilities: Less than/equal to one year with general market disruption clause 43 - - - - - - - - - - Less than/equal to one year without general market disruption clause 29,525 2,953 2,953 2,727 2,632 2,332 2,438 - - - - Greater than one year without general market disruption clause 2,672 1,336 1,336 786 1,074 1,694 845 - - - - Note issuance/Revolving underwriting facilities 7 3 3 3 4 4 14 12 14 15 13 Total 179,981 66,987 34,364 32,993 32,154 32,637 32,880 30,174 30,897 30,797 33,010
Derivative financial instrumentsInterest rate agreements 2,002,474 3,202 5,721 1,228 1,205 1,308 1,240 1,310 1,089 1,225 1,262 1,192 Foreign exchange rate contracts 977,895 8,627 19,512 4,252 4,152 4,001 4,072 4,286 4,485 3,889 4,105 4,106 Precious metals, commodities, equity linked contracts and credit derivatives 282,237 4,583 11,701 3,947 4,339 3,548 3,318 2,716 2,456 1,886 1,669 1,992 Total 3,262,606 16,412 36,934 9,427 9,696 8,857 8,630 8,312 8,030 7,000 7,036 7,290
Market risk
Total specific and general market risk 1,169,740 12.5 14,622 15,538 15,484 14,609 12,741 12,237 11,881 10,566 9,134
Total risk adjusted assets 204,247 197,004 190,908 190,058 187,330 183,409 183,002 179,492 174,385
1Calculated using guidelines issued by OSFI. 2Amounts are shown net of the allowance for loan losses.3Includes non-trading credit derivatives given guarantee treatment for credit risk capital purposes.
Risk Adjusted BalanceQ1/06
Minimum capital required
('000s) Multiplier
-16-1st Quarter 2006 - Supplementary Financial Information ROYAL BANK OF CANADA

INTEREST RATE SENSITIVITY POSITION1
(C$ MM) Q1/06 Q4/05 Q3/05 Q2/05 Q1/05 Q4/04 Q3/04 Q2/04 Q1/04 CAD FGN CAD FGN
Total assets0-3 months 209,405 216,027 204,707 199,469 187,895 192,138 173,805 182,822 168,041 117,371 92,034 122,077 93,950 4-6 months 17,042 15,921 16,802 13,424 13,300 11,954 28,772 16,294 20,210 10,041 7,001 9,035 6,886 7-12 months 17,806 19,314 20,144 23,849 21,620 17,858 17,855 18,781 24,139 11,767 6,039 12,128 7,186 1-5 years 107,579 103,987 103,701 99,092 97,473 96,218 96,952 94,902 92,369 84,286 23,293 82,915 21,072 over 5 years 34,736 31,433 32,931 33,241 33,032 30,296 34,550 28,173 26,337 13,209 21,527 11,852 19,581 non-interest rate sensitive 101,306 82,839 85,040 65,798 70,709 77,758 71,678 80,275 82,888 16,151 85,155 15,440 67,399 Total 487,874 469,521 463,325 434,873 424,029 426,222 423,612 421,247 413,984 252,825 235,049 253,447 216,074
Total liabilities and shareholders' equity0-3 months 237,758 235,327 227,327 203,776 205,440 198,261 188,682 189,826 194,577 108,143 129,615 119,215 116,112 4-6 months 20,006 17,809 20,130 17,400 14,631 18,262 28,252 22,164 14,291 12,412 7,594 11,435 6,374 7-12 months 34,818 27,569 25,004 29,167 28,344 25,087 26,415 32,298 34,270 23,925 10,893 19,793 7,776 1-5 years 84,184 80,779 83,097 80,687 77,316 71,482 71,055 69,604 67,754 57,811 26,373 56,730 24,049 over 5 years 22,563 22,798 21,210 22,012 22,556 19,989 21,362 16,357 14,561 11,172 11,391 12,121 10,677 non-interest rate sensitive 88,545 85,239 86,557 81,831 75,742 93,141 87,846 90,998 88,531 39,360 49,185 34,153 51,086 Total 487,874 469,521 463,325 434,873 424,029 426,222 423,612 421,247 413,984 252,823 235,051 253,447 216,074
Off balance sheet0-3 months 13,293 (1,146) (3,471) (15,725) (18,498) 2,262 (12,507) 2,879 12,852 (11,867) 25,160 (10,652) 9,506 4-6 months (26,598) (17,003) (15,280) (5,203) (2,561) (8,658) (10,218) (2,354) 4,998 3,948 (30,546) 2,901 (19,904) 7-12 months 11,409 7,917 8,667 9,577 12,879 6,999 28,363 8,210 764 3,605 7,804 1,727 6,190 1-5 years 24,742 19,862 20,557 12,812 14,787 7,146 (5,009) (1,604) (4,033) 174 24,568 (1,160) 21,022 over 5 years 13,865 12,904 11,701 7,926 9,100 6,263 9,232 5,411 8,362 4,685 9,180 8,036 4,868 non-interest rate sensitive (36,711) (22,534) (22,174) (9,387) (15,707) (14,012) (9,861) (12,542) (22,943) (545) (36,166) (852) (21,682) Net off-balance sheet - - - - - - - - - - - - -
Total interest rate sensitivity gap (on and off-balance sheet)0-3 months (15,060) (20,446) (26,091) (20,032) (36,043) (3,861) (27,384) (4,125) (13,684) (2,639) (12,421) (7,790) (12,656) 4-6 months (29,562) (18,891) (18,608) (9,179) (3,892) (14,966) (9,698) (8,224) 10,917 1,577 (31,139) 501 (19,392) 7-12 months (5,603) (338) 3,807 4,259 6,155 (230) 19,803 (5,307) (9,367) (8,553) 2,950 (5,938) 5,600 1-5 years 48,137 43,070 41,161 31,217 34,944 31,882 20,888 23,694 20,582 26,649 21,488 25,025 18,045 over 5 years 26,038 21,539 23,422 19,155 19,576 16,570 22,420 17,227 20,138 6,722 19,316 7,767 13,772 non-interest rate sensitive (23,950) (24,934) (23,691) (25,420) (20,740) (29,395) (26,029) (23,265) (28,586) (23,754) (196) (19,565) (5,369) Net gaps - - - - - - - - - 2 (2) - -
Before tax impact of 1% increase in rates on:Net interest income using simulation 107 106 62 87 68 70 85 114 131Economic value of equity (376) (435) (493) (390) (402) (412) (439) (434) (435)
Before tax impact of 1% decrease in rates on:Net interest income using simulation (188) (181) (137) (161) (144) (150) (94) (101) (138) Economic value of equity 240 291 348 239 318 215 272 260 266
1Incorporates management assumptions based on empirical research on consumer behaviour relating to the exercise of embedded options and on the rate paid on liabilities not linked to market rates. All interest rate measures are based upon our current exposures at a specific time. The exposures change continually as a result of day-to-day business activities and our risk management initiatives.
Q1/06 Q4/05
-17-1st Quarter 2006 - Supplementary Financial Information ROYAL BANK OF CANADA

LOANS AND ACCEPTANCES 1
(C$ MM) Q1/06 Q4/05 Q3/05 Q2/05 Q1/05 Q4/04 Q3/04 Q2/04 Q1/04 2005 2004 2003 2002
By ProductConsumer
Residential mortgages - continuing operations 91,776 91,043 88,029 84,552 82,654 81,998 79,725 76,905 76,495 91,043 81,998 75,790 72,840 Personal 41,337 41,045 40,628 39,275 37,753 36,848 35,843 34,503 32,852 41,045 36,848 32,186 30,588 Credit card 5,468 6,200 6,013 5,791 6,817 6,456 6,307 5,917 5,403 6,200 6,456 4,816 4,914 Total consumer 138,581 138,288 134,670 129,618 127,224 125,302 121,875 117,325 114,750 138,288 125,302 112,792 108,342
Business and governmentAgriculture 5,685 5,509 5,373 5,315 5,355 5,207 5,167 5,235 5,341 5,509 5,207 4,955 5,039 Automotive 2,854 2,637 2,705 2,591 2,476 2,451 2,765 2,531 2,423 2,637 2,451 2,427 2,164 Consumer goods 4,621 4,731 4,801 4,629 4,437 4,821 4,836 4,843 4,691 4,731 4,821 5,180 5,246 Energy 5,794 5,648 4,188 3,658 3,561 3,493 4,217 3,541 3,676 5,648 3,493 3,711 6,775 Financial services 3,336 2,661 3,107 2,676 2,577 1,609 2,068 2,505 2,231 2,661 1,609 2,315 5,518 Forest products 1,421 1,249 1,271 1,300 1,255 1,181 1,453 1,495 1,526 1,249 1,181 1,554 1,670 Government 2,833 2,444 3,482 2,450 2,248 2,319 2,485 2,311 2,287 2,444 2,319 2,096 1,323 Industrial products 3,490 3,229 3,206 3,214 2,984 2,887 2,968 2,958 2,978 3,229 2,887 3,012 3,728 Mining and metals 1,232 553 785 779 730 671 777 922 1,082 553 671 1,056 1,630 Real estate and related 14,742 13,977 13,772 13,285 13,177 12,420 12,961 12,835 12,826 13,977 12,420 12,463 11,673 Technology and media 2,597 2,310 2,002 1,962 1,814 2,192 2,271 2,136 2,372 2,310 2,192 2,782 4,630 Transportation and environment 2,460 2,062 2,286 2,154 2,592 2,749 2,386 2,474 3,484 2,062 2,749 3,290 4,518 Other 12,501 13,690 12,408 12,420 12,511 11,442 12,347 12,535 11,259 13,690 11,442 10,759 13,568 Total business and government 63,566 60,700 59,386 56,433 55,717 53,442 56,701 56,321 56,176 60,700 53,442 55,600 67,482
Total Loans and Acceptances 202,147 198,988 194,056 186,051 182,941 178,744 178,576 173,646 170,926 198,988 178,744 168,392 175,824 Allowance for loan losses (1,439) (1,498) (1,569) (1,612) (1,638) (1,644) (1,693) (1,739) (1,846) (1,498) (1,644) (2,055) (2,203) Total Loans and Acceptances, net of allowance for loan losses 200,708 197,490 192,487 184,439 181,303 177,100 176,883 171,907 169,080 197,490 177,100 166,337 173,621
Loans and acceptances by credit portfolio and geographic areaCanada
Residential mortgages - continuing operations 89,537 88,808 85,890 82,586 80,799 80,168 77,787 74,948 74,686 88,808 80,168 73,978 67,700 Personal 34,398 33,986 33,369 32,016 30,955 30,415 29,645 28,115 26,773 33,986 30,415 26,445 24,550 Credit card 5,289 6,024 5,838 5,614 6,648 6,298 6,142 5,753 5,245 6,024 6,298 4,663 4,740 Business and government 45,681 44,929 41,159 39,753 38,469 37,783 39,327 37,804 36,107 44,929 37,783 36,576 41,585
174,905 173,747 166,256 159,969 156,871 154,664 152,901 146,620 142,811 173,747 154,664 141,662 138,575 United States
Consumer 7,616 7,741 7,851 7,671 7,190 7,010 6,884 6,786 6,158 7,741 7,010 6,189 9,745 Business and government 12,736 12,317 13,122 12,680 12,318 11,698 12,650 12,623 13,741 12,317 11,698 13,213 16,537
20,352 20,058 20,973 20,351 19,508 18,708 19,534 19,409 19,899 20,058 18,708 19,402 26,282 Other International
Consumer 1,741 1,729 1,722 1,731 1,632 1,411 1,417 1,723 1,888 1,729 1,411 1,517 1,607 Business and government 5,149 3,454 5,105 4,000 4,930 3,961 4,724 5,894 6,328 3,454 3,961 5,811 9,360
6,890 5,183 6,827 5,731 6,562 5,372 6,141 7,617 8,216 5,183 5,372 7,328 10,967 Total
Consumer 138,581 138,288 134,670 129,618 127,224 125,302 121,875 117,325 114,750 138,288 125,302 112,792 108,342 Business and government 63,566 60,700 59,386 56,433 55,717 53,442 56,701 56,321 56,176 60,700 53,442 55,600 67,482
Total Loans and Acceptances 202,147 198,988 194,056 186,051 182,941 178,744 178,576 173,646 170,926 198,988 178,744 168,392 175,824
1Based on residence of borrower.
-18-1st Quarter 2006 - Supplementary Financial Information ROYAL BANK OF CANADA

GROSS IMPAIRED LOANSQ1/06 Q4/05 Q3/05 Q2/05 Q1/05 Q4/04 Q3/04 Q2/04 Q1/04 2005 2004 2003 2002
(C$ MM) Q4/05
Gross Impaired Loans (by credit portfolio and sector)Consumer
Residential mortgages 145 136 123 126 114 146 135 147 130 136 146 131 131 Personal 209 169 167 179 178 189 198 225 229 169 189 235 306 Total consumer 354 305 290 305 292 335 333 372 359 305 335 366 437
Business and governmentAgriculture 34 48 52 73 68 89 102 126 149 48 89 146 159 Automotive 3 2 2 3 4 4 5 5 18 2 4 7 39 Consumer goods 54 53 55 11 13 36 32 48 57 53 36 48 57 Energy 53 46 70 105 105 162 244 259 333 46 162 240 243 Financial services 16 16 16 17 16 14 16 22 42 16 14 45 77 Forest products 9 10 19 35 155 151 167 174 170 10 151 169 199 Industrial products 6 2 6 6 22 38 40 56 29 2 38 25 53 Mining and metals 3 3 4 4 5 8 5 24 52 3 8 57 128 Real estate and related 51 54 84 62 64 84 83 87 92 54 84 97 115 Small business 95 108 126 129 130 142 143 159 148 108 142 169 205 Technology and media 45 48 53 76 76 86 97 102 114 48 86 122 225 Transportation and environment 7 8 13 12 12 12 35 60 106 8 12 136 206 Other 70 71 76 82 91 98 120 144 127 71 98 118 145
Total business and government 446 469 576 615 761 924 1,089 1,266 1,437 469 924 1,379 1,851
Total Gross Impaired Loans 800 774 866 920 1,053 1,259 1,422 1,638 1,796 774 1,259 1,745 2,288
Gross Impaired Loans by credit portfolio and geographical area 1
Canada Residential mortgage - continuing operations 116 106 93 93 89 96 90 105 108 106 96 110 102 Personal 198 161 158 166 166 178 182 205 207 161 178 213 275 Business and government 214 236 294 297 430 509 570 664 705 236 509 741 895
528 503 545 556 685 783 842 974 1,020 503 783 1,064 1,272 United States Consumer 20 16 18 25 22 44 46 51 30 16 44 29 47 Business and government 172 173 223 255 269 332 420 435 436 173 332 332 537
192 189 241 280 291 376 466 486 466 189 376 361 584 Other International Consumer 20 22 21 21 15 17 15 11 14 22 17 14 13 Business and government 60 60 59 63 62 83 99 167 296 60 83 306 419
80 82 80 84 77 100 114 178 310 82 100 320 432 Total Consumer 354 305 290 305 292 335 333 372 359 305 335 366 437 Business and government 446 469 576 615 761 924 1,089 1,266 1,437 469 924 1,379 1,851 Total Gross Impaired Loans 800 774 866 920 1,053 1,259 1,422 1,638 1,796 774 1,259 1,745 2,288
1Based on residence of borrower.
-19-1st Quarter 2006 - Supplementary Financial Information ROYAL BANK OF CANADA

GROSS IMPAIRED LOANS continuedQ1/06 Q4/05 Q3/05 Q2/05 Q1/05 Q4/04 Q3/04 Q2/04 Q1/04 2005 2004 2003 2002
(C$ MM) Q4/05
Changes in Gross Impaired LoansBalance at beginning of period
Consumer 305 290 305 292 335 333 372 359 366 335 366 437 504 Business and government 469 576 615 761 924 1,089 1,266 1,437 1,379 924 1,379 1,851 1,961
774 866 920 1,053 1,259 1,422 1,638 1,796 1,745 1,259 1,745 2,288 2,465 New impaired 1
Consumer 220 272 170 256 214 220 264 267 198 912 949 850 Business and government 50 46 125 84 36 124 106 144 242 291 616 1,019
270 318 295 340 250 344 370 411 440 1,203 1,565 1,869 N/ARepayments, return to performing status, sold and other 1
Consumer (37) (106) (39) (90) (117) (91) (163) (103) (83) (352) (440) (347) Business and government (43) (76) (122) (197) (171) (156) (192) (150) (112) (566) (610) (1,083)
(80) (182) (161) (287) (288) (247) (355) (253) (195) (918) (1,050) (1,430) N/ANet impaired loan formation
Consumer 183 166 131 166 97 129 101 164 115 560 509 503 521 Business and government 7 (30) 3 (113) (135) (32) (86) (6) 130 (275) 6 (64) 759
190 136 134 53 (38) 97 15 158 245 285 515 439 1,280 Write-offs
Consumer (134) (151) (146) (153) (140) (127) (140) (151) (122) (590) (540) (574) (588) Business and government (30) (77) (42) (33) (28) (133) (91) (165) (72) (180) (461) (408) (869)
(164) (228) (188) (186) (168) (260) (231) (316) (194) (770) (1,001) (982) (1,457) Balance at end of period
Consumer 354 305 290 305 292 335 333 372 359 305 335 366 437 Business and government 446 469 576 615 761 924 1,089 1,266 1,437 469 924 1,379 1,851
800 774 866 920 1,053 1,259 1,422 1,638 1,796 774 1,259 1,745 2,288
Net Impaired Loans by credit portfolio and geographical area 2
CanadaResidential mortgages - continuing operations 106 97 84 83 79 85 80 93 95 97 85 98 87 Personal 96 60 66 68 65 70 71 85 81 60 70 84 112 Business and government 93 116 133 131 229 301 321 389 404 116 301 444 567
295 273 283 282 373 456 472 567 580 273 456 626 766 United States
Consumer 16 13 15 21 18 39 38 40 20 13 39 18 30 Business and government 154 155 169 184 195 214 242 274 285 155 214 201 325
170 168 184 205 213 253 280 314 305 168 253 219 355 Other International
Consumer 19 22 21 20 14 17 15 11 14 22 17 14 13 Business and government 31 29 26 29 29 46 53 86 125 29 46 129 260
50 51 47 49 43 63 68 97 139 51 63 143 273 Total
Consumer 237 192 186 192 176 211 204 229 210 192 211 214 242 Business and government 278 300 328 344 453 561 616 749 814 300 561 774 1,152
Total Net Impaired Loans 515 492 514 536 629 772 820 978 1,024 492 772 988 1,394
Net Write-offs by credit portfolio and geographic area 2
CanadaResidential mortgage - continuing operations 1 1 1 - 1 3 1 1 1 3 6 6 11 Personal 60 68 63 74 62 46 61 76 57 267 240 279 313 Credit card 43 49 47 49 47 44 44 42 36 192 166 152 135 Business and government 13 28 13 18 9 44 43 39 (13) 68 113 171 258
117 146 124 141 119 137 149 158 81 530 525 608 717 United States
Consumer 5 3 6 4 2 4 5 6 4 15 19 33 21 Business and government (19) 28 15 - 1 64 6 10 29 44 109 121 460
(14) 31 21 4 3 68 11 16 33 59 128 154 481 Other International
Consumer - - 1 - - - - - - 1 - - - Business and government - 2 2 1 1 5 23 97 7 6 132 50 61
- 2 3 1 1 5 23 97 7 7 132 50 61 Total
Consumer 109 121 118 127 112 97 111 125 98 478 431 470 480 Business and government (6) 58 30 19 11 113 72 146 23 118 354 342 779
Total Net Write-offs 103 179 148 146 123 210 183 271 121 596 785 812 1,259
1N/A: comparable information not available for 20022Based on residence of borrower.
-20-1st Quarter 2006 - Supplementary Financial Information ROYAL BANK OF CANADA

PROVISION FOR CREDIT LOSSESQ1/06 Q4/05 Q3/05 Q2/05 Q1/05 Q4/04 Q3/04 Q2/04 Q1/04 2005 2004 2003 2002
(C$ MM) Q4/05 Q3/04
Provision for Credit LossesSpecific
ConsumerResidential mortgages 2 1 1 1 (1) 5 - 1 1 2 7 8 2 Personal 75 70 59 74 56 42 53 73 54 259 222 254 289 Credit card 44 50 48 49 47 44 44 42 37 194 167 155 140 Total consumer 121 121 108 124 102 91 97 116 92 455 396 417 431
Business and government Agriculture (1) (13) (2) 3 - (2) 4 (1) 6 (12) 7 - 22 Automotive - (1) 2 (1) - - 1 (6) 6 - 1 (1) 1 Consumer goods - 4 20 (5) 2 1 (2) (18) - 21 (19) 10 17 Energy (27) - (15) (4) (1) 5 10 (1) 36 (20) 50 78 145 Financial services 2 - - - 10 3 - (3) - 10 - (1) (6) Forest products - (8) - (43) (2) (1) 6 (1) (1) (53) 3 13 4 Industrial products - 2 (1) (7) (3) 1 (2) 6 - (9) 5 1 (2) Mining and metals - - - - (1) - (11) 14 (7) (1) (4) 5 27 Real estate and related 1 (5) 2 (13) 1 (1) (2) (1) (3) (15) (7) (12) (16) Small business 11 13 9 18 4 19 13 27 16 44 75 77 110 Technology and media (1) (1) (2) - (4) (1) 6 (3) (1) (7) 1 30 298 Transportation and environment (7) (7) - 16 (2) (1) (1) 1 (34) 7 (35) 77 2 Other 3 (8) 13 17 (53) 8 6 19 15 (31) 48 27 32 Total business and government (19) (24) 26 (19) (49) 31 28 33 33 (66) 125 304 634
Total specific provision for credit losses 102 97 134 105 53 122 125 149 125 389 521 721 1,065 Total general provision (55) 6 (6) 11 55 (25) - - (150) 66 (175) - - Total provision for credit losses 47 103 128 116 108 97 125 149 (25) 455 346 721 1,065
Specific provision for credit loss by credit portfolio and geographic areas 1
Canada Residential mortgage - continuing operations 2 1 - 1 (1) 5 - - 1 1 6 4 2 Personal 70 68 55 71 53 42 50 68 51 247 211 230 267 Credit card 43 50 47 49 46 44 43 43 36 192 166 152 135 Business and government - (17) 25 (17) 4 13 12 12 (7) (5) 30 141 125
115 102 127 104 102 104 105 123 81 435 413 527 529 United States Consumer 6 2 6 3 4 - 4 5 4 15 13 30 27 Business and government (18) (7) - (4) (49) 19 25 16 46 (60) 106 78 413
(12) (5) 6 (1) (45) 19 29 21 50 (45) 119 108 440 Other International Consumer - - - - - - - - - - - 1 - Business and government (1) - 1 2 (4) (1) (9) 5 (6) (1) (11) 85 96
(1) - 1 2 (4) (1) (9) 5 (6) (1) (11) 86 96 Total Consumer 121 121 108 124 102 91 97 116 92 455 396 417 431 Business and government (19) (24) 26 (19) (49) 31 28 33 33 (66) 125 304 634
102 97 134 105 53 122 125 149 125 389 521 721 1,065 1Based on residence of borrower
-21-1st Quarter 2006 - Supplementary Financial Information ROYAL BANK OF CANADA

ALLOWANCE FOR CREDIT LOSSESQ1/06 Q4/05 Q3/05 Q2/05 Q1/05 Q4/04 Q3/04 Q2/04 Q1/04 2005 2004 2003 2002
(C$ MM) Q4/05 Q3/04
Allowance for credit losses by risk (ACL)Specific
ConsumerResidential mortgages 12 10 10 12 12 13 11 14 14 10 13 13 17 Personal 105 103 94 101 104 111 118 129 135 103 111 139 177 Total consumer 117 113 104 113 116 124 129 143 149 113 124 152 194 Business and governmentAgriculture 10 15 32 32 28 28 45 46 47 15 28 43 50 Automotive 2 2 2 1 - 2 2 1 7 2 2 1 14 Consumer goods 25 25 22 2 3 5 5 7 18 25 5 19 24 Energy 9 9 26 54 55 53 113 106 164 9 53 143 103 Financial services 25 24 24 25 25 14 19 21 32 24 14 31 32 Forest products 3 3 12 12 55 57 58 52 53 3 57 54 43 Industrial products 2 2 4 4 12 15 17 18 16 2 15 18 28 Mining and metals - - 1 - - 2 3 15 26 - 2 32 38 Real estate and related 5 7 9 9 11 18 20 22 21 7 18 22 34 Small business 61 53 72 75 76 80 81 93 87 53 80 89 101 Technology and media 6 6 7 11 11 13 18 30 31 6 13 35 103 Transportation and environment 1 2 4 19 5 11 26 45 65 2 11 67 59 Other 19 21 33 27 27 65 66 61 56 21 65 51 71 Total business and governement 168 169 248 271 308 363 473 517 623 169 363 605 700
General 1,224 1,286 1,287 1,298 1,284 1,227 1,264 1,269 1,264 1,286 1,227 1,407 1,420 Total 1,509 1,568 1,639 1,682 1,708 1,714 1,866 1,929 2,036 1,568 1,714 2,164 2,314
Allowance for credit loss by credit portfolio and geographic area 1
CanadaResidential mortgages - continuing operations 10 9 9 10 10 11 10 12 13 9 11 12 14 Personal 102 101 92 98 101 108 111 120 126 101 108 129 163 Business and government 121 120 161 166 201 208 249 275 301 120 208 297 329
233 230 262 274 312 327 370 407 440 230 327 438 506 United States
Consumer 4 3 3 4 4 5 8 11 10 3 5 11 17 Business and government 18 18 54 71 74 118 178 161 151 18 118 131 212
22 21 57 75 78 123 186 172 161 21 123 142 229 Other International
Consumer 1 - - 1 1 - - - - - - - - Business and government 29 31 33 34 33 37 46 81 171 31 37 177 159
30 31 33 35 34 37 46 81 171 31 37 177 159 Total
Consumer 117 113 104 113 116 124 129 143 149 113 124 152 194 Business and government 168 169 248 271 308 363 473 517 623 169 363 605 700 General 1,224 1,286 1,287 1,298 1,284 1,227 1,264 1,269 1,264 1,286 1,227 1,407 1,420
Total Allowance for Credit Loss by Geographies 1,509 1,568 1,639 1,682 1,708 1,714 1,866 1,929 2,036 1,568 1,714 2,164 2,314
Allowance for credit losses by type Allowance for loan losses 1,439 1,498 1,569 1,612 1,638 1,644 1,693 1,739 1,846 1,498 1,644 2,055 2,203 Allowance for off-balance sheet items 70 70 70 70 70 70 173 190 190 70 70 109 109 Allowance for loan substitute securities - - - - - - - - - - - - 2 Total 1,509 1,568 1,639 1,682 1,708 1,714 1,866 1,929 2,036 1,568 1,714 2,164 2,314
Changes in the allowance for credit lossesBalance at beginning of period 1,568 1,639 1,682 1,708 1,714 1,866 1,929 2,036 2,164 1,714 2,164 2,314 2,392 Provision for credit losses 47 103 128 116 108 97 125 149 (25) 455 346 721 1,065 Write-offs (164) (228) (188) (186) (168) (260) (231) (316) (194) (770) (1,001) (982) (1,457) Recoveries 61 49 40 40 45 50 48 45 73 174 216 170 198 Adjustments on acquisition 2 - - - - - - - - 6 - 6 8 18 Other adjustments 3 (3) 5 (23) 4 9 (39) (5) 15 12 (5) (17) (67) 98 Balance at end of period 1,509 1,568 1,639 1,682 1,708 1,714 1,866 1,929 2,036 1,568 1,714 2,164 2,314 1Based on residence of borrower.2Adjustment amounts include: Provident Financial Group Inc. $6 million in Q1/04; Admiralty Bancorp, Inc. $8 million in Q1/03 and Eagle Bancshares, Inc. $18 million in Q3/02.3Other adjustments include primarily foreign exchange translations on non-Canadian dollar denominated ACL.
-22-1st Quarter 2006 - Supplementary Financial Information ROYAL BANK OF CANADA

CREDIT QUALITY RATIOSQ1/06 Q4/05 Q3/05 Q2/05 Q1/05 Q4/04 Q3/04 Q2/04 Q1/04 2005 2004 2003 2002
(C$ MM) Q3/04
Diversification ratios
as a % of Total Loans and acceptances Consumer 69% 69% 69% 70% 70% 70% 68% 68% 67% 69% 70% 67% 62% Business and government 31% 31% 31% 30% 30% 30% 32% 32% 33% 31% 30% 33% 38%
Canada 87% 87% 86% 86% 86% 87% 86% 85% 83% 87% 87% 84% 79% U.S. 10% 10% 11% 11% 11% 10% 11% 11% 12% 10% 10% 12% 15% Other International 3% 3% 3% 3% 3% 3% 3% 4% 5% 3% 3% 4% 6% Condition ratios
Gross Impaired Loans [GILs] as a % of related loans and acceptances 0.40% 0.39% 0.45% 0.49% 0.58% 0.70% 0.80% 0.94% 1.05% 0.39% 0.70% 1.04% 1.30% Consumer 0.26% 0.22% 0.22% 0.24% 0.23% 0.27% 0.27% 0.32% 0.31% 0.22% 0.27% 0.32% 0.40% Business and government 0.70% 0.77% 0.97% 1.09% 1.37% 1.73% 1.92% 2.25% 2.56% 0.77% 1.73% 2.48% 2.74%
Canada 0.30% 0.29% 0.33% 0.35% 0.44% 0.51% 0.55% 0.66% 0.71% 0.29% 0.51% 0.75% 0.92% U.S. 0.94% 0.94% 1.15% 1.38% 1.49% 2.01% 2.39% 2.50% 2.34% 0.94% 2.01% 1.86% 2.22% Other International 1.16% 1.58% 1.17% 1.47% 1.17% 1.86% 1.86% 2.34% 3.77% 1.58% 1.86% 4.37% 3.94%
Net Impaired Loans [NILs] as a % of related loans and acceptances 0.25% 0.25% 0.26% 0.29% 0.34% 0.43% 0.46% 0.56% 0.60% 0.25% 0.43% 0.59% 0.79% Consumer 0.17% 0.14% 0.14% 0.15% 0.14% 0.17% 0.17% 0.20% 0.18% 0.14% 0.17% 0.19% 0.22% Business and government and acceptances 0.44% 0.49% 0.55% 0.61% 0.81% 1.05% 1.09% 1.33% 1.45% 0.49% 1.05% 1.39% 1.71%
Canada 0.17% 0.16% 0.17% 0.18% 0.24% 0.29% 0.31% 0.39% 0.41% 0.16% 0.29% 0.44% 0.55% U.S. 0.84% 0.84% 0.88% 1.01% 1.09% 1.35% 1.43% 1.62% 1.53% 0.84% 1.35% 1.13% 1.35% Other International 0.73% 0.98% 0.69% 0.85% 0.66% 1.17% 1.11% 1.27% 1.69% 0.98% 1.71% 1.95% 2.49%
PCL as a % of Average loans and acceptances 0.09% 0.21% 0.27% 0.26% 0.24% 0.22% 0.28% 0.36% (0.06)% 0.24% 0.20% 0.43% 0.62%Specific PCL as a % of Average related loans and acceptances 1 0.20% 0.20% 0.28% 0.24% 0.12% 0.27% 0.28% 0.36% 0.30% 0.21% 0.30% 0.43% 0.62% Consumer 0.34% 0.35% 0.32% 0.39% 0.32% 0.29% 0.32% 0.41% 0.33% 0.35% 0.34% 0.39% 0.42% Business and government (0.13)% (0.17)% 0.19% (0.15)% (0.37)% 0.23% 0.20% 0.24% 0.24% (0.12)% 0.23% 0.52% 0.93%
Coverage ratios
ACL as a % of total loans and acceptances 0.75% 0.79% 0.85% 0.91% 0.94% 0.97% 1.05% 1.12% 1.20% 0.79% 0.97% 1.30% 1.33% Specific ACL as a % of total loans and acceptances Consumer 0.06% 0.06% 0.05% 0.06% 0.06% 0.07% 0.07% 0.08% 0.09% 0.06% 0.07% 0.09% 0.11% Business and government 0.08% 0.09% 0.13% 0.15% 0.17% 0.20% 0.27% 0.30% 0.37% 0.09% 0.20% 0.36% 0.40%
ACL as a % of GIL 188.52% 202.49% 189.35% 182.86% 162.19% 136.14% 131.22% 117.77% 113.36% 202.49% 136.14% 124.01% 101.14%Allowance for loan losses as a % of GIL 179.77% 193.45% 181.26% 175.25% 155.54% 130.58% 119.05% 106.17% 102.78% 193.45% 130.58% 117.78% 96.37% Specific ACL as a % of GIL Consumer 14.63% 14.60% 12.01% 12.28% 11.02% 9.85% 9.07% 8.73% 8.30% 14.60% 9.85% 8.71% 8.48% Business and government 21.00% 21.83% 28.64% 29.46% 29.25% 28.83% 33.26% 31.56% 34.69% 21.83% 28.83% 34.67% 30.59%
Total net write-offs as a % of Average loans and acceptances 0.21% 0.37% 0.31% 0.33% 0.27% 0.47% 0.42% 0.65% 0.29% 0.32% 0.46% 0.49% 0.74% Consumer 0.22% 0.25% 0.25% 0.29% 0.25% 0.22% 0.25% 0.30% 0.23% 0.26% 0.25% 0.28% 0.28% Business and government and acceptances (0.01)% 0.12% 0.06% 0.04% 0.02% 0.25% 0.16% 0.35% 0.05% 0.06% 0.21% 0.21% 0.46%
Canada 0.23% 0.30% 0.26% 0.32% 0.26% 0.31% 0.34% 0.38% 0.19% 0.28% 0.31% 0.36% 0.42% U.S. (0.03)% 0.06% 0.04% 0.01% 0.01% 0.15% 0.03% 0.04% 0.08% 0.03% 0.07% 0.09% 0.28% Other International 0.00% 0.00% 0.01% 0.00% 0.00% 0.01% 0.05% 0.23% 0.02% 0.00% 0.08% 0.03% 0.04%
1 A $52 million transfer of the allocated specific allowance to the allocated general allowance during Q1/05 decreased this ratio by 0.11% or 0.03% for fiscal 2005.
-23-1st Quarter 2006 - Supplementary Financial Information ROYAL BANK OF CANADA

GOODWILLQ1/06 Q4/05 Q3/05 Q2/05 Q1/05 Q4/04 Q3/04 Q2/04 Q1/04 2005 2004 2003 2002
(C$ MM)
Opening Balance - continuing operations 4,203 4,278 4,412 4,337 4,280 4,610 4,741 4,518 4,356 4,280 4,356 5,004 4,919Net goodwill acquired 77 4 - 3 3 14 3 76 139 10 232 188 181Other adjustments1 (123) (79) (134) 72 54 (344) (134) 147 23 (87) (308) (836) (96)Closing Balance - continuing operations 4,157 4,203 4,278 4,412 4,337 4,280 4,610 4,741 4,518 4,203 4,280 4,356 5,004
BUSINESS REALIGNMENT CHARGES Q1/06Employee- Premises- Employee- Premises- Employee- Premises-
related related Other Total related related Other Total related related Other Total(C$ MM) charges charges charges charges charges charges charges charges charges charges charges charges
Opening liability balance - continuing operations 118 - - 118 109 - 1 110 164 - 13 177 Adjustments - - - - 40 - (1) 39 2 - - 2 Cash payments (27) - - (27) (30) - - (30) (12) - (2) (14) Foreign exchange translation (1) - - (1) (1) - - (1) 1 - - 1 Closing liability balance - continuing operations 90 - - 90 118 - - 118 155 - 11 166
Opening liability balance - discontinued operations 1 12 - 13 1 16 - 17 2 13 - 15 Adjustments - - - - 1 1 - 2 - - - - Cash payments (1) (1) - (2) (1) (5) - (6) (1) (2) - (3) Closing liability balance - discontinued operations - 11 - 11 1 12 - 13 1 11 - 12
Closing liability balance - total 90 11 - 101 119 12 - 131 156 11 11 178
SECURITIES MARKET VALUE SURPLUS2 Q3/05 Q2/05 Q1/05
(C$ MM) Book Value Fair Value Book Value Fair ValueGovernment Debt 10,377 10,495 118 (85) 33 12,676 12,800 124 (98) 26 142 104 122Mortgage-backed securities 9,135 9,050 (85) - (85) 8,254 8,183 (71) - (71) 2 22 45Other Debt 13,497 13,640 143 - 143 12,793 12,967 174 (9) 165 260 202 232Equity 1,098 1,078 (20) (9) (29) 1,012 974 (38) (12) (50) (41) (7) (10)Total 34,107 34,263 156 (94) 62 34,735 34,924 189 (119) 70 363 321 389
1Other adjustments include primarily foreign exchange translations on non-Canadian dollar denominated goodwill and goodwill relating to discontinued operations.2Includes investment account and loan substitute securities.
Q4/05 Q1/05
Fair Value over (under) Book Value
Unrealized gains (losses) net of Fair Value of Hedging DerivativesFair Value of
Hedging Derivatives
Unrealized gains
(losses) net of Fair Value of Hedging Derivatives
Q4/05
Fair Value over (under) Book Value
Fair Value of Hedging
Derivatives
Q1/06Unrealized
gains (losses) net of Fair Value of Hedging Derivatives
-24-1st Quarter 2006 - Supplementary Financial Information ROYAL BANK OF CANADA

ROE AND RORC RECONCILIATION 1, 2
Q1/06 Q4/05 Q3/05 Q2/05 Q1/05 Q4/04 Q3/04 Q2/04 Q1/04 2005 2004 2003 2002(C$ MM)
RBC Canadian Personal and Commercial Net Income 669 504 679 524 597 448 523 502 570 2,304 2,043 1,844 1,675
less: Preferred dividends 7 4 3 5 6 4 4 4 3 3 18 14 15 18 Net Income available to common shareholders 3 665 501 674 518 593 444 519 499 567 2,286 2,029 1,829 1,657
Average risk capital 4 6,350 6,250 5,950 5,700 5,500 5,700 5,450 5,250 5,200 5,850 5,400 5,350 5,300 Return on risk capital (RORC) 5 41.5% 31.7% 44.8% 37.3% 43.0% 31.0% 37.8% 38.6% 43.5% 39.1% 37.6% 34.3% 31.3%
ROEAdd: Average goodwill and other intangibles 2,400 2,450 2,650 2,650 2,600 2,750 3,000 2,700 2,800 2,600 2,800 2,850 2,750
Average attributed equity 4 8,750 8,700 8,600 8,350 8,100 8,450 8,450 7,950 8,000 8,450 8,200 8,200 8,050 ROE 5 30.0% 22.8% 31.1% 25.5% 29.1% 20.9% 24.4% 25.6% 28.1% 27.1% 24.7% 22.3% 20.6%
RBC US and International Personal and Business Net Income 101 135 82 86 98 37 75 33 80 401 225 340 316
less: Preferred dividends 7 1 1 2 2 1 2 2 2 2 6 8 6 8 Net Income available to common shareholders 3 100 134 80 84 97 35 73 31 78 395 217 334 308
Average risk capital 4 1,850 1,850 2,000 2,050 1,900 2,150 2,300 2,450 2,250 1,950 2,300 1,950 2,050 Return on risk capital (RORC) 5 21.2% 28.4% 16.0% 16.8% 20.0% 6.8% 12.7% 5.1% 13.9% 20.2% 9.6% 16.9% 15.0%
ROEAdd: Average goodwill and other intangibles 1,150 1,250 1,300 1,350 1,350 1,500 1,650 1,500 1,550 1,300 1,500 1,600 1,500
Average attributed equity 4 3,000 3,100 3,300 3,400 3,250 3,650 3,950 3,950 3,800 3,250 3,800 3,550 3,550 ROE 5 13.1% 17.2% 9.7% 10.2% 11.9% 4.0% 7.4% 3.1% 8.3% 12.1% 5.7% 9.4% 8.7%
RBC Capital MarketsNet Income (loss) 330 (60) 253 290 263 212 191 232 181 746 816 694 588
less: Preferred dividends 7 2 2 2 3 2 2 2 2 2 9 8 8 10 Net Income (loss) available to common shareholders 3 328 (62) 251 287 261 210 189 230 179 737 808 686 578
Average risk capital 4 3,400 3,200 3,050 3,150 3,200 3,150 3,200 3,050 3,050 3,150 3,100 3,300 3,500 Return on risk capital (RORC) 5 38.1% (7.7%) 32.4% 37.6% 32.4% 26.8% 23.5% 30.8% 23.3% 23.4% 26.0% 20.9% 16.5%
ROEAdd: Average goodwill and other intangibles 900 950 1,000 1,000 1,000 1,000 1,150 1,200 1,000 950 1,100 1,100 1,000
Average attributed equity 4 4,300 4,150 4,050 4,150 4,200 4,150 4,350 4,250 4,050 4,100 4,200 4,400 4,500 ROE 5 30.2% (5.9%) 24.5% 28.6% 24.8% 20.1% 17.4% 22.1% 17.6% 17.9% 19.3% 15.6% 12.8%
Corporate SupportNet Income (loss) 72 (36) (13) 16 19 (10) (18) (8) (25) (14) (61) 77 123
less: Preferred dividends 7 3 1 2 1 1 (1) 1 1 - 5 1 2 2 Net Income (loss) available to common shareholders 3 69 (37) (15) 15 18 (9) (19) (9) (25) (19) (62) 75 121
Average risk capital 4 550 500 500 450 550 450 550 450 450 500 500 400 600 ROE
Add: Average unattributed equity 6 2,700 2,900 2,700 2,050 1,500 1,200 900 1,550 1,100 2,300 1,100 1,000 100 Average attributed equity 4 3,250 3,400 3,200 2,500 2,050 1,650 1,450 2,000 1,550 2,800 1,600 1,400 700 ROE 5 8.7% (4.1%) (1.9%) 2.3% 3.2% (2.8%) (5.1%) (1.6%) (6.6%) (0.7%) (3.8%) 5.2% 17.0%
RBCNet income from continuing operations 1,172 543 1,001 916 977 687 771 759 806 3,437 3,023 2,955 2,702 Net income (loss) from discontinued operations (1) (21) (22) (9) 2 (173) (28) 1 (20) (50) (220) 13 N/ANet income 1,171 522 979 907 979 514 743 760 786 3,387 2,803 2,968 2,702
less: Preferred dividends 7 10 7 11 12 8 7 9 8 7 38 31 31 38 Net Income available to common shareholders 3 1,161 515 968 895 971 507 734 752 779 3,349 2,772 2,937 2,664
Average risk capital 4 12,150 11,800 11,500 11,350 11,150 11,450 11,500 11,200 10,950 11,450 11,300 11,000 11,450 Return on risk capital (RORC) - Continuing Operations 6 38.0% 18.1% 34.1% 32.7% 34.5% 23.6% 26.4% 27.3% 29.0% 29.7% 26.5% 26.4% 23.3% RORC 5 37.9% 17.3% 33.4% 32.4% 34.6% 17.6% 25.4% 27.3% 28.3% 29.3% 24.6% 26.5% 23.3%
ROEAverage common equity 19,300 19,350 19,150 18,400 17,600 17,900 18,200 18,150 17,400 18,600 17,800 17,550 16,800
ROE - Continuing Operations 6 23.6% 10.9% 20.2% 19.9% 21.6% 15.1% 16.6% 17.1% 18.3% 18.1% 16.8% 16.7% 15.8% ROE 5 23.9% 10.6% 20.0% 19.9% 21.9% 11.3% 16.1% 16.8% 17.8% 18.0% 15.6% 16.7% 15.8%
1 The average risk capital, goodwill and intangible capital, average attributed equity and average common equity figures shown above and throughout this document represent rounded figures. The ROE and RORC measures shown above and throughout this document are based on actual balances before rounding. 2 In Q1/06, we made changes to our transfer pricing methodologies and have reclassifed 2005 and 2004 results. This change impacted the following line items: net income, net income available to common shareholders, RORC and ROE in each of our segments.3 Segment return calculations are based on segment net income less an allocation of preferred dividends (based on each segment's common equity).4 Average risk capital includes credit, market (trading and non-trading), insurance, operational, business and fixed assets risk capital. Average attributed equity includes risk capital plus the net amounts of goodwill and intangibles capital. 5 RORC is based on average risk capital only. Segment ROE is based on average attributed equity. We do not report RORC for Corporate Support as it is not considered meaningful.6 Unattributed equity is reported in our Corporate Support segment and included in its calculation of ROE.7 Preferred dividends include a net gain on redemption of preferred shares.
-25-1st Quarter 2006 - Supplementary Financial Information ROYAL BANK OF CANADA

U.S. GAAP RECONCILIATION(C$ MM) Q1/06 Q4/05 Q3/05 Q2/05 Q1/05 Q4/04 Q3/04 Q2/04 Q1/04 2005 2004 2003 2002
Net income from continuing operations, Canadian GAAP 1,172 543 1,001 916 977 687 771 759 806 3,437 3,023 2,955 2,702 Differences:Net interest income
Derivatives instruments and hedging activities 7 8 12 12 4 5 2 5 (2) 36 10 (1) (65) Variable interest entities - - - - - (3) 2 (4) (14) - (19) (15) - Joint ventures - - - - - - - - - - - (2) (1) Liabilities and equity 28 29 29 29 28 42 42 40 42 115 166 152 163
Non-interest incomeInsurance accounting (140) (145) (157) (138) (166) (169) (160) (159) (115) (606) (603) (311) (133) Derivatives instruments and hedging activities (33) 4 10 (7) 4 (34) 23 6 4 11 (1) 29 156 Reclassification of securities 3 27 - - - - - 4 3 27 7 (12) - Variable interest entities - - - - - - (2) 1 1 - - 1 - Limited partnerships (1) (3) (2) (2) (2) 4 5 (5) (15) (9) (11) - - Joint ventures (40) (47) (39) (48) (37) (39) (40) (34) (33) (171) (146) (147) (150) Other (4) - - - (4) - 3 (3) - (4) - 5 (2)
Provision for (recovery of) credit losses Reclassification of securities - - - - - - - (4) 3 - (1) 6 - Joint ventures (1) - 1 17 - - - - - 18 - - -
Insurance policyholder benefits, claims and acquisition expenseInsurance accounting 102 51 155 144 234 166 145 157 114 584 582 270 205
Non-interest expenseStock appreciation rights 6 7 3 15 - 2 - (4) (1) 25 (3) 16 17 Insurance accounting 16 19 20 16 17 10 15 13 9 72 47 58 38 Joint ventures 30 33 27 29 29 30 31 27 26 118 114 122 122 Variable interest entities - - - - - (10) (15) (10) - - (35) - - Other - - - - - (1) - - - - (1) (1) (1)
Income taxes and net difference in income taxes due to the above items 22 26 (4) (12) (23) 17 (2) 9 11 (13) 35 9 (50) Non-controlling interest in net income of subsidiaries
Variable interest entities - - - - 13 15 12 12 - 52 14 - Liabilities and equity (25) (25) (26) (25) (25) (38) (39) (37) (38) (101) (152) (115) (103)
Net income from continuing operations, U.S. GAAP 1,142 527 1,030 946 1,036 682 796 773 813 3,539 3,064 3,033 2,898
Net income (loss) from discontinued operations, Canadian GAAP (1) (21) (22) (9) 2 (173) (28) 1 (20) (50) (220) 13 N/ADifferences - Other - 3 - (1) 3 (5) - - - 5 (5) (10) N/ANet income (loss) from discontinued operations, U.S. GAAP (1) (18) (22) (10) 5 (178) (28) 1 (20) (45) (225) 3 N/A
Net income, U.S. GAAP 1,141 509 1,008 936 1,041 504 768 774 793 3,494 2,839 3,036 2,898
U.S. GAAP:Basic earnings per share 1.75$ 0.77$ 1.54$ 1.43$ 1.61$ 0.77$ 1.17$ 1.17$ 1.20$ 5.34$ 4.31$ 4.47$ 4.16$ Basic earnings per share from continuing operations 1.75$ 0.80$ 1.57$ 1.45$ 1.60$ 1.05$ 1.21$ 1.17$ 1.23$ 5.41$ 4.66$ 4.47$ 4.16$ Basic earnings per share from discontinued operations -$ (0.03)$ (0.03)$ (0.02)$ 0.01$ (0.28)$ (0.04)$ -$ (0.03)$ (0.07)$ (0.35)$ -$ -$
Diluted earnings per share 1.72$ 0.76$ 1.52$ 1.41$ 1.58$ 0.76$ 1.15$ 1.16$ 1.18$ 5.26$ 4.25$ 4.42$ 4.12$ Diluted earnings per share from continuing operations 1.72$ 0.79$ 1.55$ 1.43$ 1.57$ 1.03$ 1.19$ 1.16$ 1.21$ 5.33$ 4.59$ 4.42$ 4.12$ Diluted earnings per share from discontinued operations -$ (0.03)$ (0.03)$ (0.02)$ 0.01$ (0.27)$ (0.04)$ -$ (0.03)$ (0.07)$ (0.34)$ -$ -$
-26-1st Quarter 2006 - Supplementary Financial Information ROYAL BANK OF CANADA