Supplementary Figures and Tables · 2015-06-26 · BLUEPRINT / IHEC - Kulis et al., revised version...
29
BLUEPRINT / IHEC - Kulis et al., revised version submitted March 2015 1 Supplementary Figures and Tables Whole-genome fingerprint of the DNA methylome during human B-cell differentiation Marta Kulis, Angelika Merkel, Simon Heath, Ana C. Queirós, Ronald P. Schuyler, Giancarlo Castellano, Renée Beekman, Emanuele Raineri, Anna Esteve, Guillem Clot, Nuria Verdaguer-Dot, Martí Duran-Ferrer, Nuria Russiñol, Roser Vilarrasa-Blasi, Simone Ecker, Vera Pancaldi, Daniel Rico, Lidia Agueda, Julie Blanc, David Richardson, Laura Clarke, Avik Datta, Marien Pascual, Xabier Agirre, Felipe Prosper, Diego Alignani, Bruno Paiva, Gersende Caron, Thierry Fest, Marcus O. Muench, Marina E. Fomin, Seung-Tae Lee, Joseph L. Wiemels, Alfonso Valencia, Marta Gut, Paul Flicek, Hendrik G. Stunnenberg, Reiner Siebert, Ralf Küppers, Ivo G. Gut, Elías Campo, José I. Martín-Subero* * Correspondence and requests for materials should be addressed to J.I.M.-S. ([email protected]) Nature Genetics: doi:10.1038/ng.3291
Transcript of Supplementary Figures and Tables · 2015-06-26 · BLUEPRINT / IHEC - Kulis et al., revised version...

BLUEPRINT / IHEC - Kulis et al., revised version submitted March 2015
1
Supplementary Figures and Tables
Whole-genome fingerprint of the DNA methylome during human B-cell differentiation
Marta Kulis, Angelika Merkel, Simon Heath, Ana C. Queirós, Ronald P. Schuyler, Giancarlo Castellano, Renée Beekman, Emanuele Raineri, Anna Esteve, Guillem Clot, Nuria Verdaguer-Dot, Martí Duran-Ferrer, Nuria Russiñol, Roser Vilarrasa-Blasi, Simone Ecker, Vera Pancaldi, Daniel Rico, Lidia Agueda, Julie Blanc, David Richardson, Laura Clarke, Avik Datta, Marien Pascual, Xabier Agirre, Felipe Prosper, Diego Alignani, Bruno Paiva, Gersende Caron, Thierry Fest, Marcus O. Muench, Marina E. Fomin, Seung-Tae Lee, Joseph L. Wiemels, Alfonso Valencia, Marta Gut, Paul Flicek, Hendrik G. Stunnenberg, Reiner Siebert, Ralf Küppers, Ivo G. Gut, Elías Campo, José I. Martín-Subero*
* Correspondence and requests for materials should be addressed to J.I.M.-S. ([email protected])
Nature Genetics: doi:10.1038/ng.3291

BLUEPRINT / IHEC - Kulis et al., revised version submitted March 2015
2
Supplementary figures
Supplementary Fig. 1 Reproducibility of DNA methylation data generated by WGBS and 450k microarrays. Heatmap showing the correlation matrices (Pearson correlation coefficient) of pair wise comparisons using 16.1 million CpGs with methylation estimates across all samples by WGBS (a) and 475,030 sites by 450k arrays (b). HPC: hematopoietic progenitor cell. preB1C: pre-B-I cell. preB2C: pre-B-II cell. iBC: immature B cell. naiBCs: naive B cell from peripheral blood. t-naiBCs: naive B cell from tonsil. gcBC: germinal center B cell. t-PC: plasma cell from tonsil. memBC: memory B cell from peripheral blood. bm-PCs: plasma cell from bone marrow. R1: first set of replicates. R2: second set of replicates.
naiBC gcBC memBC bm-PCpreB2CHPCR1 R2 R1 R2 R1 R2 R1 R2 R1 R2 R1 R2
R1R2
R1R2
R1R2
R1R2
R1R2
R1R2
naiBC
gcBC
memBC
bm-PC
preB2C
HPC
Correlation coefficient0.7 0.8 0.9 1.0
a b
naiBC
gcBC
memBCbm-PC
preB1C
HPC
preB2C
iBC
t-naiBC
t-PC
Correlation coefficient0.8 0.9 1.0
Nature Genetics: doi:10.1038/ng.3291

BLUEPRINT / IHEC - Kulis et al., revised version submitted March 2015
3
Supplementary Fig. 2 Validation of WGBS and microarray DNA methylation data by bisulfite pyrosequencing. (a) Five CpGs with distinct methylation patterns throughout B-cell differentiation, as measured by microarrays, were selected for validation by bisulfite pyrosequencing. (b) Scatter plot showing the correlation between DNA methylation values generated by microarrays and bisulfite pyrosequencing. c) 3D scatter plot showing the correlation among WGBS, microarrays and bisulfite pyrosequencing. These analyses show that all three techniques generate highly reproducible DNA methylation estimates, being all correlation coefficients of pair-wise comparisons above 0.95. All three techniques were done with independent sorted cell subpopulations and therefore, in addition to the technical reproducibility, this analysis also underscores the high biological reproducibility. HPC: hematopoietic progenitor cell. preB1C: pre-B-I cell. preB2C: pre-B-II cell. iBC: immature B cell. naiBCs: naive B cell from peripheral blood. t-naiBCs: naive B cell from tonsil. gcBC: germinal center B cell. t-PC: plasma cell from tonsil. memBC: memory B cell from peripheral blood. bm-PCs: plasma cell from bone marrow
BLNK
HOXA1
Enhancer
PcG region
KLF6
LYN
cg06048750
cg21441674
cg07659054
cg02980499
cg20540372 BLNK
TargetID Gene Namea
b c
0 1
1
Mea
n DN
A m
ethy
latio
nva
lues
mea
sure
dby
mic
roar
rays
DNA methylation by pyrosequencing DNA methylation by pyrosequencing
DNA
met
hyla
tion
byW
GBS
DNA methylation10
HCP preB1C preB2C iBC naiBC t-naiBC gcBC t-PC memBCbm-PC
cg02980499 (BLNK) cg20540372 (BLNK) cg06048750 (KLF6) cg21441674 (LYN) cg07659054 (HOXA1)
r=0.975
WGBS-Pyro, r=0.974450k-Pyro, r=0.979WGBS-450k, r=0.955
Nature Genetics: doi:10.1038/ng.3291

BLUEPRINT / IHEC - Kulis et al., revised version submitted March 2015
4
Supplementary Fig. 3 Unsupervised clustering of DNA methylation data of all B-cell subpopulations. Hierarchical clustering of the 81,468 CpGs with the most variable methylation levels (SD > 0.1) among all the samples. Two major clusters can be identified: “antigen-inexperienced” B-cell subpopulations (i.e. HPCs, preBCs and naiBCs) marked with green box and “antigen-experienced” B-cell subpopulations (i.e. gcBCs, memBCs and PCs) marked with violet box. HPC: hematopoietic progenitor cell. preB1C: pre-B-I cell. preB2C: pre-B-II cell. iBC: immature B cell. naiBCs: naive B cell from peripheral blood. t-naiBCs: naive B cell from tonsil. gcBC: germinal center B cell. t-PC: plasma cell from tonsil. memBC: memory B cell from peripheral blood. bm-PCs: plasma cell from bone marrow.
DNA
met
hyla
tion 1
0
HPC preB1C preB2C iBC naiBC t-naiBC
gcBC t-PC memBC bm-PC
“Antigen-inexperienced” “Antigen-experienced”
Nature Genetics: doi:10.1038/ng.3291

BLUEPRINT / IHEC - Kulis et al., revised version submitted March 2015
5
Supplementary Fig. 4 Validation by bisulfite pyrosequencing (BPS) of the presence of non-CpG methylation in HPCs and demethylation upon B- cell commitment independent of changes in flanking CpG sites. The four different regions shown in panels a to d confirm that non-CpG methylation sharply decreases upon B-cell commitment in the absence of simultaneous demethylation of flanking CpGs (independently of the distance between non-CpG and CpGs sites). In the subsequent maturation stages non-CpG methylation is at the detection threshold of BPS, and therefore can be considered negligible. Above BPS data representation, we also show data obtained by WGBS. The two techniques were performed in two independent biological replicates, confirming that non-CpG methylation of the studied sites in HPCs is conserved. HPC: hematopoietic progenitor cell. preB1C: pre-B-I cell. preB2C: pre-B-II cell. iBC: immature B cell. naiBCs: naive B cell from peripheral blood. memBC: memory B cell from peripheral blood.
WGBS data
BPS data
memBCnaiBCiBC
HPCpreB1CpreB2C
CACchr2: 85933406
CpGCpG48 bp 102 bp
1
0
1
0
1
0
0.5
0
1
0
1
0
DN
A m
ethy
latio
n le
vel
DN
A m
ethy
latio
n le
vel
CACchr10: 114544727
CpGCpG64 bp 65 bp
1
0
1
0
1
0
0.5
0
1
0
1
0
DN
A m
ethy
latio
n le
vel
DN
A m
ethy
latio
n le
vel
CACchr7: 1007514
CpGCpG8 bp 3 bp
1
0
1
0
1
0
0.5
0
1
0
1
0
DN
A m
ethy
latio
n le
vel
DN
A m
ethy
latio
n le
vel
CACchr3: 127543235
CpGCpG14 bp 11 bp
1
0
1
0
1
0
0.5
0
1
0
1
0
DN
A m
ethy
latio
n le
vel
DN
A m
ethy
latio
n le
vel
a
b
c
d
WGBS data
BPS data
WGBS data
BPS data
WGBS data
BPS data
Nature Genetics: doi:10.1038/ng.3291

BLUEPRINT / IHEC - Kulis et al., revised version submitted March 2015
6
Supplementary Fig. 5 Genomic location of methylated non-CpGs sites. The non-CpG sites methylated in hematopoietic precursor cells (HPC) are significantly enriched in (a) introns and (b) exons, and depleted in (c) lamina-associated domains (LADs). As background (Backgr.), we used the percentage of cytosines in non-CpG context located within each feature in the whole genome.
Supplementary Fig. 6 Distribution of the distance of hypomethylated non-CpGs and CpGs in preB2Cs as compared to HPCs. The genomic distance from hypomethylated non-CpGs in preB2C vs. HPC to the nearest CpG (shown by a blue line) is much closer than the distance to the nearest hypomethylated CpG (shown by an orange line) (P < 2.2x10⁻¹⁶). Data from the first (a) and second (b) set of biological replicates are shown. HPC: hematopoietic progenitor cell. preB2C: pre-B-II cell.
Backgr. HPC.R1 HPC.R2 Backgr. HPC.R1 HPC.R2 Backgr. HPC.R1 HPC.R2
Introns Exons LADs
0
0
0
0
0
0
0
0
0
0
0
0
0% 0% 0%
a b cP<1.10-6
P<1.10-6
P<1.10-6 P<1.10-6
P<1.10-6 P<1.10-680% 7% 40%
-20kb -10kb 0 10kb 20kb
Distance to thenearest CpG
Frac
tion
1
0
Genomic distance
Distance to the nexthypomethylated CpG
Frac
tion
1
0-20kb -10kb 0 10kb 20kb
Distance to thenearest CpG
Genomic distance
Distance to the nexthypomethylated CpG
PreB2C.R1 vs HPC.R1 PreB2C.R2 vs HPC.R2
a b
Nature Genetics: doi:10.1038/ng.3291
BLUEPRINT / IHEC - Kulis et al., revised version submitted March 2015
7
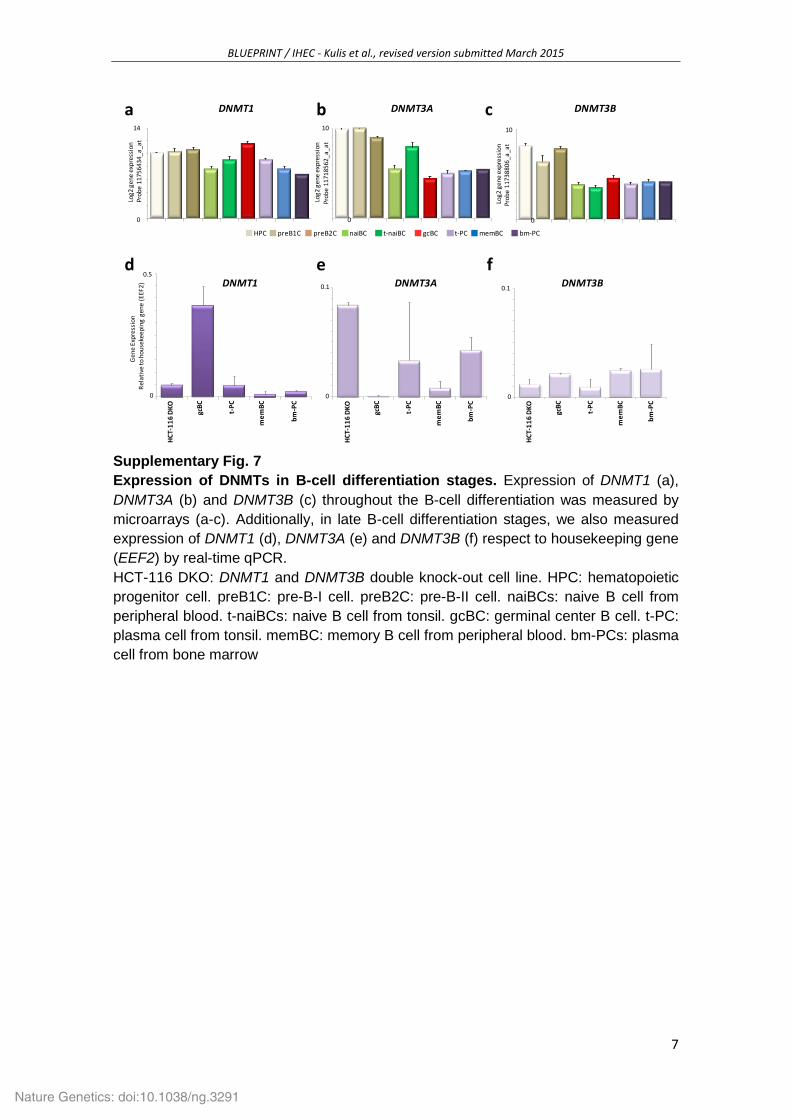
Supplementary Fig. 7 Expression of DNMTs in B-cell differentiation stages. Expression of DNMT1 (a), DNMT3A (b) and DNMT3B (c) throughout the B-cell differentiation was measured by microarrays (a-c). Additionally, in late B-cell differentiation stages, we also measured expression of DNMT1 (d), DNMT3A (e) and DNMT3B (f) respect to housekeeping gene (EEF2) by real-time qPCR. HCT-116 DKO: DNMT1 and DNMT3B double knock-out cell line. HPC: hematopoietic progenitor cell. preB1C: pre-B-I cell. preB2C: pre-B-II cell. naiBCs: naive B cell from peripheral blood. t-naiBCs: naive B cell from tonsil. gcBC: germinal center B cell. t-PC: plasma cell from tonsil. memBC: memory B cell from peripheral blood. bm-PCs: plasma cell from bone marrow
HCT-
116
DKO
gcBC
t-PC
mem
BC
bm-P
C
HCT-
116
DKO
gcBC
t-PC
mem
BC
bm-P
C
HCT-
116
DKO
gcBC
t-PC
mem
BC
bm-P
C
DNMT1 DNMT3A DNMT3B
Rela
tive
toho
usek
eepi
ngge
ne (E
EF2)
0.5
0.1 0.1
00 0
Gen
e Ex
pres
sion
fed
14
0
10
10
Prob
e11
7388
06_a
_at
DNMT3BDNMT1 DNMT3A
Prob
e11
7185
62_a
_at
Prob
e11
7564
34_a
_at
cba
0 0
HPC preB1C preB2C naiBC t-naiBC gcBC t-PC memBC bm-PC
Log2
gen
e ex
pres
sion
Log2
gen
e ex
pres
sion
Log2
gen
e ex
pres
sion
Nature Genetics: doi:10.1038/ng.3291
BLUEPRINT / IHEC - Kulis et al., revised version submitted March 2015
8
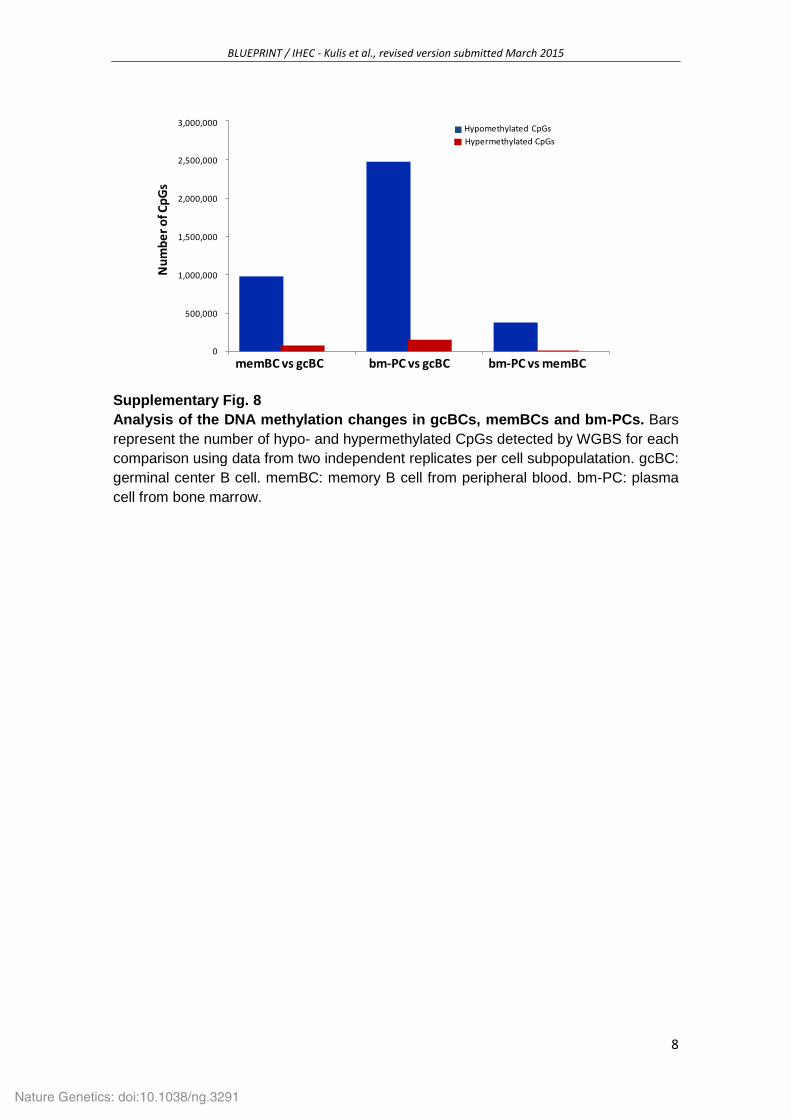
Supplementary Fig. 8 Analysis of the DNA methylation changes in gcBCs, memBCs and bm-PCs. Bars represent the number of hypo- and hypermethylated CpGs detected by WGBS for each comparison using data from two independent replicates per cell subpopulatation. gcBC: germinal center B cell. memBC: memory B cell from peripheral blood. bm-PC: plasma cell from bone marrow.
3,000,000
2,500,000
2,000,000
1,500,000
1,000,000
500,000
0
Hypomethylated CpGsHypermethylated CpGs
memBC vs gcBC bm-PC vs gcBC bm-PC vs memBC
Num
bero
f CpG
s
Nature Genetics: doi:10.1038/ng.3291

BLUEPRINT / IHEC - Kulis et al., revised version submitted March 2015
9
Supplementary Fig. 9 Modulation of the DNA methylation pattern of key B-cell genes during the differentiation process. This analysis shows smoothed DNA methylation data generated by WGBS across the promoter region and gene body of (a) BCL2, (b) EBF1 and (c) IRF4. The DNA methylation pattern of these genes is widely modulated in different B-cell subpopulations, especially in enhancer regions. HPC: hematopoietic progenitor cell. preB2C: pre-B-II cell. naiBCs: naive B cell from peripheral blood. gcBC: germinal center B cell. memBC: memory B cell from peripheral blood. bm-PCs: plasma cell from bone marrow
410,000400,000390,000
chr6cGM12878
Chrom. HMM
DNAMethylation
(WGBS)
1
0
60,950,00060,850,000
chr18aGM12878
Chrom. HMM
DNAMethylation
(WGBS)
1
0
158,500,000158,300,000158,200,000
chr5158,400,000
GM12878 Chrom. HMM
DNAMethylation
(WGBS)
1
0
b
HPC preB2C naiBC gcBC memBC bm-PCActive Promoter Weak Promoter Strong Enhancer Weak Enhancer Transcribed Weak Transcribed
Nature Genetics: doi:10.1038/ng.3291

BLUEPRINT / IHEC - Kulis et al., revised version submitted March 2015
10
Supplementary Fig. 10 Comparison between the number of dynamically methylated CpGs during B-cell differentiation and in a wide range of human cells and tissues. Diagram showing the number of dynamically methylated CpGs in our study (4.93 million) that were also detected as dynamic by Ziller et al. (Ref. 1) in a DNA methylome study of multiple human cells and tissues.
Supplementary Fig. 11 Selection of five epigenetic biomarkers to identify each B-cell subpopulation. A selection of 5 CpGs in genes important for B-cell differentiation (BLK, SEMA4B, ARID3A, AICDA, and PRDM1) with different methylation patterns across B-cell differentiation is able to identify correctly each B-cell subpopulation (with the exception of naive B cells from tonsil and peripheral blood, which have virtually identical methylomes). We used the following procedure to identify these 5 CpGs: From each comparison of adjacent B-cell subsets, we selected two CpGs among those with the highest significance. Out of these comparisons, we ended up with a list of 16 unique CpGs. With those 16 CpGs, we calculated the misclassification rate of each combination of CpGs using the linear discriminant analysis (LDA) function (R software) and finally selected a combination of 5 CpGs that accurately classify all cell subpopulations.
1,647,103(33%)
3,284,694(66%)
Total of 4,931,797 dynamic CpGs detected by WGBS
CpGs with dynamicmethylation both duringB-cell differentiation andin the study by Ziller et al.
CpGs with dynamicmethylation only duringB-cell differentiation
BLK
PRDM1
ARID3A
AICDA
cg08894487
cg07999668
cg02108623
cg22826986
cg26955540 SEMA4B
TargetID Gene Name
DNA methylation10
HCP preB1C preB2C iBC naiBC t-naiBC gcBC t-PC memBCbm-PC
Nature Genetics: doi:10.1038/ng.3291

BLUEPRINT / IHEC - Kulis et al., revised version submitted March 2015
11
Supplementary Fig. 12 Genomic annotation of differentially methylated CpGs during B-cell differentiation. (a) Characterization of differentially methylated CpGs detected by WGBS. (B) Characterization of CpGs from the 20 modules defined by microarrays. (a-b) From upper to lower panel: Relative distribution of CpGs within CGI, in CGI shores, shelves and outside CGIs; Percentages of CpGs in intergenic and genic regions (gray color scale represents fold-change enrichment as compared to the background); Relative distribution of CpGs across different gene-related regions; Bckg – all CpGs included in each analysis (n = 16,117,712 for WGBS (a) and n = 475,030 in case of microarrays (b)). CGI shores: 0–2 kb from island edge. CGI shelves: >2 to 4 kb from island edge. UTR: untranslated region. TSS200: 1–200 bp upstream of the transcription start site (TSS). TSS1500: 201–1500 bp upstream of TSS. CGI: CpG island. HPC: hematopoietic progenitor cell. preB2C: pre-B-II cell. naiBC: naive B cell from peripheral blood. gcBC: germinal center B cell. memBC: memory B cell from peripheral blood. bm-PC: plasma cell from bone marrow.
17 14 19 14 18 19 17 23 25 13 11 16 23 21 14 20 22 21 16 16 15
83 86 81 86 82 81 83 77 75 87 89 84 77 79 86 80 78 79 84 8485
I. II. III. IV.
Bckg
CGI l
ocat
ion
% Intergenic
% gene-related
Gen
e-re
late
dlo
catio
n
Outside CGI CGI Shelf CGI Shore CGI
Intergenic or gene-relatedCpG enrichment
0 1 2
Modules: 1 2 3 4 5 6 7 8 9 10 11 12 13 14 15 16 17 18 19 20
preB
2C v
s. H
PC
naiB
C vs
. pre
B2C
gcBC
vs. n
aiBC
bm-P
C vs
. gcB
C
preB
2C v
s. H
PC
naiB
C vs
. pre
B2C
gcBC
vs. n
aiBC
bm-P
C vs
. gcB
C
Hypomethylated Hypermethylated
CGI l
ocat
ion Bc
kg
% Intergenic
% gene-related
Gen
e-re
late
dlo
catio
n
1
1
481 1 1 143 40 54 60
52
a bIntronExon 3’UTRTSS1500 TSS200 5’UTR 1st.Exon
1 1 1 157 60 46 40
1 1 1 134 39 40 31
1 1 1 166 61 60 69
Nature Genetics: doi:10.1038/ng.3291

BLUEPRINT / IHEC - Kulis et al., revised version submitted March 2015
12
Supplementary Fig. 13 DNA methylation of major DNA repeat families in B-cell subpopulations sequenced by WGBS. Boxplot representation of DNA methylation values of CpGs associated with different repetitive elements. We show the data from the first set of replicates (upper panel) and second set of replicates (lower panel). HPC: hematopoietic progenitor cell. preB2C: pre-B-II cell. naiBC: naive B cell from peripheral blood. gcBC: germinal center B cell. memBC: memory B cell from peripheral blood. bm-PC: plasma cell from bone marrow.
Satellites LINE SINE LTR
naiB
C
gcBC
mem
BC
preB
2C
HPC
bm-P
C
1
0.75
0.5
0.25
0
DN
A m
ethy
latio
n
naiB
C
gcBC
mem
BC
preB
2C
HPC
bm-P
C
naiB
C
gcBC
mem
BC
preB
2C
HPC
bm-P
C
naiB
C
gcBC
mem
BC
preB
2C
HPC
bm-P
C
Satellites LINE SINE LTR
naiB
C
gcBC
mem
BC
preB
2C
HPC
bm-P
C
1
0.75
0.5
0.25
0
DN
A m
ethy
latio
n
naiB
C
gcBC
mem
BC
preB
2C
HPC
bm-P
C
naiB
C
gcBC
mem
BC
preB
2C
HPC
bm-P
C
naiB
C
gcBC
mem
BC
preB
2C
HPC
bm-P
C
First set of samples
Second set of samples
Nature Genetics: doi:10.1038/ng.3291

BLUEPRINT / IHEC - Kulis et al., revised version submitted March 2015
13
Supplementary Fig. 14 Immortalized mature B cells (i.e. lymphoblastoid B-cell lines) show a DNA methylation profile similar to normal memory B cells from peripheral blood and plasma cells from bone marrow (i.e. memBCs and bm-PCs, respectively). Unsupervised hierarchical clustering analysis of CpGs with variable DNA methylation levels (SD > 0.2) in lymphoblastoid B cell lines (including GM12878), ESC cell line (H1) and sorted cells from multiple B-cell differentiation stages. Based on this analysis, we decided to use the chromatin states categorization of GM12878 (ENCODE) as a representative model of mature B cells.
Supplementary Fig. 15 Epigenomic and transcriptional characterization of CpGs with dynamic methylation throughout B-cell differentiation. Characterization of all 106,562 dynamic CpGs detected by microarrays (left panel). On the right, the characterization of all dynamic CpGs separated into those losing or gaining methylation from HPC to bm-PCs. Each CpG site was classified into 8 different chromatin states. Numbers indicate the percentage of sites showing a particular feature and blue to red color scale represents log2 of enrichment values as compared to the background.
H1-embryonic stem cell Uncommitted hematopoietic progenitors Precursor B cells Naive B cells Germinal center B cells
Memory B cells Plasma cells from tonsils Plasma cells from bone marrow Lymphoblastoid B-cell line Lymphoblastoid B-cell line GM12878
log2FC<-1 0 >1
29.5% 12.1%
9.8% 15.5%
1.7% 1.9%
1.1% 1.0%
5.3% 1.8%
9.6% 6.8%
10.1% 17.8%
32.7% 42.9%
10.9%
17.8%
2.1%
1.2%
2.0%
7.3%
8.1%
50.3%
15.3%
9.0%
1.2%
0.5%
1.2%
5.3%
44.1%
22.8%
PromoterEnhancerInsulator
Transcrip. transitionTranscrip. elongation
Weak transcrip.Polycomb-repressed
Heterochromatin
BackgroundDynamic
CpGsDynamic CpGs
Hypomet. Hypermet.
Nature Genetics: doi:10.1038/ng.3291

BLUEPRINT / IHEC - Kulis et al., revised version submitted March 2015
14
Supplementary Fig. 16 Location of hypomethylated enhancers. All the CpGs in enhancer regions were classified into three categories according to their gene-related location: promoter, gene body and intergenic. This analysis shows that enhancers with dynamic methylation are significantly enriched in gene bodies (and to a lesser extent also in intergenic regions) as compared to those with stable methylation during B-cell differentiation.
Enhancers with dynamically methylated CpGs
Enhancers with stably methylated CpGs
Promoter regions Gene bodies Intergenic regions
60%
50%
40%
30%
20%
10%
0%
Perc
enta
ge o
f CpG
s in
enha
ncer
regi
ons
(from -1500 bp to TSS-1st exon) (1st intron-3’UTR)
Chi2 test, P < 2.10-16
Nature Genetics: doi:10.1038/ng.3291

BLUEPRINT / IHEC - Kulis et al., revised version submitted March 2015
15
Supplementary Fig. 17 Association of differentially methylated CpGs, detected by WGBS, with transcription factor binding sites (TFBSs). Heatmap representing significant (P < 0.01) enrichments for TFBSs in different DMRs detected by WGBS. Demethylated CpGs are particularly enriched in TFBSs of key B-cell transcription factors such as BCL11A, EBF1, IRF4, MEF2A, MEF2C, PAX5 or TCF3 (E2A). HPC: uncommitted hematopoietic progenitor. preB2C: pre-B-II cell. naiBC: naive B cell from peripheral blood. gcBC: germinal center B cell. bm-PC: plasma cell from bone marrow.
Hypomethylated Hypermethylated
1
14O
dds r
atio
preB
2C vs
. HPC
naiB
Cvs
. pre
B2C
gcBC
vs. n
aiBC
bm-P
C v
s. g
cBC
NFICFOSL1CEBPPSPI1RUNX3MTA3ATF2IRF4NFAT FOXM1STAT5POU2F2 BCLA11ATCF3PAX5ZEB1MEF2CBCL11A BATF MEF2A EBF1
preB
2C vs
. HPC
naiB
Cvs
. pre
B2C
gcBC
vs. n
aiBC
bm-P
C v
s. g
cBC
Nature Genetics: doi:10.1038/ng.3291

BLUEPRINT / IHEC - Kulis et al., revised version submitted March 2015
16
Supplementary Fig. 18 Analysis of PAX5, IRF4 and EBF1 expression and DNA methylation changes of their binding sites during B-cell differentiation. In the most upper panel, expression of three analyzed TFs in distinct B-cell differentiation stages is represented. Methylation patterns of CpGs associated with TF binding sites (TFBSs) is shown only for modules in which significant enrichment for these binding sites was observed. These TFs showed different patterns of both expression and TFBSs methylation throughout B-cell maturation. We observed that EBF1 and PAX5 binding sites remained unmethylated in PCs, although these TFs become downregulated in this cell type. In the case of IRF4, its binding sites in early B-cells became demethylated, however, it seems that later overexpression in PCs does not induce demethylation of additional sites. N: total number of CpGs belonging to each module; n: number of CpGs associated with PAX5, IRF4 or EBF1 binding sites. HPC: uncommitted hematopoietic progenitor. preB1C: pre-B-I cell. preB2C: pre-B-II cell. iBC: immature B cell. naiBCs: naive B cell from peripheral blood. t-naiBCs: naive B cell from tonsil. gcBC: germinal center B cell. t-PC: plasma cell from tonsil. memBC: memory B cell from peripheral blood. bm-PCs: plasma cell from bone marrow.
M1(N = 640)
M2(N = 2,617)
M4(N = 3,884)
M11(N = 531)
EBF1IRF4PAX5
1.0
0.8
0.6
0.4
0.2
0
DN
A m
ethy
latio
nD
NA
met
hyla
tion
DN
A m
ethy
latio
n
n = 223 CpG n = 145 CpG n = 303 CpG
n = 1,047 CpG n = 628 CpG n = 1,041 CpG
n = 409 CpG
n = 132 CpGn = 58 CpG
Prob
e11
7268
02_a
_at
HPC preB1C preB2C naiBC t-naiBC gcBC t-PC bm-PC
1.0
0.8
0.6
0.4
0.2
0
1-0
0.8
0.6
0.4
0.2
0
1.0
0.8
0.6
0.4
0.2
0
1.0
0.8
0.6
0.4
0.2
0
1.0
0.8
0.6
0.4
0.2
0
1.0
0.8
0.6
0.4
0.2
0
1.0
0.8
0.6
0.4
0.2
0
1.0
0.8
0.6
0.4
0.2
0
DN
A m
ethy
latio
n
GeneExpression
Prob
e11
7537
23_s
_at
Prob
e11
7175
08_a
t
456789
10111213
456789
1011121314
4
5
6
7
8
9
10
Nature Genetics: doi:10.1038/ng.3291

BLUEPRINT / IHEC - Kulis et al., revised version submitted March 2015
17
Supplementary Fig. 19 Main GO terms enriched in the 20 methylation modules detected by microarrays. Analysis of the child terms associated to the main GO term "Biological Process", which encompasses major cellular functions. This analysis shows that the methylation modules enriched for heterochromatin and polycomb-repressed regions were associated with terms not related to the immune system (e.g. development, locomotion or behavior) while the modules enriched for enhancer regions were the only ones associated with immune system-related functions (a). To further explore the immunological functions of particular modules, the child terms of the GO term "immune system process" were analyzed (b).
lymphocyte costimulation
antigen processing and presentation
immune system development
leukocyte activation
immune effector process
activation of immune response
immune system process
regulation of immune system process
positive regulation of immune system process
immune response
immune system processreproductionreproductive processcell killingmulti-organism processmetabolic processcellular processcellular component organization or biogenesisbiological phasehormone secretion
behaviorgrowthpositive regulation of biological processnegative regulation of biological process
biological regulationlocalizationsignalingresponse to stimulusbiological adhesionsingle-organism processlocomotionmulticellular organismal process
regulation of biological process
rhythmic process
developmental process
leukocyte homeostasis
production of molecular mediator of immune response
tolerance induction
T cell selection
myeloid cell homeostasis
negative regulation of immune system process
leukocyte migration
a b
11 1 4 10 7 2 6 5 12 3 13 15 8 9 14 16 17 18 19 20 Enhancer
Heterochrom.Polycomb
Module
log2FC-5.5 0 2.5
11 1 4 10 7 2 6 5 12 3 13 15 8 9 14 16 17 18 19 20 Enhancer
Heterochrom.Polycomb
Module
log2FC-5.5 0 2.5
log2 FC
-1 0 1 2
log2 FC
-2 -1 0 1 2
Nature Genetics: doi:10.1038/ng.3291

BLUEPRINT / IHEC - Kulis et al., revised version submitted March 2015
18
Supplementary Fig. 20 Analysis of the DNA methylation pattern of genes involved in B-cell receptor (BCR) signaling. 38 out of 41 genes (93%) involved in BCR signaling (identified by GO terms containing B-cell receptor signaling) had dynamic methylation during B-cell differentiation, as represented in the heatmap. The chromatin states associated with the displayed CpGs are shown in the upper part of the heatmap (48% of all CpGs are located in enhancers). Below the heatmap, we show the gene names associated with each of the different methylation patterns, which are enriched for particular modules. The reader can observe that CpGs associated with particular genes belong to distinct modules (e.g. CD19 or BLK), demonstrating that genes gradually change their methylation during the differentiation program and not in one particular differentiation step. HPC: hematopoietic progenitor cell. preB1C: pre-B-I cell. preB2C: pre-B-II cell. iBC: immature B cell. naiBCs: naive B cell from peripheral blood. t-naiBCs: naive B cell from tonsil. gcBC: germinal center B cell. t-PC: plasma cell from tonsil. bm-PCs: plasma cell from bone marrow. * Identified by GO terms containing "B cell receptor signaling". ** Predominant module associated with a particular DNA methylation pattern of genes from the BCR signaling pathway.
DNA
met
hyla
tion
1
0
HCP preB1C preB2C
iBC naiBC t-naiBC
gcBC t-PC bm-PC
B-cell receptor signaling (41 genes*)
234 CpGs with dynamic methylation in 38/41 genesB-
cell
diffe
rent
iatio
n
Module 1** Module 2** Module 4** Module 8** Module 9** Modules 19-20**
BLK
CD19
CD79
AG
CSAM LC
KM
EF2A
NCK
AP1L
PIK3
CD
BCAR
1BC
L2 BLK
BTK
CD79
AFC
RL5
KLH
L6 LCK
LPXN LY
NM
EF2A
MEF
2CM
ND
AN
FAM
1N
FATC
2PI
K3CD
PLEK
HA1
PRKC
BPR
KCH
PTPN
6PT
PRC
RFTN
1TE
CVA
V3
BCAR
1LY
NM
ND
AN
FAM
1PL
CG2
PRKC
HPT
PN6
RFTN
1
BCL2 BLK
CD19
CD30
0A LCK
LIM
E1M
EF2A
NFA
TC2
PLEK
HA1
PRKC
BPR
KCH
TEC
BLK
CD19
CD38
GCS
AM LCK
LIM
E1 LYN
MEF
2CN
CKAP
1LPI
K3CD
PRKC
BPT
PN6
RFTN
1SY
KTE
C
BAX
BCL2 BLK
CD19
CD30
0ACD
79A
CD79
BCT
LA4
FCRL
5G
CSAM
KLHL
6LA
T2 LCK
LIM
E1LP
XN LYN
MAP
K1M
EF2A
MEF
2CM
NDA
NCK
AP1L
NFA
TC2
PIK3
CDPL
CG2
PLEK
HA1
PRKC
BPR
KCH
PTPN
22PT
PN6
PTPR
CRF
TN1
SYK
TEC
VAV3
Cell subpopulations
EnhancerPromoter
PcG region
Insulator
Heterochromatin
Weak TranscriptionTranscription
Chromatin states
Nature Genetics: doi:10.1038/ng.3291

BLUEPRINT / IHEC - Kulis et al., revised version submitted March 2015
19
Supplementary Fig. 21 Association between dynamic methylated genes and a B-cell network. (a) Proportion of genes in different chromatin states and methylation modules overlapping with the B-cell network published by Lefebvre et al. (Ref. 29). Noteworthy, 44% of genes with active enhancers and 33% of genes with weak enhancers belonged to B-cell specific functional gene network and these percentages were significantly increased (P < 0.001) as compared to 18% and 21% for genes with dynamic methylation in heterochromatin and polycomb-repressed regions, respectively. (b) Network of genes with enhancers with dynamic methylation consisting of 1,993 genes connected via 11,741 interactions. The size of the nodes (= genes) corresponds to their degrees. The degrees in the network range from 1 to 449 and the gene names are only shown for nodes with a degree >= 50. The colors of the network represent the identified 9 functional communities, involved in functions modulated during B-cell development.
a
DNA methylation modules1 2 3 4 5 6 7 8 9 10 11 12 13 14 15 16 17 18 19 20
Perc
enta
gein
B-ce
llne
twor
k60
504030
2010
0
b
Network community 0Network community 1Network community 2Network community 3Network community 4Network community 5Network community 6Network community 7Network community 8
Nature Genetics: doi:10.1038/ng.3291

BLUEPRINT / IHEC - Kulis et al., revised version submitted March 2015
20
Supplementary Fig. 22 Differences in DNA methylomes and transcriptomes of naive B cells and plasma cells isolated from distinct anatomical locations. (a-b) Unsupervised principal component analyses (PCA) of microarray-based gene expression data (a) and microarray-based DNA methylation data (b) of all samples used in our study. t-naiBCs isolated from tonsils have clearly different transcriptomes as compared to naiBCs isolated from peripheral blood (marked with green arrow), while their methylomes are similar (marked with green circle). On the contrary, PCs isolated both from bone marrow and peripheral blood show a comparable gene expression pattern (marked with violet circle) but they widely differ in their DNA methylation profile (marked with violet arrow). naiBCs: naive B cell from peripheral blood. t-naiBCs: naive B cell from tonsil. gcBC: germinal center B cell. t-PC: plasma cell from tonsil. memBC: memory B cell from peripheral blood. bm-PCs: plasma cell from bone marrow.
Principal component 1 (78.7%)
Prin
cipa
l com
pone
nt2
(8.1
%)
Principal component 1 (42.2%)
Prin
cipa
l com
pone
nt2
(21.
8%)
a bGene expression DNA methylation
naiBCst-naiBCs
bm-PCst-PCs
naiBC t-naiBC gcBC t-PC memBC bm-PC
bm-PCs
t-PCsnaiBCs
t-naiBCs
Nature Genetics: doi:10.1038/ng.3291

BLUEPRINT / IHEC - Kulis et al., revised version submitted March 2015
21
Supplementary Fig. 23 Uncoupling of gene expression and DNA methylation in naive B cells isolated from tonsil and peripheral blood. (a) Heatmap representation of differentially expressed genes in t-naiBC vs naiBC (left panel), as well as methylation status of all the CpGs associated with these genes (right panels). CpGs were divided according to their location in the promoters, enhancer or other regions of the gene. (b) Numbers of differentially methylated CpGs in t-naiBC vs naiBC (at least 10% difference, FDR < 0.1), associated either with genes without changes in gene expression (left column), upregulated (center) or downregulated (right) in t-naiBC respect to naiBC. By means of this analysis, only a minor fraction of genes with differential methylation could be detected, which was similar to the changes observed in genes without any expression change. It should be noted that using our standard criteria (methylation difference at least 25%, FDR < 0.01) we did not identify any change between these two subpopulations. Therefore, the extensive transcriptional modification in t-naiBCs vs. naiBCs does not seem to be associated with any significant DNA methylation change. naiBC: naive B cell from peripheral blood. t-naiBC: naive B cell from tonsil.
2,48
5 gen
es
upre
gula
ted
1,67
1 ge
nes
dow
nreg
ulat
ed
promoters enhancers others
Methylation pattern of CpGsassociated to differentially expressed genes
2-2
10
4,156 differentially expressed genes between t-naiBC and naiBC
Gene expression
DNA methylation
a
b t-naiBC vs naiBC
naiBC t-naiBC
Genes without differential expression
Region Promoter Enhancer Others Promoter Enhancer Others Promoter Enhancer OthersTotal CpGs 83,635 25,142 157,774 29,140 6,461 16,487 20,326 5,160 16,558
Hypermethylated CpGs 368 266 876 115 73 71 83 63 60(% of total) (0.4%) (1.1%) (0.6%) (0.4%) (1.1%) (0.4%) (0.4%) (1.2%) (0.4%)
number of related genes 407 277 735 127 79 65 97 61 59(% of total) (3.1%) (2.1%) (5.6%) (5.1%) (3.2%) (2.6%) (5.8%) (3.7%) (3.5%)
Hypomethylated CpGs 77 129 588 26 19 41 22 21 33(% of total) (0.1%) (0.5%) (0.4%) (0.1%) (0.3%) (0.2%) (0.1%) (0.4%) (0.2%)
number of related genes 72 128 725 27 18 65 21 19 28(% of total) (0.5%) (1.0%) (5.5%) (1.1%) (0.7%) (2.6%) (1.3%) (1.1%) (1.7%)
n=13,108Upregulated genes
n=2,485Downregulated genes
n=1,671
Z-score
Nature Genetics: doi:10.1038/ng.3291

BLUEPRINT / IHEC - Kulis et al., revised version submitted March 2015
22
Supplementary Fig. 24 Association between DNA methylation levels and H3K27me3. Chromatin from purified memBCs was immunoprecipated with an antibody against H3K27me3, followed by bisulfite treatment and sequencing (ChIP-BS). As a comparison, the whole-genome bisulfite sequencing (WGBS) data of memBCs was used. Next, all polycomb-repressed regions as defined in the lymphoblastoid cell line GM12878 were selected and within these regions, the H3K27me3 nucleosome positioning was estimated by NucHunter using the ChIP-BS data. Average DNA methylation levels in CpG-rich and CpG-poor regions in relation to the distance of the H3K27me3 containing nucleosome (within a window of 500 bp up- and downstream) were calculated for both the ChIP-BS and WGBS data. The overall levels of DNA methylation of the H3K27me3-immunoprecipitated fraction were slightly higher than those in the non-immunoprecipitated DNA and DNA methylation levels within nucleosomes containing H3K27me3 were lower than regions outside such nucleosomes, both in CpG-rich and CpG-poor areas. This finding suggests that the regions positioned exactly at the H3K27me3-containing nucleosomes could be slightly protected from DNA methylation in comparison with the surrounding nucleosome-free areas.
Nature Genetics: doi:10.1038/ng.3291

BLUEPRINT / IHEC - Kulis et al., revised version submitted March 2015
23
Supplementary Fig. 25 DNA methylation changes during B-cell differentiation in the context of cancer and aging. (a) Heatmap of subset of CpGs from M8 module that lose methylation in heterochromatin regions. (b) Heatmap of subset of CpGs from M19 module that gain methylation in polycomb-repressed regions. (c) Scatter plots representing mean methylation levels of CpGs in heterochromatin from M8 in different B-cell subsets and four types of hematological neoplasms. (d) Scatter plots representing mean methylation levels of CpGs in polycomb-repressed regions from M19 in different B-cell subsets and four types of hematological neoplasms. (e) Mean methylation levels of CpGs in heterochromatin from M8 in whole blood samples from donors of different age. (f) Mean methylation levels of CpGs in polycomb-repressed regions from M19 in whole blood samples from donors of different age. HPC: uncommitted hematopoietic progenitor. preB1C: pre-B-I cell. preB2C: pre-B-II cell. iBC: immature B cell. naiBCs: naive B cell from peripheral blood. t-naiBCs: naive B cell from tonsil. gcBC: germinal center B cell. t-PC: plasma cell from tonsil. memBC: memory B cell from peripheral blood. bm-PC: plasma cell from bone marrow. ALL: acute lymphoblastic leukemia. CLL: chronic lymphocytic leukemia. DLBCL: diffuse large B-cell lymphoma. MM: multiple myeloma.
M8; n=21,240 M19; n=3,040CpGs losing methylation in heterochromatin regions CpGs gaining methylation in polycomb-repressed regions
DNA
met
hyla
tion
a b
c d
e f
Age (in years) Age (in years)
Mod
ule
8M
ean
DN
A m
ethy
latio
n le
vel
0.9
0.8
0.7
0.6
0.3
0.2
0.1
0
Mod
ule1
9M
ean
DN
A m
ethy
latio
n le
vel
Pearson r = 0.30 P = 7x10-16
Pearson r = -0.16 P = 3x10⁻⁵
0 10 20 30 40 50 60 70 80 90 100 110 0 10 20 30 40 50 60 70 80 90 100 110
1
0.8
0.6
0.4
0.2
0
1
0.8
0.6
0.4
0.2
0
1
0
Mea
n D
NA
met
hyla
tion
leve
l
Mea
n D
NA
met
hyla
tion
leve
l
Module 8 Module19
HPC preB1C preB2C iBC naiBC t-naiBC gcBC t-PC memBC bm-PC
HPC
preB
1C
preB
2C iBC
naiB
C
t-na
iBC
gcBC
t-PC
mem
BC
bm-P
C
ALL
CLL
DLB
CL
MM
HPC
preB
1C
preB
2C iBC
naiB
C
t-na
iBC
gcBC
t-PC
mem
BC
bm-P
C
ALL
CLL
DLB
CL
MM
Nature Genetics: doi:10.1038/ng.3291

BLUEPRINT / IHEC - Kulis et al., revised version submitted March 2015
24
Supplementary Fig. 26 Comparison of DNA methylation levels in B-cell subpopulations with short and long lifespan (naiBCs and memBCs, respectively), isolated from individuals of different age (ranging from 28 to 66 years). (a-b) Boxplot showing methylation levels of CpGs in heterochromatic regions from module M8 (a) or M9 (b). (c-d) Boxplot representation of methylation levels of CpGs in polycomb-repressed regions from module M19 (c) or M20 (d). naiBCs: naive B cell from peripheral blood. memBC: memory B cell from peripheral blood
Donor A B C D E A B C D EAge 28 32 61 63 66 28 32 61 63 66
Donor A B C D E A B C D EAge 28 32 61 63 66 28 32 61 63 66
Donor A B C D E A B C D EAge 28 32 61 63 66 28 32 61 63 66
Donor A B C D E A B C D EAge 28 32 61 63 66 28 32 61 63 66
Module 8 Module 9
Module 19 Module 20
naiBC memBC
a b
c d
DNA
met
hyla
tion
leve
lsDN
A m
ethy
latio
nle
vels
DNA
met
hyla
tion
leve
lsDN
A m
ethy
latio
nle
vels
1
0.8
0.6
0.4
0.2
0
1
0.8
0.6
0.4
0.2
0.8
0.6
0.4
0.2
0
0.8
0.6
0.4
0.2
0
Nature Genetics: doi:10.1038/ng.3291

BLUEPRINT / IHEC - Kulis et al., revised version submitted March 2015
25
Supplementary Tables
Supplementary Table 1. Normal B-cell samples used in the present study (I).
Sample ID Cell subtype Sample Name Source Age Sex Selection markers 450k WGBS GE array U219 GE array 1.0 ST Bis. Pyroseq Reference Comments1 HPC HPC_1 fetal bone marrow 22 weeks NA CD34hi/CD19- Yes Yes Lee et al (17 )2 HPC HPC_2 fetal bone marrow 22 weeks NA CD34hi/CD19- Yes Yes Lee et al (17 )3 HPC HPC_3 fetal bone marrow 22 weeks NA CD34hi/CD19- Yes Yes Lee et al (17 )4 HPC HPC_4 fetal bone marrow 22 weeks NA CD34hi/CD19- Yes Yes Lee et al (17 )5 HPC HPC_5 fetal bone marrow 22 weeks NA CD34hi/CD19- Yes Yes Lee et al (17 )6 HPC HPC_6 fetal bone marrow 22 weeks NA CD34hi/CD19- Yes Yes Lee et al (17 )7 HPC HPC_7 fetal bone marrow 22 weeks NA CD34hi/CD19- Yes Lee et al (17 )8 HPC HPC_8 fetal bone marrow 22 weeks NA CD34hi/CD19- Yes Yes9 HPC HPC_9 fetal bone marrow 22 weeks NA CD34hi/CD19- Yes
10 HPC HPC_10 fetal bone marrow 22 weeks NA CD34hi/CD19- Yes11 HPC HPC_11 fetal bone marrow 22 weeks NA CD34hi/CD19- Yes Yes12 preB1C preB1C_12 fetal bone marrow 22 weeks NA CD34+/CD19+ Yes Yes Lee et al (17 )13 preB1C preB1C_13 fetal bone marrow 22 weeks NA CD34+/CD19+ Yes Yes Lee et al (17 )14 preB1C preB1C_14 fetal bone marrow 22 weeks NA CD34+/CD19+ Yes Yes Lee et al (17 )15 preB1C preB1C_15 fetal bone marrow 22 weeks NA CD34+/CD19+ Yes Yes Lee et al (17 )16 preB1C preB1C_16 fetal bone marrow 22 weeks NA CD34+/CD19+ Yes Yes Lee et al (17 )17 preB1C preB1C_17 fetal bone marrow 22 weeks NA CD34+/CD19+ Yes Yes Lee et al (17 )18 preB1C preB1C_18 fetal bone marrow 22 weeks NA CD34+/CD19+ Yes19 preB1C preB1C_19 fetal bone marrow 22 weeks NA CD34+/CD19+ Yes Yes20 preB1C preB1C_20 fetal bone marrow 22 weeks NA CD34+/CD19+ Yes Yes21 preB2C preB2C_21 fetal bone marrow 22 weeks NA CD34-/CD19+/sIgM- Yes Yes Lee et al (17 )22 preB2C preB2C_22 fetal bone marrow 22 weeks NA CD34-/CD19+/sIgM- Yes Yes Lee et al (17 )23 preB2C preB2C_23 fetal bone marrow 22 weeks NA CD34-/CD19+/sIgM- Yes Yes Lee et al (17 )24 preB2C preB2C_24 fetal bone marrow 22 weeks NA CD34-/CD19+/sIgM- Yes Yes Lee et al (17 )25 preB2C preB2C_25 fetal bone marrow 22 weeks NA CD34-/CD19+/sIgM- Yes Yes Lee et al (17 )26 preB2C preB2C_26 fetal bone marrow 22 weeks NA CD34-/CD19+/sIgM- Yes Yes Lee et al (17 )27 preB2C preB2C_27 fetal bone marrow 22 weeks NA CD34-/CD19+/sIgM- Yes Lee et al (17 )28 preB2C preB2C_28 fetal bone marrow 22 weeks NA CD34-/CD19+/sIgM- Yes29 preB2C preB2C_29 fetal bone marrow 22 weeks NA CD34-/CD19+/sIgM- Yes Yes30 preB2C preB2C_30 fetal bone marrow 22 weeks NA CD34-/CD19+/sIgM- Yes Yes31 preB2C preB2C_31 fetal bone marrow 22 weeks NA CD34-/CD19+/sIgM- Yes Yes32 iBC iBC_32 fetal bone marrow 22 weeks NA CD34-/CD19+/sIgM+ Yes Yes Lee et al (17 )33 iBC iBC_33 fetal bone marrow 22 weeks NA CD34-/CD19+/sIgM+ Yes Yes Lee et al (17 )34 iBC iBC_34 fetal bone marrow 22 weeks NA CD34-/CD19+/sIgM+ Yes Yes Lee et al (17 )35 iBC iBC_35 fetal bone marrow 22 weeks NA CD34-/CD19+/sIgM+ Yes Lee et al (17 )36 iBC iBC_36 fetal bone marrow 22 weeks NA CD34-/CD19+/sIgM+ Yes37 iBC iBC_37 fetal bone marrow 22 weeks NA CD34-/CD19+/sIgM+ Yes
Nature Genetics: doi:10.1038/ng.3291

BLUEPRINT / IHEC - Kulis et al., revised version submitted March 2015
26
Supplementary Table 1. Normal B-cell samples used in the present study (II).
Sample ID Cell subtype Sample Name Source Age Sex Selection markers 450k WGBS GE array U219 GE array 1.0 ST Bis. Pyroseq Reference Comments38 naiBC naiBC_38 peripheral blood 63 M CD19+/CD27-/IgD+ Yes Yes Kulis et al (10 )39 naiBC naiBC_39 peripheral blood 65 F CD19+/CD27-/IgD+ Yes Kulis et al (10 )40 naiBC naiBC_40 peripheral blood 61 F CD19+/CD27-/IgD+ Yes Kulis et al (10 )41 naiBC naiBC_41 peripheral blood 32 M CD19+/CD27-/IgD+ Yes Yes42 naiBC naiBC_42 peripheral blood 28 F CD19+/CD27-/IgD+ Yes43 naiBC naiBC_43 peripheral blood 56 M CD19+/CD27-/IgD+ Yes44 naiBC naiBC_44 peripheral blood 57 M CD19+/CD27-/IgD+ yes45 naiBC naiBC_45 peripheral blood 56 F CD19+/CD27-/IgD+ yes46 naiBC naiBC_46 peripheral blood 61 M CD19+/CD27-/IgD+ yes47 naiBC naiBC_47 peripheral blood 57 M CD19+/CD27-/IgD+ yes48 naiBC naiBC_48 peripheral blood 61 F CD19+/CD27-/IgD+ Yes49 naiBC naiBC_49 peripheral blood 50 M CD19+/CD27-/IgD+ Yes50 naiBC naiBC_50 peripheral blood 45 F CD19+/CD27-/IgD+ Yes51 t-naiBC t-naiBC_51 tonsil 5 M CD20+/CD38lo/CD23+ Yes52 t-naiBC t-naiBC_52 tonsil 4 F CD19+/CD27-/IgD+ Yes53 t-naiBC t-naiBC_53 tonsil 4 F CD20+/CD38lo/CD23+ Yes54 t-naiBC t-naiBC_54 tonsil 4 M CD20+/CD38lo/CD23+ Yes55 t-naiBC t-naiBC_55 tonsil 9 F CD20+/CD38lo/CD23+ Yes56 t-naiBC t-naiBC_56 tonsil 2-6 F IgD+/CD38low/CD27- Yes Yes57 t-naiBC t-naiBC_57 tonsil 2-6 F IgD+/CD38low/CD27- Yes Yes58 t-naiBC t-naiBC_58 tonsil 3 M CD20+/CD38lo/CD23+ Yes59 t-naiBC t-naiBC_59 tonsil 3 F CD20+/CD38lo/CD23+ Yes60 memBC memBC_60 peripheral blood 63 M CD19+/CD27+/IgA+ or IgG+ Yes Yes Kulis et al (10 )61 memBC memBC_61 peripheral blood 65 F CD19+/CD27+/IgA+ or IgG+ Yes Kulis et al (10 )62 memBC memBC_62 peripheral blood 61 F CD19+/CD27+/IgA+ or IgG+ Yes Kulis et al (10 )63 memBC memBC_63 peripheral blood 32 M CD19+/CD27+/IgA+ or IgG+ Yes Yes64 memBC memBC_64 peripheral blood 28 F CD19+/CD27+/IgA+ or IgG+ Yes65 memBC memBC_65 peripheral blood 57 M CD19+/CD27+/IgA+ or IgG+ yes66 memBC memBC_66 peripheral blood 56 F CD19+/CD27+/IgA+ or IgG+ yes67 memBC memBC_67 peripheral blood 61 M CD19+/CD27+/IgA+ or IgG+ yes68 memBC memBC_68 peripheral blood 57 M CD19+/CD27+/IgA+ or IgG+ yes69 memBC memBC_69 peripheral blood 61 F CD19+/CD27+/IgA+ or IgG+ Yes70 memBC memBC_70 peripheral blood 50 M CD19+/CD27+/IgA+ or IgG+ Yes71 memBC memBC_71 peripheral blood 45 F CD19+/CD27+/IgA+ or IgG+ Yes
Nature Genetics: doi:10.1038/ng.3291

BLUEPRINT / IHEC - Kulis et al., revised version submitted March 2015
27
Supplementary Table 1. Normal B-cell samples used in the present study (III). Sample ID Cell subtype Sample Name Source Age Sex Selection markers 450k WGBS GE array U219 GE array 1.0 ST Bis. Pyroseq Reference Comments
72 gcBC gcBC_72 tonsil 3 M CD20hi/CD38mid Yes73 gcBC gcBC_73 tonsil 5 M CD20hi/CD38mid Yes74 gcBC gcBC_74 tonsil 5 F CD20hi/CD38mid Yes75 gcBC gcBC_75 tonsil 5 F CD20hi/CD38mid Yes76 gcBC gcBC_76 tonsil 6 F CD20hi/CD38mid Yes77 gcBC gcBC_77 tonsil 4 F CD20hi/CD38mid Yes78 gcBC gcBC_78 tonsil 2 M CD20hi/CD38mid Yes Yes79 gcBC gcBC_79 tonsil 4 F CD20hi/CD38mid Yes Yes Yes80 gcBC gcBC_80 tonsil 4 M CD20hi/CD38mid Yes81 gcBC gcBC_81 tonsil 4 M CD20hi/CD38mid yes82 gcBC gcBC_82 tonsil 4 M CD20hi/CD38mid yes83 gcBC gcBC_83 tonsil 4 M CD20hi/CD38mid yes84 gcBC gcBC_84 tonsil 5 M CD20hi/CD38mid yes85 gcBC gcBC_85 tonsil 3 F CD20hi/CD38mid yes Yes86 gcBC gcBC_86 tonsil 5 F CD20hi/CD38mid Yes87 gcBC gcBC_87 tonsil 5 F CD20hi/CD38mid Yes88 gcBC gcBC_88 tonsil 2-6 F IgD-/CD38hi/CD10+/CXCR4+ Yes Yes89 gcBC gcBC_89 tonsil 2-6 F IgD-/CD38hi/CD10+/CXCR4+ Yes Yes90 t-PC t-PC_90 tonsil 5 M CD20lo/CD38hi Yes91 t-PC t-PC_91 tonsil 5 F CD20lo/CD38hi Yes92 t-PC t-PC_92 tonsil 5 F CD20lo/CD38hi Yes93 t-PC t-PC_93 tonsil 6 F CD20lo/CD38hi Yes94 t-PC t-PC_94 tonsil 4 F CD20lo/CD38hi Yes95 t-PC t-PC_95 tonsil 2 M CD20lo/CD38hi Yes96 t-PC t-PC_96 tonsil 4 F CD20lo/CD38hi Yes97 t-PC t-PC_97 tonsil 13 M CD20lo/CD38hi Yes98 t-PC t-PC_98 tonsil 4 M CD20lo/CD38hi Yes99 t-PC t-PC_99 tonsil 4 M CD20lo/CD38hi yes
100 t-PC t-PC_100 tonsil 4 M CD20lo/CD38hi yes101 t-PC t-PC_101 tonsil 4 M CD20lo/CD38hi yes102 t-PC t-PC_102 tonsil 3 F CD20lo/CD38hi Yes103 t-PC t-PC_103 tonsil 5 F CD20lo/CD38hi Yes104 t-PC t-PC_104 tonsil 5 F CD20lo/CD38hi Yes105 bm-PC bm-PC_105 bone marrow 20-30 NA CD138+ Yes pooled from 4 different donors106 bm-PC bm-PC_106 bone marrow 20-30 NA CD138+ Yes pooled from 4 different donors107 bm-PC bm-PC_107 bone marrow 20-30 NA CD138+ Yes pooled from 4 different donors108 bm-PC bm-PC_108 bone marrow 20-30 NA CD138+ Yes pooled from 4 different donors109 bm-PC bm-PC_109 bone marrow 20-30 NA CD138+ Yes pooled from 4 different donors110 bm-PC bm-PC_110 bone marrow 20-30 NA CD138+ Yes pooled from 4 different donors111 bm-PC bm-PC_111 bone marrow 20-30 NA CD138+ Yes pooled from 4 different donors
Nature Genetics: doi:10.1038/ng.3291

BLUEPRINT / IHEC - Kulis et al., revised version submitted March 2015
28
Supplementary Table 2. Sequencing amounts in each of the 12 samples analyzed by WGBS.
Sample name Yield passing filter (Gb) Mapping (%) Unique mapping (%) Mean coverageHPC-R1 178.3 94.0 79.7 53.4HPC-R2 194.4 95.5 81.6 56.8preB2C-R1 180.0 94.2 80.3 54.1preB2C-R2 208.6 95.3 81.6 59.3naiBC-R1* 147.2 89.2 76.9 41.9naiBC-R2 190.6 94.8 82.0 55.6gcBC-R1 177.8 92.2 77.5 52.2gcBC-R2 198.4 84.7 81.5 56.9memBC-R1* 152.4 88.9 77.4 43.2memBC-R2 203.6 95.0 82.5 59.0bm-PC-R1 183.5 95.0 82.1 55.5bm-PC-R2 202.5 94.3 81.9 59.5Total 2217.3Mean 184.8 92.8 80.4 54.0* These two samples were previously published by Kulis et al. (Ref. 10)
Nature Genetics: doi:10.1038/ng.3291

BLUEPRINT / IHEC - Kulis et al., revised version submitted March 2015
29
Supplementary Table 3. Primers used for validation experiments using bisulfite pyrosequencing and quantitative PCR.
Gene Name Primer Sequence Comments
BLNK Forward GGAATTGTATTGTTGTGAAATTGTTAG
(cg02980499, Reversed (biotinylated) TCAAATATACAACCTCCTTATTACC
cg20540372) Sequencing ATTTTGGTTTGTTTGAAAGTA
HOXA1 Forward AGATTTAAGTGAAGATTTGGTTTTAGAA
(cg07659054 ) Reversed (biotinylated) AAATCCCAACCCAAAAAAATACC
Sequencing GTGAAGATTTGGTTTTAGAAT
KLF6 Forward GGTTTTTTTTAGGGTTGGTGTAATG
(cg06048750 ) Reversed (biotinylated) ACACCAAAAACTCCCACTTAAA
Sequencing GTGGGTATTGATTTG
LYN Forward (biotinylated) TTTTTTTTTGGTAAGGTATAATGGTTTA
(cg21441674) Reversed ACCCAAAATAAAATACAATAATACCATCA
Sequencing CCTAAACTCAAATAATCCTC
CAC.1 Forward TGTTTAGGTGTTATTATTGGGATGAA
Reversed (biotinylated) ACAATCTTAATAAAAAATAAACCCAACATC
Sequencing ATTGGGATGAATGAGTTT
CAC.2 Forward GAAAAAAATTTGGAGTATATGGGGAAAGT
Reversed (biotinylated) AAAACCAAAAAATCTACCTACATCTT
Sequencing GGAGAGATTTTAGGGTTG
CAC.3 Forward TTGGTTTATTTATTTTTTGAGTATGTGAAA
Reversed (biotinylated) ATCTATAACAACCCCAATATCCTC
Sequencing TTGAGTTGGAGAGTTTATGG
CAC.4 Forward (biotinylated) GGATTGAGATTTTATATTATTTGGGTTGAA
Reversed ACCTCCTTAAACACACACAA
Sequencing CTAAAACACAATCCTCA
CAC.1_CpG_5' Forward ATAGATAGGGGTTAGGTAGTTTAGAT
Reversed (biotinylated) ACTTTCCTCTCCCCATCTTACAACA
Sequencing AGATGGTTTTGGAAGTAG
CAC.1_CpG_3' Forward GTTTAGGTGTTATTATTGGGATGAATG
Reversed (biotinylated) ATACCCTACCCCTACCTAACTTTCCTC
Sequencing GTTTTTGGTTGTTGTAAGAT
CAC.2_CpG_5' Forward TGAGATTTTTTTAGGGTGGAATTTGT
Reversed (biotinylated) ACACCCTCCCACTAACTTT
Sequencing AATTTGTGTTTTTAGTTATGTAG
CAC.2_CpG_3' Forward (biotinylated) TTGGTTGTGTTTATATTTAGGGGTATGG
Reversed CATTTAACACACCCTCCCACTAAC
Sequencing CTCAAAATATAAACAAATCCCTT
DNMT1DNMT3ADNMT3BEEF2 Forward TGGAGATCTGCCTGAAGGAC
Reversed GACTTGGAGAGGCAGAGCAC
quantitative PCR for DNMTs expression
primers taken from Fang et al. [Ref. 71]
Validation by pyrosequencing
nonCpG methylation measurements by pyrosequencing
Methylation of CpGs that flank nonCpGs
this assay permits to measure also both
flanking CpGs
this assay permits to measure also both
flanking CpGs
Nature Genetics: doi:10.1038/ng.3291