Supplementary Figure S1. PTPN2 levels are not altered in … · Supplementary Figure S1. PTPN2...
12
1 Supplementary Figure S1. PTPN2 levels are not altered in proliferating CD8+ T cells. Lymph node (LN) CD8+ T cells from C57BL/6 mice were stained with CFSE and stimulated with plate-bound α-CD3ε (10μg/ml) and α-CD28 (5μg/ml). CD8 + T cells were sorted as indicated on days 1-4 according to their CFSE profiles and cell lysates resolved by SDS-PAGE and immunoblotted with antibodies to PTPN2 and tubulin. Results are shown representative of two independent experiments.
Transcript of Supplementary Figure S1. PTPN2 levels are not altered in … · Supplementary Figure S1. PTPN2...

1
Supplementary Figure S1. PTPN2 levels are not altered in proliferating CD8+ T
cells. Lymph node (LN) CD8+ T cells from C57BL/6 mice were stained with CFSE
and stimulated with plate-bound α-CD3ε (10µg/ml) and α-CD28 (5µg/ml). CD8+ T
cells were sorted as indicated on days 1-4 according to their CFSE profiles and cell
lysates resolved by SDS-PAGE and immunoblotted with antibodies to PTPN2 and
tubulin. Results are shown representative of two independent experiments.
2
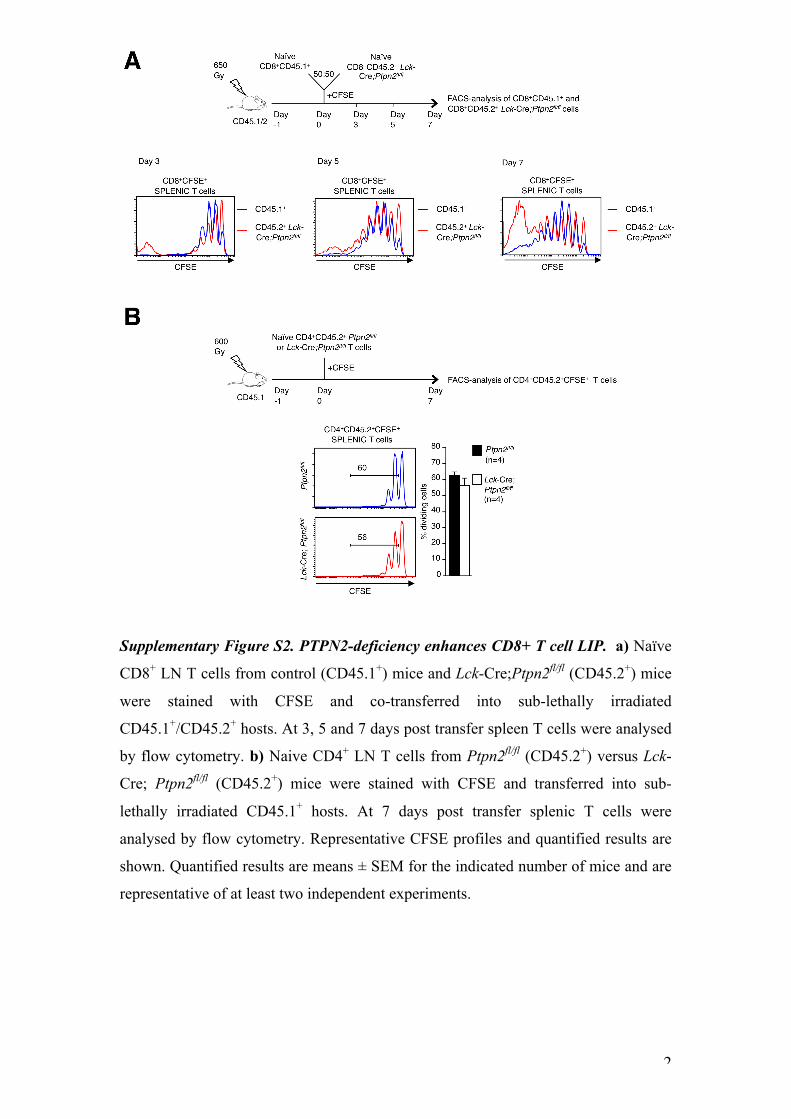
Supplementary Figure S2. PTPN2-deficiency enhances CD8+ T cell LIP. a) Naïve
CD8+ LN T cells from control (CD45.1+) mice and Lck-Cre;Ptpn2fl/fl (CD45.2+) mice
were stained with CFSE and co-transferred into sub-lethally irradiated
CD45.1+/CD45.2+ hosts. At 3, 5 and 7 days post transfer spleen T cells were analysed
by flow cytometry. b) Naive CD4+ LN T cells from Ptpn2fl/fl (CD45.2+) versus Lck-
Cre; Ptpn2fl/fl (CD45.2+) mice were stained with CFSE and transferred into sub-
lethally irradiated CD45.1+ hosts. At 7 days post transfer splenic T cells were
analysed by flow cytometry. Representative CFSE profiles and quantified results are
shown. Quantified results are means ± SEM for the indicated number of mice and are
representative of at least two independent experiments.

3
(Refer to figure legend on the next page)

4
Supplementary Figure S3. PTPN2-deficiency promotes naive CD8+ T cell LIP and
the generation of ‘antigen-experienced’ memory T cells. a) Naive CD8+ LN T cells
from Ptpn2fl/fl (CD45.2+) versus Lck-Cre; Ptpn2fl/fl (CD45.2+) mice were stained with
CFSE and transferred into sub-lethally irradiated CD45.1+ hosts. At 8 days post
transfer splenic T cells were analysed by flow cytometry. Representative CFSE
profiles and CD44 versus CD49d, KLRG-1 or CD62L plots (numbers in outlined
areas are the relative numbers in the gate) are shown. b) Splenocytes from 6 week old
Ptpn2fl/fl and Lck-Cre; Ptpn2fl/fl mice were analysed by flow cytometry. Representative
CD44 versus CD49d contour plots are shown. ‘True Memory’ (TM) CD8+ T cells
were classified as CD44hiCD49dhiIL7RαloKLRG1hi or CD44hiCD49dhiCD62Llo and
‘Homeostatic Memory’ (HM) CD8+ T cells were classified as
CD44hiCD49dloCD62Lhi, CD44hiCD49dloCD122Lhi or CD44hiCD49dloLy6C+.
Quantified results in a-b are means ± SEM for the indicated number of mice and are
representative of three independent experiments. Significance was determined using
2-tailed Mann-Whitney U test; *P<0.05, **P<0.01.

5
(Refer to figure legend on the next page)

6
Supplementary Figure S4. Cytokine signalling in PTPN2-deficient T cells. a) Naïve
CD8+ and CD4+ LN T cells from Ptpn2fl/fl and Lck-Cre;Ptpn2fl/fl mice were stimulated
with 0.01ng/ml IL-7 for the indicated times. b) CD4+ central-memory
(CD8+CD62LhiCD44hi; CM) LN T cells from Ptpn2fl/fl and Lck-Cre;Ptpn2fl/fl mice
were stimulated with IL-7 or IL-15 for 15 min. In a-b cells were stained for pSTAT5
and MFI determined by flow cytometry. Quantified results are means ± SEM for the
indicated number of mice and are representative of at least two independent
experiments. Significance was determined using 2-tailed Mann-Whitney U test;
*P<0.05. c) Naïve CD8+ and CD4+ LN T cells from Ptpn2fl/fl and Lck-Cre;Ptpn2fl/fl
mice were analysed by flow cytometry. Representative histogram overlays of un-
stained controls (background staining) and those stained for the indicated cytokine
receptor chains are shown. Results shown are representative of two independent
experiments.

7
Supplementary Figure S5. STAT5 levels are not reduced in Lck-Cre;Ptpn2fl/+
heterozygous T cells. Cell lysates from naive CD4+ and CD8+ lymph node (LN) T
cells from four Ptpn2fl/+ and four Lck-Cre;Ptpn2fl/+ mice were resolved by SDS-
PAGE and immunoblotted with antibodies to STAT5, PTPN2 and tubulin. STAT5
levels were quantified by densitometric analysis and normalised for tubulin; each lane
corresponds to T cells from a different mouse. Quantified results are means ± SEM
for the indicated number of mice and are representative of at least two independent
experiments; arbitrary units (a.u.) are shown.

8
Supplementary Figure S6. PTPN2 deficiency skews the TCR repertoire in CD8+ T
cells that have undergone LIP. Naive CD8+ LN T cells isolated from wild type
(WT; CD45.1+) mice and Lck-Cre;Ptpn2fl/fl (CD45.2+) mice were pooled and
transferred into sub-lethally irradiated CD45.1+/CD45.2+ hosts. At 8 days post
transfer, splenic and LN CD8+ T cells were stained for the indicated TCRVβ-chains
and NK1.1 and analysed by flow cytometry. a) Representative FACS profiles of
CD8+ T cells stained for NK1.1 and TCRVβ8.1/8.2 are shown. b) TCRVβ-chain
frequencies in spleen and lymph nodes after transfer are shown. In b quantified results
are means ± SEM for the indicated number of mice and are representative of at least
three independent experiments. Significance was determined using 2-tailed Mann-
Whitney U test; *P<0.05, **P<0.01, *** p<0.001.

9
Supplementary Figure S7. PTPN2 deficiency increases the proportion of T cells
undergoing fast-paced LIP. Naïve CD8+ LN T cells from control (CD45.1+) mice
and Lck-Cre;Ptpn2fl/fl (CD45.2+) mice were stained with CFSE and co-transferred into
sub-lethally irradiated CD45.1+/CD45.2+ hosts. At 8 days post-transfer spleen and
liver T cells were analysed by flow cytometry. Quantified results are means ± SEM
for the indicated number of mice and are representative of two independent
experiments. Both fast and slow proliferating and total relative T cell numbers were
determined.

10
Supplementary Figure S8. PTPN2 deficiency exacerbates CD8+ T cell responses to
self- and gut-antigens in irradiated mice. a) Genomic DNA from faeces of antibiotic
treated CD45.1+ mice was extracted using the DNA stool isolation kit. Bacterial DNA
was amplified by PCR using a specific primer pair for bacterial 16sDNA resolved on
an agarose gel and visualised by ethidium bromide staining. Primers for epithelial gut
DNA were used as positive loading control. b) Naive CD8+ lymph node (LN) T cells
from Ptpn2fl/fl (CD45.2+) versus Lck-Cre;Ptpn2fl/fl (CD45.2+) were stained with CFSE
and transferred into antibiotic treated, sub-lethally irradiated CD45.1+ hosts. At 8 days
post transfer splenic and liver T cells were analysed by flow cytometry. Quantified
results are means ± SEM for the indicated number of mice and are representative of at
least three independent experiments; significance was determined using one-way
ANOVA with bonferroni correction; *P<0.05, **P<0.01, *** p<0.001.

11
Supplementary Figure S9. Lck-Cre;Ptpn2fl/+ CD8+ T cells promote signs of
autoimmunity in irradiated mice. Naive CD8+ and CD4+ LN T cells isolated from
Ptpn2fl/+ (CD45.2+) and Lck-Cre;Ptpn2fl/+ (CD45.2+) mice were co-transferred into
sub-lethally irradiated CD45.1+ hosts. At 12 weeks post transfer blood lymphocytes
were analysed by flow cytometry. Relative numbers of total, naïve (CD62LhiCD44lo),
central memory (CD62LhiCD44hi; CM) and effector/memory (CD62LloCD44hi; EM)
CD4+ T cells were determined. Representative CD44 versus CD62L plots before and
after adoptive transfer are shown. At 20 weeks post transfer splenic, liver and lung
lymphocytes were analysed by flow cytometry. Absolute numbers of total, naïve, CM
and EM CD4+ T cells were determined. Results shown are means ± SEM for the
indicated number of mice; significance was determined using a two-tailed Mann-
Whitney U Test; *p < 0.05 ** p < 0.01.

12
Supplementary Figure S10. Full scans of the immunoblots shown in the main figures