Supplementary data The Thyroid Hormone Receptors Inhibit … · 2016-08-03 · Supplementary data...
18
Supplementary data The Thyroid Hormone Receptors Inhibit Hepatic Interleukin- 6 Signaling During Endotoxemia Constanza Contreras-Jurado 1 *, Elvira Alonso-Merino 1 *, Cristina Saiz-Ladera 1 , Arturo José. Valiño 1 , Javier Regadera 2 , Susana Alemany 1 and Ana Aranda 1 . 1 Departamento de Fisiopatología Endocrina y del Sistema Nervioso, Instituto de Investigaciones Biomédicas “Alberto Sols”. Consejo Superior de Investigaciones Científicas and Universidad Autónoma de Madrid. 2 Departamento de Anatomía, Histología y Neurociencia, Facultad de Medicina, Universidad Autónoma de Madrid. Madrid, Spain.
Transcript of Supplementary data The Thyroid Hormone Receptors Inhibit … · 2016-08-03 · Supplementary data...

Supplementary data
The Thyroid Hormone Receptors Inhibit Hepatic Interleukin-
6 Signaling During Endotoxemia
Constanza Contreras-Jurado1*, Elvira Alonso-Merino1*, Cristina Saiz-Ladera1, Arturo José. Valiño1, Javier Regadera 2, Susana Alemany1 and Ana Aranda1.
1Departamento de Fisiopatología Endocrina y del Sistema Nervioso, Instituto de Investigaciones Biomédicas “Alberto Sols”. Consejo Superior de Investigaciones Científicas and Universidad Autónoma de Madrid. 2 Departamento de Anatomía, Histología y Neurociencia, Facultad de Medicina, Universidad Autónoma de Madrid. Madrid, Spain.

Supplementary Materials and Methods
Antibodies used
Antibody Isotype Dilution Catalognumber Anti-P-STAT3Tyr705 Rabbit 1:1000 CellSignaling9145sAnti-STAT3 Rabbit 1:1000 CellSignalingC7907Anti-P-ERK Mouse 1:1000 SantaCruz,sc-7383Anti-ERK2 Rabbit 1:1000 SantaCruz,sc-154Anti-P-p65 Rabbit 1:500 CellSignaling3033Anti-p65 Mouse 1:1000 CellSignaling6956PAnti-IKBα Rabbit 1:500 SantaCruz,sc-371Anti-IKBβ Rabbit 1:500 SantaCruz,sc-945
Listofprimersused for real-time quantitative RT-PCR (qRT-PCR)
Amplificationprimers
Sequence(5´-3´)GENE Forward Reverse
Mouse IL6 GCTACCAAACTGGATATAATCAGGA CCAGGTAGCTATGGTACTCCAGA Mouse IL10 TCCTCCTCCAGCTCTTACCTC TGGCTTTCCCTAGGACTCTCT Mouse TNFα
CGATCACCCCGAAGTTCAGTA GGTGCCTATGTCTCAGCCTCTT
Mouse Socs3 ATTTTCGCTTCGGGACTAGC AACTTGCTGTGGGTGACCAT Mouse GAPDH
TTCACACCATGGAGAAGGC CCCTTTTGGCTCCACCCT
Mouse Dio1 GTTGAACTTTGGCAGTTGCAC GGCTGTGGAGGCAAAGTCATC Human Gp130
TCAACTTGGAGCCAGATTCC CCCACTTGCTTCTTCACTCC
Human Il6-r TTGTTTGTGAGTGGGGTCCT TGGGACTCCTGGGAATACTG Human CRP CCCTGAACTTTCAGCCGAATACA CGTCCTGCTGCCAGTGATACA Human Haptoglobin
TTGCAGTGGACTCAGGCAAT CAGCCGTCATCTGCTTCACAT
Human Hepcidin
CCCCACCCCCTGAACACA ACCGAGTGACAGTCGCTTTT
Human SAA1
CTGCAGAAGTGATCAGCG ATTGTGTACCCTCTCCCC
Human Socs3
ATCCTGGTGACATGCTCCTC GGCACCAGGTAGACTTTGGA
Human β-fibrinogen
AGCAGCTGCCACTCAAAAGA GAGGAGGTCTGGGAAACAGC
3 min exposure
1 min exposure 6 min exposure
1 min exposure
LPS
Vehicle
LPS
Vehicle
LPS
Vehicle
LPS
Vehicle
WT
KO
WT
KO
WT
KO
WT
KO
LIVER
SERUM
A)
B)
Fig. S1. TR de�ciency decreases hepatic and circulating levels of several cytokines and chemokines. A) Mouse Cytokine Arrays using pooled liver extracts from WT and TR KO mice (3-4 animals/point) treated with vehicle or with LPS (5mg/kg) for 4h as indicated. To better visualize the reduction in the intensity of the spots in the KO group two di�erent exposures of the arrays (1 min and 6 min) are shown. B) Arrays exposed for 1 min or 3 min obtained from pooled serum samples of the same animals. The blue, red and green circles show the position of the duplicate spots corresponding to TNFα, IL-6 and IL-10, respecti-vely.

0 1 2 3 4 5LPS 20 mg/kg (hours)
Dio
1 m
RN
A (fo
ld c
hang
e)
0
2
4
6
8
10
12
*****
**
****
0
1
2
3
4
LPS (5mg/kg) - +
Dio
1 m
RN
A (fo
ld c
hang
e)
EuthyroidHyperthyroid
EuthyroidHyperthyroid
B)A)
Fig. S2. Thyroid hormone treatment increases liver Dio1 mRNA levels. A) To prove that oral thyroid hormone treatment was su�cient to induce hyperthyroidism, Dio1 transcripts were measured in livers from euthyroid and hyperthyroid mice untreated and treated with vehicle or LPS (5mg/kg) for 5h. Data (means± s.e) are expressed relative to the values obtained in untreated euthyroid controls. Statistically signi�cant di�erences between euthyroid and hyperthyroid mice are shown with aste-risks. B) Similar experiments performed in mice injected with LPS (20mg/kg) for the indicated time periods.

Euthyroid
Hyperthyroid
Hyperthyroid
Euthyroid
Euthyroid
Hyperthyroid
Euthyroid
Hyperthyroid
LPS LPS
3 min exposure 5 min exposure
Vehicle
LPS
3 min exposure
Vehicle
Vehicle
LPS
1 min exposure
Vehicle
LIVER
SERUM
A)
B)
Fig. S3. Hepatic and circulating cytokines and chemokines in hyperthyroid mice. A) Liver extracts from euthyroid and hyperthyroid mice (pools from 4-6 animals) were used to detect cytokines and chemoki-nes with Mouse Cytokine Arrays. Mice were treated with vehicle or with LPS (5mg/kg) for 5h. Two di�e-rent exposures of the arrays (3 min and 5 min) are shown. The blue, red and green circles show location of the spots corresponding to TNFα, IL-6 and IL-10, respectively. Note that IL-6 is only clearly detectable at high exposures in hyperthyroid LPS-treated mice corresponding with the high IL-6 mRNA levels in the livers of these animals. B) Serum levels of cytokines and chemokines in the same animals. Arrays were exposed for 1 min and 3 min.
aaranda
Typewritten Text
aaranda
Typewritten Text

WTWT
LPS
Vehicle
KO
KO
A) B)
0 1 2 3 40
500
1000
1500
2000
2500
LPS 5mg/kg (hours)
AST
activ
ity
H&E
Fig. S4. Liver histology after LPS treatment of WT and TR KO mice. A) AST activity in serum of WT and TR KO mice treated with 5mg/kg LPS for the times indicated. B) Representative H&E staining of livers from mice treated with vehicle or LPS for 4h, showing an increased number of in�ammatory cells within the vessels and absence of necrosis or in�ammatory cell in�ltration in the liver parenchyma. Scale bar: 100µm.

Control Hyperthyroid Control Hyperthyroid
LPS
LPS LPS
LPS
Vehicle Vehicle
LPS (5mg/kg) - +
AST
activ
ity
EuthyroidHyperthyroid
0200400600800
1000
A)
B) C)a c
b d
e
a c
b d
e
H&E F4/80
Fig. S5. E�ect of hyperthyroidism in hepatic damage and immune cell in�ltration in response to LPS. A) AST activity in serum of control and hyperthyroid mice treated with vehicle or 5mg/kg LPS for 5h. B) H&E staining of the livers of the di�erent groups. Panel e shows the occasional appearance of necrotic foci with nuclei loss and in�ammatory cell in�ltration in LPS-treated hyperthyroid mice. Necrosis was not detected in the LPS-treated control mice. C) Immunohistochemistry of macrophages labeled with the F4/80 antibody in livers from the same animals, showing increased number of macrophages in hyperthyroid mice after LPS treatment. Panel e shows macrophage in�ltration in the necrotic areas, which did not occur in euthyroid mice. Scale bars: 100µm.

Control Hyperthyroid
LPS(20mg/kg)
LPS(20mg/kg)
Vehicle
a c
b
e
d
H&E
Fig. S6. H&E staining of livers from euthyroid and hyperthyroid mice treated with vehicle or 20 mg/kg LPS for 5h. Panel e shows liver morphology post-mortem in a representative mice that died 2 h after injection, showing absence of liver damage. Scale bar: 100µm.

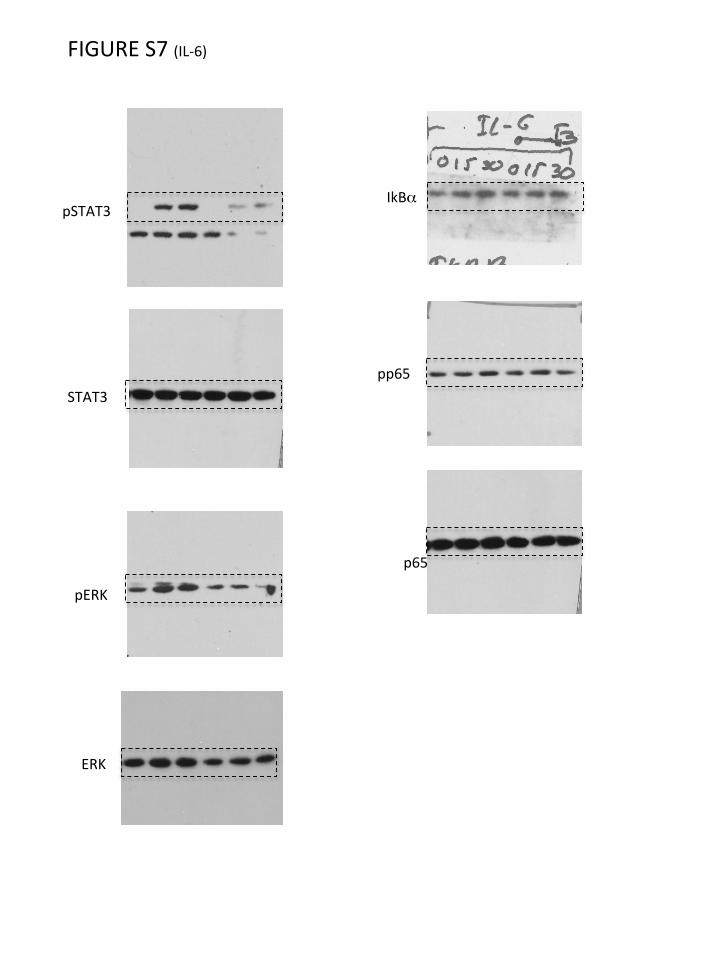
ERK
pERK
pSTAT3
- T3 + T3
0 15 30 0 15 30
IL-6 TNFα
IKBα
p65pp65
STAT3
Time (min)- T3
0 15 30 60
+ T3
0 15 30 60
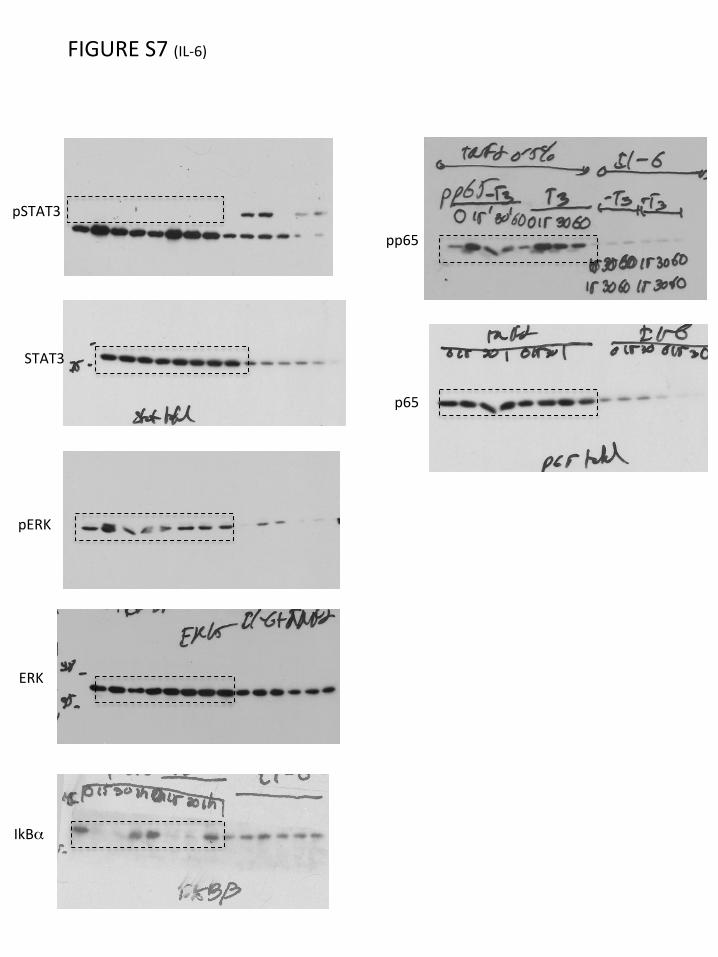
Fig. S7. T3 reduces signaling by IL-6 but not by TNFα in Hep3B cells. Western blots of tthe indicated proteins performed in cells treated with 5 nM T3 for 36 h and with IL-6 (10ng/ml) or TNFα (10ng/ml) for the indicated time periods in medium containing 0.5% thyroid hormone depleted serum.
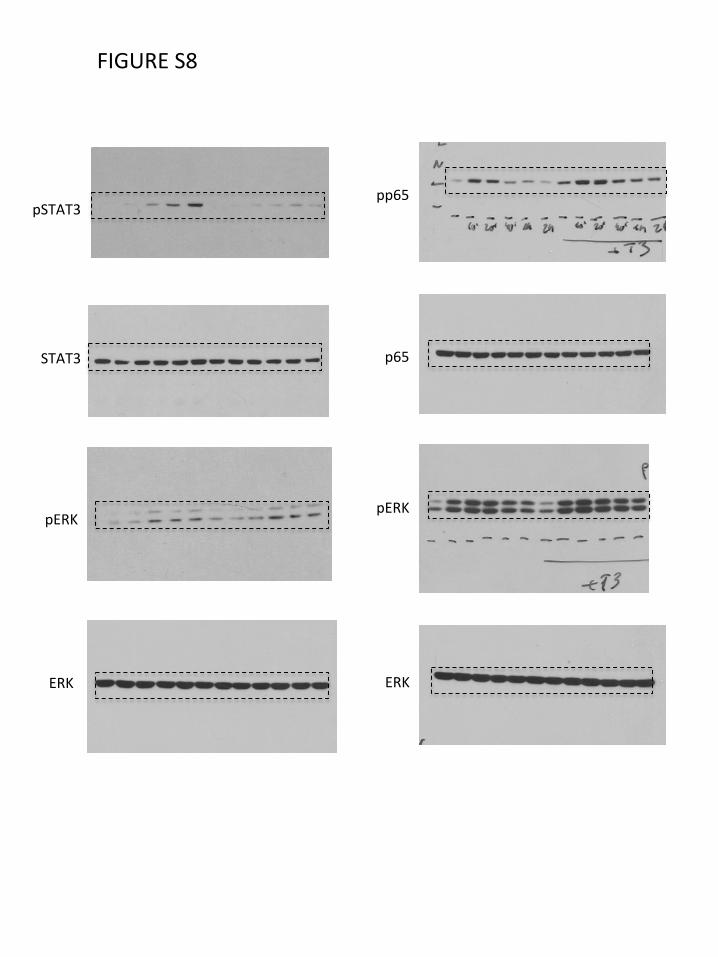
ERK
pERK
STAT3
pSTAT3
IL-6 (min)
- T3
0 10 20 60 120
40
+ T3
0 10 20 60 120
40 TNFα (min)
pp65p65
ERK
pERK
- T3
0 10 20 60 120
40
+T3
0 10 20 60 120
40
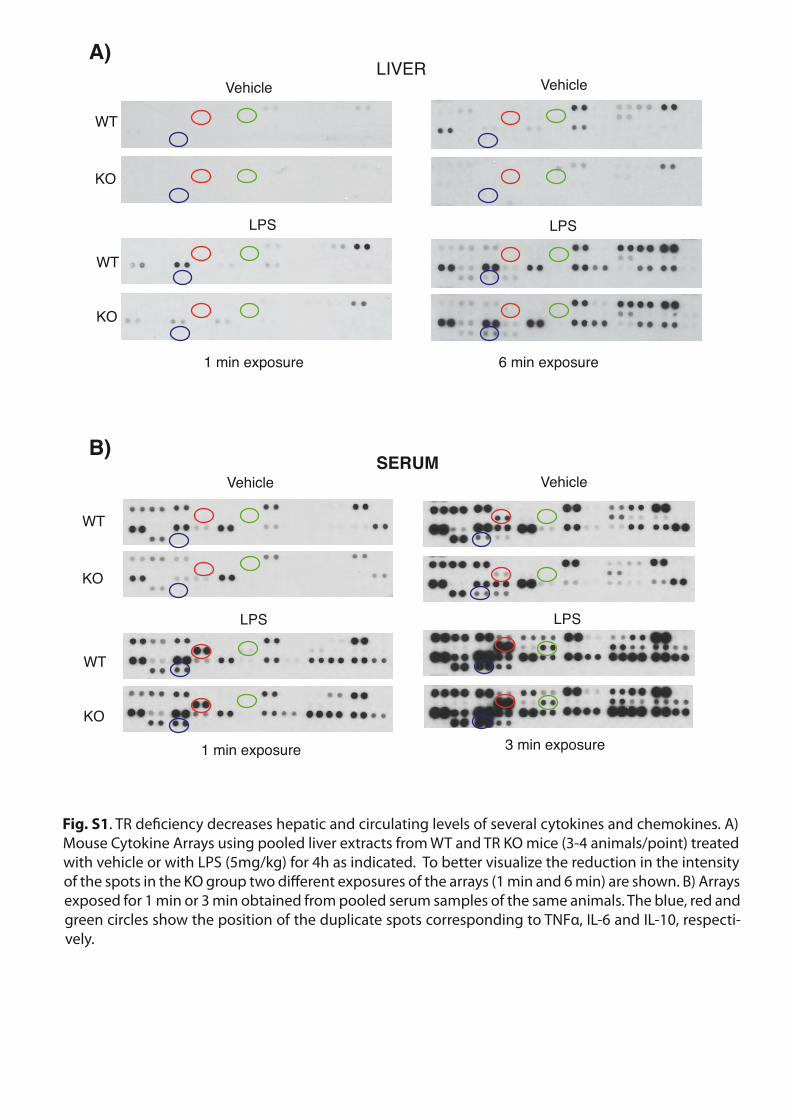
Fig.S8. T3 inhibits signaling by IL-6 but not by TNFα in macrophages. RAW264.7 cells were treated with 5nM T3 for 36h before addition of 10ng/ml IL-6 (A) or 10 ng/ml TNFα (B) for times varying between 0 and 120 min in medium containing 10% thyroid hormone depleted serum. The levels of the indicated total and phosphorylated proteins were analyzed by wes-tern blot.
A B))

pSTAT3 FIGURE1A
STAT3
pERK
ERK
pp65
p65
IkBα
IkBβ
FIGURE1B FIGURE1C
Fig.S9(blots)
FIGURE3CFIGURE3B
pSTAT3
STAT3
pERK
ERK
pp65
p65
IkBβ

FIGURE5A FIGURE5B
pSTAT3
STAT3
pERK
ERKpERK
ERK
pp65
p65
IkBα
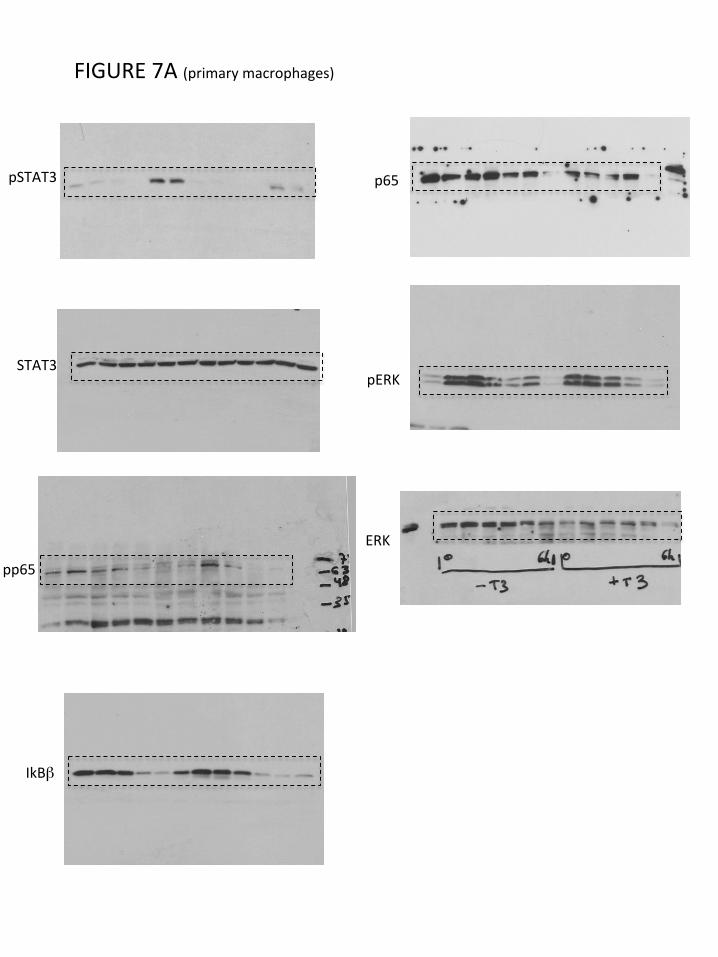
FIGURE7A(primarymacrophages)
pSTAT3
STAT3pERK
ERK
pp65
p65
IkBβ

FIGURE7ª(RAW264.7)
pSTAT3
STAT3 pERK
ERKpp65
p65
IkBβ
FIGURES7(IL-6)
pSTAT3
STAT3
pERK
ERK
pp65
p65
IkBα
FIGURES7(IL-6)
pSTAT3
STAT3
pERK
ERK
pp65
p65
IkBα
FIGURES8
pSTAT3
STAT3
pERK
ERK
pp65
p65
pERK
ERK