
Supplementary Data 19 - media.nature.com · Carla Galinha1,*, Hugo Hofhuis*, Marijn Luijten, Viola...
12
Supplemental data to: PLETHORA proteins as dose-dependent master regulators of Arabidopsis root development Carla Galinha 1,* , Hugo Hofhuis*, Marijn Luijten, Viola Willemsen, Ikram Blilou, Renze Heidstra and Ben Scheres 2 Dpt. of Biology, Faculty of Science, Utrecht University, Padualaan 8, 3584 CH Utrecht, The Netherlands 1: current address: Dpt. of Plant Sciences, University of Oxford, South Parks Road, Oxford OX1 3RB, UK 2: corresponding author: [email protected] *: These authors contributed equally to this work. SUPPLEMENTARY INFORMATION doi: 10.1038/nature06206 www.nature.com/nature 1
Transcript of Supplementary Data 19 - media.nature.com · Carla Galinha1,*, Hugo Hofhuis*, Marijn Luijten, Viola...

Supplemental data to:
PLETHORA proteins as dose-dependent master regulators of Arabidopsis root
development
Carla Galinha1,*
, Hugo Hofhuis*, Marijn Luijten, Viola Willemsen, Ikram Blilou, Renze
Heidstra and Ben Scheres2
Dpt. of Biology, Faculty of Science, Utrecht University, Padualaan 8, 3584 CH Utrecht, The
Netherlands
1: current address: Dpt. of Plant Sciences, University of Oxford, South Parks Road, Oxford
OX1 3RB, UK
2: corresponding author: [email protected]
*: These authors contributed equally to this work.
SUPPLEMENTARY INFORMATION
doi: 10.1038/nature06206
www.nature.com/nature 1
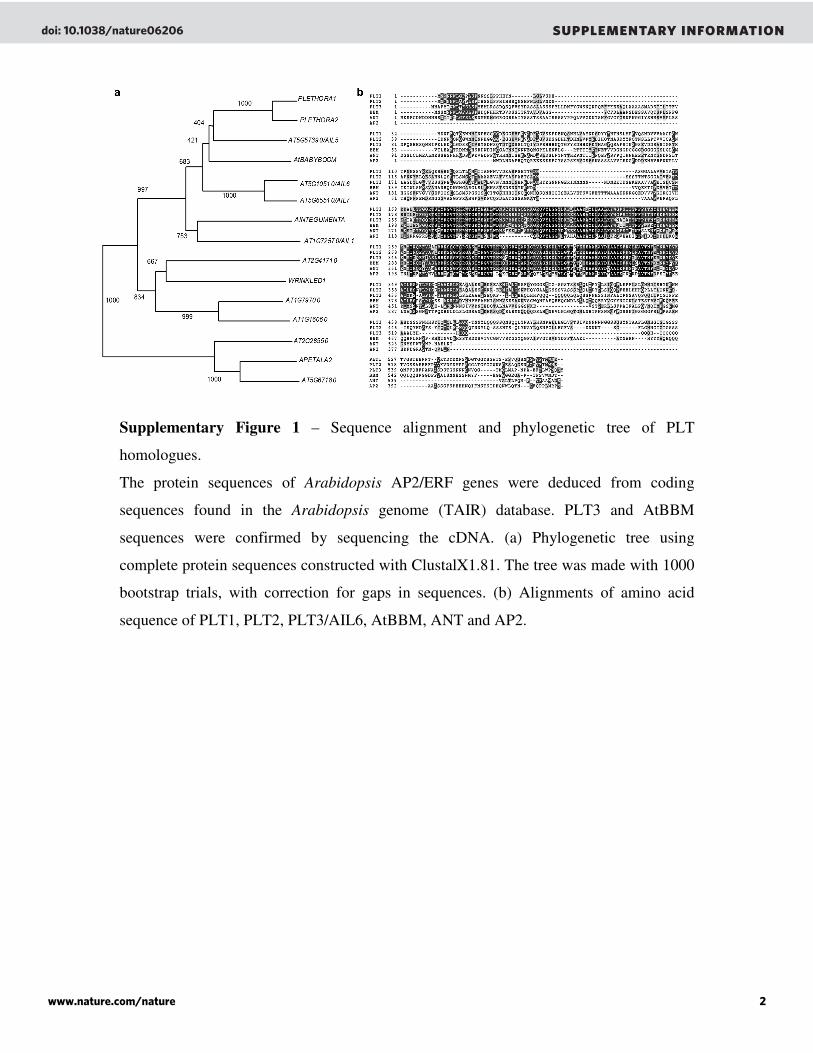
Supplementary Figure 1 – Sequence alignment and phylogenetic tree of PLT
homologues.
The protein sequences of Arabidopsis AP2/ERF genes were deduced from coding
sequences found in the Arabidopsis genome (TAIR) database. PLT3 and AtBBM
sequences were confirmed by sequencing the cDNA. (a) Phylogenetic tree using
complete protein sequences constructed with ClustalX1.81. The tree was made with 1000
bootstrap trials, with correction for gaps in sequences. (b) Alignments of amino acid
sequence of PLT1, PLT2, PLT3/AIL6, AtBBM, ANT and AP2.
doi: 10.1038/nature06206 SUPPLEMENTARY INFORMATION
www.nature.com/nature 2
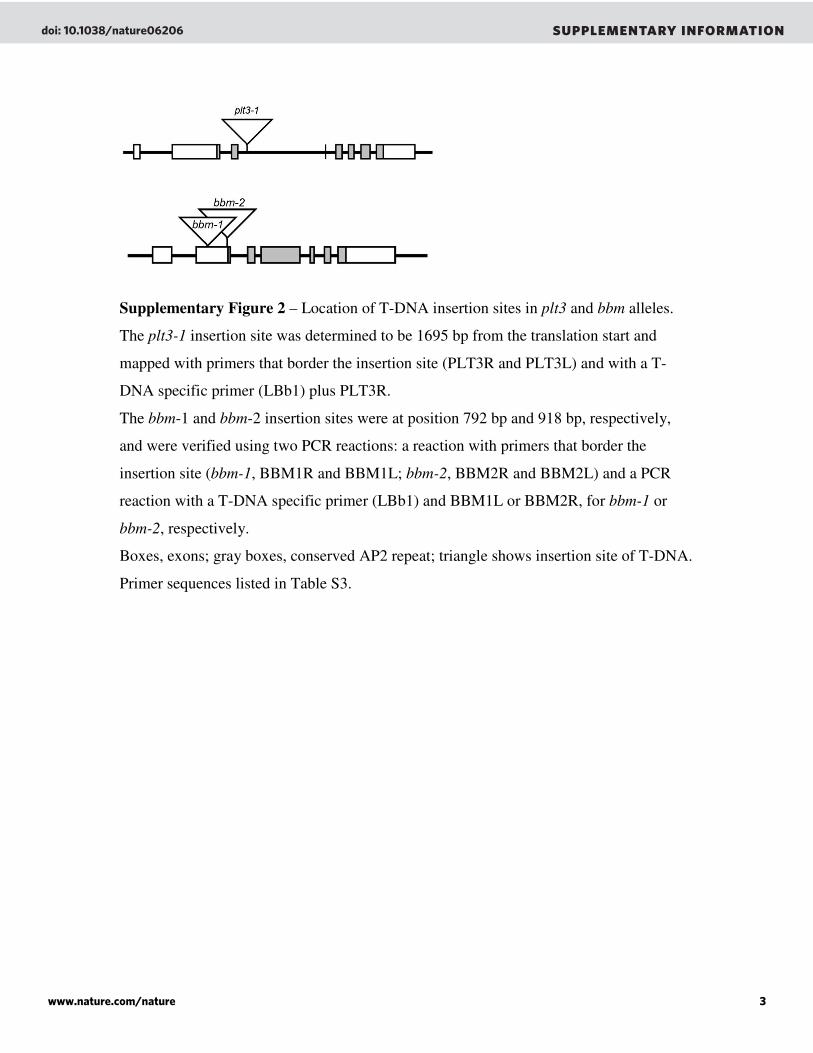
Supplementary Figure 2 – Location of T-DNA insertion sites in plt3 and bbm alleles.
The plt3-1 insertion site was determined to be 1695 bp from the translation start and
mapped with primers that border the insertion site (PLT3R and PLT3L) and with a T-
DNA specific primer (LBb1) plus PLT3R.
The bbm-1 and bbm-2 insertion sites were at position 792 bp and 918 bp, respectively,
and were verified using two PCR reactions: a reaction with primers that border the
insertion site (bbm-1, BBM1R and BBM1L; bbm-2, BBM2R and BBM2L) and a PCR
reaction with a T-DNA specific primer (LBb1) and BBM1L or BBM2R, for bbm-1 or
bbm-2, respectively.
Boxes, exons; gray boxes, conserved AP2 repeat; triangle shows insertion site of T-DNA.
Primer sequences listed in Table S3.
doi: 10.1038/nature06206 SUPPLEMENTARY INFORMATION
www.nature.com/nature 3

Supplementary Figure 3 – PLT dosage effect on root development.
(a) Nomarski optics images of 3 and 6 dpg seedlings of indicated genotypes reveal
dosage effect. Starch granules in columella cells stain brown. (b) Root length in wild-
type and plt mutants at indicated dpg. For each data point, n=10 to 50, bars: std error.
Supplementary Figure 4 – Embryo and seedling phenotypes of plt mutants.
(a-c) Root pole of mature embryos stained with aniline-blue. Wild-type (a), plt1-/-
plt2-/-
(b), and plt1-/-
plt2-/-
plt3-/-
(c). (d,e) vasculature in cleared wt (d) and plt1-/-
plt2+/-
plt3-/-
bbm-2-/-
(e) seedlings.
doi: 10.1038/nature06206 SUPPLEMENTARY INFORMATION
www.nature.com/nature 4

Supplementary figure 5 – Basal embryonic phenotype in progeny of plt1-/-
plt2+/-
plt3-/-
bbm-2-/-
parents. Upper row from left to right: wildtype-like sibling embryos at early and
late globular, heart and torpedo stages. Lower row: mutants of comparable stages.
Frequency of aberrant divisions at early heart stage was 15% (n=64). Scale bars: 10 µm.
doi: 10.1038/nature06206 SUPPLEMENTARY INFORMATION
www.nature.com/nature 5
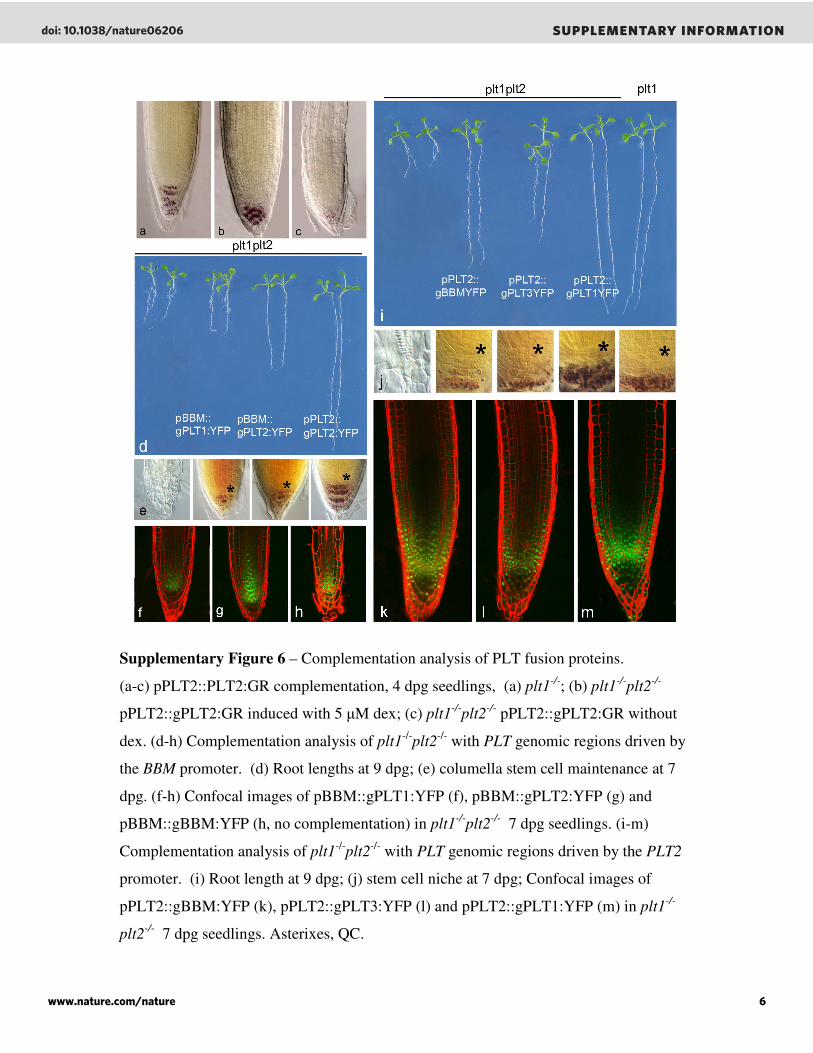
Supplementary Figure 6 – Complementation analysis of PLT fusion proteins.
(a-c) pPLT2::PLT2:GR complementation, 4 dpg seedlings, (a) plt1-/-
; (b) plt1-/-
plt2-/-
pPLT2::gPLT2:GR induced with 5 µM dex; (c) plt1-/-
plt2-/-
pPLT2::gPLT2:GR without
dex. (d-h) Complementation analysis of plt1-/-
plt2-/-
with PLT genomic regions driven by
the BBM promoter. (d) Root lengths at 9 dpg; (e) columella stem cell maintenance at 7
dpg. (f-h) Confocal images of pBBM::gPLT1:YFP (f), pBBM::gPLT2:YFP (g) and
pBBM::gBBM:YFP (h, no complementation) in plt1-/-
plt2-/-
7 dpg seedlings. (i-m)
Complementation analysis of plt1-/-
plt2-/-
with PLT genomic regions driven by the PLT2
promoter. (i) Root length at 9 dpg; (j) stem cell niche at 7 dpg; Confocal images of
pPLT2::gBBM:YFP (k), pPLT2::gPLT3:YFP (l) and pPLT2::gPLT1:YFP (m) in plt1-/-
plt2-/-
7 dpg seedlings. Asterixes, QC.
doi: 10.1038/nature06206 SUPPLEMENTARY INFORMATION
www.nature.com/nature 6
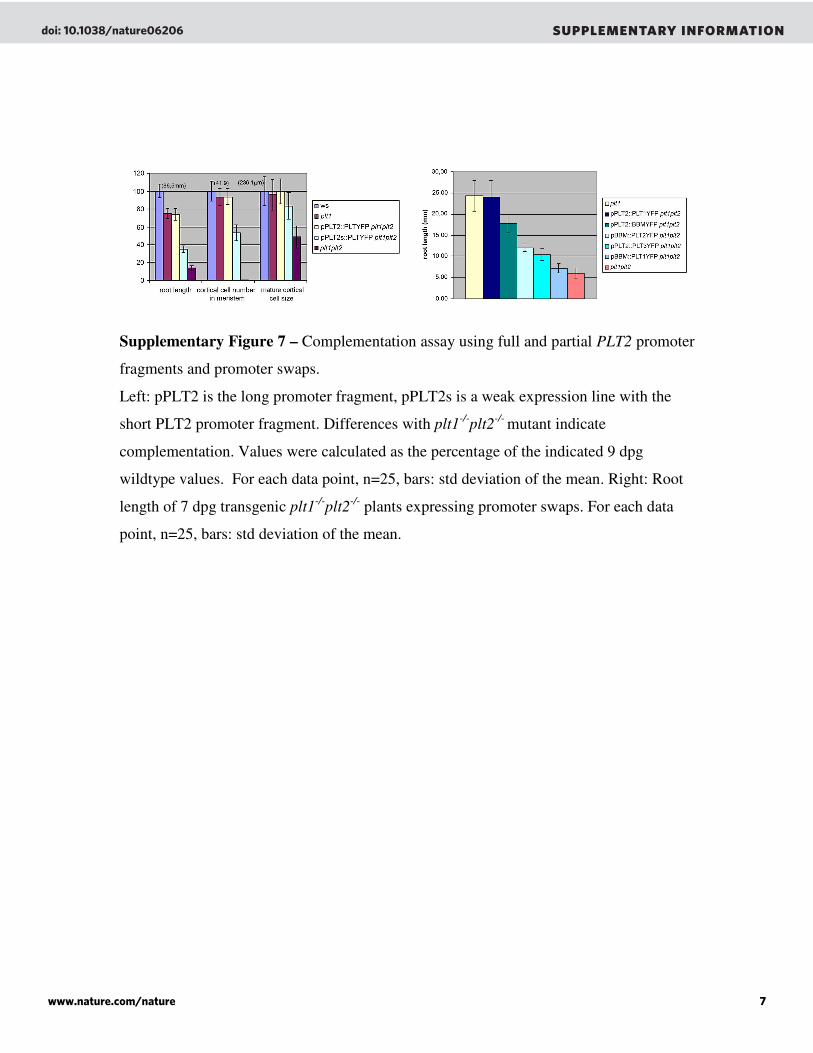
Supplementary Figure 7 – Complementation assay using full and partial PLT2 promoter
fragments and promoter swaps.
Left: pPLT2 is the long promoter fragment, pPLT2s is a weak expression line with the
short PLT2 promoter fragment. Differences with plt1-/-
plt2-/-
mutant indicate
complementation. Values were calculated as the percentage of the indicated 9 dpg
wildtype values. For each data point, n=25, bars: std deviation of the mean. Right: Root
length of 7 dpg transgenic plt1-/-
plt2-/-
plants expressing promoter swaps. For each data
point, n=25, bars: std deviation of the mean.
doi: 10.1038/nature06206 SUPPLEMENTARY INFORMATION
www.nature.com/nature 7
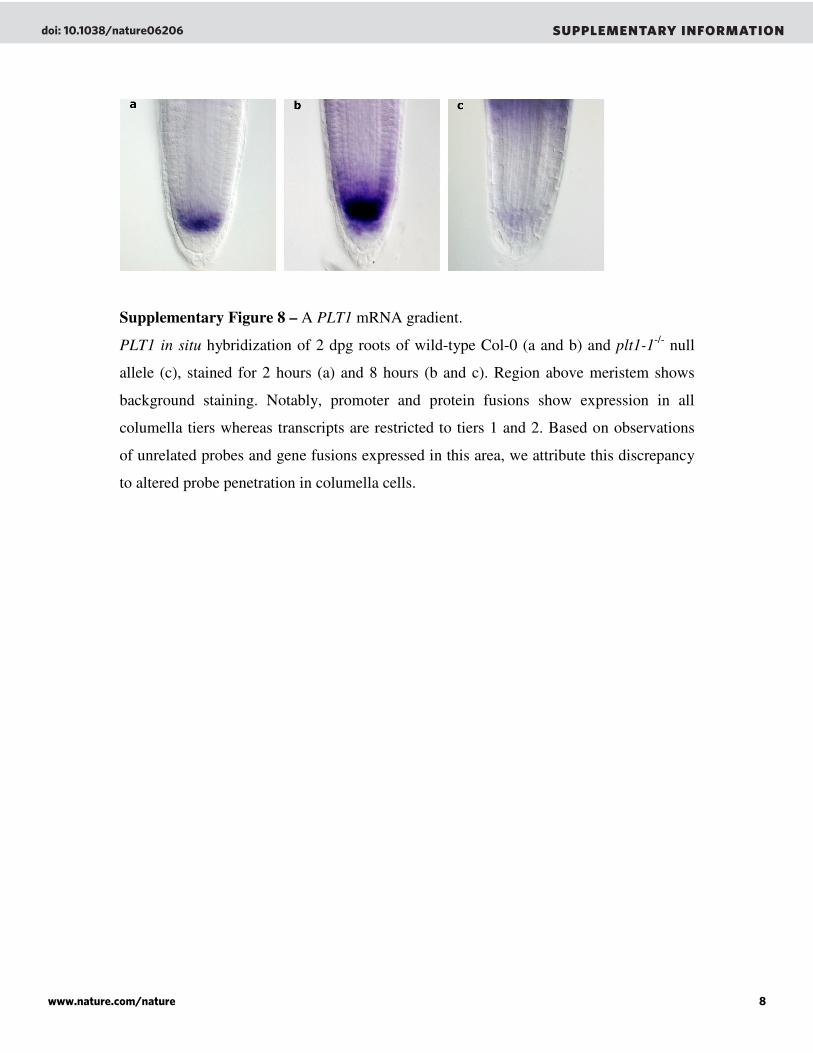
Supplementary Figure 8 – A PLT1 mRNA gradient.
PLT1 in situ hybridization of 2 dpg roots of wild-type Col-0 (a and b) and plt1-1-/-
null
allele (c), stained for 2 hours (a) and 8 hours (b and c). Region above meristem shows
background staining. Notably, promoter and protein fusions show expression in all
columella tiers whereas transcripts are restricted to tiers 1 and 2. Based on observations
of unrelated probes and gene fusions expressed in this area, we attribute this discrepancy
to altered probe penetration in columella cells.
doi: 10.1038/nature06206 SUPPLEMENTARY INFORMATION
www.nature.com/nature 8

Supplementary Figure 9 – Auxin response and PIN transcription upon PLT
overexpression.
(a-d) DR5::GUS expression in 3dpg 24 hr dex treated 35S::PLT2:GR roots that have
clearly expanded meristems. No dex (a); 24 hrs dex with unchanged GUS expression
(15%; n=53); with mild ectopic expression in proximal meristem (72%); with strong
ectopic expression (13%).
(e-i) PIN3 in situ hybridization in 35S::PLT2:GR roots treated with dex or mock at 2dpg.
12 hr no dex (e); 12 hr dex (f); 24 hr no dex (g); 24 hr dex with change in vascular PIN3
(92%; n=24) (h); 24 hr dex without change in vascular PIN3 (8%).
doi: 10.1038/nature06206 SUPPLEMENTARY INFORMATION
www.nature.com/nature 9
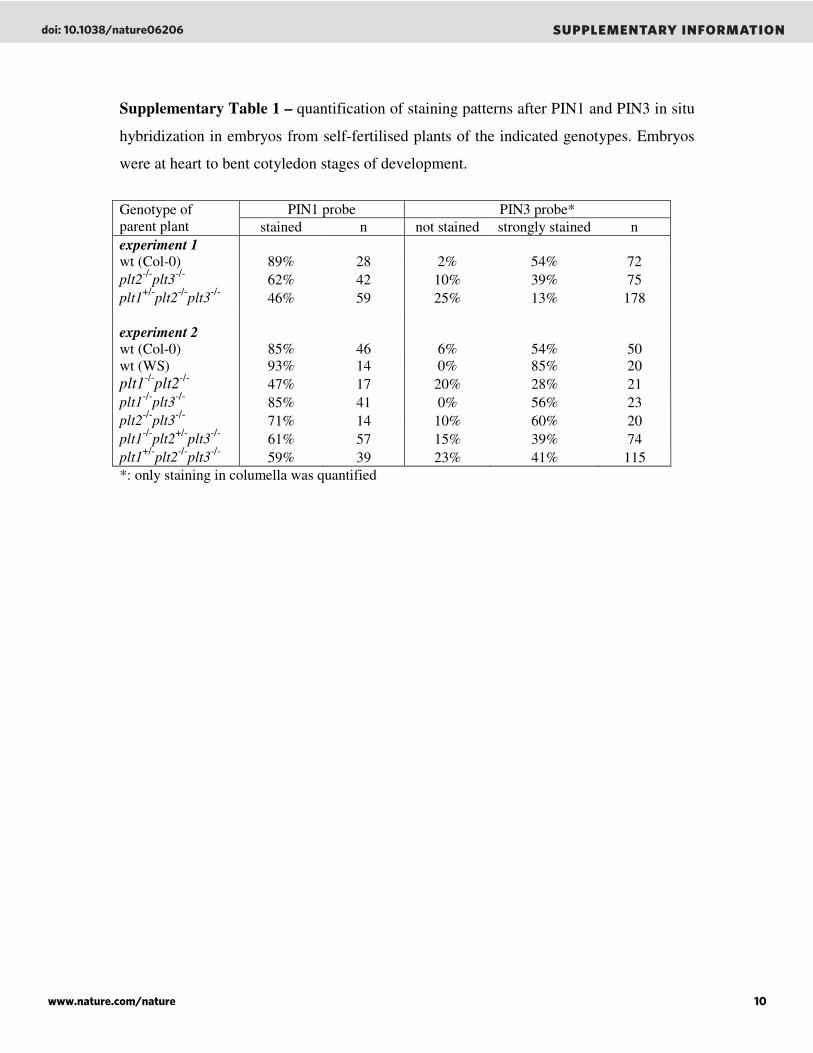
Supplementary Table 1 – quantification of staining patterns after PIN1 and PIN3 in situ
hybridization in embryos from self-fertilised plants of the indicated genotypes. Embryos
were at heart to bent cotyledon stages of development.
PIN1 probe PIN3 probe* Genotype of
parent plant stained n not stained strongly stained n
experiment 1
wt (Col-0) 89% 28 2% 54% 72
plt2-/-
plt3-/-
62% 42 10% 39% 75
plt1+/-
plt2-/-
plt3-/-
46% 59 25% 13% 178
experiment 2
wt (Col-0) 85% 46 6% 54% 50
wt (WS) 93% 14 0% 85% 20
plt1-/-
plt2-/-
47% 17 20% 28% 21
plt1-/-
plt3-/-
85% 41 0% 56% 23
plt2-/-
plt3-/-
71% 14 10% 60% 20
plt1-/-
plt2+/-
plt3-/-
61% 57 15% 39% 74
plt1+/-
plt2-/-
plt3-/-
59% 39 23% 41% 115
*: only staining in columella was quantified
doi: 10.1038/nature06206 SUPPLEMENTARY INFORMATION
www.nature.com/nature 10

Supplementary Table 2- Seedling phenotype in different allelic combinations of plt/bbm
mutants. Frequency of basal defects were scored in the progeny of self-fertilised plants of
the indicated genotype. plt1,plt3,bbm-1,plt2/+ seedlings display diverse defects that can be
grouped in three phenotypic classes of different penetrance Used mutant alleles: plt1-4,
plt2-2, plt3-1.
genotype of parent plant n
no
root/hypocotyl no root short root #
wt (Col-0) 869 0 0 -
wt (WS) 620 0 0 -
plt1 510 0 0 -
plt2 741 0 0.40% -
bbm-1 774 0 0.13% -
bbm-2 880 0 2.3% -
plt1,bbm-1 654 0 0.31% -
plt1,bbm-2 169 0.59% 0 -
plt1,bbm-1,plt2/+ 935 0.64% 0.11% -
plt1,bbm-2,plt2/+ 776 2.1% 0.51% -
plt2,bbm-2/+ 984 0 0.31% -
bbm-2,plt2/+ 861 0 0.12% -
plt1,plt2 2233 0.05% 0.09% -
plt1,plt2,bbm-1/+ 768 3.4% 1.3% -
plt1,plt2,bbm-2/+ 770 0.52% 0.52% -
plt3 1650 0 0.85% -
plt1plt3 504 0 1.2% -
plt2,plt3 731 0 0 -
plt1,plt3,plt2/+ 742 0 27% -
plt2,plt3,plt1/+ 623 0 28% -
plt1,plt2,plt3/+ 553 0 25% -
plt1,plt3,bbm-1 200 0 1% 2.5%
plt3,bbm,plt2/+ 261 0 0.77% 2.3%
plt1,plt3,bbm-1,plt2/+ 303 6.6% 25% 38%
plt1,plt3,bbm-1,plt2/+ siblings*: 9.5% 35.7% 54.8%
# : seedlings with shorter root than plt1,plt2 mutants that terminate growth at 6 dpg.
-: not determined, see figure 2 for root length.
*: heterozygous siblings (68% of population).
.
doi: 10.1038/nature06206 SUPPLEMENTARY INFORMATION
www.nature.com/nature 11

Supplementary Table 3. Primer sequences used for cloning, mapping, genotyping and
riboprobe amplification.
fragment abbrev
fragm
size Forward primer Reverse primer
PLT1
promoter pPLT1 4.5 kb
pPLT1-Fa
(GGGGACCACTTTGTACAAGAAAGCTGG
GTTAGTGTCGTTCCAAACTGAAAACGTTG)
pPLT1-Ra
(GGGGACTGCTTTTTTGTACAAACTTGT
AAAGCCAAGCCAGTTGTTAGAA)
PLT2 long
promoter pPLT2L 5.8 kb
pPLT2-Fa
(GGGGACAACTTTGTATAGAAAAGTTGTT
TCAACTCTCGTTGCATTGACT)
pPLT2-Ra
(GGGGACTGCTTTTTTGTACAAACTTGT
CGCGAGCCAGTTGTTAGAAT)
PLT2 short
promoter pPLT2S 1.3 kb
pPLT2-Fj
(GGGGACAACTTTGTATAGAAAAGTTGTT
GAGAGGGAATTAGGGTTTGGAC)
pPLT2-Ra
(GGGGACTGCTTTTTTGTACAAACTTGT
CGCGAGCCAGTTGTTAGAAT)
PLT3
promoter pPLT3 4.6 kb
pPLT3-Fa
(GGGGACAACTTTGTATAGAAAAGTTGTT
CTTATTTGCATGGGATCGTCTT)
pPLT3-Ra
(GGGGACTGCTTTTTTGTACAAACTTGT
CATCTCCATTGGTGACAGAGAA)
BBM
promoter pBBM 4.2 kb
pBBM-Fa
(GGGGACAACTTTGTATAGAAAAGTTGTT
GAAAGCTTACGATTACAGAGACCAAAAGGGG)
pBBM-Ra
(GGGGACTGCTTTTTTGTACAAACTTGT
CATATAATATTCTAACTACTCCTTGTGATA)
RCH2
promoter pRCH2 2.3 kb
pRCH2-Fa
(GGGGACAACTTTGTATAGAAAAGTTGTT
TCGAGGCAAAGACCCTTGAAACAAG)
pRCH2-Ra
(GGGGACTGCTTTTTTGTACAAACTTGT
TAGGAAGAGAACATAAGAGGGTTTAAG)
PLT1
genomic
region gPLT1 2.6 kb
gPLT1-Fa
(GGGGACAAGTTTGTACAAAAAAGCAGGC
TTTATGAATTCTAACAACTGGCTTGG)
gPLT1-Ra
(GGGGACCACTTTGTACAAGAAAGCTGG
GTTCTCATTCCACATAGTGAAAACACCA)
PLT2
genomic
region gPLT2 2.8 kb
gPLT2-Fa
(GGGGACAAGTTTGTACAAAAAAGCAGGC
TTTATGAATTCTAACAACTGGCTCGCGTT)
gPLT2-Ra
(GGGGACCACTTTGTACAAGAAAGCTGG
GTTTTCATTCCACATCGTGAAAACACCTC)
PLT3
genomic
region gPLT3 4.0 kb
gPLT3-Fa
(GGGGACAAGTTTGTACAAAAAAGCAGGC
TTTATGGAGATGTTGAGGTCATCTGATCA)
gPLT3-Ra
(GGGGACCACTTTGTACAAGAAAGCTGG
GTTGTAAGACTGATTAGGCCAGAGGAAGAACTCAGC)
BBM
genomic
region gBBM 3.0 kb
gBBM-Fa
(GGGGACAAGTTTGTACAAAAAAGCAGGC
TTTATGAACTCGATGAATAACTGGTTAGGC)
gBBM-Ra
(GGGGACCACTTTGTACAAGAAAGCTGG
GTTAGTGTCGTTCCAAACTGAAAACGTTG)
PLT3
riboprobe 400 bp PLT3C-F (ATCGGTGGTGCAGCTAAACG) PLT3C-R (AAGAACTCAGCCGGATTTGG)
BBM
riboprobe 550 bp BBMC-F (AATCCGGTTCCAGCTATGATG) BBMC-R (TCCAAACTGAAAACGTTGGAG)
plt3-1
genotyping 921bp PLT3L (TTGTGATTTGCCATTGACTAAAGGT) PLT3R (GAAAACAGTCCAATGGTCTCACATC)
bbm-1
genotyping 911bp BBM1L (CACTCTCTCTCAACCGAACCATTAG) BBM1R (CATCTTTTCTTTCTCCTTTCGGTGT)
bbm-2
genotyping 963bp BBM2L (ACTTTAGTGCGGCTAAATCGTAAGC) BBM2R (CAATAACGAACAAAATGGACCAAAG)
doi: 10.1038/nature06206 SUPPLEMENTARY INFORMATION
www.nature.com/nature 12