
Supplementary Appendix for Outsourcing Mutual Fund ...hh2679/OutsourcingAppendix.pdf ·...
29
1 Supplementary Appendix for Outsourcing Mutual Fund Management: Firm Boundaries, Incentives and Performance JOSEPH CHEN, HARRISON HONG, WENXI JIANG, and JEFFREY D. KUBIK * This appendix provides details on how we constructed our outsourcing status measure, how we constructed our fund performance benchmarks construction choices, and robustness checks. A. Categorizing Outsourcing Status If two advisors are listed in Thomson Mutual Fund Holdings Database, but only one of the names does not match the name of the family complex, we identify that fund as a candidate for being outsourced. Note the limitation to “candidate” because advisors with different names may still be affiliated. We carefully do this matching by hand so as to account for issues such as slight variations of names for the same organization (e.g. Smith Barney Ltd versus Smith Barney) and to account for different divisions of the same company having different names (e.g. Morgan Stanley Japan is a part of Morgan Stanley). The latter issue is relevant mostly for categorizing international funds. Using this scheme alone, we identify roughly 56% of fund-year observations as being managed in-house and 44% of fund-year observations as candidates for being outsourced. 1 * Chen is from the University of California at Davis, Hong is from Princeton University, Jiang is from Yale School of Management, and Kubik is from Syracuse University.
Transcript of Supplementary Appendix for Outsourcing Mutual Fund ...hh2679/OutsourcingAppendix.pdf ·...

1
Supplementary Appendix for
Outsourcing Mutual Fund Management:
Firm Boundaries, Incentives and Performance
JOSEPH CHEN, HARRISON HONG, WENXI JIANG, and JEFFREY D. KUBIK*
This appendix provides details on how we constructed our outsourcing status measure,
how we constructed our fund performance benchmarks construction choices, and
robustness checks.
A. Categorizing Outsourcing Status
If two advisors are listed in Thomson Mutual Fund Holdings Database, but only
one of the names does not match the name of the family complex, we identify that fund
as a candidate for being outsourced. Note the limitation to “candidate” because advisors
with different names may still be affiliated. We carefully do this matching by hand so as
to account for issues such as slight variations of names for the same organization (e.g.
Smith Barney Ltd versus Smith Barney) and to account for different divisions of the same
company having different names (e.g. Morgan Stanley Japan is a part of Morgan
Stanley). The latter issue is relevant mostly for categorizing international funds. Using
this scheme alone, we identify roughly 56% of fund-year observations as being managed
in-house and 44% of fund-year observations as candidates for being outsourced.1
* Chen is from the University of California at Davis, Hong is from Princeton University, Jiang is from Yale
School of Management, and Kubik is from Syracuse University.

2
We then use the SEC database of disclosures by investment advisors to check the
relationship of advisors with different names. The worry is that we might misidentify an
advisor who is a part of the same ownership structure as the mutual family because the
names vary within the ownership structure. For example, The Dreyfus Corporation is a
mutual fund family that is owned by Mellon Financial Corporation and there are funds in
Dreyfus whose advisor is Mellon Bank. Similarly, there are other advisors in Dreyfus,
such as The Boston Company, who are affiliated with the Mellon Financial Corporation.
Fortunately, investment advisors are required by the Investment Advisers Act of 1940 to
disclose their ownership structure to the SEC in their registration via Form ADV.2 In all
of our analysis, we exclude index funds.
Panel A of Supplement Table I provides a summary of our identification scheme
by year. We find that the incidence of outsourcing has increased over time. As the
mutual fund industry (i.e. families) has grown substantially during this period (as
witnessed by the dramatic increase in the number of funds), they are, in turn, outsourcing
a larger portion of their management. On average, we find that the managements of about
27% of the funds in our sample are outsourced. This figure is slightly higher than other
estimates given by industry practitioners and regulators, which hover anywhere from the
mid-teens to twenty-percent.3
[Insert Supplement Table I here]
Panel B of Supplement Table I shows the break down of our identification
scheme by the investment styles provided by the CRSP Mutual Fund Database. The
percentage of funds being farmed out is uniform across almost every style; for six of the
seven styles, on average about 28% (range from 24% to 32%) of funds are outsourced.
3
The exception is sector funds; about 19% of these funds are outsourced on average. Thus,
outsourcing does not appear to be limited to a few styles. Furthermore, most of the funds
that are unidentified are bond and money market funds. The reason is that the Thomson
Database focuses primarily on equity and has spottier coverage of bond funds. Our
results, however, hold even if we just considered equity funds. So these missing
observations do not appear to be driving our results. Our final sample excludes funds that
we are unable to definitively identify as being outsourced or not.
B. Fund Performance Benchmarks
In Supplement Table II, we report summary statistics on the performance
benchmarks used in our analysis.
[Insert Supplement Table II here]
C. Additional Analyses
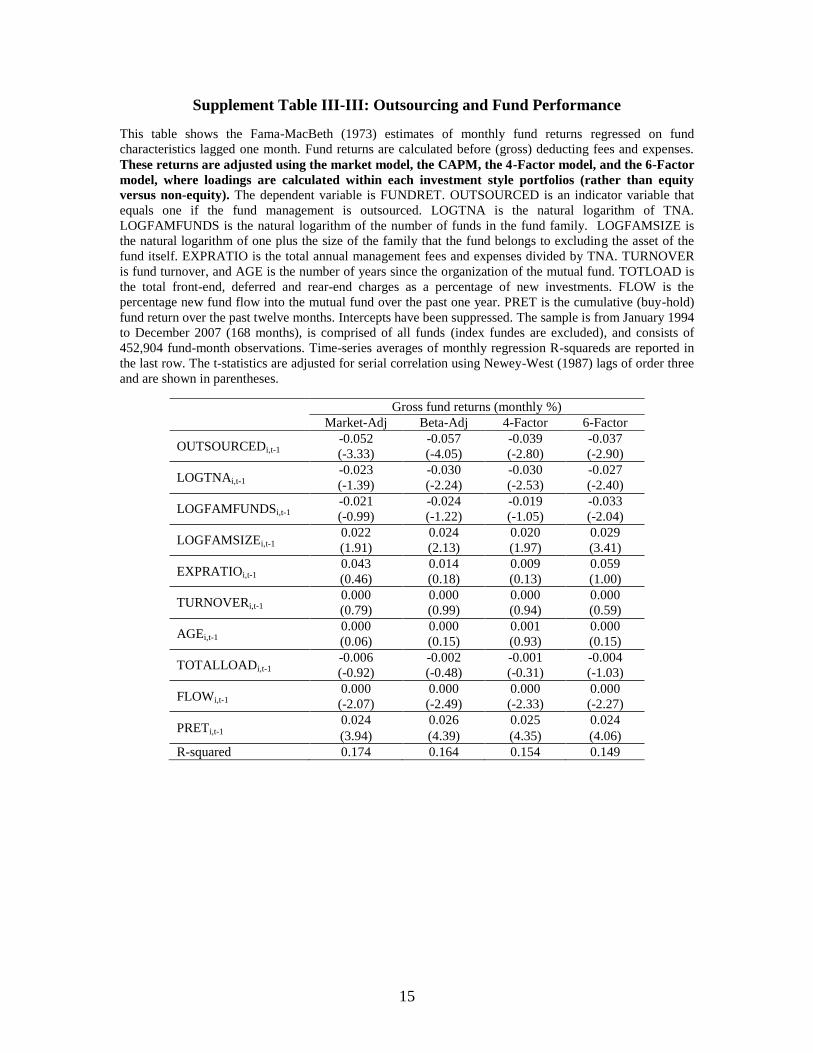
In Supplement Table III, we use a fund’s previous 60 months of returns to
estimate the factor loadings at each month. Hence we require a fund to be in existence for
at least 5 years before it enters the sample. As the table shows, the coefficients on the
effects of outsourcing on performance do not change much when we compared them to
our main table (Table III of the paper). This is true whether we use the CAPM, the 4-
Factor model or the 6-Factor model.
[Insert Supplement Table III here]
4
In Supplement Table IV, we change the definition of outsourcing to the following.
If two advisors are listed (two is the maximum number listed), we require that both
advisors be unaffiliated external advisors rather than just one or the other for us to
identify the fund as outsourced. Doing so reduces the average number of outsourced
funds at any given time from 808 funds to roughly 600 funds. As the table shows, our
result regarding the effect of outsourcing on performance is hardly changed. If anything,
there is a very slight improvement with this identification scheme.
[Insert Supplement Table IV here]
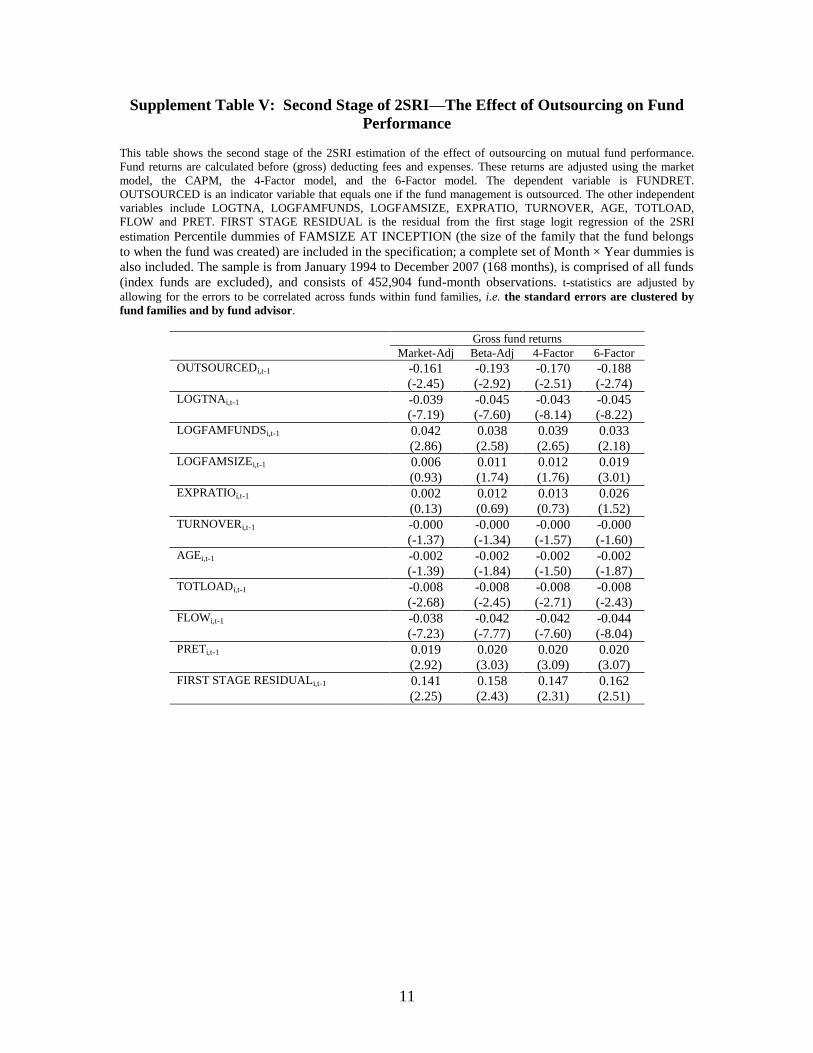
In Supplement Table V, we apply double-clustered standard error for family and
advisor to our Table VI (second stage regression the IV regression), since this is a linear
regression. We did not apply double-clustered standard error to our main regression,
since its empirical specification is Fama-MacBeth. We note that our t-statistic using
double-clustered standard error for family and advisor are of slightly lower statistical
significance.
[Insert Supplement Table V here]
In Supplement Table VI, we look at the relationship between expense ratios and
flows and outsourcing status. We find that outsourced funds have a lower expense ratio
but there is no difference in flows.
[Insert Supplement Table VI here]
D. Robustness Checks

5
In Supplement Tables III-I to III-XIV, we report the tables for the robustness
checks discussed in the Section V of our paper regarding our baseline Table III on the
effect of outsourcing on performance. For brevity, we briefly summarize here the check
performed by each table.
Table III-I: The dependent variable is net fund returns.
Table III-II: Loadings for performance benchmarks are calculated using gross
fund returns.
Table III-III: Loadings for performance benchmarks are calculated using each
investment style rather than equity versus non-equity.
Table III-IV: Loading for performance benchmarks are calculated using past
return portfolios.
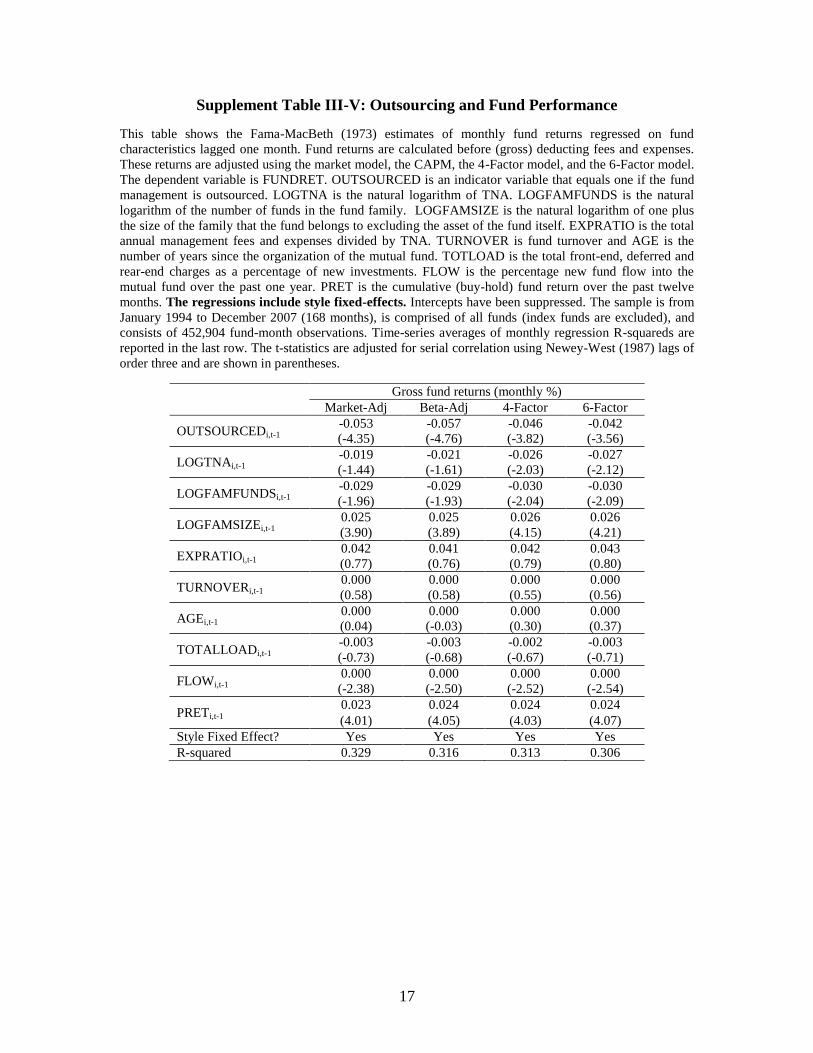
Table III-V: Performance regression includes style fixed effects.
Table III-VI: Performance regression excludes international and sector funds.
Table III-VII: Control separately for expense ratio net of 12B1 fees and 12B1
fees.
Table III-VIII: Control separately for front load and rear load.
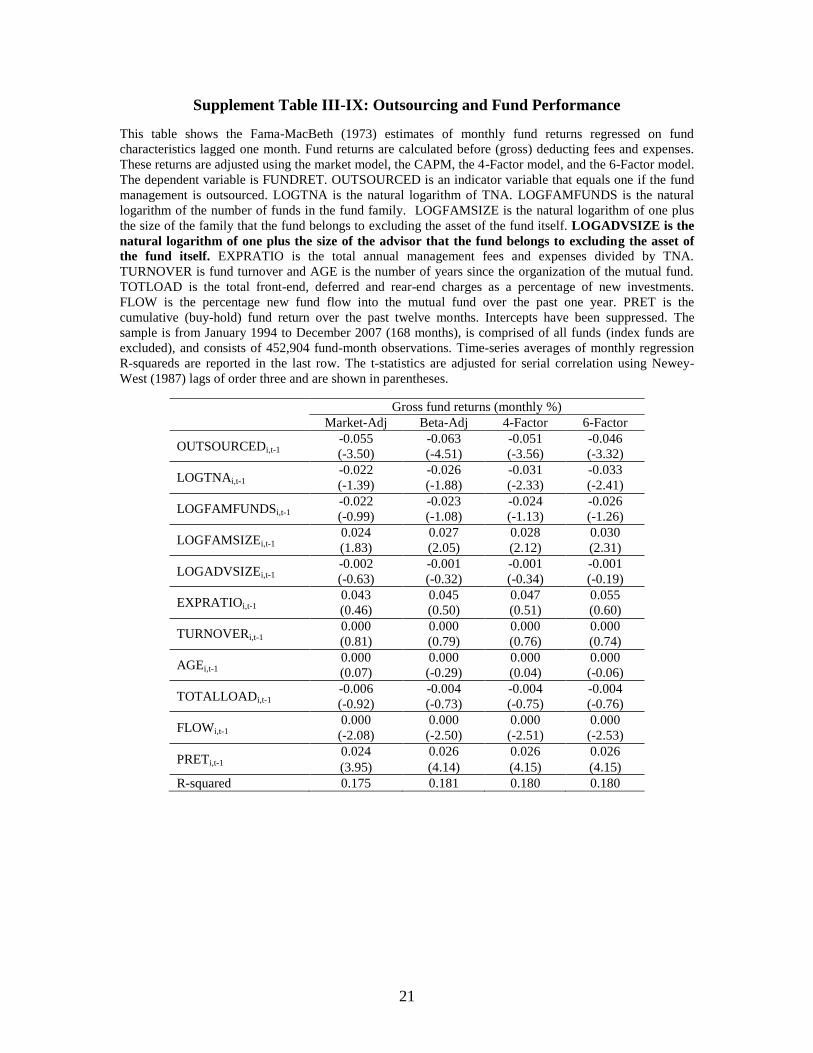
Table III-IX: Control for log of advisor size or assets under management.
Table III-X: Control for Family Size interacted with Advisor Size.
Table III-XI: Use decile rankings for advisor size control.
Table III-XII: Control for log of number of funds managed by advisor.
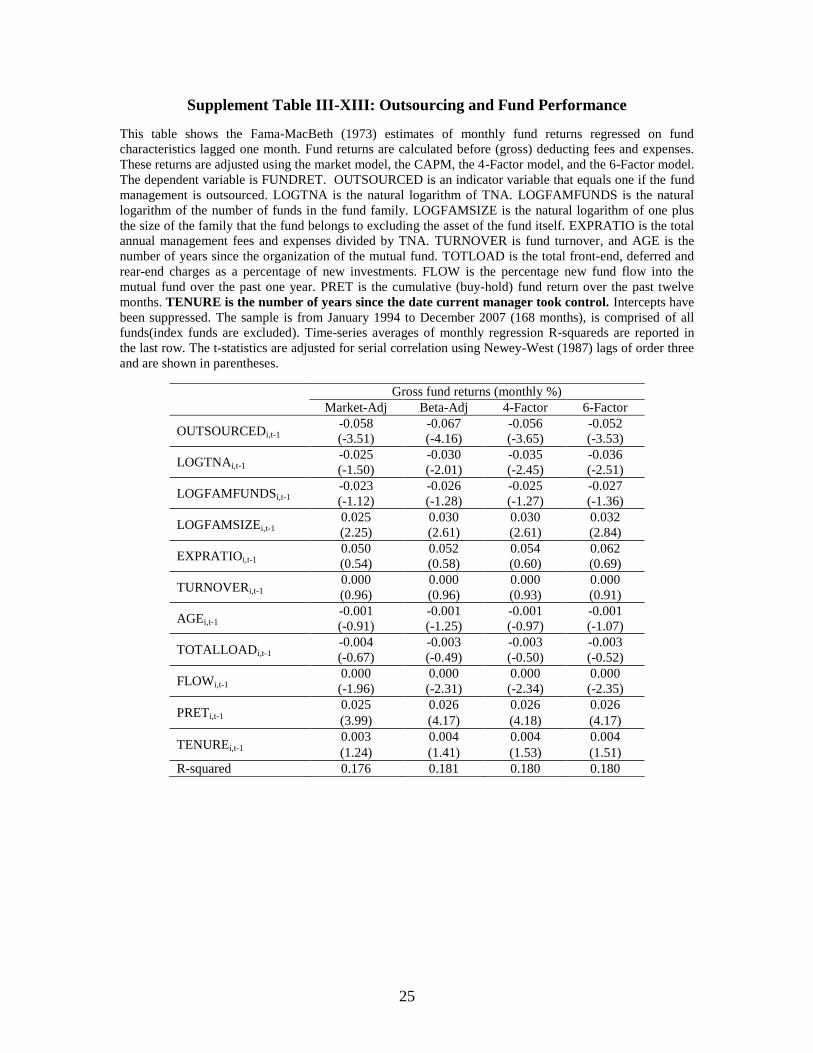
Table III-XIII: Control for tenure of manager.
Table III-XIV: OLS estimates and control for year and month fixed effects.

6
[Insert Supplement Table III-I to Table III-XIV here]
In Supplement Table VIII-I, we add as additional controls to the specification of
Table VIII a style ends dummy.
[Insert Supplement Table VIII-I here]
In Supplement Table IX-I, we add as an additional control manager tenure to the
specification in Table IX.
[Insert Supplement Table IX-I here]

7
Supplement Table I: Identification of Mutual Fund Management
This table reports the number of mutual funds we identify as being managed in-house versus being
outsourced. Index funds are excluded. We match mutual fund in CRSP Mutual Fund Database with entries
in Thomson Mutual Fund Holdings Database. We identify a fund as being managed in-house if the name of
its mutual fund family reported in CRSP matches the names of its investment advisory firm reported in
CDA/Spectrum. We also identify a fund as being managed in-house if the names do not match but they are
filed with the SEC’s ADV forms as the names of one company that owns another or as the names of two
affiliated companies. Otherwise, we identify the mutual fund management as being outsourced. If the
names are not provided and we cannot further identify the management using manager abbreviation codes,
we label the fund as being unidentified. Panel A reports the distribution of fund management outcomes by
year. Panel B breaks down the unidentified mutual funds by style. Percentages of total within each year are
reported in parenthesis.
Panel A: Number of funds that are managed in-house, outsourced and left unidentified
Year In-house Outsourced Unidentified
1994 1576 (69%) 459 (20%) 252(11%)
1995 1740(69%) 555(22%) 235(9%)
1996 1950(69%) 627(22%) 245 (9%)
1997 2366(69%) 749(22%) 302 (9%)
1998 2455(67%) 930(25%) 292 (8%)
1999 2467(62%) 1323(33%) 187 (5%)
2000 2887(70%) 1034(25%) 183 (4%)
2001 2965(70%) 1093(26%) 197 (5%)
2002 2938(70%) 1085(26%) 186 (4%)
2003 2924(68%) 1161(27%) 197 (5%)
2004 2885(66%) 1239(29%) 216 (5%)
2005 2765(70%) 1210(30%) 15 (0%)
2006 2596(68%) 1189(31%) 15 (0%)
2007 2977(70%) 1253(30%) 16 (0%)
Total 35491(68%) 13907(27%) 2538 (5%)
Panel B: Breakdown of in-house funds, outsourced funds and unidentified funds by style
Year Ag
gre
ssiv
e
Gro
wth
Sm
all-
Cap
Gro
wth
Gro
wth
an
d
Inco
me
Bo
nd
or
Mo
ney
Mk
t
Sec
tor
Inte
rnat
ion
al
Bal
ance
d
In-house 6519(69%) 3941(66%) 3668(69%) 7757(62%) 2971(79%) 6314(71%) 4318(70%)
Outsourced 2745 (29%) 1913(32%) 1515(28%) 2955(24%) 709(19%) 2362(27%) 1708(28%)
Unidentified 140(1%) 77(1%) 138(3%) 1736(14%) 87(2%) 204(2%) 156(3%)

8
Supplement Table II: Summary Statistics for Performance Benchmarks
This table reports the loadings of equal-weighted fund portfolios on various factors. The portfolios are first sorted by TNA and then separated into funds
managed in-house and outsourced funds. VWRF is the return on the CRSP value-weighted stock index in excess of the one-month Treasury rate. SMB is the
return on a portfolio of small stocks minus large stocks. HML is the return on a portfolio long high book-to-market stocks and short low book-to-market stocks.
UMD is the return on a portfolio long stocks that are past winners and short those that are past losers. MSCI is the excess return on the MSCI EAFE index. LABI
is the excess return on the Lehman Aggregate Bond Index. Panel A reports the means, standard deviations and correlations of the factors. Panel B and C report
factor loadings for Fama-French (1993) model augmented with the momentum factor, MSCI and LABI (6-Factor model). Panel B shows results for equity funds
while Panel C shows results for non-equity funds. The sample period is from January 1994 to December 2007 and is comprised of equity funds (Index funds are
excluded).
Panel A: Summary statistics of the factors
Factor Mean
Return
SD of
Return
Cross-correlations
VWRF SMB HML UMD MSCI LABI
VWRF 0.61% 4.16% 1.00 0.21 -0.51 -0.20 0.79 -0.01
SMB 0.13% 3.85% 1.00 -0.48 0.17 0.19 -0.13
HML 0.34% 3.48% 1.00 -0.07 -0.34 0.09
UMD 0.81% 4.98% 1.00 -0.15 0.13
MSCI 0.26% 4.02% 1.00 -0.07
LABI 0.18% 1.08% 1.00
Panel B: Loadings for equity funds calculated using the 6-Factor model
In-house funds Outsourced funds
Portfolio Alpha VWRF SMB HML UMD MSCI LABI Alpha VWRF SMB HML UMD MSCI LABI
1(small) 0.03% 0.98 0.20 0.09 -0.01 -0.01 -0.14 0.02% 0.97 0.17 0.12 -0.04 0.02 -0.20
2 -0.01% 0.98 0.23 0.14 0.01 0.00 -0.12 -0.09% 1.02 0.17 0.12 -0.02 -0.02 -0.15
3 -0.08% 1.00 0.23 0.07 0.03 0.00 -0.12 -0.10% 1.01 0.19 0.03 0.03 0.00 -0.07
4 -0.15% 0.99 0.22 0.06 0.04 0.02 -0.11 -0.12% 0.97 0.14 0.04 0.01 0.03 -0.14
5(large) -0.11% 0.98 0.09 0.01 0.02 0.02 -0.09 -0.11% 0.99 0.07 0.02 0.00 0.02 -0.10
Panel C: Loadings for non-equity funds calculated using the 6-Factor model
In-house funds Outsourced funds
Portfolio Alpha VWRF SMB HML UMD MSCI LABI Alpha VWRF SMB HML UMD MSCI LABI
1(small) 0.07% 0.64 0.17 0.09 -0.05 0.20 0.06 -0.03% 0.63 0.16 0.04 -0.06 0.19 0.07
2 -0.02% 0.57 0.17 0.10 -0.02 0.19 0.16 -0.08% 0.59 0.14 0.10 0.00 0.18 0.15
3 -0.05% 0.55 0.14 0.04 0.02 0.20 0.20 -0.05% 0.56 0.09 0.06 0.03 0.22 0.16
4 -0.02% 0.57 0.14 0.05 0.04 0.18 0.18 -0.07% 0.61 0.13 0.04 0.04 0.23 0.18
5(large) -0.05% 0.61 0.13 0.00 0.04 0.18 0.15 0.02% 0.53 0.08 0.09 -0.01 0.30 0.17

9
Supplement Table III: Robustness to Fund-Level Factor Loadings
This table shows the Fama-MacBeth (1973) estimates of monthly fund returns regressed on fund
characteristics lagged one month. Fund returns are calculated before (gross) deducting fees and expenses.
Index funds are excluded. These returns are adjusted using the market model, the CAPM, the 4-Factor
model, and the 6-Factor model, where factor-loadings are based on past 60-months of returns for each
fund estimated separately. The dependent variable is FUNDRET. OUTSOURCED is an indicator
variable that equals one if the fund management is outsourced. LOGTNA is the natural logarithm of TNA.
LOGFAMFUNDS is the natural logarithm of the number of funds in the fund family. LOGFAMSIZE is
the natural logarithm of one plus the size of the family that the fund belongs to excluding the asset of the
fund itself. EXPRATIO is the total annual management fees and expenses divided by TNA. TURNOVER
is fund turnover and AGE is the number of years since the organization of the mutual fund. TOTLOAD is
the total front-end, deferred and rear-end charges as a percentage of new investments. FLOW is the
percentage new fund flow into the mutual fund over the past one year. PRET is the cumulative risk-
adjusted fund return over the past twelve months. Intercepts have been suppressed. The sample is from
January 1999 to December 2007 (108 months), is comprised of all funds, and consists of 140,052 fund-
month observations. Time-series averages of monthly regression R-squareds are reported in the last row.
The t-statistics are adjusted for serial correlation using Newey-West (1987) lags of order three and are
shown in parentheses.
Gross fund returns (monthly %)
Market-Adj Beta-Adj 4-Factor 6-Factor
OUTSOURCEDi,t-1 -0.061 -0.068 -0.048 -0.054
(-2.81) (-3.53) (-2.70) (-2.98)
LOGTNAi,t-1 -0.023 -0.028 -0.011 -0.005
(-1.21) (-2.11) (-1.14) (-0.55)
LOGFAMFUNDSi,t-1 0.000 0.000 0.000 0.000
(-0.92) (-0.98) (0.71) (0.81)
LOGFAMSIZEi,t-1 0.016 0.014 0.012 0.014
(2.37) (2.07) (2.27) (2.57)
EXPRATIOi,t-1 0.113 0.047 0.016 0.069
(1.18) (0.66) (0.25) (1.21)
TURNOVERi,t-1 0.000 0.000 0.000 0.000
(0.08) (-0.39) (-1.61) (-1.29)
AGEi,t-1 -0.003 -0.003 -0.001 -0.002
(-2.69) (-2.96) (-2.00) (-3.02)
TOTALLOADi,t-1 -0.001 0.003 0.004 0.001
(-0.25) (0.65) (1.00) (0.21)
FLOWi,t-1 -0.114 -0.040 -0.019 -0.022
(-1.96) (-0.77) (-0.52) (-0.64)
PRETi,t-1 0.033 0.032 0.020 0.017
(3.37) (3.71) (4.12) (3.96)
R-squared 0.220 0.178 0.113 0.098

10
Supplement Table IV: Complete Outsourcing and Fund Performance
This table shows the Fama-MacBeth (1973) estimates of monthly fund returns regressed on fund
characteristics lagged one month. Index funds are excluded. Fund returns are calculated before (gross)
deducting fees and expenses. These returns are adjusted using the market model, the CAPM, the 4-Factor
model, and the 6-Factor model. The dependent variable is FUNDRET. COMPLETELY_OUTSOURCED
is an indicator variable that equals one if the fund management is completely outsourced. LOGTNA
is the natural logarithm of TNA. LOGFAMFUNDS is the natural logarithm of the number of funds in the
fund family. LOGFAMSIZE is the natural logarithm of one plus the size of the family that the fund
belongs to excluding the asset of the fund itself. EXPRATIO is the total annual management fees and
expenses divided by TNA. TURNOVER is fund turnover and AGE is the number of years since the
organization of the mutual fund. TOTLOAD is the total front-end, deferred and rear-end charges as a
percentage of new investments. FLOW is the percentage new fund flow into the mutual fund over the past
one year. PRET is the cumulative risk-adjusted fund return over the past twelve months. Intercepts have
been suppressed. The sample is from January 1994 to December 2007 (168 months), is comprised of all
funds, and consists of 452,904 fund-month observations. Time-series averages of monthly regression R-
squareds are reported in the last row. The t-statistics are adjusted for serial correlation using Newey-West
(1987) lags of order three and are shown in parentheses.
Gross fund returns (monthly %)
Market-Adj Beta-Adj 4-Factor 6-Factor
COMPLETELY_
OUTSOURCEDi,t-1
-0.072 -0.083 -0.072 -0.065
(-3.56) (-4.57) (-3.91) (-3.53)
LOGTNAi,t-1 -0.036 -0.040 -0.044 -0.047
(-1.83) (-2.33) (-2.74) (-2.86)
LOGFAMFUNDSi,t-1 -0.017 -0.021 -0.022 -0.025
(-0.65) (-0.81) (-0.85) (-0.98)
LOGFAMSIZEi,t-1 0.019 0.024 0.025 0.028
(1.31) (1.71) (1.75) (1.99)
EXPRATIOi,t-1 -0.028 -0.021 -0.020 -0.010
(-0.26) (-0.19) (-0.18) (-0.09)
TURNOVERi,t-1 0.000 0.000 0.000 0.000
(0.91) (0.87) (0.84) (0.83)
AGEi,t-1 0.000 0.000 0.000 0.000
(-0.04) (-0.49) (-0.14) (-0.25)
TOTALLOADi,t-1 -0.005 -0.004 -0.004 -0.004
(-0.75) (-0.54) (-0.56) (-0.57)
FLOWi,t-1 0.000 0.000 0.000 0.000
(-1.91) (-2.21) (-2.26) (-2.29)
PRETi,t-1 0.022 0.022 0.023 0.023
(3.02) (3.08) (3.12) (3.13)
R-squared 0.175 0.178 0.177 0.177
11
Supplement Table V: Second Stage of 2SRI—The Effect of Outsourcing on Fund
Performance
This table shows the second stage of the 2SRI estimation of the effect of outsourcing on mutual fund performance.
Fund returns are calculated before (gross) deducting fees and expenses. These returns are adjusted using the market
model, the CAPM, the 4-Factor model, and the 6-Factor model. The dependent variable is FUNDRET.
OUTSOURCED is an indicator variable that equals one if the fund management is outsourced. The other independent
variables include LOGTNA, LOGFAMFUNDS, LOGFAMSIZE, EXPRATIO, TURNOVER, AGE, TOTLOAD,
FLOW and PRET. FIRST STAGE RESIDUAL is the residual from the first stage logit regression of the 2SRI
estimation Percentile dummies of FAMSIZE AT INCEPTION (the size of the family that the fund belongs
to when the fund was created) are included in the specification; a complete set of Month × Year dummies is
also included. The sample is from January 1994 to December 2007 (168 months), is comprised of all funds
(index funds are excluded), and consists of 452,904 fund-month observations. t-statistics are adjusted by
allowing for the errors to be correlated across funds within fund families, i.e. the standard errors are clustered by
fund families and by fund advisor.
Gross fund returns
Market-Adj Beta-Adj 4-Factor 6-Factor
OUTSOURCEDi,t-1 -0.161 -0.193 -0.170 -0.188
(-2.45) (-2.92) (-2.51) (-2.74) LOGTNAi,t-1 -0.039 -0.045 -0.043 -0.045
(-7.19) (-7.60) (-8.14) (-8.22) LOGFAMFUNDSi,t-1 0.042 0.038 0.039 0.033
(2.86) (2.58) (2.65) (2.18) LOGFAMSIZEi,t-1 0.006 0.011 0.012 0.019
(0.93) (1.74) (1.76) (3.01) EXPRATIOi,t-1 0.002 0.012 0.013 0.026
(0.13) (0.69) (0.73) (1.52) TURNOVERi,t-1 -0.000 -0.000 -0.000 -0.000
(-1.37) (-1.34) (-1.57) (-1.60) AGEi,t-1 -0.002 -0.002 -0.002 -0.002
(-1.39) (-1.84) (-1.50) (-1.87) TOTLOADi,t-1 -0.008 -0.008 -0.008 -0.008
(-2.68) (-2.45) (-2.71) (-2.43) FLOWi,t-1 -0.038 -0.042 -0.042 -0.044
(-7.23) (-7.77) (-7.60) (-8.04) PRETi,t-1 0.019 0.020 0.020 0.020
(2.92) (3.03) (3.09) (3.07) FIRST STAGE RESIDUALi,t-1 0.141 0.158 0.147 0.162
(2.25) (2.43) (2.31) (2.51)

12
Supplement Table VI: Expense Ratios/Flows and Outsourcing
This table shows the Fama-MacBeth (1973) estimates of expense ratios and flows regressed on
outsourcing. Index funds are excluded. The dependent variable is EXPRATIO or FLOW.
OUTSOURCED is an indicator variable that equals one if the fund management is outsourced. LOGTNA
is the natural logarithm of TNA. LOGFAMFUNDS is the natural logarithm of the number of funds in the
fund family. LOGFAMSIZE is the natural logarithm of one plus the size of the family that the fund
belongs to excluding the asset of the fund itself. EXPRATIO is the total annual management fees and
expenses divided by TNA. TURNOVER is fund turnover and AGE is the number of years since the
organization of the mutual fund. TOTLOAD is the total front-end, deferred and rear-end charges as a
percentage of new investments. FLOW is the percentage new fund flow into the mutual fund over the past
one year. PRET is the cumulative (buy-hold) fund return over the past twelve months. Intercepts have been
suppressed. The sample is from January 1994 to December 2007 (168 months), is comprised of all funds,
and consists of 452,904 fund-month observations. Time-series averages of monthly regression R-squareds
are reported in the last row. The t-statistics are adjusted for serial correlation using Newey-West (1987)
lags of order three and are shown in parentheses.
EXPRATIOi,t-1 FLOWi,t-1
OUTSOURCEDi,t-1 -0.043 -1.636
(-4.27) (-1.16)
LOGTNAi,t-1 -0.077 -5.497
(-41.83) (-6.94)
LOGFAMFUNDSi,t-1 0.039 -6.295
(6.61) (-6.23)
LOGFAMSIZEi,t-1 -0.044 3.980
(-30.71) (7.47)
EXPRATIOi,t-1 -0.698
(-0.22)
TURNOVERi,t-1 0.001 0.030
(13.30) (2.38)
AGEi,t-1 -0.004 -1.708
(-11.23) (-23.02)
TOTALLOADi,t-1 0.076 1.613
(60.34) (5.31)
FLOWi,t-1 0.000
(0.33)
PRETi,t-1 0.000 2.948
(-0.35) (13.56)
R-squared 0.331 0.126

13
Supplement Table III-I: Outsourcing and Fund Performance
This table shows the Fama-MacBeth (1973) estimates of monthly fund returns regressed on fund
characteristics lagged one month. Fund returns are calculated after (net) deducting fees and expenses.
These returns are adjusted using the market model, the CAPM, the 4-Factor model, and the 6-Factor model.
The dependent variable is FUNDRET. OUTSOURCED is an indicator variable that equals one if the fund
management is outsourced. LOGTNA is the natural logarithm of TNA. LOGFAMFUNDS is the natural
logarithm of the number of funds in the fund family. LOGFAMSIZE is the natural logarithm of one plus
the size of the family that the fund belongs to excluding the asset of the fund itself. EXPRATIO is the total
annual management fees and expenses divided by TNA. TURNOVER is fund turnover, and AGE is the
number of years since the organization of the mutual fund. TOTLOAD is the total front-end, deferred and
rear-end charges as a percentage of new investments. FLOW is the percentage new fund flow into the
mutual fund over the past one year. PRET is the cumulative (buy-hold) fund return over the past twelve
months. Intercepts have been suppressed. The sample is from January 1994 to December 2007 (168
months), is comprised of all funds (index funds are excluded), and consists of 452,904 fund-month
observations. Time-series averages of monthly regression R-squareds are reported in the last row. The t-
statistics are adjusted for serial correlation using Newey-West (1987) lags of order three and are shown in
parentheses.
Net fund returns (monthly %)
Market-Adj Beta-Adj 4-Factor 6-Factor
OUTSOURCEDi,t-1 -0.053 -0.062 -0.051 -0.046
(-3.35) (-4.41) (-3.55) (-3.36)
LOGTNAi,t-1 -0.023 -0.027 -0.032 -0.033
(-1.39) (-1.87) (-2.32) (-2.40)
LOGFAMFUNDSi,t-1 -0.021 -0.023 -0.024 -0.027
(-0.98) (-1.11) (-1.16) (-1.30)
LOGFAMSIZEi,t-1 0.022 0.026 0.027 0.029
(1.89) (2.26) (2.31) (2.56)
EXPRATIOi,t-1 -0.038 -0.036 -0.034 -0.026
(-0.41) (-0.39) (-0.37) (-0.28)
TURNOVERi,t-1 0.000 0.000 0.000 0.000
(0.80) (0.79) (0.76) (0.74)
AGEi,t-1 0.000 0.000 0.000 0.000
(0.10) (-0.26) (0.08) (-0.02)
TOTALLOADi,t-1 -0.006 -0.004 -0.004 -0.004
(-0.94) (-0.74) (-0.76) (-0.76)
FLOWi,t-1 0.000 0.000 0.000 0.000
(-2.07) (-2.48) (-2.49) (-2.51)
PRETi,t-1 0.024 0.026 0.026 0.026
(3.94) (4.13) (4.15) (4.15)
R-squared 0.174 0.180 0.179 0.178

14
Supplement Table III-II: Outsourcing and Fund Performance
This table shows the Fama-MacBeth (1973) estimates of monthly fund returns regressed on fund
characteristics lagged one month. Fund returns are calculated before (gross) deducting fees and expenses.
These returns are adjusted using the market model, the CAPM, the 4-Factor model, and the 6-Factor
model, where loadings are calculated using gross fund return (rather than net fund returns). The
dependent variable is FUNDRET. OUTSOURCED is an indicator variable that equals one if the fund
management is outsourced. LOGTNA is the natural logarithm of TNA. LOGFAMFUNDS is the natural
logarithm of the number of funds in the fund family. LOGFAMSIZE is the natural logarithm of one plus
the size of the family that the fund belongs to excluding the asset of the fund itself. EXPRATIO is the total
annual management fees and expenses divided by TNA. TURNOVER is fund turnover, and AGE is the
number of years since the organization of the mutual fund. TOTLOAD is the total front-end, deferred and
rear-end charges as a percentage of new investments. FLOW is the percentage new fund flow into the
mutual fund over the past one year. PRET is the cumulative (buy-hold) fund return over the past twelve
months. Intercepts have been suppressed. The sample is from January 1994 to December 2007 (168
months), is comprised of all funds (index funds are excluded), and consists of 452,904 fund-month
observations. Time-series averages of monthly regression R-squareds are reported in the last row. The t-
statistics are adjusted for serial correlation using Newey-West (1987) lags of order three and are shown in
parentheses.
Gross fund returns (monthly %)
Market-Adj Beta-Adj 4-Factor 6-Factor
OUTSOURCEDi,t-1 -0.052 -0.062 -0.051 -0.046
(-3.34) (-4.39) (-3.57) (-3.38)
LOGTNAi,t-1 -0.023 -0.027 -0.032 -0.033
(-1.39) (-1.89) (-2.36) (-2.44)
LOGFAMFUNDSi,t-1 -0.021 -0.024 -0.024 -0.027
(-0.99) (-1.12) (-1.18) (-1.31)
LOGFAMSIZEi,t-1 0.022 0.026 0.027 0.029
(1.91) (2.28) (2.34) (2.58)
EXPRATIOi,t-1 0.043 0.046 0.047 0.055
(0.46) (0.50) (0.51) (0.60)
TURNOVERi,t-1 0.000 0.000 0.000 0.000
(0.80) (0.79) (0.76) (0.74)
AGEi,t-1 0.000 0.000 0.000 0.000
(0.06) (-0.29) (0.05) (-0.05)
TOTALLOADi,t-1 -0.006 -0.004 -0.004 -0.004
(-0.92) (-0.73) (-0.74) (-0.75)
FLOWi,t-1 0.000 0.000 0.000 0.000
(-2.07) (-2.49) (-2.49) (-2.51)
PRETi,t-1 0.024 0.026 0.026 0.026
(3.94) (4.14) (4.15) (4.15)
R-squared 0.174 0.180 0.179 0.179
15
Supplement Table III-III: Outsourcing and Fund Performance
This table shows the Fama-MacBeth (1973) estimates of monthly fund returns regressed on fund
characteristics lagged one month. Fund returns are calculated before (gross) deducting fees and expenses.
These returns are adjusted using the market model, the CAPM, the 4-Factor model, and the 6-Factor
model, where loadings are calculated within each investment style portfolios (rather than equity
versus non-equity). The dependent variable is FUNDRET. OUTSOURCED is an indicator variable that
equals one if the fund management is outsourced. LOGTNA is the natural logarithm of TNA.
LOGFAMFUNDS is the natural logarithm of the number of funds in the fund family. LOGFAMSIZE is
the natural logarithm of one plus the size of the family that the fund belongs to excluding the asset of the
fund itself. EXPRATIO is the total annual management fees and expenses divided by TNA. TURNOVER
is fund turnover, and AGE is the number of years since the organization of the mutual fund. TOTLOAD is
the total front-end, deferred and rear-end charges as a percentage of new investments. FLOW is the
percentage new fund flow into the mutual fund over the past one year. PRET is the cumulative (buy-hold)
fund return over the past twelve months. Intercepts have been suppressed. The sample is from January 1994
to December 2007 (168 months), is comprised of all funds (index fundes are excluded), and consists of
452,904 fund-month observations. Time-series averages of monthly regression R-squareds are reported in
the last row. The t-statistics are adjusted for serial correlation using Newey-West (1987) lags of order three
and are shown in parentheses.
Gross fund returns (monthly %)
Market-Adj Beta-Adj 4-Factor 6-Factor
OUTSOURCEDi,t-1 -0.052 -0.057 -0.039 -0.037
(-3.33) (-4.05) (-2.80) (-2.90)
LOGTNAi,t-1 -0.023 -0.030 -0.030 -0.027
(-1.39) (-2.24) (-2.53) (-2.40)
LOGFAMFUNDSi,t-1 -0.021 -0.024 -0.019 -0.033
(-0.99) (-1.22) (-1.05) (-2.04)
LOGFAMSIZEi,t-1 0.022 0.024 0.020 0.029
(1.91) (2.13) (1.97) (3.41)
EXPRATIOi,t-1 0.043 0.014 0.009 0.059
(0.46) (0.18) (0.13) (1.00)
TURNOVERi,t-1 0.000 0.000 0.000 0.000
(0.79) (0.99) (0.94) (0.59)
AGEi,t-1 0.000 0.000 0.001 0.000
(0.06) (0.15) (0.93) (0.15)
TOTALLOADi,t-1 -0.006 -0.002 -0.001 -0.004
(-0.92) (-0.48) (-0.31) (-1.03)
FLOWi,t-1 0.000 0.000 0.000 0.000
(-2.07) (-2.49) (-2.33) (-2.27)
PRETi,t-1 0.024 0.026 0.025 0.024
(3.94) (4.39) (4.35) (4.06)
R-squared 0.174 0.164 0.154 0.149

16
Supplement Table III-IV: Outsourcing and Fund Performance
This table shows the Fama-MacBeth (1973) estimates of monthly fund returns regressed on fund
characteristics lagged one month. Fund returns are calculated before (gross) deducting fees and expenses.
These returns are adjusted using the market model, the CAPM, the 4-Factor model, and the 6-Factor
model, where loadings are calculated from past return quintile portfolios (rather than size quintile
portfolios). The dependent variable is FUNDRET. OUTSOURCED is an indicator variable that equals
one if the fund management is outsourced. LOGTNA is the natural logarithm of TNA. LOGFAMFUNDS
is the natural logarithm of the number of funds in the fund family. LOGFAMSIZE is the natural logarithm
of one plus the size of the family that the fund belongs to excluding the asset of the fund itself. EXPRATIO
is the total annual management fees and expenses divided by TNA. TURNOVER is fund turnover and
AGE is the number of years since the organization of the mutual fund. TOTLOAD is the total front-end,
deferred and rear-end charges as a percentage of new investments. FLOW is the percentage new fund flow
into the mutual fund over the past one year. PRET is the cumulative (buy-hold) fund return over the past
twelve months. Intercepts have been suppressed. The sample is from January 1994 to December 2007 (168
months), is comprised of all funds (index funds are excluded), and consists of 452,904 fund-month
observations. Time-series averages of monthly regression R-squareds are reported in the last row. The t-
statistics are adjusted for serial correlation using Newey-West (1987) lags of order three and are shown in
parentheses.
Gross fund returns (monthly %)
Market-Adj Beta-Adj 4-Factor 6-Factor
OUTSOURCEDi,t-1 -0.050 -0.054 -0.050 -0.047
(-3.19) (-3.80) (-3.62) (-3.43)
LOGTNAi,t-1 -0.017 -0.019 -0.034 -0.034
(-0.97) (-1.25) (-2.34) (-2.37)
LOGFAMFUNDSi,t-1 -0.020 -0.025 -0.022 -0.024
(-0.91) (-1.16) (-1.05) (-1.16)
LOGFAMSIZEi,t-1 0.021 0.025 0.026 0.028
(1.74) (2.12) (2.20) (2.46)
EXPRATIOi,t-1 0.039 0.040 0.025 0.035
(0.41) (0.43) (0.29) (0.41)
TURNOVERi,t-1 0.000 0.000 0.000 0.000
(0.78) (0.80) (0.55) (0.53)
AGEi,t-1 0.000 0.000 0.000 0.000
(0.50) (0.36) (-0.20) (-0.35)
TOTALLOADi,t-1 -0.005 -0.003 -0.003 -0.002
(-0.77) (-0.51) (-0.47) (-0.44)
FLOWi,t-1 0.000 0.000 0.000 0.000
(-2.75) (-3.16) (-2.38) (-2.51)
PRETi,t-1 0.023 0.025 0.015 0.014
(3.88) (4.23) (3.79) (3.69)
R-squared 0.170 0.173 0.105 0.102
17
Supplement Table III-V: Outsourcing and Fund Performance
This table shows the Fama-MacBeth (1973) estimates of monthly fund returns regressed on fund
characteristics lagged one month. Fund returns are calculated before (gross) deducting fees and expenses.
These returns are adjusted using the market model, the CAPM, the 4-Factor model, and the 6-Factor model.
The dependent variable is FUNDRET. OUTSOURCED is an indicator variable that equals one if the fund
management is outsourced. LOGTNA is the natural logarithm of TNA. LOGFAMFUNDS is the natural
logarithm of the number of funds in the fund family. LOGFAMSIZE is the natural logarithm of one plus
the size of the family that the fund belongs to excluding the asset of the fund itself. EXPRATIO is the total
annual management fees and expenses divided by TNA. TURNOVER is fund turnover and AGE is the
number of years since the organization of the mutual fund. TOTLOAD is the total front-end, deferred and
rear-end charges as a percentage of new investments. FLOW is the percentage new fund flow into the
mutual fund over the past one year. PRET is the cumulative (buy-hold) fund return over the past twelve
months. The regressions include style fixed-effects. Intercepts have been suppressed. The sample is from
January 1994 to December 2007 (168 months), is comprised of all funds (index funds are excluded), and
consists of 452,904 fund-month observations. Time-series averages of monthly regression R-squareds are
reported in the last row. The t-statistics are adjusted for serial correlation using Newey-West (1987) lags of
order three and are shown in parentheses.
Gross fund returns (monthly %)
Market-Adj Beta-Adj 4-Factor 6-Factor
OUTSOURCEDi,t-1 -0.053 -0.057 -0.046 -0.042
(-4.35) (-4.76) (-3.82) (-3.56)
LOGTNAi,t-1 -0.019 -0.021 -0.026 -0.027
(-1.44) (-1.61) (-2.03) (-2.12)
LOGFAMFUNDSi,t-1 -0.029 -0.029 -0.030 -0.030
(-1.96) (-1.93) (-2.04) (-2.09)
LOGFAMSIZEi,t-1 0.025 0.025 0.026 0.026
(3.90) (3.89) (4.15) (4.21)
EXPRATIOi,t-1 0.042 0.041 0.042 0.043
(0.77) (0.76) (0.79) (0.80)
TURNOVERi,t-1 0.000 0.000 0.000 0.000
(0.58) (0.58) (0.55) (0.56)
AGEi,t-1 0.000 0.000 0.000 0.000
(0.04) (-0.03) (0.30) (0.37)
TOTALLOADi,t-1 -0.003 -0.003 -0.002 -0.003
(-0.73) (-0.68) (-0.67) (-0.71)
FLOWi,t-1 0.000 0.000 0.000 0.000
(-2.38) (-2.50) (-2.52) (-2.54)
PRETi,t-1 0.023 0.024 0.024 0.024
(4.01) (4.05) (4.03) (4.07)
Style Fixed Effect? Yes Yes Yes Yes
R-squared 0.329 0.316 0.313 0.306

18
Supplement Table III-VI: Outsourcing and Fund Performance
This table shows the Fama-MacBeth (1973) estimates of monthly fund returns regressed on fund
characteristics lagged one month. Fund returns are calculated before (gross) deducting fees and expenses.
These returns are adjusted using the market model, the CAPM, the 4-Factor model, and the 6-Factor model.
The dependent variable is FUNDRET. OUTSOURCED is an indicator variable that equals one if the fund
management is outsourced. LOGTNA is the natural logarithm of TNA. LOGFAMFUNDS is the natural
logarithm of the number of funds in the fund family. LOGFAMSIZE is the natural logarithm of one plus
the size of the family that the fund belongs to. EXPRATIO is the total annual management fees and
expenses divided by TNA. TURNOVER is fund turnover and AGE is the number of years since the
organization of the mutual fund. TOTLOAD is the total front-end, deferred and rear-end charges as a
percentage of new investments. FLOW is the percentage new fund flow into the mutual fund over the past
one year. PRET is the cumulative (buy-hold) fund return over the past twelve months. Intercepts have been
suppressed. The sample is from January 1994 to December 2007 (168 months) and is comprised of all
funds except international and sector funds (index funds are excluded). Time-series average of monthly
regression r-squared is reported in the last row. The t-statistics are adjusted for serial correlation using
Newey-West (1987) lags of order three and are shown in parentheses.
Gross fund returns (monthly %)
Market-Adj Beta-Adj 4-Factor 6-Factor
OUTSOURCEDi,t-1 -0.041 -0.048 -0.033 -0.027
(-2.35) (-3.35) (-2.21) (-1.85)
LOGTNAi,t-1 -0.018 -0.023 -0.025 -0.027
(-1.20) (-1.91) (-1.91) (-2.01)
LOGFAMFUNDSi,t-1 -0.036 -0.038 -0.038 -0.040
(-1.68) (-1.92) (-1.99) (-2.09)
LOGFAMSIZEi,t-1 0.026 0.029 0.029 0.030
(3.39) (3.89) (4.05) (4.18)
EXPRATIOi,t-1 0.076 0.055 0.057 0.062
(0.88) (0.73) (0.77) (0.83)
TURNOVERi,t-1 0.000 0.000 0.000 0.000
(0.17) (0.34) (0.25) (0.31)
AGEi,t-1 0.000 -0.001 0.000 0.000
(-0.58) (-0.87) (-0.55) (-0.61)
TOTALLOADi,t-1 -0.008 -0.005 -0.005 -0.005
(-1.26) (-0.99) (-1.00) (-0.98)
FLOWi,t-1 0.000 0.000 0.000 0.000
(-1.52) (-1.77) (-1.81) (-1.93)
PRETi,t-1 0.020 0.020 0.021 0.021
(2.96) (3.05) (3.12) (3.20)
R-squared 0.185 0.175 0.174 0.175

19
Supplement Table III-VII: Outsourcing and Fund Performance
This table shows the Fama-MacBeth (1973) estimates of monthly fund returns regressed on fund
characteristics lagged one month. Fund returns are calculated before (gross) deducting fees and expenses.
These returns are adjusted using the market model, the CAPM, the 4-Factor model, and the 6-Factor model.
The dependent variable is FUNDRET. OUTSOURCED is an indicator variable that equals one if the fund
management is outsourced. LOGTNA is the natural logarithm of TNA. LOGFAMFUNDS is the natural
logarithm of the number of funds in the fund family. LOGFAMSIZE is the natural logarithm of one plus
the size of the family that the fund belongs to. EXPRATIO_12B1 is the total annual management fees
and expenses divided by TNA, minus the 12-B1 fees. 12B1 is the actual 12-B1 fees as a percentage of
TNA. TURNOVER is fund turnover, and AGE is the number of years since the organization of the mutual
fund. TOTLOAD is the total front-end, deferred and rear-end charges as a percentage of new investments.
FLOW is the percentage new fund flow into the mutual fund over the past one year. PRET is the
cumulative (buy-hold) fund return over the past twelve months. Intercepts have been suppressed. The
sample is from January 1994 to December 2007 (168 months) and is comprised of all funds (index funds
are excluded). Time-series average of monthly regression r-squared is reported in the last row. The t-
statistics are adjusted for serial correlation using Newey-West (1987) lags of order three and are shown in
parentheses.
Gross fund returns (monthly %)
Market-Adj Beta-Adj 4-Factor 6-Factor
OUTSOURCEDi,t-1 -0.056 -0.066 -0.054 -0.049
(-3.61) (-4.76) (-3.82) (-3.65)
LOGTNAi,t-1 -0.025 -0.029 -0.034 -0.036
(-1.44) (-1.89) (-2.25) (-2.31)
LOGFAMFUNDSi,t-1 -0.022 -0.024 -0.025 -0.028
(-0.96) (-1.08) (-1.13) (-1.26)
LOGFAMSIZEi,t-1 0.023 0.027 0.028 0.030
(1.82) (2.14) (2.18) (2.42)
EXPRATIO_12B1i,t-1 0.029 0.033 0.034 0.044
(0.23) (0.26) (0.27) (0.34)
12B1i,t-1 1.685 1.921 1.925 1.427
(0.14) (0.16) (0.16) (0.12)
TURNOVERi,t-1 0.000 0.000 0.000 0.000
(0.80) (0.79) (0.76) (0.74)
AGEi,t-1 0.000 0.000 0.000 0.000
(0.14) (-0.18) (0.13) (0.03)
TOTLOADi,t-1 -0.002 -0.001 -0.001 -0.001
(-0.73) (-0.40) (-0.42) (-0.37)
FLOWi,t-1 0.000 0.000 0.000 0.000
(-1.91) (-2.33) (-2.35) (-2.36)
PRETi,t-1 0.024 0.026 0.026 0.026
(3.96) (4.16) (4.17) (4.17)
R-squared 0.182 0.188 0.187 0.187

20
Supplement Table III-VIII: Outsourcing and Fund Performance
This table shows the Fama-MacBeth (1973) estimates of monthly fund returns regressed on fund
characteristics lagged one month. Fund returns are calculated before (gross) deducting fees and expenses.
These returns are adjusted using the market model, the CAPM, the 4-Factor model, and the 6-Factor model.
The dependent variable is FUNDRET. OUTSOURCED is an indicator variable that equals one if the fund
management is outsourced. LOGTNA is the natural logarithm of TNA. LOGFAMFUNDS is the natural
logarithm of the number of funds in the fund family. LOGFAMSIZE is the natural logarithm of one plus
the size of the family that the fund belongs to. EXPRATIO is the total annual management fees and
expenses divided by TNA. TURNOVER is fund turnover, and AGE is the number of years since the
organization of the mutual fund. FRONTLOAD and REARLOAD are the total front-end charges and
rear-end charges as percentages of new investments. FLOW is the percentage new fund flow into the
mutual fund over the past one year. PRET is the cumulative (buy-hold) fund return over the past twelve
months. Intercepts have been suppressed. The sample is from January 1994 to December 2007 (168
months) and is comprised of all funds. Time-series average of monthly regression r-squared is reported in
the last row. The t-statistics are adjusted for serial correlation using Newey-West (1987) lags of order three
and are shown in parentheses.
Gross fund returns (monthly %)
Market-Adj Beta-Adj 4-Factor 6-Factor
OUTSOURCEDi,t-1 -0.051 -0.061 -0.050 -0.045
(-3.31) (-4.47) (-3.52) (-3.36)
LOGTNAi,t-1 -0.023 -0.027 -0.032 -0.033
(-1.39) (-1.86) (-2.28) (-2.36)
LOGFAMFUNDSi,t-1 -0.016 -0.019 -0.019 -0.022
(-0.85) (-1.03) (-1.06) (-1.21)
LOGFAMSIZEi,t-1 0.021 0.025 0.026 0.028
(1.85) (2.30) (2.37) (2.64)
EXPRATIOi,t-1 0.038 0.043 0.045 0.053
(0.41) (0.46) (0.49) (0.58)
TURNOVERi,t-1 0.000 0.000 0.000 0.000
(0.77) (0.75) (0.72) (0.70)
AGEi,t-1 0.000 0.000 0.000 0.000
(-0.08) (-0.36) (-0.04) (-0.13)
FRONTLOADi,t-1 -0.387 -0.421 -0.407 -0.400
(-0.93) (-1.00) (-0.97) (-0.97)
REARLOADi,t-1 -0.023 0.109 0.027 -0.003
(-0.05) (0.23) (0.06) (-0.01)
FLOWi,t-1 0.000 0.000 0.000 0.000
(-2.10) (-2.50) (-2.51) (-2.53)
PRETi,t-1 0.024 0.026 0.026 0.026
(3.92) (4.12) (4.13) (4.13)
R-squared 0.175 0.181 0.181 0.180
21
Supplement Table III-IX: Outsourcing and Fund Performance
This table shows the Fama-MacBeth (1973) estimates of monthly fund returns regressed on fund
characteristics lagged one month. Fund returns are calculated before (gross) deducting fees and expenses.
These returns are adjusted using the market model, the CAPM, the 4-Factor model, and the 6-Factor model.
The dependent variable is FUNDRET. OUTSOURCED is an indicator variable that equals one if the fund
management is outsourced. LOGTNA is the natural logarithm of TNA. LOGFAMFUNDS is the natural
logarithm of the number of funds in the fund family. LOGFAMSIZE is the natural logarithm of one plus
the size of the family that the fund belongs to excluding the asset of the fund itself. LOGADVSIZE is the
natural logarithm of one plus the size of the advisor that the fund belongs to excluding the asset of
the fund itself. EXPRATIO is the total annual management fees and expenses divided by TNA.
TURNOVER is fund turnover and AGE is the number of years since the organization of the mutual fund.
TOTLOAD is the total front-end, deferred and rear-end charges as a percentage of new investments.
FLOW is the percentage new fund flow into the mutual fund over the past one year. PRET is the
cumulative (buy-hold) fund return over the past twelve months. Intercepts have been suppressed. The
sample is from January 1994 to December 2007 (168 months), is comprised of all funds (index funds are
excluded), and consists of 452,904 fund-month observations. Time-series averages of monthly regression
R-squareds are reported in the last row. The t-statistics are adjusted for serial correlation using Newey-
West (1987) lags of order three and are shown in parentheses.
Gross fund returns (monthly %)
Market-Adj Beta-Adj 4-Factor 6-Factor
OUTSOURCEDi,t-1 -0.055 -0.063 -0.051 -0.046
(-3.50) (-4.51) (-3.56) (-3.32)
LOGTNAi,t-1 -0.022 -0.026 -0.031 -0.033
(-1.39) (-1.88) (-2.33) (-2.41)
LOGFAMFUNDSi,t-1 -0.022 -0.023 -0.024 -0.026
(-0.99) (-1.08) (-1.13) (-1.26)
LOGFAMSIZEi,t-1 0.024 0.027 0.028 0.030
(1.83) (2.05) (2.12) (2.31)
LOGADVSIZEi,t-1 -0.002 -0.001 -0.001 -0.001
(-0.63) (-0.32) (-0.34) (-0.19)
EXPRATIOi,t-1 0.043 0.045 0.047 0.055
(0.46) (0.50) (0.51) (0.60)
TURNOVERi,t-1 0.000 0.000 0.000 0.000
(0.81) (0.79) (0.76) (0.74)
AGEi,t-1 0.000 0.000 0.000 0.000
(0.07) (-0.29) (0.04) (-0.06)
TOTALLOADi,t-1 -0.006 -0.004 -0.004 -0.004
(-0.92) (-0.73) (-0.75) (-0.76)
FLOWi,t-1 0.000 0.000 0.000 0.000
(-2.08) (-2.50) (-2.51) (-2.53)
PRETi,t-1 0.024 0.026 0.026 0.026
(3.95) (4.14) (4.15) (4.15)
R-squared 0.175 0.181 0.180 0.180

22
Supplement Table III-X: Outsourcing and Fund Performance
This table shows the Fama-MacBeth (1973) estimates of monthly fund returns regressed on fund
characteristics lagged one month. Fund returns are calculated before (gross) deducting fees and expenses.
These returns are adjusted using the market model, the CAPM, the 4-Factor model, and the 6-Factor model.
The dependent variable is FUNDRET. OUTSOURCED is an indicator variable that equals one if the fund
management is outsourced. LOGTNA is the natural logarithm of TNA. LOGFAMFUNDS is the natural
logarithm of the number of funds in the fund family. LOGFAMSIZE is the natural logarithm of one plus
the size of the family that the fund belongs to excluding the asset of the fund itself. LOGADVSIZE is the
natural logarithm of one plus the size of the advisor that the fund belongs to excluding the asset of
the fund itself. EXPRATIO is the total annual management fees and expenses divided by TNA.
TURNOVER is fund turnover, and AGE is the number of years since the organization of the mutual fund.
TOTLOAD is the total front-end, deferred and rear-end charges as a percentage of new investments.
FLOW is the percentage new fund flow into the mutual fund over the past one year. PRET is the
cumulative (buy-hold) fund return over the past twelve months. Intercepts have been suppressed. The
sample is from January 1994 to December 2007 (168 months), is comprised of all funds (index funds are
excluded), and consists of 452,904 fund-month observations.. Time-series averages of monthly regression
R-squareds are reported in the last row. The t-statistics are adjusted for serial correlation using Newey-
West (1987) lags of order three and are shown in parentheses.
Gross fund returns (monthly %)
Market-Adj Beta-Adj 4-Factor 6-Factor
OUTSOURCEDi,t-1 -0.046 -0.053 -0.041 -0.035
(-2.88) (-3.84) (-2.97) (-2.60)
LOGTNAi,t-1 -0.024 -0.028 -0.033 -0.035
(-1.48) (-1.98) (-2.46) (-2.55)
LOGFAMFUNDSi,t-1 -0.031 -0.033 -0.035 -0.038
(-1.33) (-1.49) (-1.59) (-1.74)
LOGFAMSIZEi,t-1 0.021 0.024 0.024 0.025
(1.56) (1.79) (1.82) (2.00)
LOGADVSIZEi,t-1 -0.015 -0.014 -0.015 -0.016
(-2.30) (-2.26) (-2.55) (-2.62)
LOGFAMSIZE i,t-1
LOGADVSIZE i,t-1
0.002 0.002 0.002 0.002
(2.08) (2.34) (2.65) (2.83)
EXPRATIOi,t-1 0.040 0.043 0.044 0.052
(0.43) (0.47) (0.48) (0.57)
TURNOVERi,t-1 0.000 0.000 0.000 0.000
(0.80) (0.78) (0.75) (0.73)
AGEi,t-1 0.000 0.000 0.000 0.000
(-0.07) (-0.41) (-0.10) (-0.20)
TOTALLOADi,t-1 -0.005 -0.004 -0.004 -0.004
(-0.92) (-0.74) (-0.76) (-0.77)
FLOWi,t-1 0.000 0.000 0.000 0.000
(-2.11) (-2.53) (-2.54) (-2.56)
PRETi,t-1 0.024 0.026 0.026 0.026
(3.95) (4.14) (4.16) (4.15)
R-squared 0.176 0.182 0.181 0.181

23
Supplement Table III-XI: Outsourcing and Fund Performance
This table shows the Fama-MacBeth (1973) estimates of monthly fund returns regressed on fund
characteristics lagged one month. Fund returns are calculated before (gross) deducting fees and expenses.
These returns are adjusted using the market model, the CAPM, the 4-Factor model, and the 6-Factor model.
The dependent variable is FUNDRET. OUTSOURCED is an indicator variable that equals one if the fund
management is outsourced. LOGTNA is the natural logarithm of TNA. LOGFAMFUNDS is the natural
logarithm of the number of funds in the fund family. LOGFAMSIZE is the natural logarithm of one plus
the size of the family that the fund belongs to excluding the asset of the fund itself. D_LOGADVSIZE is
decile ranking of the size of the advisor that the fund belongs to. EXPRATIO is the total annual
management fees and expenses divided by TNA. TURNOVER is fund turnover, and AGE is the number of
years since the organization of the mutual fund. TOTLOAD is the total front-end, deferred and rear-end
charges as a percentage of new investments. FLOW is the percentage new fund flow into the mutual fund
over the past one year. PRET is the cumulative (buy-hold) fund return over the past twelve months.
Intercepts have been suppressed. The sample is from January 1994 to December 2007 (168 months), is
comprised of all funds (index funds are excluded), and consists of 452,904 fund-month observations. Time-
series averages of monthly regression R-squareds are reported in the last row. The t-statistics are adjusted
for serial correlation using Newey-West (1987) lags of order three and are shown in parentheses.
Gross fund returns (monthly %)
Market-Adj Beta-Adj 4-Factor 6-Factor
OUTSOURCEDi,t-1 -0.050 -0.058 -0.046 -0.040
(-3.29) (-4.23) (-3.35) (-3.02)
LOGTNAi,t-1 -0.022 -0.027 -0.032 -0.033
(-1.37) (-1.89) (-2.31) (-2.41)
LOGFAMFUNDSi,t-1 -0.025 -0.026 -0.027 -0.030
(-1.14) (-1.23) (-1.34) (-1.47)
LOGFAMSIZEi,t-1 0.018 0.021 0.021 0.022
(1.19) (1.39) (1.40) (1.49)
D_LOGADVSIZEi,t-1 -0.008 -0.006 -0.009 -0.009
(-1.19) (-1.01) (-1.42) (-1.46)
LOGFAMSIZE i,t-1
D_LOGADVSIZE i,t-1
0.001 0.001 0.001 0.001
(0.93) (0.95) (1.21) (1.36)
EXPRATIOi,t-1 0.042 0.045 0.046 0.054
(0.45) (0.49) (0.50) (0.58)
TURNOVERi,t-1 0.000 0.000 0.000 0.000
(0.80) (0.79) (0.76) (0.74)
AGEi,t-1 0.000 0.000 0.000 0.000
(-0.00) (-0.35) (-0.04) (-0.15)
TOTALLOADi,t-1 -0.006 -0.004 -0.004 -0.004
(-0.94) (-0.75) (-0.76) (-0.77)
FLOWi,t-1 0.000 0.000 0.000 0.000
(-2.06) (-2.48) (-2.49) (-2.51)
PRETi,t-1 0.024 0.026 0.026 0.026
(3.95) (4.15) (4.16) (4.16)
R-squared 0.176 0.182 0.181 0.181

24
Supplement Table III-XII: Outsourcing and Fund Performance
This table shows the Fama-MacBeth (1973) estimates of monthly fund returns regressed on fund
characteristics lagged one month. Fund returns are calculated before (gross) deducting fees and expenses.
These returns are adjusted using the market model, the CAPM, the 4-Factor model, and the 6-Factor model.
The dependent variable is FUNDRET. OUTSOURCED is an indicator variable that equals one if the fund
management is outsourced. LOGTNA is the natural logarithm of TNA. LOGFAMFUNDS is the natural
logarithm of the number of funds in the fund family. LOGFAMSIZE is the natural logarithm of one plus
the size of the family that the fund belongs to excluding the asset of the fund itself. LOGADVFUNDS is
the natural logarithm of number of funds managed by the advisor. EXPRATIO is the total annual
management fees and expenses divided by TNA. TURNOVER is fund turnover, and AGE is the number of
years since the organization of the mutual fund. TOTLOAD is the total front-end, deferred and rear-end
charges as a percentage of new investments. FLOW is the percentage new fund flow into the mutual fund
over the past one year. PRET is the cumulative (buy-hold) fund return over the past twelve months.
Intercepts have been suppressed. The sample is from January 1994 to December 2007 (168 months), is
comprised of all funds(index funds are excluded), and consists of 452,904 fund-month observations. Time-
series averages of monthly regression R-squareds are reported in the last row. The t-statistics are adjusted
for serial correlation using Newey-West (1987) lags of order three and are shown in parentheses.
Gross fund returns (monthly %)
Market-Adj Beta-Adj 4-Factor 6-Factor
OUTSOURCEDi,t-1 -0.051 -0.059 -0.047 -0.041
(-3.24) (-4.27) (-3.24) (-3.00)
LOGTNAi,t-1 -0.023 -0.027 -0.032 -0.033
(-1.41) (-1.90) (-2.35) (-2.43)
LOGFAMFUNDSi,t-1 -0.021 -0.024 -0.025 -0.028
(-1.00) (-1.19) (-1.26) (-1.42)
LOGFAMSIZEi,t-1 0.022 0.026 0.026 0.028
(1.80) (2.13) (2.18) (2.42)
LOGADVFUNDSi,t-1 0.001 0.004 0.004 0.005
(0.13) (0.34) (0.42) (0.51)
EXPRATIOi,t-1 0.043 0.046 0.047 0.055
(0.46) (0.50) (0.51) (0.60)
TURNOVERi,t-1 0.000 0.000 0.000 0.000
(0.79) (0.78) (0.75) (0.73)
AGEi,t-1 0.000 0.000 0.000 0.000
(0.06) (-0.30) (0.03) (-0.07)
TOTALLOADi,t-1 -0.006 -0.004 -0.004 -0.004
(-0.94) (-0.75) (-0.77) (-0.77)
FLOWi,t-1 0.000 0.000 0.000 0.000
(-2.08) (-2.49) (-2.50) (-2.52)
PRETi,t-1 0.024 0.026 0.026 0.026
(3.95) (4.14) (4.16) (4.16)
R-squared 0.175 0.181 0.180 0.180
25
Supplement Table III-XIII: Outsourcing and Fund Performance
This table shows the Fama-MacBeth (1973) estimates of monthly fund returns regressed on fund
characteristics lagged one month. Fund returns are calculated before (gross) deducting fees and expenses.
These returns are adjusted using the market model, the CAPM, the 4-Factor model, and the 6-Factor model.
The dependent variable is FUNDRET. OUTSOURCED is an indicator variable that equals one if the fund
management is outsourced. LOGTNA is the natural logarithm of TNA. LOGFAMFUNDS is the natural
logarithm of the number of funds in the fund family. LOGFAMSIZE is the natural logarithm of one plus
the size of the family that the fund belongs to excluding the asset of the fund itself. EXPRATIO is the total
annual management fees and expenses divided by TNA. TURNOVER is fund turnover, and AGE is the
number of years since the organization of the mutual fund. TOTLOAD is the total front-end, deferred and
rear-end charges as a percentage of new investments. FLOW is the percentage new fund flow into the
mutual fund over the past one year. PRET is the cumulative (buy-hold) fund return over the past twelve
months. TENURE is the number of years since the date current manager took control. Intercepts have
been suppressed. The sample is from January 1994 to December 2007 (168 months), is comprised of all
funds(index funds are excluded). Time-series averages of monthly regression R-squareds are reported in
the last row. The t-statistics are adjusted for serial correlation using Newey-West (1987) lags of order three
and are shown in parentheses.
Gross fund returns (monthly %)
Market-Adj Beta-Adj 4-Factor 6-Factor
OUTSOURCEDi,t-1 -0.058 -0.067 -0.056 -0.052
(-3.51) (-4.16) (-3.65) (-3.53)
LOGTNAi,t-1 -0.025 -0.030 -0.035 -0.036
(-1.50) (-2.01) (-2.45) (-2.51)
LOGFAMFUNDSi,t-1 -0.023 -0.026 -0.025 -0.027
(-1.12) (-1.28) (-1.27) (-1.36)
LOGFAMSIZEi,t-1 0.025 0.030 0.030 0.032
(2.25) (2.61) (2.61) (2.84)
EXPRATIOi,t-1 0.050 0.052 0.054 0.062
(0.54) (0.58) (0.60) (0.69)
TURNOVERi,t-1 0.000 0.000 0.000 0.000
(0.96) (0.96) (0.93) (0.91)
AGEi,t-1 -0.001 -0.001 -0.001 -0.001
(-0.91) (-1.25) (-0.97) (-1.07)
TOTALLOADi,t-1 -0.004 -0.003 -0.003 -0.003
(-0.67) (-0.49) (-0.50) (-0.52)
FLOWi,t-1 0.000 0.000 0.000 0.000
(-1.96) (-2.31) (-2.34) (-2.35)
PRETi,t-1 0.025 0.026 0.026 0.026
(3.99) (4.17) (4.18) (4.17)
TENUREi,t-1 0.003 0.004 0.004 0.004
(1.24) (1.41) (1.53) (1.51)
R-squared 0.176 0.181 0.180 0.180

26
Supplement Table III-XIV: Outsourcing and Fund Performance
This table shows the pooled OLS estimates of monthly fund returns regressed on fund characteristics
lagged one month. Fund returns are calculated before (gross) deducting fees and expenses. These returns
are adjusted using the market model, the CAPM, the 4-Factor model, and the 6-Factor model. The
dependent variable is FUNDRET. OUTSOURCED is an indicator variable that equals one if the fund
management is outsourced. The other independent variables include LOGTNA, LOGFAMFUNDS,
LOGFAMSIZE, EXPRATIO, TURNOVER, AGE, TOTLOAD, FLOW and PRET. The regressions
include year-month fixed-effects. Intercepts have been suppressed. The sample is from January 1994 to
December 2007 (168 months), is comprised of all funds(index funds are excluded). t-statistics are adjusted
by allowing for the errors to be correlated across funds within fund families, i.e. the standard errors are
clustered by fund families
Gross fund returns (monthly %)
Market-Adj Beta-Adj 4-Factor 6-Factor
OUTSOURCEDi,t-1 -0.051 -0.046 -0.032 -0.027
(-2.41) (-2.41) (-1.90) (-1.64)
LOGTNAi,t-1 -0.054 -0.042 -0.054 -0.057
(-2.03) (-1.77) (-2.20) (-2.19)
LOGFAMFUNDSi,t-1 0.019 0.022 0.021 0.017
(0.94) (1.10) (1.05) (0.87)
LOGFAMSIZEi,t-1 0.014 0.013 0.013 0.016
(1.13) (0.97) (1.01) (1.30)
EXPRATIOi,t-1 0.087 0.087 0.088 0.095
(0.47) (0.47) (0.48) (0.52)
TURNOVERi,t-1 0.000 0.000 0.000 0.000
(0.06) (0.05) (0.03) (0.03)
AGEi,t-1 0.000 0.000 0.000 0.001
(0.23) (0.25) (0.53) (0.54)
TOTALLOADi,t-1 -0.011 -0.011 -0.012 -0.012
(-1.48) (-1.46) (-1.54) (-1.54)
FLOWi,t-1 -0.058 -0.057 -0.056 -0.057
(-3.47) (-3.45) (-3.40) (-3.34)
PRETi,t-1 0.021 0.021 0.021 0.021
(1.38) (1.40) (1.40) (1.39)
R-squared 0.070 0.041 0.040 0.033

27
Supplement Table VIII-I:
Fund Closures and Deviations in Fund Risk-Taking from the Norm
This table investigates the determinants of mutual fund closures and reports pooled panel regression estimates of
whether a mutual fund is closed on fund characteristics lagged one year. The dependent variable, STYLEENDS, is
an indicator function that equals one if the only mutual fund in the family for that style is closed during that
year. The dependent variable, CLOSED, is an indicator function that equals one if the mutual fund is closed during that
year. OUTSOURCED is an indicator variable that equals one if the fund management is outsourced.
INMODALSTYLE is an indicator that equals one if the fund is in its family’s modal style. The other independent
variables include LOGTNA, LOGFAMFUNDS, LOGFAMSIZE, TURNOVER, EXPRATIO, TOTLOAD, FLOW and
PRET LOW. NUMBERINSTYLE is the number of mutual funds in the same style as the fund in the fund family.
ONLYLFUNDINSTYLE is an indicator variable that equals one if the fund is the only fund in that style in the
fund family. All regressions include year-effects and investment style effects. The sample is from January 1994 to
December 2006, is comprised of all funds, and consists of 27,760 fund-year observations. t-statistics are adjusted by
allowing for the errors to be correlated across funds within fund families, i.e. the standard errors are clustered by fund
families. The unconditional probability of style ending is 0.75%. The unconditional probability of closure is 4.01%
per year.
STYLEENDS CLOSEDi,t CLOSEDi,t
OUTSOURCEDi,t-1
-0.014 0.019 0.033
(-0.11) [-0.024]
(0.26) [0.169]
(0.45) [0.296]
PRET LOW i,t-1
0.204 0.290 0.287
(2.41) [0.347]
(6.77) [2.596]
(6.74) [2.586]
PRET LOW i,t-1
OUTSOURCED i,t-1
0.217 0.157 0.157
(1.49) [0.478]
{1.38}
(2.29) [1.971]
{2.51}
(2.29) [2.057]
{2.58}
INMODALSTYLE i,t-1
-0.677 0.035 -0.049
(-8.10)
[-1.153]
(0.71)
[0.313]
(-1.00)
[-0.437]
LOGTNA i,t-1
-0.152 -0.220 -0.214
(-7.24) [-0.259]
(-16.29) [-1.969]
(-15.19) [-1.922]
LOGFAMFUNDS i,t-1
-0.426 0.227 0.102
(-8.56)
[-0.726]
(4.93)
[2.034]
(1.50)
[0.914]
LOGFAMSIZE i,t-1
-0.051 -0.071 0.001
(-0.60)
[-0.087]
(-0.95)
[-0.637]
(0.02)
[0.013]
EXPRATIO i,t-1 -0.012 -0.021 -0.020 (-0.66)
[-0.021]
(-1.19)
[-0.185]
(-1.21)
[-0.184]
TURNOVER i,t-1 0.001 0.001 0.001 (0.12)
[0.000]
(0.08)
[0.006]
(0.08)
[0.007]
AGE i,t-1
0.000 0.002 0.001
(0.10) [0.000]
(0.93 [0.014]
(0.78) [0.013]
TOTLOAD i,t-1
0.012 0.014 0.017
(0.76) [0.020]
(1.18) [0.125]
(1.39) [0.152]
FLOW i,t-1
-0.192 -0.001 -0.001
(-1.34)
[-0.326]
(-0.98)
[-0.013]
(-0.98)
[-0.013]
NUMBERINSTYLE i,t-1
-0.018
(-2.78)
[-0.164]
ONLYFUNDINSTYLE i,t-1
-0.038
(-0.52)
[-0.343]
Pseudo R-squared 0.218 0.115 0.110

28
Supplement Table IX-I:
Outsourcing and Deviations in Fund Risk-Taking from the Norm
This table reports pooled panel regression estimates of annual regressions of how outsourcing affects the
risk-taking of mutual funds. The dependent variable of the first specification, RISKDEV, is either the beta-
deviation measure or the idiosyncratic risk measure. The independent variables are OUTSOURCED,
TENURE, INMODALSTYLE, LOGTNA, LOGFAMFUNDS, LOGFAMSIZE, TURNOVER, AGE,
EXPRATIO, TOTLOAD, FLOW and PRET. TENURE is the number of years since the date current
manager took control. All regressions include year-effects and investment style effects. The sample is
from 1994 to 2007 and is comprised of all funds. t-statistics are adjusted by allowing for the errors to be
correlated across funds within fund families, i.e. the standard errors are clustered by fund families.
RISKDEVi,t
Beta Deviation Idio-Risk Deviation
OUTSOURCEDi,t-1 -0.070 -0.069
(-2.55) (-2.94)
TENURE i,t-1 0.003 0.002
(1.58) (1.20)
INMODALSTYLE i,t-1 0.048 0.016
(2.63) (0.90)
LOGTNA i,t-1 -0.030 -0.021
(-4.04) (-2.64)
LOGFAMFUNDS i,t-1 -0.010 -0.024
(-0.39) (-1.04)
LOGFAMSIZE i,t-1 -0.007 -0.004
(-0.68) (-0.42)
EXPRATIO i,t-1 0.181 0.176
(3.89) (3.26)
TURNOVER i,t-1 0.000 0.000
(4.04) (3.44)
AGE i,t-1 0.002 0.001
(1.96) (1.88)
TOTLOAD i,t-1 -0.015 -0.005
(-2.87) (-0.92)
FLOW i,t-1 0.000 0.000
(0.27) (0.11)
PRET i,t-1 0.006 0.002
(7.29) (3.19)
Pseudo R-squared 0.354 0.380

29
1 This method, however, is imperfect because investment advisory names may sometimes be missing. We
are able to reduce the number of unidentified funds by using an investment advisory firm code that
Thomson provides in addition to the name of the sub-advisor. For instance, Vanguard is given a code of
VANG. We supplement our identification scheme by using this code.
2 The SEC makes available the most recently available Form ADV to the public via the Internet at
Investment Adviser Public Disclosure (IAPD) website, http://www.adviserinfo.sec.gov/IAPD. We look up
Schedule A of ADV to identify direct ownerships, Schedule B to identify indirect ownerships, and
Schedule C to identify other affiliate relationships. If we cannot find the mutual fund family in IAPD, we
search for the investment advisory firm in IAPD.
3 Del Guercio, Reuter and Tkac (2010) study a sample of subadvisory contracts of domestic equity funds in
2002. They find 18% of funds are subadvised and 38% of families participate in a subadvisory relation. For
another estimate, press release by Elliot Spitzer, which can be downloaded at the site
http://www.oag.state.ny.us/press/2004/jan/jan06b_04.html, suggests that “less than 20%” of funds are
subadvised.