Supplemental Phase II Environmental Site Assessment Report
153
Supplemental Phase II Environmental Site Assessment Report Omega Drive Brownfields Project Brattleboro, Vt. 05301 by New England EnviroStrategies, Inc. Concord, New Hampshire for Windham Regional Commission 139 Main Street, Suite 505 Brattleboro, VT 05301 File No. 09011E04 March 19, 2010
Transcript of Supplemental Phase II Environmental Site Assessment Report

Supplemental Phase II Environmental Site Assessment Report
Omega Drive Brownfields Project Brattleboro, Vt. 05301
by
New England EnviroStrategies, Inc. Concord, New Hampshire
for
Windham Regional Commission 139 Main Street, Suite 505
Brattleboro, VT 05301
File No. 09011E04
March 19, 2010

One Tremont Street 2nd Floor
Concord NH 03301
March 19, 2010 File No. 09011E04 Windham Regional Commission 139 Main Street, Suite 505 Brattleboro, Vermont 05301 Attention: Ms. Susan McMahon Subject: Supplemental Phase II Environmental Site Assessment Omega Drive Brownfields Project Brattleboro, Vermont
Dear Ms McMahon: This Phase II Environmental Site Assessment (ESA) report covers work conducted by New England EnviroStrategies, Inc (NE2S) at Lots 2 and 3 of the Omega Drive site (site) in Brattleboro, Vermont in response to Recognized Environmental Conditions (RECs) identified in the Phase I ESA dated November 13, 2009. This document is issued as a supplement to the Phase II report issued on February 17, 2010 Please do not hesitate to contact us at 603.856.8815 if you have any questions about our site observations or this report. Thank you for your business and we appreciate being of service to you in this assignment. Sincerely, New England EnviroStrategies, Inc. Muriel S. Robinette President
1

2
EXECUTIVE SUMMARY Several Recognized Environmental Conditions (RECs) had been identified at the Omega Drive site in a November 2009 Phase I ESA. A previous Phase II dealt specifically with REC4 and had identified an area on Lot 2 that had elevated lead in soil and in groundwater that will require proper measures for risk control as development moves forward. This Supplemental Phase II concentrated on additional work to further investigate REC4 as well as RECs 1, 2 and 3 and the two historical RECs (HRECs). REC1 dealt with concerns pertaining to stained soil and soil pile areas in Lot 3. REC2 focused on stored drummed waste and apparently empty totes, also on Lot 3. REC3 dealt with auto parts debris and miscellaneous solid waste on Lots 2 and 3. The HRECs dealt with previously remediated areas. These included a large, historic auto salvage operation that encompassed subject Lots 2 and 3, as well as a portion (reportedly over 30 acres) of the upgradient area of the 130+ acre Delta Business Campus along with multiple areas on Lot 2 where contaminated soils (a result of the former auto salvage operations), were removed. This Supplemental Phase II ESA included advancement of soil borings (geoprobes), installation of seven monitoring wells, field screening for lead and arsenic in soils using x-ray fluorescence (XRF) and laboratory testing of environmental samples (soil, ground and surface water) for selected parameters to further evaluate the RECs. Arsenic concentrations were found throughout the area and are likely attributable to background conditions rather than from releases to the environment. Lead was found in most samples, but at levels lower than Industrial and Residential RSLs. Sampling of both ground and surface water found only minimal levels of volatile organic compounds in one well. Metals concentrations in ground and surface water were either nondetectable or below regulatory standards. Based on the work conducted to date, NE2S recommends that the site can proceed to brownfields redevelopment without any environmental risk. A Soil and Materials Management Plan (SMMP) should be developed for the site which describes how any soil, disturbed for offsite disposal, will be screened and tested for known site contaminants. In addition, the SMMP will address intersected contaminated groundwater in the localized area of petroleum contamination at MW-2. To confirm the anticipated VOC concentrations during dewatering, NE2S recommends an additional round of ground water samples be taken from MW-1, - 2, -3 and -4 before they are destroyed in construction. All other well should be properly decommissioned, as long term testing is not necessary for this site.

3
TABLE OF CONTENTS Page EXECUTIVE SUMMARY 2 LIST OF TABLES 4 LIST OF FIGURES 4 1. INTRODUCTION 5
1.1 Purpose 5 1.2 General Scope of Work 6
2. BACKGROUND INFORMATION 7 2.1. Site Setting 7 2.2. Site History, Previous Environmental Investigations and Remediation 7
3. FIELD EXPLORATION 9 3.1. Soil Borings 9 3.2. Soil Sampling 9 3.3. Groundwater Sampling 10 3.4. Surface Water Sampling 11
4. DATA RESULTS AND EVALUATION 12 4.1 Soil Sampling 12 4.2 Groundwater Sampling 12 4.3 Data QA/QC Evaluation 13
5. CONCLUSIONS AND RECOMMENDATIONS 14 6. LIMITATIONS 15 REFERENCES 16 FIGURES APPENDIX A – Resumes of Qualified Staff APPENDIX B – Field Notes and XRF Information APPENDIX C – Laboratory Data Sheets APPENDIX D – Tier II Data Validation Results

LIST OF TABLES Table No. Title 1 Tabulated Sampling and Analysis Plan 2 Soil Boring and Monitoring Well Information 3 Groundwater Elevation Data 4 Soil Analytical Results: Metals 5 Soil Analytical Results: Organics 6 Ground and Surface Water Analytical Results LIST OF FIGURES Figure No. Title 1 Site Locus and Site Plan 2 Lead Concentrations in Soil (XRF Data) 3 Groundwater Contour
4

5
1. INTRODUCTION 1.1 Purpose
This Supplemental Phase II Environmental Site Assessment (ESA) for the Omega Drive site (site) in Brattleboro, VT (Figure 1) was designed by New England EnviroStrategies, Inc. (NE2S) to assist the Windham Regional Commission (WRC) and its client Commonwealth Dairy in the redevelopment of property in the Delta Business Campus. It is understood that the property developers may have the site entered into Vermont’s Brownfields Reuse and Environmental Liability Limitation Act (BRELLA) program. For projects that proceed through cleanup, the BRELLA program offers a release protecting the developer from environmental liability for newly discovered contamination or changes in regulations. The BRELLA release is transferable to successor property owners. The subject property covers approximately six (6) acres along Omega Drive, and is comprised of two lots (Lots 2 and 3) (Figure 1). It is part of the 130+ acre Delta Business Campus property located in Brattleboro, VT. Lots 2 and 3 are the proposed location of an industrial building. An historic auto salvage operation encompassed subject Lots 2 and 3, as well as a portion (reportedly over 30 acres) of the upgradient area of the Delta Business Campus. Results from a November 2009 Phase I ESA prepared by NE2S indicate that historical contamination may currently be present on site. The sources are from an automobile salvaging operation that took place on Lots 2 and 3 beginning sometime between 1960 and 1985, and ending in the mid to late 1990s. In 1997 the lots were identified by the state of Vermont’s Agency of Natural Resources (VTANR) Department of Environmental Conservation’s (DEC’s) Sites Management Section (SMS) for investigation. A 1999 Phase II report by Stevens & Associates describes site activities as soil excavation, temporary soil staging next to the excavation area, installation of 3 monitoring wells, removal of free phase product from wetlands and Bob’s Brook area, surface water, groundwater and soil sampling and analysis, and the later removal of staged soils to a permanent stockpiling area. Groundwater monitored in the three wells (since removed) across the site did not detect Volatile Organic Compound (VOC) contamination. Soils from four locations around the auto salvage yard, including and predominantly from an oil-stained concrete slab that held engine blocks (now Lot 2), had been excavated, tested for Total Petroleum Hydrocarbon (TPHs), and stockpiled. The stockpile was covered and eventually deemed remediated, the soil spread thinly in a central area of the site, and the site closed by the SMS. The SMS had required analysis for TPHs. The extent of the excavation and associated confirmatory testing was incomplete, leaving a possibility of residual contamination that could impact foundation construction of the planned facility or pose an environmental liability to the future owner. A 2009 geotechnical investigation report by Terracon, Inc. for a potential purchaser of the property describes soils underlying both lots as glacial till with some areas of shallow fill. The site is underlain by very dense glacial till over bedrock varying in depth to greater than 37 ft below grade. Depth to groundwater observed during drilling varied from 3 ft to 17 ft in borings where groundwater was encountered. A wetland is mapped in the center of the property and slopes to the south toward a streambed containing numerous tires and a wet marshy area. NE2S identified four RECs during the November 2009 Phase I ESA:

6
REC1 – Stained soil and soil pile areas – Several small areas of stained soil were observed on Lot 3. The stained areas are small (generally less than 6 square feet in area) and appeared to represent relatively shallow impacted soil. Onsite soil piles are generally small (each roughly no more than several cubic yards (CY) in volume), appeared old, are sometimes associated with other debris, and are often in the vicinity of shredded polyethylene tarps. REC2 – Uncontrolled drum storage – Stored drummed waste and apparently empty totes were stored on Lot 3. Eight barrels appeared full of solid, unknown material. Lot 3 also had several empty plastic totes, one labeled as containing biodiesel, and another, waste oil. These items have reportedly been removed from the site since the Phase 1 ESA. REC3 – Various areas of debris – Auto parts debris and miscellaneous solid waste were observed on and around both Lots 2 and 3. Types of solid waste observed included waste tires, some within wetlands, empty antifreeze and oil containers, and various pieces of car parts, some still oily. Bins of swabs, waste pallets, empty steel tanks/drums, plastic pails, and piles of crushed rock are all included in this debris category. REC4 –Contaminated soil treatment and disposal operations onsite – Contaminated soil excavated as a result of releases from the former auto salvage operations was reported as temporarily stockpiled near the excavation site and then moved elsewhere on the Delta Campus property for long term storage and remediation. After analytical testing, the soil was reported clean and was disposed of via thin spreading at an unreported location onsite. As part of the redevelopment project, a Phase II ESA was conducted, focusing solely on REC 4 (the area of the proposed building), which almost encompasses the previously-excavated engine block storage area, and the section of Bob’s Brook that reportedly carried free phase oil away from the former engine block storage area. The main finding of the Phase II ESA was probable groundwater impact above Vermont Groundwater Enforcement Standards for arsenic and lead, and limited soil impact by arsenic (borings NE2S-1 and NE2S-3) and lead (boring NE2S-3). 1.2 General Scope of Work For the investigation for the site under the BRELLA program, the following scope and associated QAPP was proposed and approved for this Supplemental Phase II with the objective of specifically addressing RECs 1, 2 and 3 and resolving initial findings related to REC4:
A Geoprobe soil sampling program to investigate residual soil contamination
o five borings were advanced in the area slated for cut on the northern portion of the property
o five borings advanced to a depth of six feet in the area of Phase II ESA soil borings in a star pattern around the previous Phase II boring NE2S-3
o soil samples from each of seven monitoring wells to be installed field screened using an XRF for lead and arsenic
o at least 10% of samples sent to the lab for confirmatory analysis.
A groundwater and surface water quality sampling program with permanent wells, sampling for VOCs, TPH and metals in groundwater and, VOCs and metals in surface water.

7
2. BACKGROUND INFORMATION
2.1. Site Setting The six-acre site is part of a 133-acre Delta Business Campus located in a rural area of Brattleboro, Vermont, south and west of the town center and at the end of Paul’s Road, which is off of Canal Street. Lots 2 and 3 are situated along the southern boundary of the campus, much of which is vacant open fields and woodlands (Figure 1). Lot 2 is a generally flat wet field sloping to the south into a lightly forested area, has a sand and gravel surface and is generally rectangular in shape. The area close to the road is grass field with some disturbed or reworked surface areas. Wetlands are located at the rear of Lot 2. Lot 3 lies on a topographic bench approximately 15 to 20 feet higher than and north of Lot 2. This bench slopes to the south and is accessed via a gravel driveway off of Omega Drive. The bench appears to be part of a naturally occurring geomorphic feature extending back to the north with some minor modifications due to surface grading along its top and placement of additional soils along the face and toe of the slopes. The lot is mostly disturbed, graded and lightly vegetated. The site is underlain by some areas of shallow fill overlying a very dense glacial till above bedrock. The bedrock surface varies in depth to greater than 37 ft below grade. Depth to groundwater is variable, from 3 ft to 17 ft. A wetland is located in the center of the property and slopes to the south toward a streambed containing numerous tires and a wet marshy area. Both wetland areas exhibit large amounts of iron bacteria growth and staining. There are currently no permanent buildings located on either lot. A temporary construction trailer was present on Lot 3 at the time of NE2S’s Phase I field visit. Two abandoned/destroyed monitoring wells were found on Lot 2. Steel 6 inch well casings were found filled with earth materials. PVC well screens and risers were found discarded adjacent to the wells. 2.2. Site History, Previous Environmental Investigations and Remediation NE2S’s Phase I revealed that Lots 2 and 3 are not yet represented on municipal tax maps but are shown as being enclosed by the Delta Business Campus. Prior to about 1960, the site was part of a farm. After 1960 but before 1985 an extensive auto salvage operation encompassed Lots 2 and 3, as well as a portion (reportedly over 30 acres) of the upgradient area of the Delta Business Campus. One consequence of the automobile recycling operation was the presence of oil, gas and diesel fuel contaminated soils that were the target of previous remedial action. The salvage business ran through at least the mid to late 1990s. Environmental activity at the site commenced in the late 1990s. A series of reports, letters, an ESA, and response actions exist for the two lots and the Delta Business Campus as a whole. Investigation and remedial work on Lot 2 was associated with the cleanup of the former salvage operations. Investigation and remedial work on Lot 2 reportedly included debris removal, concrete slab and soil removal, installation of three monitoring wells, limited soil and groundwater testing, and reports to and communications with the Sites Management Section (SMS) VT Agency of Natural Resources (VTANR). The extent of contaminated soil was characterized in the field via visual staining and field screening techniques. Contaminated soils were temporarily stockpiled on polyethylene adjacent to the excavations, and were later moved to another area onsite for long term storage and remediation. Confirmatory soil testing within

8
the excavation was conducted only for gasoline-related components of volatile organic compounds (benzene, toluene, ethyl benzene, and xylenes). After limited analytical testing, the soil was reported clean and was disposed of via thin spreading following Vermont ANR regulatory approval at an undetermined location on the Delta Business Campus property. Based on these reports and correspondence, and in context with the site transaction and redevelopment, a Phase II investigation was needed to investigate the possible presence of TPH-contaminated soil in the former engine block storage area, and to investigate the presence of other contaminants (e.g. VOCs, PCBs, metals) in this area that were not included in previous sampling programs. The results of that work found elevated concentrations of some metals in site soil and groundwater in proximity to the former engine recycling slab. Other constituents were either not detected (e.g., VOCs), had no regulatory standards (e.g., TPH) or were detected at concentrations lower than regulatory limits. The elevated levels required further investigation both of soil and groundwater, leading to the work of this Supplemental Phase II involving additional soil borings, soil sampling for VOCs and metals, additional monitoring wells and surface and groundwater sampling.

9
3. FIELD EXPLORATION 3.1. Soil Borings Data quality objectives for soils were established in an approved Quality Assurance Project Plan (QAPP) and in two approved QAPP addenda to evaluate whether former on-site activities had contaminated soils and groundwater with VOCs, PAHs, PCBs and/or metals. Soil and water were investigated in the vicinity of the formerly excavated engine block storage area, lower section of Bob’s Brook (a reported transport pathway for free phase oil from the former engine block storage area), and in various locations where Recognized Environmental Conditions (RECs) were identified on Lot 3. All borings were located as proposed in the approved QAPP and as shown on Figure 2. Soil boring depths on Lot 3 varied according to anticipated depth of fill and proposed final grade for planned facility. Lot 2 soil borings were drilled to the depths discussed in the Work Plan and summarized on Table 1 and detailed on Table 2. A total of twenty three (23) soil borings (NE2S-10 thru NE2S-23), an additional seven soil borings completed with monitoring wells, and one surface soil sample were completed during the period March 3- 5, 2010 by Technical Drilling Services of Sterling, Massachusetts. Geoprobe (direct push) drilling rigs were used. The aforementioned soil borings included two additional boring locations (NE2S-22 and NE2S-23) that were requested by Vermont Department of Environmental Conservation (ANR) staff and approved by the EPA. NE2S-22 was drilled near surface debris that included a flattened, weathered drum; and NE2S-23 was collected between Omega Drive and the east property line of Lot 2, to investigate a possible, historic upgradient and off-site source of petroleum. The surface soil sample (SS-1) was collected in lieu of a soil boring to investigate a debris area located on a wooded slope that was inaccessible to Geoprobe equipment. Monitoring well depths on Lot 3 were based on depth to water (MW-6, 30 feet) and depth of refusal (MW-7, 23 feet). Monitoring well depths on Lot 2 were chosen relative to water levels. Monitoring wells MW-4 and MW-5 were installed with screens spanning the water table, and the remaining wells were installed with the screens starting about two feet below the interpreted water table, to account for lower water levels at other times of year. Following the advancement of soil borings, wells were constructed with five to fifteen feet of 1.0 inch diameter PVC well screens, and risers were placed in the holes, backfilled with sand to one foot above the screened interval, sealed with one foot of bentonite powder, and backfilled further with sand. Standpipes were placed into the boring and sealed with concrete. Well elevations and soil boring locations were surveyed by SVE Associates of Brattleboro Vermont on March 10, 2010. Boring log information, monitoring well depths and screened intervals are presented on Table 2. Field notes are attached in Appendix B. 3.2. Soil Sampling
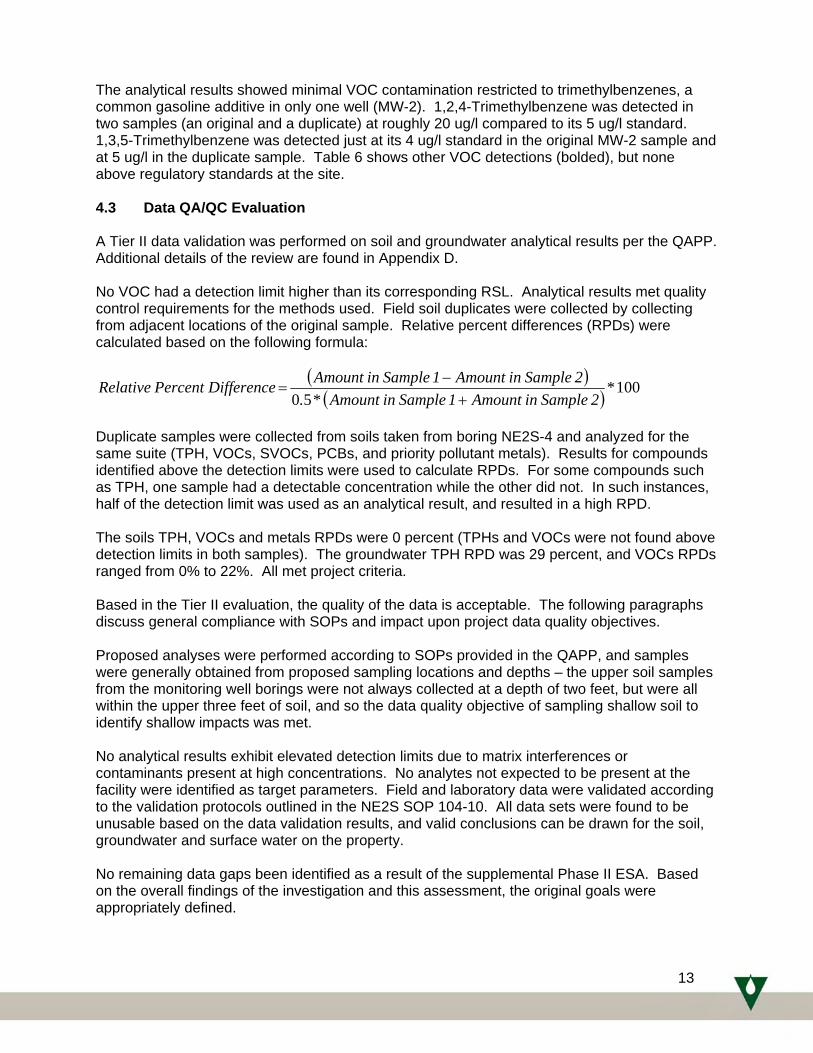
The sampling plan is provided on Table 1. Fifty six soil samples were collected for lead screening by x-ray fluorescence (XRF), using an INNOVEX portable x-ray fluorescence analyzer (XRF). Details pertaining to the XRF methods are presented in Appendix B. Ten percent of samples were submitted to the analytical laboratory for comparison to field screening. Cores were collected from borings in acetate sleeves by the Geoprobe, split and screened by running the PID over the opened core and under a nitrile-gloved hand. At least two samples

10
from each core were also collected into plastic re-sealable bags, and left for at least 10 minutes before screening for VOC’s. VOCs were not detected by PID screening of monitoring wells soils, other than at MW-2, nor were the soils stained other than in the upper six feet at MW-2. Sampling of the soils at MW-2 took place within the upper three feet, and within the saturated screened interval rather than at mid-screen. Borings NE2S-10 thru NE2S-22 were examined for staining and screened with the PID along the length of the recovered core. No staining was observed or PID readings above background were found. Three samples were collected from borings NE2S-10 thru NE2S-15 at depths of three to six inches, two feet and six feet, as practicable, and field screened for lead and arsenic. For borings NE2S-16 thru NE2S-21 samples were collected at a two foot depth and at the anticipated depths of the final grade that may result from proposed cut and fill operations. These borings depths were sampled for VOCs, TPH and XRF field screening. In addition, soil samples were collected from the two locations requested by ANR (NE2S-22 and NE2S-23). Samples collected for XRF screening were bagged in re-sealable, plastic storage bags and homogenized. Gravel was removed from each bag as the sample was mixed to present a fine grained media for XRF screening. Sample bags were labeled with the boring number and depth of sample and delivered to the XRF screening station for analysis. Three soils samples were collected from MW-2, MW-6, and NE2S-21 on March 3 and 4 for laboratory VOC analysis into sample jars, labeled as grab samples, placed in protective bubble wrap and stored in coolers, under ice, for transport to the lab for immediate analysis. The analyses were run to guide and finalize the remaining sampling sites and types in consultation with EPA and ANR prior to NE2S leaving the site on March 5.. The remaining samples were collected on March 4 and 5. Performance evaluation samples were not collected as per the QAPP. After examining and sampling the cores, the remaining core soils were returned to the ground surface in area of their borehole. All bagged samples collected for XRF screening were retained by NE2S for selected laboratory confirmation of the field screening results and potential additional metals analysis as identified.
3.3. Groundwater Sampling Groundwater samples were collected from the seven monitoring wells (MW-1 through MW-7) one week after drilling and installation (March 11 and 12, 2010). Low flow methodology was used to collect water samples using peristaltic pumps and dedicated, 1/4 inch Teflon-lined tubing and dedicated silicon tubing at the pump heads to remove water. The wells were purged via low-flow cells, and samples collected following stabilization of dissolved oxygen, oxidation-reduction potential, temperature, pH, and specific conductance, as required in the NE2S low-flow sampling SOP. Most wells showed stabilized water levels at flow rates of 50 to 65 milliliters per minute with the exception of MW-7 which had just achieved stabilization when it purged dry. The water level in MW-7 was allowed to recover for several hours before samples were collected. Water samples were collected by removing the tubing from the low-flow cell and using the discharge end just beyond the pump to fill laboratory-supplied sample containers. Water sample containers were then labeled, placed in protective bubble wrap and stored in coolers under ice for transport to the lab for analysis.

11
Groundwater samples were analyzed for VOCs, TPH, and total 13 Priority Pollutant Metals (PP Metals). Two dissolved PP Metals samples were collected from MW-2 and MW-3. Duplicate analyses included total metals, VOCs and TPH, which were collected at MW-2, and a duplicate filtered metals sample collected from MW-3. Most duplicate samples were collected at MW-2 because it was the only soil boring completed as a monitoring well that exhibited detectable organic vapors during the field effort. A dissolved metals sample and duplicate were collected at MW-3 because the well is downgradient of the area with quantifiable metals concentrations in the soils, and results from the location may indicate whether off site transport is taking place. The seven groundwater samples and duplicates were submitted to Eastern Analytical Laboratory for chemical analysis on the evening of March 12, 2010. Two groundwater sample locations (MW-2 and MW-3) were adjacent to the brook/drainage way, which reportedly contained free-phase petroleum in the past. Shallow groundwater was expected to be encountered in the near-brook samples. In fact the water table approximately three feet below ground surface on at MW-2 and MW-3. A second sample at MW-4 was taken on March 15, 2010, following receipt of VOC results from the sampling conducted on March 11 and 12. Those results, discussed in more depth below, showed lead concentrations exceeding Vermont standards. However, the first sample displayed excessive turbidity, leading to the possibility that colloidal particles enhanced the total lead concentration. Well MW-4 was first developed and then sampled using low flow methodology. 3.4. Surface Water Sampling Surface water samples were collected from four (4) locations and are shown on Figure 1. Samples were collected for VOCs, 13 priority metals and TPHs. SW-1 is located at the end of the discharge area downgradient of the former engine block storage area. SW-2 is at Bob’s Brook and upgradient from where it leaves the property. SW-4 is approximately 50 feet north of where the unnamed brook along the west side of lot # 3 leaves that property. SW-3 is just south of where that same brook enters lot # 3. All surface waters were free of noticeable turbidity when sampled.

12
4. DATA RESULTS AND EVALUATION 4.1 Soil Sampling Soil samples were analyzed for VOCs by SW 846 Method 8260B, TPHs by SW 846 Method 8100, and priority pollutant metals by SW 846 Method 6020A. Sampling results for soil are presented in Tables 4 and 5. Values for lead estimated using the XRF are posted on Figure 2 with the raw XRF data in Appendix B. Appendix C contains laboratory data sheets. The XRF data showed minimal lead levels throughout the site (Figure 2). The posted data in Figure 2 depicts the arithmetic mean of the highest XRF sample taken at each location (the mean of three XRF readings of each sample). The highest mean value is 189 mg/kg at NE2S-10 at a depth of two feet. This sample, along with three others (NE2S-11, 2 feet; NE2S-13, 3 to 6 feet; NE2S-15, 6 feet), were sent to the laboratory for confirmatory analysis. The lab results from those samples are found in Table 4. Plotting field versus lab data shows an extremely close linear relationship of almost uniform correlation (see graph inset, Figure 2). A regression equation predicting laboratory results from field results shows a coefficient of determination (R2) of over 96%, meaning that virtually all of the variability of the Y values (the lab data) can be explained by the X values (the field data). From a practical perspective, this means that the XRF data obtained in the field can reliably predict the true value as expressed in the laboratory analysis. Based on the regression relationship, none of the XRF results for lead would have exceeded the Residential RSL of 400 mg/kg. Results of VOC sampling showed no exceedences of either Industrial or Residential RSLs in soil. Laboratory analyses of metals showed elevated arsenic concentrations in soil, but these are likely naturally-occurring, background levels and not due to releases to the environment. TPH concentrations were below detection limits. 4.2 Groundwater Sampling
Groundwater samples were analyzed for VOCs by SW 846 Method 8260B, TPHs by SW 846 Method 8100, and priority pollutant metals by EPA Method 200.8. Analytical results for groundwater sampling are provided in Table 6 with laboratory data sheets in Appendix C. Figure 3 shows a contour map developed from measurements of groundwater elevations taken on March 11. Surface water elevations were also used in the contouring, proceeding on the assumption that surface water at this time of year (late winter) likely represents the surface expression of groundwater discharge as baseflow to streams. Groundwater flows southeast at a steep gradient of approximately 0.11, reflective of the significant topographic relief in the area (Figure 3). The Work Plan did not call for obtaining values for hydraulic conductivity during this Supplemental Phase II, but given the silty nature of the till, it is likely to be fairly low. If that is the case, ground water seepage velocities through the site would be low to moderate. Metal concentrations in groundwater were found at slightly above detection limits in all wells except MW-4 for the sample taken on March 11 which contained concentrations of lead, chromium and nickel. However, MW-4 may have been incompletely developed by the driller at the time of sampling, so that the elevated levels of metals were likely due to colloidal suspension and mobilization. A second sample taken March 16 after more rigorous development of the well (pumping and agitated until clear) showed no detections of metals with low flow techniques (Table 6).
13
The analytical results showed minimal VOC contamination restricted to trimethylbenzenes, a common gasoline additive in only one well (MW-2). 1,2,4-Trimethylbenzene was detected in two samples (an original and a duplicate) at roughly 20 ug/l compared to its 5 ug/l standard. 1,3,5-Trimethylbenzene was detected just at its 4 ug/l standard in the original MW-2 sample and at 5 ug/l in the duplicate sample. Table 6 shows other VOC detections (bolded), but none above regulatory standards at the site. 4.3 Data QA/QC Evaluation A Tier II data validation was performed on soil and groundwater analytical results per the QAPP. Additional details of the review are found in Appendix D. No VOC had a detection limit higher than its corresponding RSL. Analytical results met quality control requirements for the methods used. Field soil duplicates were collected by collecting from adjacent locations of the original sample. Relative percent differences (RPDs) were calculated based on the following formula:
( )( ) 100
50*
2 Samplein Amount 1 Samplein Amount*.2 Samplein Amount 1 Samplein Amount Difference Percent Relative
+−
=
Duplicate samples were collected from soils taken from boring NE2S-4 and analyzed for the same suite (TPH, VOCs, SVOCs, PCBs, and priority pollutant metals). Results for compounds identified above the detection limits were used to calculate RPDs. For some compounds such as TPH, one sample had a detectable concentration while the other did not. In such instances, half of the detection limit was used as an analytical result, and resulted in a high RPD. The soils TPH, VOCs and metals RPDs were 0 percent (TPHs and VOCs were not found above detection limits in both samples). The groundwater TPH RPD was 29 percent, and VOCs RPDs ranged from 0% to 22%. All met project criteria. Based in the Tier II evaluation, the quality of the data is acceptable. The following paragraphs discuss general compliance with SOPs and impact upon project data quality objectives. Proposed analyses were performed according to SOPs provided in the QAPP, and samples were generally obtained from proposed sampling locations and depths – the upper soil samples from the monitoring well borings were not always collected at a depth of two feet, but were all within the upper three feet of soil, and so the data quality objective of sampling shallow soil to identify shallow impacts was met. No analytical results exhibit elevated detection limits due to matrix interferences or contaminants present at high concentrations. No analytes not expected to be present at the facility were identified as target parameters. Field and laboratory data were validated according to the validation protocols outlined in the NE2S SOP 104-10. All data sets were found to be unusable based on the data validation results, and valid conclusions can be drawn for the soil, groundwater and surface water on the property. No remaining data gaps been identified as a result of the supplemental Phase II ESA. Based on the overall findings of the investigation and this assessment, the original goals were appropriately defined.

14
5. CONCLUSIONS AND RECOMMENDATIONS We have performed a Supplemental Phase II Environmental Site Assessment in conformance with the scope and limitations of ASTM Practice E1903-97 (2002) of a portion of Lots 2 and 3, Omega Drive, Brattleboro, Vermont, the property. Any exceptions to, or deletions from, this practice are described in Section 5 of this report. This assessment has revealed no evidence of recognized environmental conditions in connection with the property except for the following:
REC1 and REC2 required additional soil sampling on Lots 2 and 3, concentrating on stained areas and onsite soil piles. Soil sampling conducted during this Supplemental Phase II shows no areas of contamination above Residential or Industrial RSL other than for arsenic, a metal commonly found in this area and likely representing background concentrations. No VOCs were detected above Residential or Industrial RSLs. TPH values were minimal.
REC3 consists of various areas of debris which are issues of solid waste. Such material
can simply be picked up and removed to an appropriate solid waste landfill without the need for sampling. The solid waste needs to be disposed in an appropriate facility with documentation of that disposal.
REC4 was investigated in the earlier Phase II and again in this Supplemental Phase II,
with both soil and groundwater sampling. The previous Phase II showed exceedences of lead in soil at NE2S-3 and in groundwater (NE2S-3, -6 and -7). This area will need proper measures for risk control. Further investigation in the Supplemental Phase II indicates this to be a localized phenomenon and not one of large areal extent. Wells MW-3 and MW-4, installed downgradient of this area, had no detections above standards. Similarly, the surface water sample from SW-2 had no detections above standards.
Historic REC1 and 2 have been remediated previously. Based on the ground and
surface water sampling for VOCs, TPH and metals, it appears unlikely that contamination is migrating onsite from upgradient locations or migrating offsite to the south.
NE2S recommends that the site can proceed to redevelopment without experiencing risks to human health or the environment. We recommend an additional round of ground water samples be taken from MW-1, -2, -3, and -4 before the wells are likely destroyed during the construction so that groundwater concentrations are confirmed for construction dewatering considerations. The remaining monitoring wells should be properly decommissioned as long-term groundwater monitoring is not required at this site. A Soils and Material Management Plan (SMMP) should be developed for the site which provides construction specifications for the following:
confirmatory testing for removal of any soil from the site; and,
proper handling/discharge of contaminated groundwater which may be encountered during construction dewatering.

15
6. LIMITATIONS This report has been prepared for the use of Windham Regional Commission and Commonwealth Dairy LLC and its counsel in connection with the proposed Commonwealth Diary yogurt manufacturing facility, Lots 2 and 3 Omega Drive in Brattleboro, VT. The conclusions provided by New England EnviroStrategies, Inc. are based solely on the scope of work conducted and the sources of information referenced in our report. The findings submitted in this report are based in part upon data collected by others and are thus contingent upon their validity. These data have been reviewed and interpretations have been made in the text and figures of this report. Any additional information that becomes available concerning this site should be provided to New England EnviroStrategies, Inc. so that our conclusions may be reviewed and modified, as necessary. The work performed by New England EnviroStrategies, Inc. is subject to the terms and conditions stated in our contract with Windham Regional Commission dated 29 October 2009 and Contract Amendment 1 (December 10, 2009) and Contract Amendment 2 (January 20, 2010). This work has been undertaken in accordance with generally accepted consulting practices. No other warranty, express or implied, is made.

16
REFERENCES New England EnviroStrategies, Inc. February 2010. ASTM Phase II Environmental Site
Assessment Report, Lots 2 and 3, Omega Drive, Brattleboro, VT 05301. New England EnviroStrategies, Inc. February 16, 2010. E-mail communication with Kristin Huff
of Blackstone Laboratories, Inc. regarding concentrations of metals in used engine oil. New England EnviroStrategies, Inc. January 2010. ASTM Phase I Environmental Site
Assessment Report, Lots 2 and 3, Omega Drive, Brattleboro, VT 05301. New England EnviroStrategies, Inc. January 2010. Quality Assurance Project Plan, Phase II
Environmental Site Assessment, Brattleboro, Vermont. State of Vermont Agency of Natural Resources Department of Environmental Conservation.
February 14, 2005. Chapter 12 Of the Environmental Protection Rules: Groundwater Protection Rule and Strategy.
United States Environmental Protection Agency Region I. December 1996. Region I, EPA-New
England Data Validation Functional Guidelines for Evaluating Environmental Analyses. United States Environmental Protection Agency Regions 3, 6, and 9. December 2009.
Regional Screening Levels for Chemical Contaminants at Superfund Sites. http://www.epa.gov/reg3hwmd/risk/human/rb-concentration_table/index.htm Innov-X Systems 2005 User Manual, Version 2.1 (Woburn, MA: Innov-X Systems, Inc.).
Chapter 5S.

TABLE 1Tabulated Sampling and Analysis PlanSupplemental Phase II ESAOmega Drive Brownfields ProjectBrattleboro, Vermont
Task Task Description Matrix
No. of Borings & Surface Samples Sample Depths (ft)
No. of Pb Screening Samples
No. of Lab Pb Samples
No. of Lab Samples - As
No. of PID Screening Samples
No. of Lab Samples - VOCs
No. of Lab Samples - Tot. PP Metals
No. of Lab Samples -Diss. PP Metals
No. of Lab Samples - TPH
SOILS
1A5 Lot 3 Cut/Fill, 1 Sump Boring, 1 Surface Soil Sample Soil 7 bottom of cut & choice 13 1 0 13 8 0 0 8
1B Former Engine Block Stg. Area Soil 5 0.5, 3, 6 15 2 2 15 0 0 0 0
1C Monitoring Well Soil Borings Soil 7 2 & mid-screen 14 1 1 2 2 0 0 0
1D VTDEC Soil Borings Soil 2NE2S-22: 1'; NE2S-23: 4.5'. 1 0 0 4 0 1 0 2
Total Soils Samples 21 43 4 3 34 10 1 0 10SOILS DUPLICATES
1A Cut Soils Quality Soil 6 bottom of cut & choice 1 0 0 0 1 0 0 11B Former Engine Block Stg. Area Soil 5 0.5, 3, 6 2 1 1 0 0 0 0 01C Monitoring Well Soil Borings Soil 7 2 & mid-screen 1 1 1 0 0 0 0 0
Total Soils Duplicates 18 4 2 2 0 1 0 0 1
TOTAL SOIL SAMPLES 47 6 5 34 11 1 0 11WATER
2 MW Installation/GW Sampling Water NA NA 0 0 0 0 7 7 2 73 Surface Water Sampling Water NA NA 0 0 0 0 4 4 0 0
Total Water 0 0 0 0 11 11 2 7WATER DUPLICATES
2 MW Installation/GW Sampling Water NA NA 0 0 0 0 1 1 1 12 MW Installation/GW Sampling Water NA NA 0 0 0 0 1 1 1 13 Surface Water Sampling Water NA NA 0 0 0 0 0 0 0 0
Total Water Duplicates 0 0 0 0 1 1 1 1
TOTAL WATER SAMPLES 0 0 0 0 12 12 3 8

TABLE 2Soil Boring and Monitoring Well InformationSupplemental Phase II ESAOmega Drive Brownfields ProjectBrattleboro, Vermont
Boring IDTotal
Depth (ft) (Recovery) (in)Borehole
Completion Soil DescriptionField Screening and Laboratory Samples
Collected10 (40/60) Loose gravelly sand with organics XRF: 0.5', 2', 6'
(16/60) Med dense light tan to brown SILTY SAND PID: <1 ppm
10 (34/60) Loose gravelly SAND with organics and glass debris XRF: 0.5', 2', 6'(40/60) 4 in crushed stone PID: <1 ppm
Med dense brown SILTY SAND with GRAVEL, some iron staining LAB: Soil, 2 ft (Pb, As) Med dense dark brown - olive tan SILTY SAND
10 (27/60) Loose gravelly SAND with organics XRF: 0.5', 2', 6'(27/60) 6 in light gray crushed cement PID: <1 ppm
Med dense mottled red-brown SILTY SAND with iron metal debrisLoose grey-brown SILTY SANDMed dense iron stained GRAVELY SAND
10 (36/60) Loose gravelly SAND with organics XRF: 0.5', 2', 6'(24/60) 2 in broken – crushed cement PID: <1 ppm
Med dense dark brown GRAVELY SAND, iron staining and roots with iron metal debris
LAB: Soil, 3 - 6 in (Pb, As)
Loose - Med dense olive green GRAVELY SAND, some iron staining10 (36/60) Loose gravelly SAND with organics XRF: 0.5', 2', 6'
(12/60) 3 in broken – crushed cement PID: <1 ppmMed dense brown to red GRAVELY SAND, with roots and woody debris LAB:
Med dense brown to black SILTY SAND roots and organic material
NE2S-10
N/A
NE2S-13
NE2S-14
NE2S-11
N/A
NE2S-12
N/A
N/A
N/A
Med dense brown to black SILTY SAND roots and organic material
10 (28/60) Loose gravelly SAND with organics XRF: 0.5', 2', 6'(11/60) Med dense brown GRAVELY SAND, some iron staining PID: <1 ppm
with debris including black foam material, chrome plated metal, and rubber tire
LAB:
Dense olive green SAND, iron stained23 (42/60) Dense olive green to light brown silty GRAVELY SAND, with woody
debrisXRF: 3', 23'
(58/60) Dense olive green to light brown silty GRAVELY SAND PID: <1 ppm(40/60) LAB: Soil, 23 Ft (VOCs, TPH)(58/60)(36/36) same as above
NE2S-15
N/A
N/A
NE2S-16
New England Envirostrategies, Inc. Project 09011E04 3/19/2010 1 of 3

TABLE 2Soil Boring and Monitoring Well InformationSupplemental Phase II ESAOmega Drive Brownfields ProjectBrattleboro, Vermont
Boring IDTotal
Depth (ft) (Recovery) (in)Borehole
Completion Soil DescriptionField Screening and Laboratory Samples
Collected16 (47/60) Dense olive green to light brown silty GRAVELY SAND, with some iron
stainingXRF: 3', 16'
(60/60) PID: <1 ppm(55/60) As above LAB: Soil, 3 Ft, (VOCs TPH)(18/18) Very dense olive green gravely SITY SAND (TILL) Soil, 16 Ft (TPH)
10 (44/60) 2 in topsoil XRF: 3', 8'(44/60) Loose olive green GRAVELY SAND PID: <1 ppm
Dense olive green GRAVELY SAND with fissile rock fragments LAB: Soil, 2.5 Ft and 8 Ft (VOCs TPH)15 (34/60) 1 in topsoil XRF: 3', 15'
(58/60) Loose brown to olive green SANDY GRAVEL PID: <1 ppm(57/60) Med dense olive green SAND, wet LAB: Soil, 3 Ft (VOCs TPH), Soil, 15 Ft (VOCs)
Loose olive green GRAVELY SAND20 (35/60) 2 in topsoil XRF: 2', 20'
(52/60) Loose brown GRAVELY SAND PID: <1 ppm(60/60) Dense olive green to light brown silty GRAVELY SAND, some iron
staining LAB: Soil, 2 Ft (VOCs TPH) Soil, 20 Ft (TPH)
(56/60) Thin lense of loose light grey SAND 9" crushed stone
Refusal at 20 Ft23 (60/60) Dense olive green to light brown silty GRAVELY SAND XRF: 2', 23'
(60/60) 60 in as above PID: <1 ppm(60/60) 60 in as above LAB: Soil, 2.5 Ft (TPH), Soil 23 Ft (VOCs)(60/60) 60 in as above(33/36) 36 in as above
5 (24/60) 6 in topsoil XRF: 2'Dense olive green to light brown silty GRAVELY SAND PID: <1 ppm
LAB: Soil, 0 - 2 Ft (TPH, PP 13 Metals)
N/A
N/A
NE2S-21
NE2S-22
NE2S-18
N/A
N/A
NE2S-19
NE2S-20
N/A
N/A
NE2S-17
LAB: Soil, 0 2 Ft (TPH, PP 13 Metals) Soil 23 Ft (VOCs)
10 (39/60) Loose brown GRAVELY SAND (FILL) XRF: 1', 5',8'(39/60) Dense redish brown GRAVELY SAND PID:
Dense olive green to light brown silty GRAVELY SAND with thin LAB: Soil, 2 – 4 Ft (TPH)lense of med sand
10 (54/60) 1" Monitoring Well
3 in topsoil with roots XRF: 1', 2',7'
(60/60) Screened 5-10 feet
Thin lense of white-olive green clayey material PID: <1 ppm
Loose olive SILTY SAND with GRAVEL LAB: Groundwater (VOCs, TPH, Total PP Metals)
Very dense gray SILTY SAND with GRAVEL, iron stained mafic rock fragments from 4 – 4.5 ft bgs
15 (30/60) 1" Monitoring Well
Med dense brown turning to gray fine SILTY SAND, black staining 4 in from bottom
XRF: 2',12.5'
(60/60) Screened 10-15 feet
Gray wet, faint petroleum odor 5 – 6.5 PID: 6.6 ppm (5 – 6 Ft)
4 ft olive med dense SILTY SAND with GRAVEL turning course and grey LAB: Soil 6 Ft (VOCs, Pb ,As); Groundwater (VOCs, TPH, Total and dissolved PP 13 Metals)
Olive to gray very dense GRAVELY SAND with some iron staining
N/A
NE2S-23
MW-1
MW-2
New England Envirostrategies, Inc. Project 09011E04 3/19/2010 2 of 3

TABLE 2Soil Boring and Monitoring Well InformationSupplemental Phase II ESAOmega Drive Brownfields ProjectBrattleboro, Vermont
Boring IDTotal
Depth (ft) (Recovery) (in)Borehole
Completion Soil DescriptionField Screening and Laboratory Samples
Collected13 (42/60) 1" Monitoring
Well42 in brown and olive dense SILTY SAND with rounded GRAVEL, moist XRF: 2',12.5'
(48/60) Screened 8-13 feet
4 feet olive with iron stained loose SILTY uniform SAND, wet PID: <1 ppm
(36/36) 1 ft olive me dense SILTY SAND LAB: Groundwater (VOCs, TPH, Total and dissolved PP 13 Metals)
2 ft olive gray very dense SAND with GRAVEL10 (40/60) 1" Monitoring
Well6 ft dense light brown SILTY SAND with GRAVEL, moist XRF: 2',7.5', 12.5'
(52/60) Screened 5-10 feet
4 ft dense olive saturated SILTY SAND with GRAVEL PID: <1 ppm
LAB: Groundwater (VOCs, TPH, Total and dissolved PP 13 Metals)
15 (48/60) 1" Monitoring Well
Medium dense brown SILTY SAND with GRAVEL, moist, roots in top foot. Dense below 4 ft, laminated 5 – 10 ft
XRF: 2', 12.5'
(60/60) Screened 10-15 feet
3 in med course SAND layer @ 8 ft PID: <1 ppm
(60/60) 2.5 ft loose olive SILTY SAND LAB: Groundwater, VOCs, TPH, Total PP 13 Metals
2.5 ft olive very dense SILTY SAND with GRAVEL. (TILL)30 (36/60) 1" Monitoring
WellXRF: 2', 12.5', 22', 26'
Screened 20-30 feet
Medium dense SILTY SAND with gray pebble size GRAVEL PID: <1 ppm
(40/60) Dark green to dark brown dense SILTY SAND with GRAVEL (5 – 7 only), slightly mottled
LAB: Soil,1.5 Ft (VOCs), Groundwater (VOCs, TPH, Total PP 13 Metals)
(48/60) 10 – 11 ft dense dark olive SANDY SILT, mottled (50/60) 11 – 15 medium very course SILTY SAND and pebble size GRAVEL,
slightly mottled and ashy at 12.5 ft
MW-6
MW-3
MW-4
MW-5
slightly mottled and ashy at 12.5 ft (60/60) Dark olive brown dense SILTY SAND to SANDY SILT with GRAVEL(50/60) As above
23 (26/60) 1" Monitoring Well
Medium dense tan SILTY SAND with GRAVEL. Moist. Pockets of course SAND and odorless black stained soil. White roots in top 6 in. Fill
XRF: 2', 10', 19', 23'
(32/60) Screened 8-23 feet
Same as above with iron stained shale rock, root at 10 ft PID: <1 ppm
(60/60) Olive with many large pieces of GRAVEL LAB: Groundwater (VOCs, TPH, Total PP 13 Metals)
(36/60) Very dense TILL, iron mottles and grayish olive SILTY SAND(36/36) Bottom 6 in medium dense mottled w/ tan
Grayish olive very dense SITLY SAND with GRAVEL
Notes: PID headspace screening conducted from all bagged samples collected. Maximum PID response noted with respective depth (iff applicable). Bgs=below ground surfaceXRF: X-ray fluorescence field screening conducted with handheld Innovex, Model A 4000. Results of field screening included as Appendix B
MW-7
New England Envirostrategies, Inc. Project 09011E04 3/19/2010 3 of 3

TABLE 3Groundwater Elevation DataSupplemental Phase II ESAOmega Drive Brownfields ProjectBrattleboro, Vermont
GROUNDWATER DEPTH (FEET)Elevation MW-1 MW-2 MW-3 MW-4 MW-5 MW-6 MW-7
TOC 621.76 608.43 * 596.67 * 587.83 594.54 619.76 * 635.46 *GS 618.69 605.23 594.01 584.96 591.54 617.34 633.14
Date3/11/10 5.5 3.81 4.75 6.88 8.50 14.70 9.38
GROUNDWATER ELEVATION (FEET)Date MW-1 MW-2 MW-3 MW-4 MW-5 MW-6 MW-7
3/11/10 616.26 604.62 * 591.92 * 580.95 586.04 605.06 * 626.08 *
Notes:* Surveyor reported elevations for well cap. Top of Casing (TOC) not accessable at time of survey.All groundwater measurement depths reported from TOC.GS = ground surface

TABLE 4Soil Analytical Results: MetalsSupplemental Phase II ESAOmega Drive Brownfields ProjectBrattleboro, Vermont
Sample Identification: MW-2 NE2S-10 NE2S-11 NE2S-15 NE2S-22 DUP-1 DUP-2Sample Date: Units 3/3/2010 3/4/2010 3/4/2010 3/4/2010 3/5/2010 3/3/2010 3/4/2010Metals (6020)Antimony mg/kg <0.5Arsenic 1.6 0.39 mg/kg 2.1 4.6 3 1.4 1.4 2.8 2.7Beryllium mg/kg 0.6Cadmium 800 70 mg/kg <0.5Chromium mg/kg 18Copper 41000 3100 mg/kg 10Lead 800 400 mg/kg 27 330 160 7.9 39 20 130Mercury 34 5.6 mg/kg <0.1Nickel mg/kg 13Selenium 5100 390 mg/kg <0.5Silver 5100 390 mg/kg <0.5Thallium mg/kg <0.5Zinc 310000 23000 mg/kg 44
Notes:Result exceeds Industrial RSLResult exceeds Residential RSL
Revised 3/12/2010 3:33:38 PM
Industrial RSL
Residential RSL
New England EnviroStrategies, Inc. Project 09011E03 Page 1 of 13/19/2010

TABLE 5Soil Analytical Results: OrganicsSupplemental Phase II ESAOmega Drive Brownfields ProjectBrattleboro, VT
Sample Identification: DUP-3 MW-2 MW-6 NE2S-16 NE2S-17 NE2S-17 NE2S-18 NE2S-18 NE2S-19 NE2S-19 NE2S-20 NE2S-20 NE2S-21 NE2S-21 NE2S-22 NE2S-23Saple Depth (ft): Reporting 2.5 6 1.5 23 3 16 2.5 8 3 15 2 20 2.5 23 2 5Sample Date: Units 3/5/2010 3/3/2010 3/4/2010 3/4/2010 3/5/2010 3/5/2010 3/5/2010 3/5/2010 3/5/2010 3/5/2010 3/5/2010 3/5/2010 3/4/2010 3/4/2010 3/5/2010 3/5/2010Hydrocarbon (8100mod)TPH (C9-C40) mg/kg <13 <13 <13 <13 <13 <13 <13 20 <13 60 <20VOAs (8260B)1,1,1,2-Tetrachloroethane 9.3 1.9 mg/kg <0.05 <0.05 <0.05 <0.05 <0.05 <0.05 <0.05 <0.05 <0.05 <0.05 <0.05 <0.051,1,1-Trichloroethane 38000 8700 mg/kg <0.05 <0.05 <0.05 <0.05 <0.05 <0.05 <0.05 <0.05 <0.05 <0.05 <0.05 <0.051,1,2,2-Tetrachloroethane 2.8 0.56 mg/kg <0.05 <0.05 <0.05 <0.05 <0.05 <0.05 <0.05 <0.05 <0.05 <0.05 <0.05 <0.051,1,2-Trichloroethane 5.3 1.1 mg/kg <0.05 <0.05 <0.05 <0.05 <0.05 <0.05 <0.05 <0.05 <0.05 <0.05 <0.05 <0.051,1-Dichloroethane 17 3.3 mg/kg <0.05 <0.05 <0.05 <0.05 <0.05 <0.05 <0.05 <0.05 <0.05 <0.05 <0.05 <0.051,1-Dichloroethene 1100 240 mg/kg <0.05 <0.05 <0.05 <0.05 <0.05 <0.05 <0.05 <0.05 <0.05 <0.05 <0.05 <0.051,1-Dichloropropene mg/kg <0.05 <0.05 <0.05 <0.05 <0.05 <0.05 <0.05 <0.05 <0.05 <0.05 <0.05 <0.051,2,3-Trichlorobenzene 490 49 mg/kg <0.05 <0.05 <0.05 <0.05 <0.05 <0.05 <0.05 <0.05 <0.05 <0.05 <0.05 <0.051,2,3-Trichloropropane 0.095 0.005 mg/kg <0.05 <0.05 <0.05 <0.05 <0.05 <0.05 <0.05 <0.05 <0.05 <0.05 <0.05 <0.051,2,4-Trimethylbenzene 260 62 mg/kg <0.05 2.2 <0.05 <0.05 <0.05 <0.05 <0.05 <0.05 <0.05 <0.05 <0.05 <0.051,2-Dibromo-3-chloropropane 0.069 0.0054 mg/kg <0.05 <0.05 <0.05 <0.05 <0.05 <0.05 <0.05 <0.05 <0.05 <0.05 <0.05 <0.051,2-Dibromoethane 0.17 0.034 mg/kg <0.05 <0.05 <0.05 <0.05 <0.05 <0.05 <0.05 <0.05 <0.05 <0.05 <0.05 <0.051,2-Dichloroethane 2.2 0.43 mg/kg <0.05 <0.05 <0.05 <0.05 <0.05 <0.05 <0.05 <0.05 <0.05 <0.05 <0.05 <0.051,2-Dichloropropane 4.5 0.89 mg/kg <0.05 <0.05 <0.05 <0.05 <0.05 <0.05 <0.05 <0.05 <0.05 <0.05 <0.05 <0.051,3,5-Trimethylbenzene 10000 780 mg/kg <0.05 0.55 <0.05 <0.05 <0.05 <0.05 <0.05 <0.05 <0.05 <0.05 <0.05 <0.05
Industrial RSL
Residential RSL
1,3-Dichloropropane 20000 1600 mg/kg <0.05 <0.05 <0.05 <0.05 <0.05 <0.05 <0.05 <0.05 <0.05 <0.05 <0.05 <0.052,2-Dichloropropane mg/kg <0.05 <0.05 <0.05 <0.05 <0.05 <0.05 <0.05 <0.05 <0.05 <0.05 <0.05 <0.052-Butanone 200000 28000 mg/kg <0.5 <0.5 <0.5 <0.5 <0.5 <0.5 <0.5 <0.5 <0.5 <0.5 <0.5 <0.52-Chlorotoluene 20000 1600 mg/kg <0.05 <0.05 <0.05 <0.05 <0.05 <0.05 <0.05 <0.05 <0.05 <0.05 <0.05 <0.052-Hexanone 1400 210 mg/kg <0.1 <0.1 <0.1 <0.1 <0.1 <0.1 <0.1 <0.1 <0.1 <0.1 <0.1 <0.14-Chlorotoluene 72000 5500 mg/kg <0.05 <0.05 <0.05 <0.05 <0.05 <0.05 <0.05 <0.05 <0.05 <0.05 <0.05 <0.054-Methyl-2-pentanone 53000 5300 mg/kg <0.5 <0.5 <0.5 <0.5 <0.5 <0.5 <0.5 <0.5 <0.5 <0.5 <0.5 <0.5Acetone 630000 61000 mg/kg <2 <2 <2 <2 <2 <2 <2 <2 <2 <2 <2 <2Benzene 5400 1100 ug/kg <50 <50 <50 <50 <50 <50 <50 <50 <50 <50 <50 <50Bromobenzene 1800 300 mg/kg <0.05 <0.05 <0.05 <0.05 <0.05 <0.05 <0.05 <0.05 <0.05 <0.05 <0.05 <0.05Bromochloromethane mg/kg <0.05 <0.05 <0.05 <0.05 <0.05 <0.05 <0.05 <0.05 <0.05 <0.05 <0.05 <0.05Bromodichloromethane 1.4 0.27 mg/kg <0.05 <0.05 <0.05 <0.05 <0.05 <0.05 <0.05 <0.05 <0.05 <0.05 <0.05 <0.05Bromoform 220 61 mg/kg <0.05 <0.05 <0.05 <0.05 <0.05 <0.05 <0.05 <0.05 <0.05 <0.05 <0.05 <0.05Bromomethane 32 7.3 mg/kg <0.1 <0.1 <0.1 <0.1 <0.1 <0.1 <0.1 <0.1 <0.1 <0.1 <0.1 <0.1Butylbenzene mg/kg <0.05 <0.05 <0.05 <0.05 <0.05 <0.05 <0.05 <0.05 <0.05 <0.05 <0.05 <0.05Carbon disulfide 3700 820 mg/kg <0.1 <0.1 <0.1 <0.1 <0.1 <0.1 <0.1 <0.1 <0.1 <0.1 <0.1 <0.1Carbon tetrachloride 1.2 0.25 mg/kg <0.05 <0.05 <0.05 <0.05 <0.05 <0.05 <0.05 <0.05 <0.05 <0.05 <0.05 <0.05Chlorobenzene 1400 290 mg/kg <0.05 <0.05 <0.05 <0.05 <0.05 <0.05 <0.05 <0.05 <0.05 <0.05 <0.05 <0.05Chloroethane 61000 15000 mg/kg <0.1 <0.1 <0.1 <0.1 <0.1 <0.1 <0.1 <0.1 <0.1 <0.1 <0.1 <0.1Chloroform 1.5 0.29 mg/kg <0.05 <0.05 <0.05 <0.05 <0.05 <0.05 <0.05 <0.05 <0.05 <0.05 <0.05 <0.05Chloromethane 500 120 mg/kg <0.1 <0.1 <0.1 <0.1 <0.1 <0.1 <0.1 <0.1 <0.1 <0.1 <0.1 <0.1i 1 2 Di hl th 10000 780 /k 0 05 0 05 0 05 0 05 0 05 0 05 0 05 0 05 0 05 0 05 0 05 0 05cis-1,2-Dichloroethene 10000 780 mg/kg <0.05 <0.05 <0.05 <0.05 <0.05 <0.05 <0.05 <0.05 <0.05 <0.05 <0.05 <0.05
cis-1,3-Dichloropropene mg/kg <0.05 <0.05 <0.05 <0.05 <0.05 <0.05 <0.05 <0.05 <0.05 <0.05 <0.05 <0.05Dibromochloromethane 3.3 0.68 mg/kg <0.05 <0.05 <0.05 <0.05 <0.05 <0.05 <0.05 <0.05 <0.05 <0.05 <0.05 <0.05Dibromomethane 110 25 mg/kg <0.05 <0.05 <0.05 <0.05 <0.05 <0.05 <0.05 <0.05 <0.05 <0.05 <0.05 <0.05Dichlorodifluoromethane 780 180 mg/kg <0.1 <0.1 <0.1 <0.1 <0.1 <0.1 <0.1 <0.1 <0.1 <0.1 <0.1 <0.1Ethylbenzene 27 5.4 mg/kg <0.05 0.37 <0.05 <0.05 <0.05 <0.05 <0.05 <0.05 <0.05 <0.05 <0.05 <0.05Isopropylbenzene 11000 2100 mg/kg <0.05 0.07 <0.05 <0.05 <0.05 <0.05 <0.05 <0.05 <0.05 <0.05 <0.05 <0.05m,p-Xylenes 2700 630 mg/kg <0.05 1.4 <0.05 <0.05 <0.05 <0.05 <0.05 <0.05 <0.05 <0.05 <0.05 <0.05Methyl tert butyl ether 220 43 mg/kg <0.1 <0.1 <0.1 <0.1 <0.1 <0.1 <0.1 <0.1 <0.1 <0.1 <0.1 <0.1Methylene chloride 53 11 mg/kg <0.1 <0.1 <0.1 <0.1 <0.1 <0.1 <0.1 <0.1 <0.1 <0.1 <0.1 <0.1o-Xylene 19000 3800 mg/kg <0.05 0.59 <0.05 <0.05 <0.05 <0.05 <0.05 <0.05 <0.05 <0.05 <0.05 <0.05Propylbenzene 21000 3400 mg/kg <0.05 0.26 <0.05 <0.05 <0.05 <0.05 <0.05 <0.05 <0.05 <0.05 <0.05 <0.05Styrene 36000 6300 mg/kg <0.05 <0.05 <0.05 <0.05 <0.05 <0.05 <0.05 <0.05 <0.05 <0.05 <0.05 <0.05tert-Butylbenzene mg/kg <0.05 <0.05 <0.05 <0.05 <0.05 <0.05 <0.05 <0.05 <0.05 <0.05 <0.05 <0.05Tetrachloroethene 2.6 0.55 mg/kg <0.05 <0.05 <0.05 <0.05 <0.05 <0.05 <0.05 <0.05 <0.05 <0.05 <0.05 <0.05Tetrahydrofuran mg/kg <0.5 <0.5 <0.5 <0.5 <0.5 <0.5 <0.5 <0.5 <0.5 <0.5 <0.5 <0.5Toluene 45000 5000 mg/kg <0.05 <0.05 <0.05 <0.05 <0.05 <0.05 <0.05 <0.05 <0.05 <0.05 <0.05 <0.05trans-1,2-Dichloroethene 690 150 mg/kg <0.05 <0.05 <0.05 <0.05 <0.05 <0.05 <0.05 <0.05 <0.05 <0.05 <0.05 <0.05trans-1,3-Dichloropropene mg/kg <0.05 <0.05 <0.05 <0.05 <0.05 <0.05 <0.05 <0.05 <0.05 <0.05 <0.05 <0.05Trichloroethene 14 2.8 mg/kg <0.05 <0.05 <0.05 <0.05 <0.05 <0.05 <0.05 <0.05 <0.05 <0.05 <0.05 <0.05Trichlorofluoromethane 3400 790 mg/kg <0.1 <0.1 <0.1 <0.1 <0.1 <0.1 <0.1 <0.1 <0.1 <0.1 <0.1 <0.11 2 4 Trichlorobenzene 99 22 mg/kg <0 05 <0 05 <0 05 <0 05 <0 05 <0 05 <0 05 <0 05 <0 05 <0 05 <0 05 <0 051,2,4-Trichlorobenzene 99 22 mg/kg <0.05 <0.05 <0.05 <0.05 <0.05 <0.05 <0.05 <0.05 <0.05 <0.05 <0.05 <0.051,2-Dichlorobenzene 9800 1900 mg/kg <0.05 <0.05 <0.05 <0.05 <0.05 <0.05 <0.05 <0.05 <0.05 <0.05 <0.05 <0.051,3-Dichlorobenzene mg/kg <0.05 <0.05 <0.05 <0.05 <0.05 <0.05 <0.05 <0.05 <0.05 <0.05 <0.05 <0.051,4-Dichlorobenzene 12 2.4 mg/kg <0.05 <0.05 <0.05 <0.05 <0.05 <0.05 <0.05 <0.05 <0.05 <0.05 <0.05 <0.05Hexachlorobutadiene 22 6.2 mg/kg <0.05 <0.05 <0.05 <0.05 <0.05 <0.05 <0.05 <0.05 <0.05 <0.05 <0.05 <0.05Naphthalene 18 3.6 mg/kg <0.1 0.9 <0.1 <0.1 <0.1 <0.1 <0.1 <0.1 <0.1 <0.1 <0.1 <0.1
Notes:Result exceeds Industrial RSLResult exceeds Residential RSL
Revised 3/12/2010 3:49:55 PM
New England EnviroStrategies, Inc. Project 09011E03 3/19/2010 Page 1 of 1

TABLE 6Ground and Surface Water Analytical ResultsSupplemental Phase II ESAOmega Drive Brownfields ProjectBrattleboro, Vermont
Sample Identification: MW-1 MW-2 Dup (MW-2) MW-3 Dup (MW-3) MW-5 MW-6 MW-7 SW-1 SW-2 SW-3 SW-4Sample Date: Units 3/11/2010 3/11/2010 3/11/2010 3/11/2010 3/11/2010 3/11/2010 3/16/2010 3/11/2010 3/11/2010 3/11/2010 3/5/2010 3/5/2010 3/5/2010 3/5/2010Metals (6020)Antimony 0.006 mg/L <0.001 <0.001 <0.001 <0.001 <0.001 <0.001 <0.001 <0.001 <0.001 <0.001 <0.001 <0.001 <0.001 <0.001Arsenic 0.01 mg/L <0.001 <0.001 <0.001 <0.001 <0.001 0.008 <0.001 <0.001 <0.001 <0.001 <0.001 <0.001 <0.001 <0.001Beryllium 0.004 mg/L <0.001 <0.001 <0.001 <0.001 <0.001 <0.001 <0.001 <0.001 <0.001 <0.001 <0.001 <0.001 <0.001 <0.001Cadmium 0.005 mg/L <0.001 <0.001 <0.001 <0.001 <0.001 <0.001 <0.001 <0.001 <0.001 <0.001 <0.001 <0.001 <0.001 <0.001Chromium 0.1 mg/L 0.013 <0.001 <0.001 <0.001 <0.001 0.11 0.001 <0.001 <0.001 0.006 <0.001 <0.001 <0.001 <0.001Copper 1.3 mg/L 0.005 <0.001 <0.001 <0.001 <0.001 0.13 <0.001 0.001 <0.001 0.004 0.009 0.002 <0.001 <0.001Lead 0.015 mg/L 0.003 0.001 <0.001 <0.001 <0.001 0.036 <0.001 <0.001 <0.001 0.002 0.005 0.001 <0.001 <0.001Mercury 0.002 mg/L <0.0001 <0.0001 <0.0001 <0.0001 <0.0001 <0.0001 <0.0001 <0.0001 <0.0001 <0.0001 <0.0001 <0.0001 <0.0001 <0.0001Nickel 0.1 mg/L 0.009 0.001 0.001 0.004 0.004 0.11 <0.001 0.01 0.006 0.008 0.008 0.002 <0.001 <0.001Selenium 0.05 mg/L <0.001 <0.001 <0.001 <0.001 <0.001 <0.001 <0.001 <0.001 <0.001 <0.001 <0.001 <0.001 <0.001 <0.001Silver 0.1 ppm <0.001 <0.001 <0.001 <0.001 <0.001 <0.001 <0.001 <0.001 <0.001 <0.001 <0.001 <0.001 <0.001 <0.001Thallium 0.002 mg/L <0.001 <0.001 <0.001 <0.001 <0.001 <0.001 <0.001 <0.001 <0.001 <0.001 <0.001 <0.001 <0.001 <0.001Zinc 5 mg/L 0.017 <0.005 <0.005 <0.005 <0.005 0.17 <0.005 <0.005 <0.005 0.01 0.097 0.025 <0.005 <0.005Hydrocarbon (8100mod)TPH (C9-C40) mg/L <0.2 0.4 0.3 <0.2 <0.2 <0.2 <0.2 <0.2VOAs (8260B)1,1,1,2-Tetrachloroethane ug/L <2 <2 <2 <2 <2 <2 <2 <2 <2 <2 <2 <2 <21,1,1-Trichloroethane 200 ug/L <2 <2 <2 <2 <2 <2 <2 <2 <2 <2 <2 <2 <21,1,2,2-Tetrachloroethane 70 ug/L <2 <2 <2 <2 <2 <2 <2 <2 <2 <2 <2 <2 <21,1,2-Trichloroethane 5 ug/L <2 <2 <2 <2 <2 <2 <2 <2 <2 <2 <2 <2 <21,1-Dichloroethane 70 ug/L <2 <2 <2 <2 <2 <2 <2 <2 <2 <2 <2 <2 <2
Enforcement Standard
MW-4
, g1,1-Dichloroethene 7 ug/L <1 <1 <1 <1 <1 <1 <1 <1 <1 <1 <1 <1 <11,1-Dichloropropene ug/L <2 <2 <2 <2 <2 <2 <2 <2 <2 <2 <2 <2 <21,2,3-Trichlorobenzene ug/L <1 <1 <1 <1 <1 <1 <1 <1 <1 <1 <1 <1 <11,2,3-Trichloropropane 5 ug/L <2 <2 <2 <2 <2 <2 <2 <2 <2 <2 <2 <2 <21,2,4-Trimethylbenzene 5 ug/L <1 20 21 <1 <1 <1 <1 <1 <1 <1 <1 <1 <11,2-Dibromo-3-chloropropane ug/L <1 <1 <1 <1 <1 <1 <1 <1 <1 <1 <1 <1 <11,2-Dibromoethane 0.05 ug/L <1 <1 <1 <1 <1 <1 <1 <1 <1 <1 <1 <1 <11,2-Dichloroethane 5 ug/L <2 <2 <2 <2 <2 <2 <2 <2 <2 <2 <2 <2 <21,2-Dichloropropane 5 ug/L <2 <2 <2 <2 <2 <2 <2 <2 <2 <2 <2 <2 <21,3,5-Trimethylbenzene 4 ug/L <1 4 5 <1 <1 <1 <1 <1 <1 <1 <1 <1 <11,3-Dichloropropane 0.5 ug/L <2 <2 <2 <2 <2 <2 <2 <2 <2 <2 <2 <2 <22,2-Dichloropropane ug/L <2 <2 <2 <2 <2 <2 <2 <2 <2 <2 <2 <2 <22-Butanone 4200 ug/L <10 <10 <10 <10 <10 <10 <10 <10 <10 <10 <10 <10 <102-Chlorotoluene ug/L <2 <2 <2 <2 <2 <2 <2 <2 <2 <2 <2 <2 <22-Hexanone ug/L <10 <10 <10 <10 <10 <10 <10 <10 <10 <10 <10 <10 <104-Chlorotoluene ug/L <2 <2 <2 <2 <2 <2 <2 <2 <2 <2 <2 <2 <24-Methyl-2-pentanone 560 ug/L <10 <10 <10 <10 <10 <10 <10 <10 <10 <10 <10 <10 <10Acetone 700 ug/L <10 <10 <10 <10 <10 <10 <10 <10 <10 <10 <10 <10 <10Benzene 5 ug/L <1 <1 <1 <1 <1 <1 <1 <1 <1 <1 <1 <1 <1Bromobenzene ug/L <2 <2 <2 <2 <2 <2 <2 <2 <2 <2 <2 <2 <2Bromochloromethane 90 ug/L <2 <2 <2 <2 <2 <2 <2 <2 <2 <2 <2 <2 <2Bromodichloromethane ug/L <1 <1 <1 <1 <1 <1 <1 <1 <1 <1 <1 <1 <1Bromoform ug/L <2 <2 <2 <2 <2 <2 <2 <2 <2 <2 <2 <2 <2Bromomethane 10 ug/L <2 <2 <2 <2 <2 <2 <2 <2 <2 <2 <2 <2 <2Butylbenzene ug/L <1 <1 <1 <1 <1 <1 <1 <1 <1 <1 <1 <1 <1Carbon disulfide ug/L <5 <5 <5 <5 <5 <5 <5 <5 <5 <5 <5 <5 <5Carbon tetrachloride 5 ug/L <2 <2 <2 <2 <2 <2 <2 <2 <2 <2 <2 <2 <2Chlorobenzene 100 ug/L <2 <2 <2 <2 <2 <2 <2 <2 <2 <2 <2 <2 <2Chloroethane 2 ug/L <5 <5 <5 <5 <5 <5 <5 <5 <5 <5 <5 <5 <5Chloroform ug/L <2 <2 <2 <2 <2 <2 <2 <2 <2 <2 <2 <2 <2Chloromethane 30 ug/L <2 <2 <2 <2 <2 <2 <2 <2 <2 <2 <2 <2 <2cis-1,2-Dichloroethene 70 ug/L <2 <2 <2 <2 <2 <2 <2 <2 <2 <2 <2 <2 <2cis-1,3-Dichloropropene ug/L <1 <1 <1 <1 <1 <1 <1 <1 <1 <1 <1 <1 <1Dibromochloromethane ug/L <2 <2 <2 <2 <2 <2 <2 <2 <2 <2 <2 <2 <2Dibromomethane ug/L <2 <2 <2 <2 <2 <2 <2 <2 <2 <2 <2 <2 <2Dichlorodifluoromethane 1000 ug/L <5 <5 <5 <5 <5 <5 <5 <5 <5 <5 <5 <5 <5Ethylbenzene 700 ug/L <1 8 9 <1 <1 <1 <1 <1 <1 <1 <1 <1 <1Isopropylbenzene ug/L <1 <1 <1 <1 <1 <1 <1 <1 <1 <1 <1 <1 <1m,p-Xylenes ug/L <1 30 32 <1 <1 <1 <1 <1 <1 <1 <1 <1 <1Methyl tert butyl ether 40 ug/L <5 <5 <5 <5 <5 <5 <5 <5 <5 <5 <5 <5 <5Methylene chloride 5 ug/L <5 <5 <5 <5 <5 <5 <5 <5 <5 <5 <5 <5 <5o-Xylene ug/L <1 15 16 <1 <1 <1 <1 <1 <1 <1 <1 <1 <1Propylbenzene ug/L <1 2 2 <1 <1 <1 <1 <1 <1 <1 <1 <1 <1Styrene ug/L <1 <1 <1 <1 <1 <1 <1 <1 <1 <1 <1 <1 <1tert-Butylbenzene ug/L <1 <1 <1 <1 <1 <1 <1 <1 <1 <1 <1 <1 <1Tetrachloroethene 5 ug/L <2 <2 <2 <2 <2 <2 <2 <2 <2 <2 <2 <2 <2Tetrahydrofuran ug/L <10 <10 <10 <10 <10 <10 <10 <10 <10 <10 <10 <10 <10Toluene 1000 ug/L <1 <1 <1 <1 <1 <1 <1 <1 <1 <1 <1 <1 <1t 1 2 Di hl th 100 /L 2 2 2 2 2 2 2 2 2 2 2 2 2trans-1,2-Dichloroethene 100 ug/L <2 <2 <2 <2 <2 <2 <2 <2 <2 <2 <2 <2 <2trans-1,3-Dichloropropene ug/L <1 <1 <1 <1 <1 <1 <1 <1 <1 <1 <1 <1 <1Trichloroethene 5 ug/L <2 <2 <2 <2 <2 <2 <2 <2 <2 <2 <2 <2 <2Trichlorofluoromethane 2100 ug/L <5 <5 <5 <5 <5 <5 <5 <5 <5 <5 <5 <5 <51,2,4-Trichlorobenzene 70 ug/L <1 <1 <1 <1 <1 <1 <1 <1 <1 <1 <1 <1 <11,2-Dichlorobenzene ug/L <1 <1 <1 <1 <1 <1 <1 <1 <1 <1 <1 <1 <11,3-Dichlorobenzene ug/L <1 <1 <1 <1 <1 <1 <1 <1 <1 <1 <1 <1 <11,4-Dichlorobenzene ug/L <1 <1 <1 <1 <1 <1 <1 <1 <1 <1 <1 <1 <1Hexachlorobutadiene ug/L <1 <1 <1 <1 <1 <1 <1 <1 <1 <1 <1 <1 <1Naphthalene 20 ug/L <5 10 10 <5 <5 <5 <5 <5 <5 <5 <5 <5 <5
Notes:Result exceeds Enforcement Standard
Revised 3/16/2010 2:16:37 PMAll surface water values detected below Vermont surface water standards for the protection of human health and aquatic biota. Comparison to water quality standards for aquatic biota is dependent on water hardness for some metals, including Cu, Pb, Ni and Zn. Water hardness data not collected.
New England EnviroStrategies, Inc. Project 09011E03 3/19/2010 Page 1 of 1

Legend
?
NE2S Temporary Groundwater Monitoring Location!( Previous Borings (NE2S)! Previous Borings (Terracon)
Gravel DrivePaved RoadProperty LineStreamTreeline
! ! ! Wetland Boundary! ! ! ! WETLAND BND-FLAGGED-2
0 70 14035Feet
!!
!
!!
!
!!!
!!!
!!!!!!!!!
!!!
!!!
!!!
!!!
!!!
!!
!
!!
!
!!
!
!!
!
!!
!
!!
!
!!
!
!!
!
!!
!
!!!
!!!
!!!
!!!
!!
!
!!
!
!!
!
!!
!
!!!!!!
!!
!
!!
!
!!
!
!!!!!!!!!!
!!
!!
!
!!
!!!!
!!!
!!!
!!!!!!!!!!!!!
!!
!!
!
!!
!
!!
!
!!
!
!!
!
!!
!
!!
!
!
!!
!
!!
!
!!
!
!!
!
!!
!
!!
!
!!
!
!!
!
!!
!
!!
!
!!
!
!!!
!!!
!!!
!!!!!!!!!!
!!
!!
!!
!!!!!!!!!!
!!
!!
!!
! ! ! ! ! ! ! ! ! ! ! !! !
! !
! ! ! ! ! ! ! ! ! !
!!
!!
!!
! !
! !
! !
!
!!!
!!
!!
!!!!
!!
!!
!!
!!
!!
!
! ! !
! ! !
! !!
!!
!
!!
!
!!
!
!!
!
!!
!
!!
!
!!
!
!
! !! ! !
! !
!
!!
!
!!
!
!!
!
!!
!
!!
!
!!
!!
!!
!!
!!
!!
!!
!!
!!
!!
!!
!!
!!
!!
!!
!!
!!
!
RIGHT OF WAY
RIGH
T OF W
AY
N 03°30'59" W 305.93'N 03°30'59" W 266.43'
S 74°
03'25
" E 3
54.50
'
S 89
°03'2
5" E
275
.12'
N 15°56'35" E 180.000'
N 89
°03'2
5" W
256
.19'
S 77
°04'1
7" W
291
.88'
S 06°47'46" E 144.08'
S 61°2
8'35"
W 79.6
6'
N 08°21'31" E 127.29'
R = 4
5.00'
L = 86
.52'
R = 319.00'
L = 163.54'
S
!
!
!
!
!
!
!
!
!
!
!
!
!
!
!
!
!
!
!
!
!!(
!(
!(
!(
!(
!(
!(
!(
!(
?
?
?
NE2S-2
NE2S-9
NE2S-6
NE2S-4 NE2S-5
NE2S-8
NE-3NE2S-7
NE2S-1
!!!
!!!
!
!!
!
!
!
!
!
A
A
A
A
A
A
A
"
#
###
NE2S-14
SW-4 SW-3
SW-2
SW-1
SS-1
MW-7
MW-6
MW-5
MW-4
MW-3
MW-2MW-1
NE2S-23
NE2S-22
NE2S-21
NE2S-20
NE2S-19
NE2S-18
NE2S-17
NE2S-16
NE2S-15
NE2S-13NE2S-12
NE2S-11
NE2S-10
B-9
B-8
B-6
B-5
B-4
B-3
B-2
B-1
B-10
B-20
B-13B-12
B-11
B-19
B-21B-17
B-18
B-14
B-17
B-15
B-16
SUPPLEMENTAL PHASE II ESAOMEGA DRIVE BROWNFIELDS PROJECTBRATTLEBORO, VERMONT
Site Locus and Site Plan
March 2010 Figure 1
NOTES:Site locations are approximate.
DATA SOURCES:Basemap from Revised Existing Conditions Plan (.dwg) by SVE Associates, revised 3/12/10.
Scale:
³
Supplemental Phase II Sample Locations# Surface Water Sample
! GP boring
A GP well
" Surficial Soil Sample
SITE0 2,100 4,2001,050
Feet
0 0.5 10.25
Miles
Data Source: VCGI - Brattleboro Quadrangle (1985) Political Boundaries
SITE COORDINATES: 72°34'43.133"W 42°49'43.758"N
1:24,000
Existing Topo Contour (1 ft)

09
011
E0
4_
18
-Ma
r-2
01
0_
jg
!!
!
!!
!
!!!
!!!
!!!!!!!!!
!!!
!!!
!!!
!!!
!!!
!!
!
!!
!
!!
!
!!
!
!!
!
!!
!
!
!!
!!
!
!!
!
!!!
!!!
!!!
!!!
!!!
!!!
!!
!
!!
!
!!
!!!!
!
!
!
!
!
!
!
!!
!!!!!!!!!!!!
!!
!
!!
!
!!!
!!!
!!!
!!!
!!!!!!!!!!!!
!!
!
!!
!
!!
!
!!
!
!!
!
!!
!
!!!
!!
!
!!
!
!!
!
!!
!
!!
!
!!
!
!
!!
!!
!
!
!!
!!
!
!!!
!!
!
!!!
!!!
!!!
!!!!!!!!!
!
!!
!!
!!
!!
!!!!!!!!!
!
!!
!!
! ! ! ! ! ! ! ! ! ! ! ! ! !
! !
! !! ! ! ! ! ! ! !
! !
! !
!!
!!
! !
! !
! !
!!
!!
!
!!
!!
!!
!!
!!
!!
!!
!!
!
! ! !
! ! !
! !!
!!
!
!!
!
!!
!
!!
!
!!
!
!!!
!
!!
!!
!
! ! !
! ! !
!!
!
!!
!
!!
!
!!
!
!!
!
!!
!!
!!
!!
!!
!!
!!
!!
!!
!!
!!
!!
!!
!!
!!
!!
!!
!!
RIGHT OF WAY
RIG
HT
OF
WA
Y
N 03°30'59" W 305.93'
N 03°30'59" W 266.43'
S 7
4°0
3'2
5" E
3
54.5
0'
S 8
9°0
3'2
5" E
2
75
.12
'
N 15°56'35" E 180.000'
N 8
9°0
3'2
5" W
2
56
.19
'
S 7
7°0
4'1
7" W
2
91.8
8'
S 06°47'46" E 144.08'
S 6
1°2
8'3
5" W
7
9.6
6'
N 08°21'31" E 127.29'
R =
45
.00
'
L =
86
.52
'
R = 3
19.00'
L = 1
63.54'
!!!
!!!
!
!!
!
!
!
!
!
A
A
A
A
A
A
A
"
MW-524
MW-714
SS-115
MW-611
MW-328
MW-219
MW-412
MW-1118
NE2S-239
NE2S-1614
NE2S-2110
NE2S-2216
NE2S-2013
NE2S-1910
NE2S-1811
NE2S-1713
NE2S-1539
NE2S-1257
NE2S-11100
NE2S-10189
NE2S-1433
NE2S-13149
Legend
XRF (wet) Pb (mg/kg)
< 20
21 - 50
51 - 100
101 - 400
> 400
NOTES:
DATA SOURCES:Basemap from Revised Existing Conditions Plan (.dwg) by SVE Associates, revised 3/12/10.
SUPPLEMENTAL PHASE II ESAOMEGA DRIVE BROWNFIELDS PROJECTBRATTLEBORO, VERMONT
Lead Concentrations in Soil
March 2010 Figure 2
Gravel Drive
Paved Road
Property Line
Stream
Treeline
! ! ! ! ! Wetland Boundary
! ! ! ! WETLAND BND-FLAGGED-Existing Topo Contour (1 ft)
y = 1.7099x - 20.033R² = 0.9642
100
150
200
250
300
350
LA
B V
AL
UE
S (
mg
/kg
)
y = 1.7099x - 20.033R² = 0.9642
0
50
100
150
200
250
300
350
0 50 100 150 200
LA
B V
AL
UE
S (
mg
/kg
)
FIELD VALUES (mg/kg)
Regression Plot: Lab Predicted from Field
NE
2S
-15
(6
ft)
NE
2S
-11 (
2 f
t)
NE
2S
-13 (
3-6
in)
NE
2S
-10 (
2 f
t)

0810
9A_1
1-Ju
n-20
09_j
g
!!
!
!!
!
!!!
!!!
!!!!!!!!!
!!!
!!!
!!!
!!!
!!!
!!
!
!!
!
!!
!
!!
!
!!
!
!!
!
!!
!
!!
!
!!
!
!!!
!!!
!!!
!!!
!!
!
!!
!
!!
!
!!
!
!!!!!!
!!
!
!!
!
!!
!
!!!!!!!!!!
!!
!!
!
!!
!!!!
!!!
!!!
!!!!!!!!!!!!!
!!
!!
!
!!
!
!!
!
!!
!
!!
!
!!
!
!!
!
!
!!
!
!!
!
!!
!
!!
!
!!
!
!!
!
!!!
!!!
!!!
!!!
!!
!
!!!
!!!
!!!
!!!!!!!!!!
!!
!!
!!
!!!!!!!!!!
!!
!!
!!
! ! ! ! ! ! ! ! ! ! ! !! !
! !
! ! ! ! ! ! ! ! ! !
! !
! !
!!
!!
! !
! !
!
!!
!
!!
!!!!
!!!!
!!
!!
!!
!!
!
! ! !
! ! !
! ! !
!!
!
!!
!
!!
!
!!
!
!!
!
!!!
!!
!
!
! !! ! !
! !
!
!!
!
!!
!
!!
!
!!
!
!!
!
!!
!!
!!
!!
!!
!!
!!
!!
!!
!!
!!
!!
!!
!!
!!
!!
!!
!
RIGHT OF WAY
RIGH
T OF W
AY
N 03°30'59" W 305.93'N 03°30'59" W 266.43'
S 74°
03'25
" E 3
54.50
'
S 89
°03'2
5" E
275
.12'
N 15°56'35" E 180.000'
N 89
°03'2
5" W
256
.19'
S 77
°04'1
7" W
291
.88'
S 06°47'46" E 144.08'
S 61°2
8'35"
W 79.6
6'
N 08°21'31" E 127.29'
R = 4
5.00'
L = 86
.52'
R = 319.00'
L = 163.54'
S
!!!
!!!
!
!!
!
!
!
!
!
A
A
A
A
A
A
A
"
#
###
SS-1
NE2S-23
NE2S-22
NE2S-21
NE2S-20
NE2S-19
NE2S-18
NE2S-17
NE2S-16
NE2S-14
NE2S-13NE2S-12
NE2S-11
NE2S-10
SW-4606.83
SW-3559.39
SW-2577.89
SW-1594.78
MW-7626.08
MW-6605.06
MW-5586.04
MW-4580.95
MW-3591.92
MW-2604.62
MW-1616.26
NE2S-15
605 600610
595
590
585
580
575
615
620
570
565
560
Supplemental Phase II ESAOMEGA DRIVE BROWNFIELDS PROJECTBRATTLEBORO, VERMONT
Groundwater Contour Map
March 2010 Figure 3
Legend# Surface Water Sample
! GP boring
A GP well
" Surficial Soil Sample
Groundwater Elevation Contour
Existing Topo Contour (1 ft)
Gravel Drive
Paved Road
Property Line
Stream
Treeline! ! ! ! ! Wetland Boundary! ! ! ! WETLAND BND-FLAGGED-2
NOTES:Groundwater elevations based on gauging data collected on March 11, 2010 and elevations of monitoring wells and stream channel sampling locations (at ground surface). Groundwater elevations shown in feet.Site survey data collected by SVE Associates.
DATA SOURCES:Basemap from Revised Existing Conditions Plan (.dwg) by SVE Associates, revised 3/12/10.

APPENDIX A
Resumes of Qualified Staff
I declare that, to the best of my professional knowledge and belief, I meet the definition of Environmental Professional as defined in §312.10 of 40 CFR 312 and I have the specific qualifications based on education, training, and experience to assess a property of the nature, history, and setting of the subject property. I have developed and performed the all appropriate inquiries in conformance with the standards and practices set forth in 40 CFR Part 312.
Muriel S. Robinette, P.G.

New England EnviroStrategies, Inc.
MURIEL S. ROBINETTE President
Business Experience: • Director, Idaho Mining and Minerals Resources Research Institute [1980-1982] • Head, Hydrogeological Investigation Unit, NH Department of Environmental Services [1983- 1987] • Senior Project Manager, Vice President, Branch Manager and member, Board of Directors, GEI Consultants, Inc. [various, 1987 – 1996] • Senior Vice President, Industrial Environmental Business Unit Leader and member, Board of Directors, Haley & Aldrich, Inc. [various, 1996 – 2007] • Member, several non-profit BODs Technical: Muriel is responsible for technical strategy development and management of projects relating to landfills, groundwater, and hazardous waste sites. She has extensive experience in designing and implementing field studies for collection of environmental data to determine impacts to soil, soil gas, sediment, groundwater, and surface water from landfills, industrial sites, mining/mill tailings, Superfund sites, and underground storage tanks. Muriel has conceptually designed and permitted soil, sediments, and groundwater remediation alternatives for metals, petroleum hydrocarbons, polycyclic aromatic hydrocarbons, and volatile organic compounds. Remediation technologies have included air stripping, carbon adsorption, in-situ and ex-situ bioremediation, thermal destruction, vapor extraction, dual-phase extraction, capping, and removal. She has served as technical expert to PRP groups in negotiation and implementation of RD/RAs, and as expert witness for many litigation and mediation cases involving contaminant source determination, cost allocation and site remediation.
Relevant Project Experience
DNAPL Evaluation/Remediation, Confidential Industrial Site, Nebraska. Officer-in-charge of investigation, pilot testing and remedial design of active industrial site with chlorinated solvent DNAPL source. Insitu funnel/gate technology with ZVI for ground water management coupled with dual phase extraction in the source area constitutes the final remedy. Building Decontamination/Permitting, Hatfield, MA. Senior project manager on evaluation and rehabilitation of former manufacturing facility. Air sampling, solids assessment and wipe tests were performed to design cleanup. Confirmatory sampling after remediation was performed, and State and Federal permits for reuse of the facility were obtained. Manufacturing Facilities Due Diligence, Multiple States & China. Officer-in-charge of due diligence investigations at 6 RCRA LQG facilities in CA, OR, and Utah (and Singapore) for confidential buyer. Phase I, II and compliance audits performed to determine environmental liabilities. Assisted in transaction negotiations and assessed permit applications to bring facilities into compliance. RFI Workplan for A1BP, SSFL, California. Officer-in-charge of work plan development including historical document evaluation and employee interviews for the Area 1 Burn Pit facility [within a RCRA corrective action program] at a former aerospace manufacturer.
Education
Washington State University, M.S. Engineering with concentration in Groundwater
University of New Hampshire, B.A. Geology University of Idaho, Post Graduate, Mining Engineering
Professional Registration
2002/Professional Geologist: New Hampshire 1990/Professional Geologist: Maine
Professional Societies
New Hampshire Geological Society New England Association of Engineering Geologists

MURIEL S. ROBINETTE Page2
New England EnviroStrategies, Inc.
Loengart Industry Facility Audit, Loengart, PA. Lead due diligence auditor on RCRA compliance for determination of operational and historical environmental liabilities for acquisition and merger decision. RCRA Corrective Action, Bovano Industries, Cheshire, CT. Officer-in-charge for implementation of RCRA corrective action at metal etching/plating facility. Remedy successfully selected as MNA by EPA. EHS Compliance, Multiple Electrical Substations, Private Utility, New Hampshire. Officer-in-charge on EHS compliance audits for PCB’s at multiple substations. Missouri Electric Works NPL Site, Cape Girardeau, MO. Officer-in-Charge of an innovative technology (ISTD) pilot demonstration at a PCB-contaminated site for a utility PRP consortium. Responsible for work plans, regulatory interactions, field health and safety, QA/QC and expanding the ISTD TSCA permit. Confidential Utility Client Service Yard, Rutland, VT. Officer-in-charge of site evaluation/remediation for PCB contamination from former transformer operations and soil, groundwater and sediment impacts from former MGP site. RCRA Corrective Action, Omaha, NE. Officer-in-charge of Voluntary Interim Measure and final remedy negotiations at former RCRA TSDF. Interim measure included source removal by dual phase extraction. Final remedy selected for groundwater was MNA. Confidential Multi Site Due Diligence, Six States. Project manager for fast track Phase I, Phase II and EHS compliance audits of three laboratories and three manufacturing facilities in six states for merger/acquisition decisions. Completed all work within two weeks and provided compliance mitigation and remedial cost estimates. Lead Contaminated Soil Remediation, Confidential Printing Site, Brattleboro, VT. Performed site assessment and developed Corrective Action Plan for site contaminated with residual lead from printing operation. Obtained permits and managed remediation, site stabilization and closure. Motorolla NPL Site OU2, Phoenix, AZ. Officer-in-Charge to PRP for Workplan negotiation and performance of focused Remedial Investigation of potential source areas affecting indoor air quality of a commercial building within plume of an offsite NPL site. DNAPL Contamination due to Fire Response, PAK 2000 site, Melvin Village, NH. Expert opinion developed and deposition in case involving chlorinated solvent contamination, DNAPL and migration pathways. Opinions were rendered regarding overburden and bedrock water supplies, contaminant flowpaths and insitu natural attenuation site parameters. 3-D computer site models and physical DNAPL demonstration were developed for visual aids. Case settled during trial. Schiavone Scrap Metal Site, North Haven, CT. Technical expert on cost allocation case for a major utility, defending plaintiffs claim regarding widespread PCB contamination in soil. NAPL and wetlands impacts at a scrap yard recycling facility were allegedly contaminated from transformer oils. Rexnord v. Springfield, Massachusetts. Expert witness regarding PCB contamination/ source area evaluation and NCP compliance of remedial actions at former industrial site redeveloped into a school. Expert report and deposition completed. Case settled.
Expert witness for many litigation cases involving contaminant source determination, cost allocation and site remediation

New England EnviroStrategies, Inc.
MICHAEL J. ROBINETTE Sr. Vice President
General Technical Mr Robinette, a founding partner in New England EnviroStrategies, serves as staff scientist on environmental remediation and investigation projects. In this role he performs field data collection, technical file reviews, permitting studies and report writing. In addition, he is in charge of Information Technology and responsible for office and field electronic equipment selection, setup, network maintenance, hardware and software trouble shooting, and e-mail communications. Previous environmental experience includes work at the NHDES as Administrator of the Pre-Remedial Section performing Preliminary Assessments and Site Inspections of contaminated property, and as a Hydrogeologist with BCI Geonetics, as water supply exploration company.
Relevant Project Experience
Studio Rd Site, Bradford, NH Laid out and performed field borings for flooding assessment. Completed technical analysis and figures. PCE Remedial Action, Bennington, VT Performed pre-design field investigation for residual source of PCE at active Shopping Center. Member of field team during implementation of ISCO remedy and subsequent monitoring rounds for remedy tracking. 466 So. Willow St ESA Ph I/II, Manchester, NH Performed drilling and sampling during Phase II ESA for evaluation of RECs from historical operations and abutting properties. Centredale NPL Site, No. Providence, RI Performed environmental forensics regarding historical site operations. CSPA Permitting Studies, Cow Island, NH Lead scientist on field studies and preparation of application for CSPA permit for expanded development in protected shoreland. Dunbarton Rd LF, Manchester, NH Field scientist for annual monitoring of groundwater, gas and surface water at closed MSW landfill. Dry Cleaners PCE Spill Site, Middlebury, VT Field scientist for low flow sampling of onsite monitoring wells for dissolved metals, inorganic parameters and VOCs, including sampling of offsite bedrock water supply wells. Pre-Remedial Investigations, Various Sites, NH Administrator and lead geologist in charge of more than 50 Preliminary Assessments and Site Inspections performed on contaminated sites under the EPA grant to NHDES. Scope of these environmental assessments included background file reviews, site inspections, sampling of environmental media at selected sites, analyses and development of reports. Potential Water Supply Development, various locations, NE – Staff Hydrogeologist on field investigations, geophysical surveys, and pump tests for water supply development at various locations within New England.
Environmental Hydrogeologist Sr. Vice President – New England EnviroStrategies, Inc. 10 years as environmental consultant 9 years as Environmental Regulator with NH Department of Environmental Services
Education
B.A. in Geology, 1974, University of New Hampshire; M.S. in Hydrology, 1979, University of Idaho; Post Graduate Water Resources Engineering, Washington State University, 1979-1981
Professional Registration
1982/Professional Geologist: Idaho
Professional Societies
New Hampshire Geological Society, past president and member of Board of Directors American Society of Foundation Engineers

New England EnviroStrategies, Inc.
SHELLEY H. FROST, PG, PE Staff Engineer
Ms. Frost is a geological engineer specializing in site hydrogeological characterization and regulatory compliance. She has directed and participated in Phase I and II petroleum and hazardous site evaluations, aquifer testing, geophysical characterization, and ground water sampling events for large ground water monitoring systems. Other experience includes numerically modeling contaminant transport in ground water; geochemical analysis of the impact of aerating sediments on metals-laden lagoon water; municipal landfill gas sampling and characterization; landfill cap design; storm water sampling; storm water drainage analysis; storm water pollution prevention plans; spill prevention, control and countermeasure plans; above ground tank inspections; superfund site water and soil sampling and data validation reporting; and petroleum-impacted remedial actions and associated cost reimbursements
Relevant Project Experience
Phase II Comprehensive Site Characterization; Gasoline Station, Boylston, Massachusetts; Project Engineer. Conducted a Phase II Comprehensive Site Characterization associated with petroleum release migration at a gasoline station located on an extensively filled area surrounded by residences and underlain by fractured bedrock. Characterization activities include permeability testing of saturated soils and an assessment of the magnitude and extent of impacts to ground water and residual soil impacts near the location of a former underground storage tank (UST). Risk characterization was used to evaluate possible remedial action requirements. Preliminary Site Investigations, State Of New Hampshire Department Of Transportation (NHDOT) Sites, Canaan And New London, New Hampshire; Project Engineer. Conducted test pitting, soil boring/monitoring well installation, and ground water sampling to investigate NHDOT sites where asphalt mixing, solid waste and tar-barrel disposal took place. Investigated potential oil releases to the ground surface. Reported historical site usage as observed from aerial photographs, characterized and reported solid wastes and distribution of oil-based asphalt and tar, and recommended limited further investigation of areas where petroleum constituents in soils exceeded regulatory standards, to provide basis for remediation costing. West First Street Investigation, Boston, MA (chlorinated solvent site); Project Engineer Investigated the presence and distribution of high concentrations of chlorinated solvents in low-permeability soils at a former warehouse in a densely developed industrial section of Boston. The property was under consideration for development as high-end near-waterfront residences. Phase II Site Investigation, New Hampshire Ball Bearing, Laconia, NH; Project Engineer Investigated the source of oil repeatedly observed in a stormwater conveyance ditch at an industrial facility located adjacent to an abandoned building that formerly housed an operation using chlorinated. Installed five wells and conducted smoke-screening tests to identify the inlet of pipes discharging to the ditch. Petroleum Release Investigation, Brookline, MA; Project Engineer Investigated the source of petroleum located between two apartment buildings. Collected samples for petroleum-fingerprinting analysis to analyze source of petroleum.
Education
B.S. Geological Engineering, Michigan Technological University 1984 M.S. Civil Engineering, University of New Hampshire 1991 Professional Geologist and Engineer licenses, New Hampshire, Vermont

SHELLEY H. FROST, PG, PE Page2
New England EnviroStrategies, Inc.
Supplemental Environmental Investigation, Revere, MA (PCB); Project Engineer Investigated the source and distribution of petroleum and polychlorinated biphenyls, and soil strength parameters for the underlying clay, at a former gift bow-manufacturing facility. The existing warehouse was razed and the property reused for construction of a professional office building. Multiple Site Investigations, South Boston, MA; Project Engineer Oversaw and reported excavation of test pits, soil drilling and well installation at locations of approximately twelve razed residences, to identify potentially reportable environmental condition before construction of new residences. Supplemental Environmental Investigation, Revere, MA; Project Engineer Conducted a drilling program to investigate residual polychlorinated biphenyl compounds (PCBs) and volatile organic compounds in soil, at the location of a former bow manufacturing plant that was to be razed and replaced with housing. Oversaw test pitting and drilling, installed four wells, and collected soil and water samples; identified areas requiring remediation, researched local and regional hydrogeology, reviewed results relative to the Massachusetts Contingency Plan, and prepared a report of the investigation. Polychlorinated Biphenyl (PCB) Soil Remediation Investigation, Brentwood, NH; Project Engineer Investigated and reported the distribution and concentration of PCBs in shallow soil, using field assay tests on soil samples collected with direct push drilling equipment. Quality control consisted of one laboratory sample per 10 field samples, and duplicate field samples. Plotted and contoured results, using the plots to estimate costs for soil remediation Gasoline Release Migration, East Boston, Massachusetts; Project Engineer Investigated site soil for the source of petroleum products observed in previous borings at the property and nearby properties. Directed the field program, including drilling; soil groundwater and free-phase petroleum sampling; and slug testing. Later performed a supplemental investigation to identify the downgradient extent of contamination.
Work Plan for Investigation into Impact of Septic Systems Upon Groundwater and Coastal Seawater, Provincetown, MA, Project Scientist Devised a plan to sample groundwater from local private wells, chose wells and recommended analytical parameters. CERCLA Site Remediation Design, Augusta, ME, Project Engineer Authored a Soil Blending Memorandum, which summarized calculations of the amount of PCB-contaminated soils and median concentrations in each phase of excavation for the site, and recommended alternative phasing/blending for soils which did not meet acceptance criteria. Report of Impact of Surface Impoundments on Groundwater Quality, and Interim Groundwater Assessment Reports, Geismar, LA Associate Project Engineer Conducted, interpreted and reported results of an electromagnetic survey, subsequent well installations, and soil and water analyses, to determine extent of contamination from surface impoundments. Reviewed state documentation of groundwater quality in multiple water-bearing strata based on five surrounding chemical plants, and from this information prepared local and site chemical and potentiometric maps; evaluated local geology based upon regional geology and local borehole logs (the USGS had not defined aquifer systems in this area).

New England EnviroStrategies, Inc.
JAMES R. GAYNOR Staff Scientist/GIS Specialist
Mr. Gaynor is a geologist specializing in Geographic Information Systems and database administration. He has developed comprehensive relational databases for managing environmental data, along with both 2D and 3D spatial representations of environmental characterization data for visual interpretation and analysis. Mr. Gaynor is responsible for administrating a companywide environmental database for all active sites. Mr. Gaynor has experience conducting Phase I and II Environmental Site Assessments for both petroleum and hazardous waste sites; aquifer testing and characterization; surface water quality monitoring; groundwater quality monitoring; large groundwater withdrawal monitoring; soil and soil vapor characterization; various remedial site activities; maintenance, calibration and deployment of technical field monitoring equipment; operation and maintenance of groundwater remediation systems; and geophysical characterization.
Relevant Project Experience
Phase II-IV Environmental Site Assessment and Remediation, Quechee, VT; Hydrogeologist Characterized extent of contamination resulting from a residential fuel oil release. Implemented remedial measures including limited excavation and disposal, partial replacement of building foundation and slab, vapor barrier installation, sub-slab depressurization/venting. Corrective Action Plan Implementation and Evaluation, Bennington, VT; GIS Specialist Developed a comprehensive spatial database of groundwater characterization data for Implementation of Corrective Actions involving chemical oxidation chlorinated VOCs in groundwater for a former launderette site. Developed GIS posting figures for evaluation of corrective actions and regulatory reports. Environmental Site Assessments, New Hampshire, Vermont, and Massachusetts; Project Scientist Conducted Phase I/II ASTM ESAs on properties ranging from former mill buildings and large industrial facilities to undeveloped 20+ acre properties. Phase II-V Environmental Site Assessment and Remediation, various, Massachusetts; Hydrogeologist Characterized extent of contamination resulting from various residential fuel oil releases. Implemented various remedial measures including in-situ chemical oxidation, excavation and disposal, and vapor mitigation. Completed regulatory reports for these activities. Phase II-IV Environmental Site Assessment, Beverly, MA; Hydrogeologist Characterized extent of #6 fuel oil DNAPL and groundwater plume from an historic 2,000 gallon #6 fuel oil UST release located beneath site condominium development. Due to the nature of free product and subsurface conditions, DNAPL had been stable for 20+ years and posed no significant threat to public safety, welfare or the environment. The outcome of Risk Characterization justified implementation of a periodic Groundwater Monitoring Program, as there were no viable remediation alternatives for the site. Conceptual Site Model Development, Manchester, NH; GIS Specialist Developed a comprehensive spatial database of environmental characterization data for historic PCE release bulk storage and distribution facility. Products included 3D models of site
Education
B.S. Geology, University of Puget Sound Tacoma
WA 2001
Candidate MS Geology, University of New
Hampshire, December 2010
NHTI Advanced Database
Course – April 2009

JAMES R. GAYNOR Staff Scientist/GIS Specialist. Page2
New England EnviroStrategies, Inc.
stratigraphy and environmental characterization data based on 60+ subsurface borings and USGS Digital Elevation Model. Conceptual Site Model for Superfund Litigation Support, North Providence, RI; GIS Specialist Developed a comprehensive spatial database of environmental characterization data for historic chemical manufacturing and drum reconditioning facility located on a former industrial mill property along the Woonasquatucket River. Developed high resolution 3D site models based on photogrammetric analysis showing spatial distribution of Dioxin in soil and river sediments. Generated 2D/3D map products for litigation support. Surface Water Monitoring Program and Trace Metals Analysis, Greenland/North Hampton, NH; Staff Scientist Completed ‘clean hands technique’ trace metals sampling and low detection limit surface water field monitoring program for a potential development site along an environmentally sensitive brook. Responsible for coordinating field monitoring, equipment maintenance, calibration, and deployment, as well as database development and regulatory reporting. Baseline conditions were documented and used to create a storm water treatment program to improve surface water quality for the brook. Phase IV/V Groundwater Treatment and Monitoring, Condominium Development Beverly, MA; Hydrogeologist Conducted groundwater monitoring and operation and maintenance activities for a large Air Sparge/Dual Phase Extraction remedial treatment system for a former bulk fuel oil tank farm. Conducted regulatory reporting and correspondence between various project stakeholders and attented public information forums due to concerns over public health and safety. Natural Resource Inventory, Moultonborough, NH; GIS Specialist Developed a comprehensive spatial database, 2D/3D map products, and co-occurrence model of available natural resource data including surface waters, wetlands, riparian and wetland buffers, wellhead protection areas, aquifer resources, wildlife habitat and recreational/historical resources. Attended public information and local Conservation Commission forums and incorporated public comments and recommendations into final project deliverable. Large Groundwater Withdrawal Monitoring Program, Greenland, NH; Geologist Conducted continuous groundwater level monitoring via a network of remote data loggers in order to maintain regulatory compliance for a Large Groundwater Withdrawal Permit. Responsible for equipment maintenance, calibration and deployment, and quarterly regulatory report submittals.

APPENDIX B
Field Notes and XRF Information


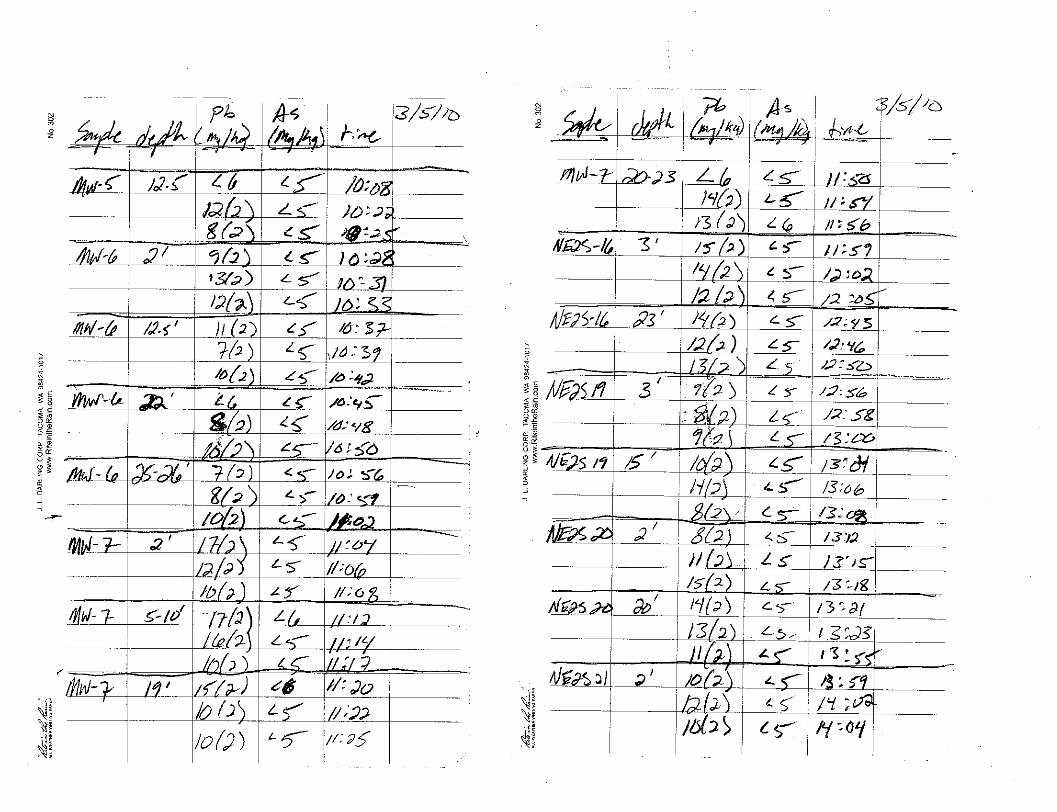


X-ray fluorescence (XRF) Sampling Soil samples to be analyzed by X-ray fluorescence (XRF) were prepared, bagged, and homogenized prior to field analysis. At the commencement of field activities (March 4, 2010) samples were determined to have high moisture content and high silt/clay fraction, precluding the use of either 10-mesh or 60-mesh sieves in field sample preparation, as specified in the original workplan and follow-up correspondence with EPA. Field sample preparation therefore included breakdown of the sample with a nitrile-gloved hand, removal of gravel and debris, and homogenization of the moist sample in a sealed plastic bag. XRF analysis was run at least three (3) times at an automated count of 120 seconds from different sections of the bagged sample in order to assess sample homogeneity and/or consistency of instrument response. A minimum of 10% of the field-prepared samples collected on March 4, 2010 were dried, sieved through 60-mesh screen, and re-analyzed with XRF for confirmation of field results. Samples were dried in dedicated foil containers in a clean oven. Sieves were decontaminated with non-ionic surfactant wash using municipal water and dried prior to each use. Sieved samples were transferred into new plastic bags, homogenized, and analyzed with the XRF three (3) times at an automated count of 120 seconds from different sections of the bagged sample. Dry-prepared samples were also submitted for laboratory analysis of lead for confirmation of XRF results.

XRF DataSupplemental Phase II ESAOmega Drive Brownfields ProjectBrattleboro, Vermont
As (Field) As (Dry)Value
(mg/kg)Mean
(mg/kg)Value
(mg/kg)Mean
(mg/kg)Value
(mg/kg)Value
(mg/kg)NE2S-10 0.5 29 28 <6
28 <628 <6
NE2S-10 2.0 203 189 272 278 <10 <13166 278 <10 <13199 283 <10 <13
NE2S-10 6.0 6 7 <48 <5
<5 <4NE2S-11 0.5 96 94 <8
83 <8103 <8
NE2S-11 2.0 49 100 163 161 <6 <11126 164 <9 <11124 156 <9 <11
NE2S-11 6.0 8 9 <49 <4
10 <4NE2S-12 0.5 50 57 8
62 <860 <7
NE2S-12 2.0 7 10 <512 <510 <5
Pb (Dry)Pb (Field)
Boring ID Depth (ft)
XRF
10 <5NE2S-12 6.0 10 11 <5
12 <510 <5
NE2S-13 0.5 152 149 189 204 <10 <12203 223 <11 <13121 201 <9 <12118 <9
NE2S-13 2.0 10 13 <515 <514 <5
NE2S-13 6.0 15 12 <511 <511 <5
NE2S-14 0.5 36 33 <633 <630 <6
NE2S-14 2.0 28 31 <637 <628 <5
NE2S-14 6.0 26 27 <5

XRF DataSupplemental Phase II ESAOmega Drive Brownfields ProjectBrattleboro, Vermont
As (Field) As (Dry)Value
(mg/kg)Mean
(mg/kg)Value
(mg/kg)Mean
(mg/kg)Value
(mg/kg)Value
(mg/kg)
Pb (Dry)Pb (Field)
Boring ID Depth (ft)
XRF
21 <533 <5
NE2S-15 0.5 46 39 <633 <638 <6
NE2S-15 2.0 40 42 <636 <650 <7
NE2S-15 6.0 16 12 18 16 <5 <66 15 <5 7
13 15 <5 <6NE2S-16 3.0 15 14 <5
14 <512 <5
NE2S-16 23.0 14 13 <512 <513 <5
NE2S-17 3.0 14 13 <511 <514 <5
NE2S-17 16.0 14 11 <510 <58 <5
NE2S 18 3 0 17 13 5NE2S-18 3.0 17 13 <59 <5
12 <5NE2S-18 8.0 13 11 <5
11 <59 <5
DUP (18) 3.0 16 11 <58 <69 <5
NE2S-19 3.0 9 9 <58 <59 <5
NE2S-19 15.0 10 10 <511 <58 <5
NE2S-20 2.0 8 11 <511 <515 <5
NE2S-20 20.0 14 13 <513 <5

XRF DataSupplemental Phase II ESAOmega Drive Brownfields ProjectBrattleboro, Vermont
As (Field) As (Dry)Value
(mg/kg)Mean
(mg/kg)Value
(mg/kg)Mean
(mg/kg)Value
(mg/kg)Value
(mg/kg)
Pb (Dry)Pb (Field)
Boring ID Depth (ft)
XRF
11 <5NE2S-21 2.0 10 11 <5
12 <510 <5
NE2S-21 23.0 11 10 <512 <58 <5
NE2S-22 2.0 16 16 <521 <511 <5
NE2S-23 1.0 9 9 <5<6 <58 <5
NE2S-23 5.0 8 9 <57 <5
11 <5NE2S-23 8.0 <7 7 <5
7 <57 <5
MW-1 1.0 131 118 <9115 <9109 <8
MW-1 2.0 13 12 810 510 <514 <5
MW-1 7.0 13 14 <516 <512 7
MW-2 2.0 24 19 <518 <516 <5
MW-2 12.5 13 15 <514 <517 <5
MW-3 2.0 30 28 <633 <622 6
MW-3 10.5 <6 6 <5<5 <46 <5
MW-4 2.0 13 12 <511 <513 <5

XRF DataSupplemental Phase II ESAOmega Drive Brownfields ProjectBrattleboro, Vermont
As (Field) As (Dry)Value
(mg/kg)Mean
(mg/kg)Value
(mg/kg)Mean
(mg/kg)Value
(mg/kg)Value
(mg/kg)
Pb (Dry)Pb (Field)
Boring ID Depth (ft)
XRF
MW-4 7.5 11 9 <57 <5
10 <5MW-4 12.5 9 10 <5
12 <510 <5
MW-5 2.0 37 24 <619 <616 <5
MW-5 12.5 <6 10 <512 <58 <5
MW-6 2.0 9 11 <513 <512 <5
MW-6 12.5 11 9 <57 <5
10 <5MW-6 22.0 <6 9 <5
8 <510 <5
MW-6 26.0 7 8 <58 <58 <5
10 <5MW-7 2.0 17 13 <5
12 <510 <5
MW-7 10.0 17 14 <616 <510 <5
MW-7 19.0 15 12 <610 <510 <5
MW-7 23.0 <6 14 <514 <513 <6
SS-1 0.5 21 15 <58 <5
16 <5SITE MEAN 27Total # of samples: 56

APPENDIX C
Laboratory Data Sheets


APPENDIX D
Tier II Data Validation Results
DATA VALIDATION - COVER SHEETSupplemental Phase II ESAOmega Drive Brownfields ProjectBrattleboro, VT
Data Reviewed By Shelley Frost
Date 3/17/2010
NE2S Project No. 09011E04
Project Title Supplemental Phase II ESA
Laboratory Eastern Analytical, Inc.
Lab Project Numbers 87078, 87132. 87244, 87245
Chain of Custody Present? Yes
Chain of Custody Complete? YesAll Requested Analyses Performed? Yes
Case Narrative Present? YesAll Samples Properly Preserved? YesRange in Field Duplicate RSDs?
11-21% (soil metals); 0% (soil TPH, both samples ND); 0% (Soil VOCs) 0% (3 sets groundwater metals); 29% (groundwater TPH); 0-
Data Completeness (=# of valid measurements/# of measurements planned*100) >100% (due to conditions in field)
Laboratory Contacted? Yes
Date 3/4/10, 3/11/10, 3/17/10Name(s) of Lab Personnel Contacted Sample receiving personnel (Jenn Lane, Michael Becker), Scott Kelley
Subject Added several samples to be analyzed.
Resolution TPH was added to analyte list
Qualifying Footnotes:A Result is estimated due to exceedence of holding times
B Result is estimated due to surrogate recovery outside of QC limitsReported result should be considered laboratory contamination due tolevels detected in the associated laboratory blank
C Reported result should be considered laboratory contamination due tolevels detected in the sample.
D Reporting limit is elevated due to the presence of non-target analytesdetected in the sample.
E Reporting limit is elevated due to matrix effect.F Result is due to gross exceedance of _____________________criteria.

DATA VALIDATION - LABORATORY RESULTSSupplemental Phase II ESA Omega Drive Brownfields ProjectBrattleboro, VT
Parameter Matrix Number of Samples Proposed
Number of Samples Collected
Analytical Method
(SW-846)
Surrogate Recoveries
Meet Criteria?
Maximum Holding
Time (from date of
collection to
Holding Time Met?
Method Blank Contamination
Lab Control Sample (LCS), LCS Duplicate Recoveries and RPDs
Acceptable?
Reporting Limits Less Than or Equal to
Regulatory Limits?
VOCs Soil 10 10 8260B Yes 14 days Yes None Yes Yes
SVOCs (PAHs) Soil 10 10 8270 Yes 14 days Yes None Yes Yes
TPHs Soil 10 10 8100 Yes 14 days Yes None Yes Yes
PCBs Soil 10 10 8082 Yes 14 days Yes None Yes Yes
PP Metals Soil 10 10 200.8 Yes 28 days (Hg); 6 mos. (other) Yes None Yes Yes
VOCs Water 3 +1 trip blank
3 +1 trip blank 8260B Yes 14 days Yes None Yes Yes1
SVOCs (PAHs) Water 4 +1 trip
blank 4 +1 trip
blank 8270 Yes 7 days Yes None Yes Yes
TPHs Water 5 +1 trip blank
5 +1 trip blank 8100 Yes 14 days Yes None Yes NA
PP Metals Water 3 + 1 trip blank
3 + 1 trip blank
200.8, 6020 (Hg) Yes 28 days (Hg);
6 mos (other) Yes None Yes YesPP Metals Water blank blank (Hg) Yes 6 mos. (other) Yes None Yes Yes
NOTES:1. The detection limit of 1 microgram per liter (μg/L) for 1,2-Dibromo-3-chloropropane was greater than the regulatory limit, a regional screening level of 0.2 μg/L.
However, the compound is a pesticide and is not anticipated to be present, based on historical property use.

Laboratory QC ReviewSupplemental Phase II ESA Omega Drive Brownfields ProjectBrattleboro, VT
Acceptable Percent Recovery?
Acceptable LCS
Recovery Limits (Soil)
Acceptable LCS Recovery Limits (Water)
Acceptable RPD Limit Soil/Water
Within Acceptable RPD Limit?Compound NE2S Samples
Laboratory Control Samples (soil +/- water)
Duplicate Laboratory
Control Samples (soil +/- water)
VOCs - 8260B Soil Water1,1-Dichloroethene NA NA Yes Yes 59-172 61-145 30/30 YesBenzene NA NA Yes Yes 66-142 76-127 30/30 YesTrichloroethene NA NA Yes Yes 62-137 71-120 30/30 YesToluene NA NA Yes Yes 59-139 76-125 30/30 YesChlorobenzene NA NA Yes Yes 60-133 75-130 30/30 Yes4-Bromofluorobenzene (surr) Yes1 Yes Yes Yes 74-121 86-115 50/50 Yes1,2-Dichlorobenzene-d4 (surr) Yes1 Yes Yes Yes 80-120 80-120 50/50 YesToluene-d8 (surr) Yes1 Yes Yes Yes 70-130 70-130 50/50 Yes
TPH (C9 - C40) - 8100 mod NA NA Yes Yes 30-160 30-160 30/20 Yesp-Terphenyl-D14 (surr) Yes Yes Yes Yes 30-130 30-130 NA NA
METALS - 6020 Soil Water YesAntimony NA NA Yes Yes 80-120 75-125 20/20 YesArsenic NA NA Yes Yes 80-120 75-125 20/20 YesBeryllium NA NA Yes Yes 80-120 75-125 20/20 YesCadmium NA NA Yes Yes 80-120 75-125 20/20 YesChromium NA NA Yes Yes 80-120 75-125 20/20 YesCopper NA NA Yes Yes 80-120 75-125 20/20 YesLead NA NA Yes Yes 80-120 75-125 20/20 YesMercury NA NA Yes Yes 80-120 75-125 20/20 YesNickel NA NA Yes Yes 80-120 75-125 20/20 YesSelenium NA NA Yes Yes 80-120 75-125 20/20 YesSilver NA NA Yes Yes 80-120 75-125 20/20 YesThallium NA NA Yes Yes 80-120 75-125 20/20 YesZinc NA NA Yes Yes 80-120 75-125 20/20 Yes
NOTES:1. Surrogate recoveries for NE2S-17 significantly exceeded upper acceptable limits, indicating enhanced VOC recovery: however, no VOCs were
detected in the sample.

Field QC Results Review - SoilsSupplemental Phase II ESA Omega Drive Brownfields ProjectBrattleboro, VT
Sample Identification: DUP-3 NE2S-18
Saple Depth (ft): 2.5 2.5Sample Date: 3/5/2010 3/5/2010 A-B (A+B)/2 2*(A-B)/(A+B)
Hydrocarbon (8100mod)TPH (C9-C40) <13 <13 - - 0VOAs (8260B)1,1,1,2-Tetrachloroethane <0.05 <0.05 - - 01,1,1-Trichloroethane <0.05 <0.05 - - 01,1,2,2-Tetrachloroethane <0.05 <0.05 - - 01,1,2-Trichloroethane <0.05 <0.05 - - 01,1-Dichloroethane <0.05 <0.05 - - 01,1-Dichloroethene <0.05 <0.05 - - 01,1-Dichloropropene <0.05 <0.05 - - 01,2,3-Trichlorobenzene <0.05 <0.05 - - 01,2,3-Trichloropropane <0.05 <0.05 - - 01,2,4-Trimethylbenzene <0.05 <0.05 - - 01,2-Dibromo-3-chloropropane <0.05 <0.05 - - 01,2-Dibromoethane <0.05 <0.05 - - 01,2-Dichloroethane <0.05 <0.05 - - 01,2-Dichloropropane <0.05 <0.05 - - 01,3,5-Trimethylbenzene <0.05 <0.05 - - 01,3-Dichloropropane <0.05 <0.05 - - 02,2-Dichloropropane <0.05 <0.05 - - 02-Butanone <0.5 <0.5 - - 02-Chlorotoluene <0.05 <0.05 - - 02-Hexanone <0.1 <0.1 - - 04-Chlorotoluene <0.05 <0.05 - - 04-Methyl-2-pentanone <0.5 <0.5 - - 0Acetone <2 <2 - - 0Benzene <50 <50 - - 0
Relative Percent Difference Calculation
Bromobenzene <0.05 <0.05 - - 0Bromochloromethane <0.05 <0.05 - - 0Bromodichloromethane <0.05 <0.05 - - 0Bromoform <0.05 <0.05 - - 0Bromomethane <0.1 <0.1 - - 0Butylbenzene <0.05 <0.05 - - 0Carbon disulfide <0.1 <0.1 - - 0Carbon tetrachloride <0.05 <0.05 - - 0Chlorobenzene <0.05 <0.05 - - 0Chloroethane <0.1 <0.1 - - 0Chloroform <0.05 <0.05 - - 0Chloromethane <0.1 <0.1 - - 0

Field QC Results Review - SoilsSupplemental Phase II ESA Omega Drive Brownfields ProjectBrattleboro, VT
Sample Identification: DUP-3 NE2S-18
Saple Depth (ft): 2.5 2.5
Relative Percent Difference Calculation
cis-1,2-Dichloroethene <0.05 <0.05 - - 0cis-1,3-Dichloropropene <0.05 <0.05 - - 0Dibromochloromethane <0.05 <0.05 - - 0Dibromomethane <0.05 <0.05 - - 0Dichlorodifluoromethane <0.1 <0.1 - - 0Ethylbenzene <0.05 <0.05 - - 0Isopropylbenzene <0.05 <0.05 - - 0m,p-Xylenes <0.05 <0.05 - - 0Methyl tert butyl ether <0.1 <0.1 - - 0Methylene chloride <0.1 <0.1 - - 0o-Xylene <0.05 <0.05 - - 0Propylbenzene <0.05 <0.05 - - 0Styrene <0.05 <0.05 - - 0tert-Butylbenzene <0.05 <0.05 - - 0Tetrachloroethene <0.05 <0.05 - - 0Tetrahydrofuran <0.5 <0.5 - - 0Toluene <0.05 <0.05 - - 0trans-1,2-Dichloroethene <0.05 <0.05 - - 0trans-1,3-Dichloropropene <0.05 <0.05 - - 0Trichloroethene <0.05 <0.05 - - 0Trichlorofluoromethane <0.1 <0.1 - - 01,2,4-Trichlorobenzene <0.05 <0.05 - - 01,2-Dichlorobenzene <0.05 <0.05 - - 01,3-Dichlorobenzene <0.05 <0.05 - - 01,4-Dichlorobenzene <0.05 <0.05 - - 0Hexachlorobutadiene <0.05 <0.05 - - 0Naphthalene <0.1 <0.1 - - 0.0
Sample Identification: DUP-1 MW-2 RPD DUP-2 NE2S-11 RPDSample Date: 3/3/2010 3/3/2010 3/4/2010 3/4/2010Metals (6020)AntimonyArsenic 2.8 2.1 29% 2.7 3 11%BerylliumCadmiumChromiumCopperLead 20 27 30% 130 160 21%MercuryNickelSeleniumSilverThalliumZinc

Field QC Results Review - GroundwaterSupplemental Phase II ESA Omega Drive Brownfields ProjectBrattleboro, VT
MW-2 MW-2D
Metals (6020) mg/L A B A-B A+B (A-B)/(0.5*(A+B))
Antimony <0.001 <0.001Arsenic <0.001 <0.001Beryllium <0.001 <0.001Cadmium <0.001 <0.001Chromium <0.001 <0.001Copper <0.001 <0.001Lead 0.001 <0.001Mercury <0.0001 <0.0001Nickel 0.001 0.001 0.000 0.002 0%Selenium <0.001 <0.001Silver <0.001 <0.001Thallium <0.001 <0.001Zinc <0.005 <0.005Hydrocarbon (8100mod) mg/LTPH (C9-C40) 0.4 0.3 0.1 0.7 29%VOAs (8260B) μg/L1,1,1,2-Tetrachloroethane <2 <21,1,1-Trichloroethane <2 <21,1,2,2-Tetrachloroethane <2 <21,1,2-Trichloroethane <2 <21,1-Dichloroethane <2 <21,1-Dichloroethene <1 <11,1-Dichloropropene <2 <21,2,3-Trichlorobenzene <1 <11,2,3-Trichloropropane <2 <21,2,4-Trimethylbenzene 20 21 -1 41 5%1,2-Dibromo-3-chloropropane <1 <11,2-Dibromoethane <1 <11,2-Dichloroethane <2 <21,2-Dichloropropane <2 <21,3,5-Trimethylbenzene 4 5 -1 9 22%1 3 Dichloropropane <2 <2
Relative Percent Difference Calculation
1,3-Dichloropropane <2 <22,2-Dichloropropane <2 <22-Butanone <10 <102-Chlorotoluene <2 <22-Hexanone <10 <104-Chlorotoluene <2 <24-Isopropyltoluene <1 <14-Methyl-2-pentanone <10 <10Acetone <10 <10Benzene <1 <1Bromobenzene <2 <2Bromochloromethane <2 <2Bromodichloromethane <1 <1Bromoform <2 <2Bromomethane <2 <2Butylbenzene <1 <1Carbon disulfide <5 <5Carbon tetrachloride <2 <2

Field QC Results Review - GroundwaterSupplemental Phase II ESA Omega Drive Brownfields ProjectBrattleboro, VT
MW-2 MW-2D
Metals (6020) mg/L A B A-B A+B (A-B)/(0.5*(A+B))
Relative Percent Difference Calculation
Chlorobenzene <2 <2Chloroethane <5 <5Chloroform <2 <2Chloromethane <2 <2cis-1,2-Dichloroethene <2 <2cis-1,3-Dichloropropene <1 <1Dibromochloromethane <2 <2Dibromomethane <2 <2Dichlorodifluoromethane <5 <5Diethyl ether <5 <5Ethylbenzene 8 9 -1 17 12%Isopropylbenzene <1 <1m,p-Xylenes 30 32 -2 62 6%Methyl tert butyl ether <5 <5Methylene chloride <5 <5o-Xylene 15 16 -1 31 6%Propylbenzene 2 2 0 4 0%sec-Butylbenzene <1 <1Styrene <1 <1tert-Butylbenzene <1 <1Tetrachloroethene <2 <2Tetrahydrofuran <10 <10Toluene <1 <1trans-1,2-Dichloroethene <2 <2trans-1,3-Dichloropropene <1 <1Trichloroethene <2 <2Trichlorofluoromethane <5 <51,2,4-Trichlorobenzene <1 <11,2-Dichlorobenzene <1 <11,3-Dichlorobenzene <1 <11,4-Dichlorobenzene <1 <1Hexachlorobutadiene <1 <1Naphthalene 10 10 0 20 0%p
Sample Identification: MW-3 Dup (MW-3) RPD MW-2 Dup (MW-2) RPDResult Result (%) Result Result (%)
Metals (6020) mg/LAntimony <0.001 <0.001 <0.001 <0.001Arsenic <0.001 <0.001 <0.001 <0.001Beryllium <0.001 <0.001 <0.001 <0.001Cadmium <0.001 <0.001 <0.001 <0.001Chromium <0.001 <0.001 <0.001 <0.001Copper <0.001 <0.001 <0.001 <0.001Lead <0.001 <0.001 0.001 <0.001Mercury <0.0001 <0.0001 <0.0001 <0.0001Nickel 0.004 0.004 0 0.001 0.001 0Selenium <0.001 <0.001 <0.001 <0.001Silver <0.001 <0.001 <0.001 <0.001Thallium <0.001 <0.001 <0.001 <0.001Zinc <0.005 <0.005 <0.005 <0.005