
SUPPLEMENTAL METHODS Immunodetectionsedoc.mdc-berlin.de/15794/7/15794suppl.pdfRoche Diagnostics,...
26
1 SUPPLEMENTAL METHODS Immunodetections Antibodies against SORLA were generated in-house. The following antibodies were purchased from commercial suppliers: HSL (4107), pHSL (4139), pIR (3024), IR (3025), adiponectin (2789), AKT (4691), and pAKT (2965) (all from Cell Signaling); PDE3β (Santa Cruz, sc-11838), α-tubulin (Chalbiochem, CP06), PKA (Abcam, 136960), EEA1 (610456), VTI1B (611404), VTI1A (611220), RAB11 (610657), AP1 (610385) (BD Transduction Laboratories), RAB9 (Thermo Fisher Scientific, MA3- 067), and calnexin (Stressgen, SPA-860). Substances for treatment of explants included IBMX (Sigma, 101134953), insulin (Sigma, I9278), forskolin (Fluka, 93049), L(-) norepinephrine (Sigma, A9512), and (-) isoproterenol (Sigma, I2760). Immunodetection of proteins by Western blotting or on fixed cells and paraffin- embedded tissue sections was carried out according to standard procedures. Histology Mouse tissues were dissected and fixed in 4% PFA/PBS over night at 4°C. After 1 hour of washing in PBS, the tissues were dehydrated and embedded in paraffin. The tissues were cut in 10 μm sections on a rotary microtome (Rm2155, Leica microsystems GmbH, Germany), and standard hematoxylin and eosin staining was performed. CHO cell studies Chinese hamster ovary (CHO) cells stably overexpressing human SORLA have been described before (1). Replicate cell layers were grown on coverslips in DMEM with
Transcript of SUPPLEMENTAL METHODS Immunodetectionsedoc.mdc-berlin.de/15794/7/15794suppl.pdfRoche Diagnostics,...
1
SUPPLEMENTAL METHODS
Immunodetections
Antibodies against SORLA were generated in-house. The following antibodies were
purchased from commercial suppliers: HSL (4107), pHSL (4139), pIR (3024), IR
(3025), adiponectin (2789), AKT (4691), and pAKT (2965) (all from Cell Signaling);
PDE3β (Santa Cruz, sc-11838), α-tubulin (Chalbiochem, CP06), PKA (Abcam,
136960), EEA1 (610456), VTI1B (611404), VTI1A (611220), RAB11 (610657), AP1
(610385) (BD Transduction Laboratories), RAB9 (Thermo Fisher Scientific, MA3-
067), and calnexin (Stressgen, SPA-860). Substances for treatment of explants
included IBMX (Sigma, 101134953), insulin (Sigma, I9278), forskolin (Fluka,
93049), L(-) norepinephrine (Sigma, A9512), and (-) isoproterenol (Sigma, I2760).
Immunodetection of proteins by Western blotting or on fixed cells and paraffin-
embedded tissue sections was carried out according to standard procedures.
Histology
Mouse tissues were dissected and fixed in 4% PFA/PBS over night at 4°C. After 1
hour of washing in PBS, the tissues were dehydrated and embedded in paraffin. The
tissues were cut in 10 µm sections on a rotary microtome (Rm2155, Leica
microsystems GmbH, Germany), and standard hematoxylin and eosin staining was
performed.
CHO cell studies
Chinese hamster ovary (CHO) cells stably overexpressing human SORLA have been
described before (1). Replicate cell layers were grown on coverslips in DMEM with
2
our without 100 µM oleic acid for 24 hours. Then, the cells were fixed for 10 min
with 4% PFA/PBS, washed with PBS, and stained with Oil Red O solution. Lipase
activity in the cells was determined as described for adipose tissue below. Co-
immunoprecipiations were performed using anti-SORLA serum and protein G-
coupled Sepharose beads according to standard protocols. For cell surface labeling of
proteins, CHO cell layers were treated with membrane-impermeable sulfo-NHS-S-S-
biotin (Pierce) in PBS for 30 min. The biotin label was quenched with Tris-HCl (pH
8.0) before precipitating biotinylated proteins from cell extracts using streptavidin-
coupled Sepharose (Amersham Pharmacia Biosciences). Lysosomal activity in CHO
cells was blocked by a cocktail of 100 µM leupeptin, 10 µM pepstatin and 50 µM
chloroquine (in PBS) added for 1 hour. Thereafter, cells were incubated with 10
µg/ml insulin and lysosomal inhibitors in the culture medium for the indicated time
points before precipitating biotinylated proteins.
For immunofluorescence microscopy, CHO cells were grown on glass
coverslips, fixed with 4% PFA/PBS, and blocked with 5% skim milk/PBS under
permeabilizing (with 0,25% Triton X-100) or non-permeabilizing (without Triton X-
100) conditions. The cells were stained with antiserum overnight at 4°C and then
incubated with fluorochrome-conjugated secondary antibodies for 2 hours. Images
were taken using deconvolution microscopy (Delta Vision Imaging System, Applied
Precision). To determine the Pearson´s correlation coefficient, a single photo of a z-
stack was acquired and analyzed with Fiji/ImageJ. Statistical analysis of data was
performed using GraphPad Prism 6.
3
Metabolic characterization of mice
Body composition of mice was determined by Time-Domain-Nuclear-Magnetic-
Resonance imaging (TD-NMR, Bruker MiniSpec LF90II). Food intake and activity
were recorded using the LabMaster system (TSE, Bad Homburg, Germany). Mice
were habituated to the test cages for two days before trials, and the measurement
period lasted three to five days. Food baskets were connected to weight sensors and
recorded data were analyzed as food intake per hour. Respiratory exchange ratio
(RER) and energy expenditure (heat) was determined by indirect calorimetry at 22°C
for at least 72 hours. Rates of oxygen consumption (VO2) and carbon dioxide
production (VCO2) were measured with a flow rate of 0.4 l/min. Recorded data were
analyzed as mean RER for each hour (time course) or bar graphs. Heat was referred to
the lean mass of the mice (kcal/h per gramm lean mass).
Determination of enzyme activities
To determine lipase or esterase activities, equal amounts of gonadal fat tissue were
rinsed in PBS and minced. Krebs-Ringer-Bicarbonate solution (KRP; pH 7.4; Sigma
K4002) containing 4% BSA and 10 mg collagenase was added at 3 ml/g tissue and
incubated at 37°C for 2 hours. The suspension was centrifuged (1 min at 400 g) to
separate fat cells from stromal and vascular (SV) cells. Precipitated SV cells and most
of the medium were removed and the fat cells, floating on the surface of the residual
solution, were decanted into a new tube. Fat cells were washed with fresh KRB/BSA
solution and centrifuged. This washing step was repeated three times. Lipases were
extracted from fat cells as follows. One ml of suspended fat cells was further diluted
with 2.5 ml KRB/BSA and incubated at 37°C for 30 min. Subsequently, the
suspension was centrifuged at 100 g for 1min to separate the infranatant from the fat
4
cells. One ml of suspended fat cells was mixed with 1.125 ml homogenization buffer
(50 mM Tris-HCl, pH 7.0, 250 mM sucrose, protease inhibitor cocktail) by agitating
20 times. The homogenate was centrifuged at 4500 g at 4°C for 10 min. Subsequently,
250 µl of diethyl ether was added to the homogenate and vigorously shaken. After
further centrifugation (5 min at 1200 g), the ether layer was aspirated and the aqueous
phase collected for enzyme activity measurement. Lipase and esterase activities were
quantified by a colorimetric assay using substrates 4-nitrophenyl palmitate (Sigma)
and 4-nitrophenyl butyrate (Sigma), respectively. Substrates were dissolved in
acetonitrile and further diluted with 50 mM Tris-HCl, pH 7.0. The enzyme solutions
were mixed with the substrate to a final substrate concentration of 200 µM. The
reaction was kept at 37°C in a microplate reader and the release of 4-nitrophenol was
measured as the increase in absorbance over time.
For analyses of activity of lipoprotein lipase (LpL), frozen adipose tissue was
homogenized in 9 volumes of buffer pH 8.2 containing 0.025 M ammonia, 1% Triton
X-100, 0.1% SDS, 5 IU heparin/ml and protease inhibitor cocktail (Complete Mini,
Roche Diagnostics, Germany, 1 tablet/50 ml). After centrifugation, triplicates of 2 µl
aliquots from the infranatant below the fat cake were incubated with a phospholipid-
stabilized emulsion of soy bean triacylglycerols and 3H-oleic acid labeled triolein with
the same composition as Intralipid 10% (Fresenius Kabi, Uppsala, Sweden), as
previously described (2). Post-heparin plasma was first treated for 2.5 h at 4°C with
IgG from a rabbit immunized with rat hepatic lipase (2.5 vol of plasma + 1 vol of
IgG) to inhibit hepatic lipase activity (2). After brief centrifugation, triplicates of 3 µl
of the supernatants were incubated with the lipid emulsion. Samples from white
adipose tissue were incubated for 2 h, samples form brown adipose tissue for 60 min,
and samples from post-heparin plasma for 30 min. One milliunit of enzyme activity
5
corresponds to 1 nmol of fatty acids released per min. Enzyme activity is expressed
per g wet tissue weight or per ml plasma.
Free fatty acid analysis
Free fatty acids from mouse tissue and plasma samples were identified using GC-MS-
based fatty acid profiling. In brief, 50 mg of pulverized tissue or 50 µl plasma were
dissolved in 1 ml of extraction solvent (methanol:chloroform:water, 5:2:1).
Subsequently, 500 µl water were added, and samples were rigorously mixed,
centrifuged for 10 min at 10.000 g, and 50 µl of the chloroform phase used for
subsequent analyses. To do so, the chloroform phase was dried and stored at -20°C.
Derivatization of samples and GC-MS measurement (LECO-Pegasus III TOF-MS-
System, LECO) were carried out as described (3). The chromatograms were analyzed
using the vendor software Chromatof. For identification of fatty acids, an in-house
mass spectral database was used, and further processing was performed with the
software MetMax (4).
Primary adipocyte cultures
Primary adipocytes were differentiated from preadipocytes isolated from white
adipose tissue or from murine embryonic fibroblasts (MEF) according to standard
procedures.
In brief, white adipose tissue was removed, minced, and digested with 125
units collagenase/HEPES (Sigma C2139) solution for 45 min at 37°C. DMEM/F12
medium was added to the homogenates and the solution filtered through a 180 µm
mesh filter and, thereafter, centrifuged at 200 g for 10 min to pellet stromal vascular
(SV) precursor cells. SV cells were incubated with red blood cell lysis buffer (155

6
mM NH4Cl, 10 mM KHCO3, 0.1mM EDTA) for 5 min, and the reaction stopped by
addition of growth medium (DMEM/F12, 10% FBS). To obtain MEFs, E14.5 mouse
embryos were dissected and visceral organ removed. Thereafter, the embryos were
minced and trypsinized for 30 min at 37°C. After centrifugation (1000 g, 10 min), the
cell pellets were homogenized in DMEM medium supplemented with 10% FBS, and
plated on dishes coated with 0.1% gelatine.
For differentiation, MEFs or SV cells were cultured to confluence. Three days
later, the medium was replaced with differentiation induction medium containing
DMEM supplemented with 5% FBS, 17 nM insulin (Sigma I6634), 0.1 µM
dexamethasone (Sigma D4902), 250 µM 3-Isobutyl-1-methylxanthine (Sigma I5879),
1 µM rosiglitazone (Sigma R2408), and 60 µM indomethacin (Sigma I7378). After
two days, the cells were grown in DMEM/10% FBS + insulin for another two days.
After 9-14 days culturing with normal growth medium (DMEM/10% FBS), the
adipocytes were lipid filled and ready for analysis.

7
SUPPLEMENTAL REFERENCES
1. Schmidt V, Sporbert A, Rohe M, Reimer T, Rehm A, Andersen OM, and
Willnow TE. SorLA/LR11 regulates processing of amyloid precursor protein
via interaction with adaptors GGA and PACS-1. J Biol Chem.
2007;282(45):32956-64.
2. Bergo M, Olivecrona G, and Olivecrona T. Forms of lipoprotein lipase in rat
tissues: in adipose tissue the proportion of inactive lipase increases on fasting.
Biochem J. 1996;313 ( Pt 3)(893-8.
3. Pietzke M, Zasada C, Mudrich S, and Kempa S. Decoding the dynamics of
cellular metabolism and the action of 3-bromopyruvate and 2-deoxyglucose
using pulsed stable isotope-resolved metabolomics. Cancer Metab. 2014;2(9.
4. Kempa S, Hummel J, Schwemmer T, Pietzke M, Strehmel N, Wienkoop S,
Kopka J, and Weckwerth W. An automated GCxGC-TOF-MS protocol for
batch-wise extraction and alignment of mass isotopomer matrixes from
differential 13C-labelling experiments: a case study for photoautotrophic-
mixotrophic grown Chlamydomonas reinhardtii cells. J Basic Microbiol.
2009;49(1):82-91.
8
SUPPLEMENTAL FIGURES
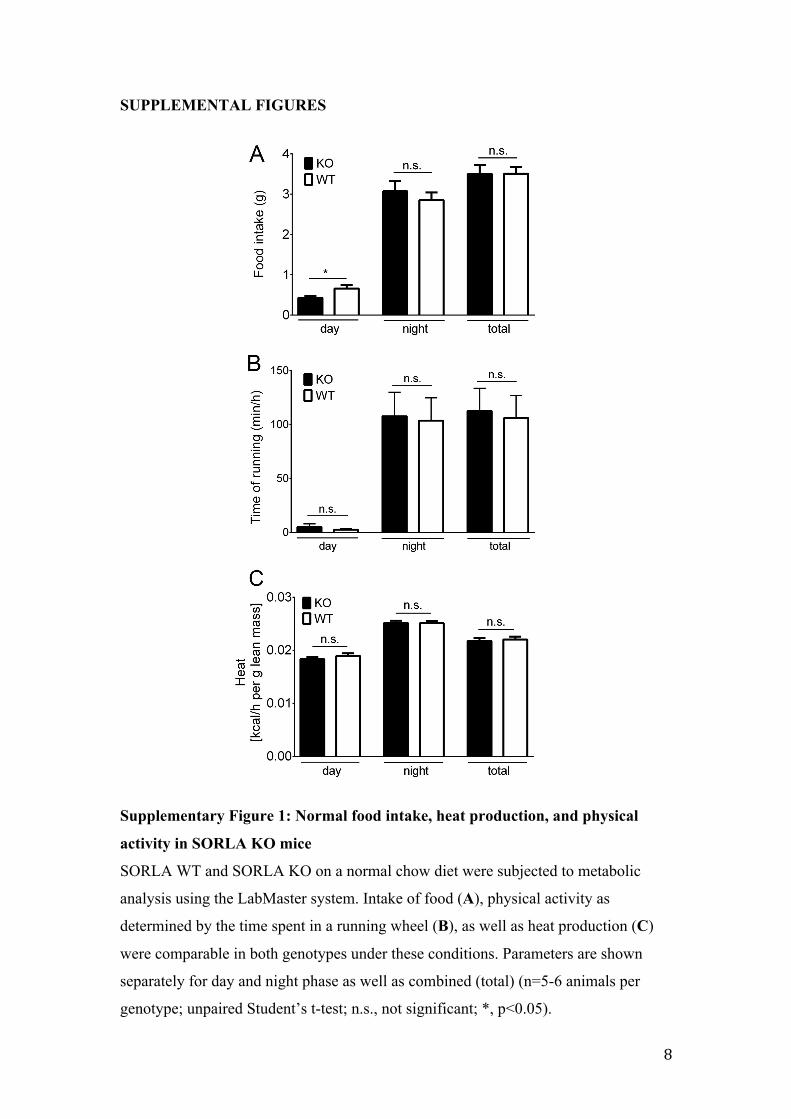
Supplementary Figure 1: Normal food intake, heat production, and physical
activity in SORLA KO mice
SORLA WT and SORLA KO on a normal chow diet were subjected to metabolic
analysis using the LabMaster system. Intake of food (A), physical activity as
determined by the time spent in a running wheel (B), as well as heat production (C)
were comparable in both genotypes under these conditions. Parameters are shown
separately for day and night phase as well as combined (total) (n=5-6 animals per
genotype; unpaired Student’s t-test; n.s., not significant; *, p<0.05).
9
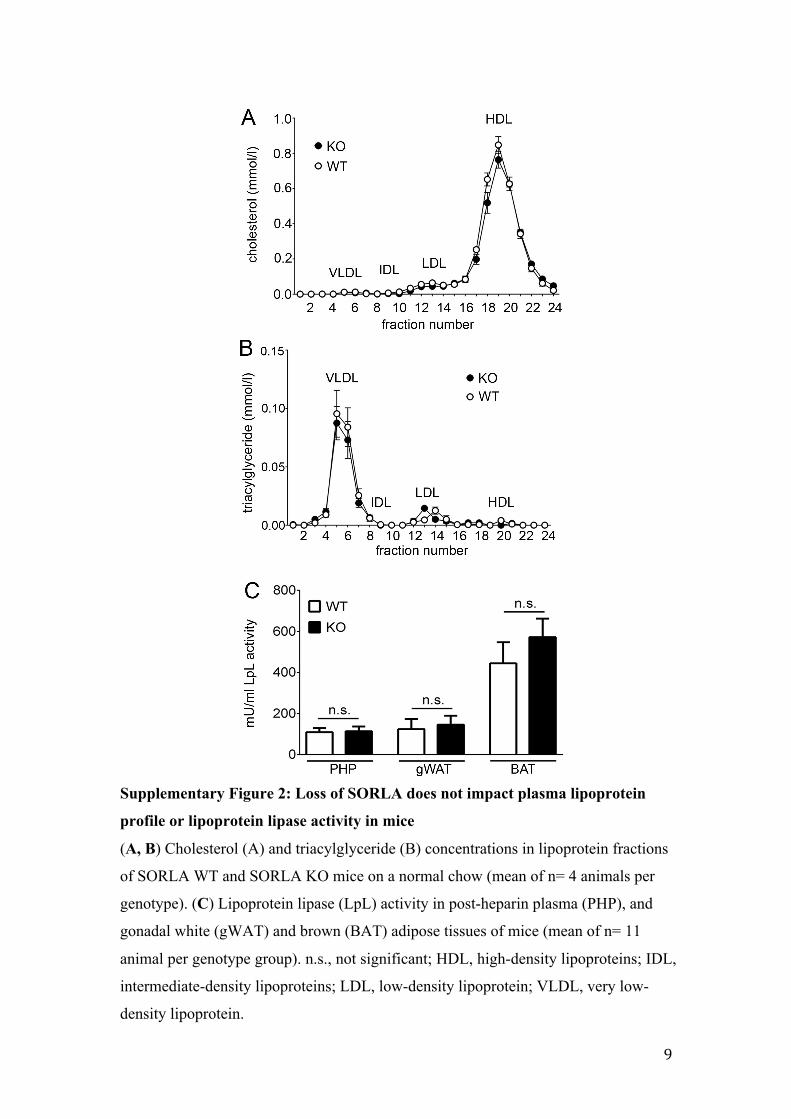
Supplementary Figure 2: Loss of SORLA does not impact plasma lipoprotein
profile or lipoprotein lipase activity in mice
(A, B) Cholesterol (A) and triacylglyceride (B) concentrations in lipoprotein fractions
of SORLA WT and SORLA KO mice on a normal chow (mean of n= 4 animals per
genotype). (C) Lipoprotein lipase (LpL) activity in post-heparin plasma (PHP), and
gonadal white (gWAT) and brown (BAT) adipose tissues of mice (mean of n= 11
animal per genotype group). n.s., not significant; HDL, high-density lipoproteins; IDL,
intermediate-density lipoproteins; LDL, low-density lipoprotein; VLDL, very low-
density lipoprotein.
10
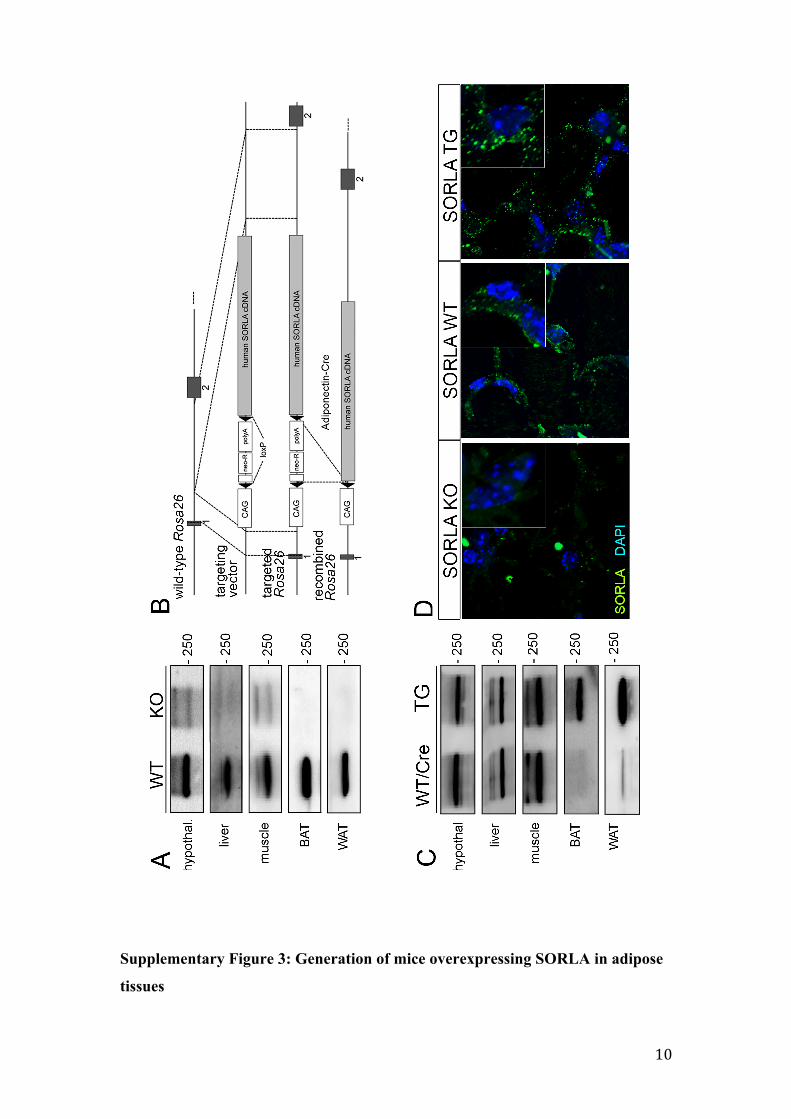
Supplementary Figure 3: Generation of mice overexpressing SORLA in adipose
tissues
11
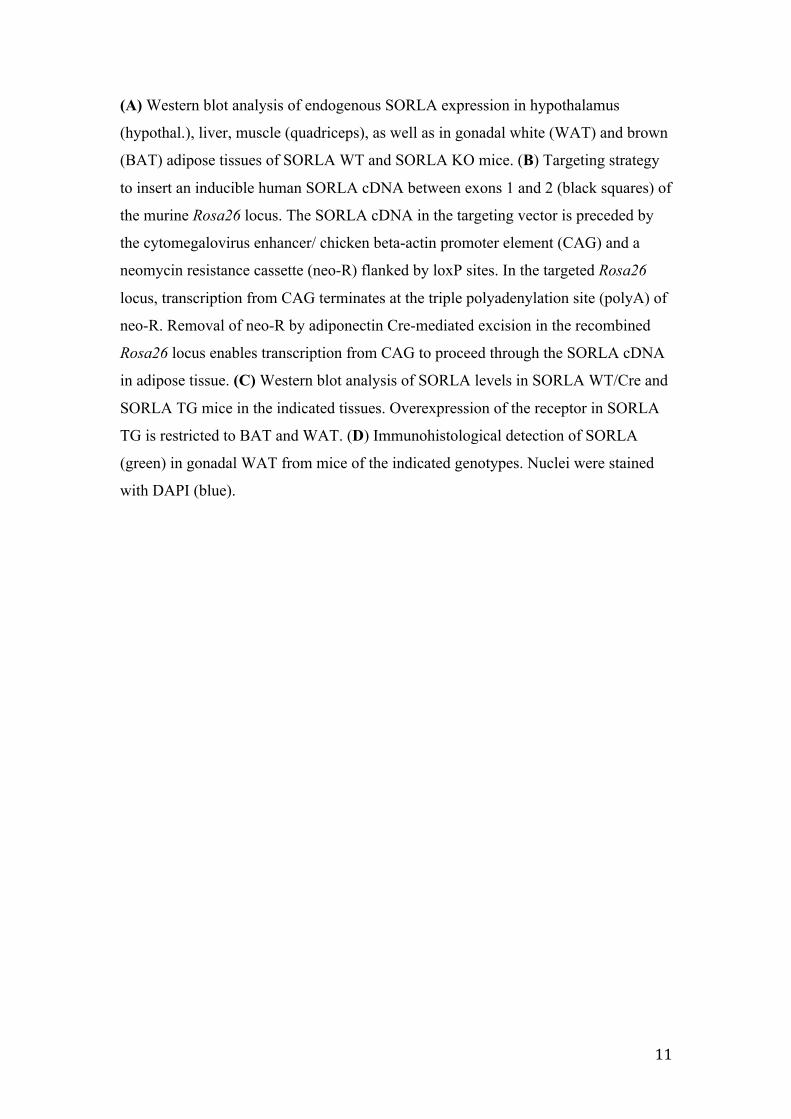
(A) Western blot analysis of endogenous SORLA expression in hypothalamus
(hypothal.), liver, muscle (quadriceps), as well as in gonadal white (WAT) and brown
(BAT) adipose tissues of SORLA WT and SORLA KO mice. (B) Targeting strategy
to insert an inducible human SORLA cDNA between exons 1 and 2 (black squares) of
the murine Rosa26 locus. The SORLA cDNA in the targeting vector is preceded by
the cytomegalovirus enhancer/ chicken beta-actin promoter element (CAG) and a
neomycin resistance cassette (neo-R) flanked by loxP sites. In the targeted Rosa26
locus, transcription from CAG terminates at the triple polyadenylation site (polyA) of
neo-R. Removal of neo-R by adiponectin Cre-mediated excision in the recombined
Rosa26 locus enables transcription from CAG to proceed through the SORLA cDNA
in adipose tissue. (C) Western blot analysis of SORLA levels in SORLA WT/Cre and
SORLA TG mice in the indicated tissues. Overexpression of the receptor in SORLA
TG is restricted to BAT and WAT. (D) Immunohistological detection of SORLA
(green) in gonadal WAT from mice of the indicated genotypes. Nuclei were stained
with DAPI (blue).
12
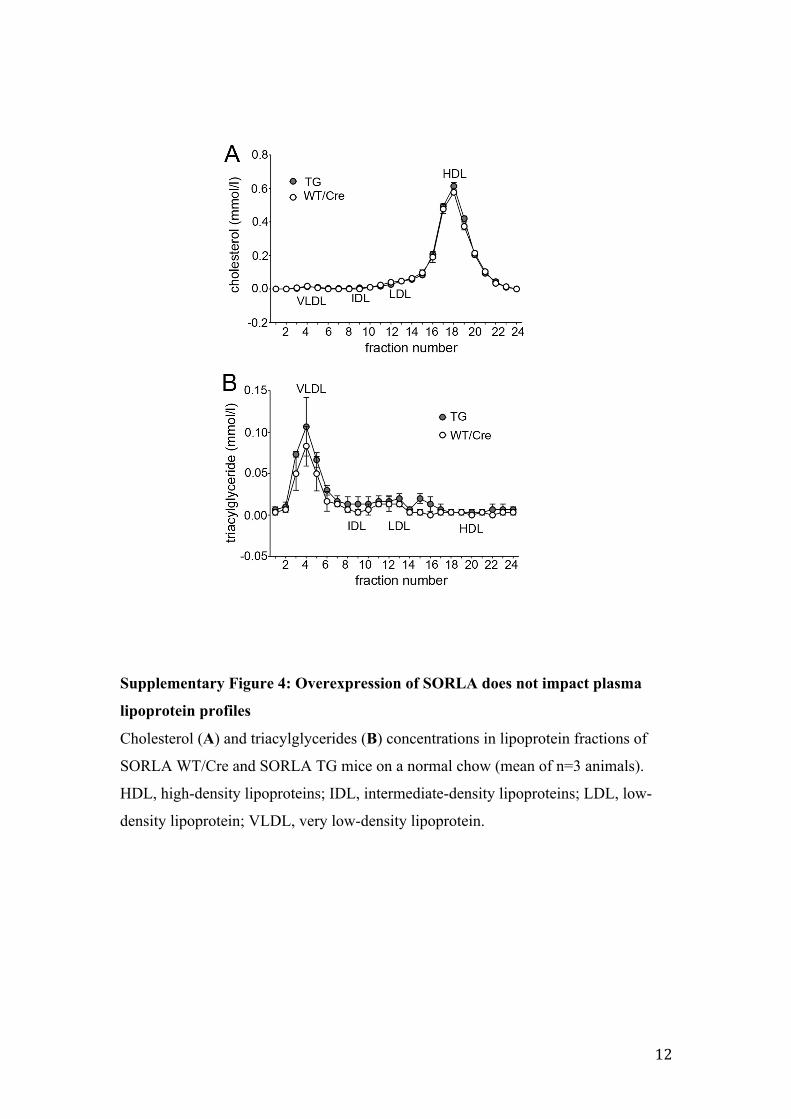
Supplementary Figure 4: Overexpression of SORLA does not impact plasma
lipoprotein profiles
Cholesterol (A) and triacylglycerides (B) concentrations in lipoprotein fractions of
SORLA WT/Cre and SORLA TG mice on a normal chow (mean of n=3 animals).
HDL, high-density lipoproteins; IDL, intermediate-density lipoproteins; LDL, low-
density lipoprotein; VLDL, very low-density lipoprotein.

13
Supplementary Figure 5: Normal food intake, physical activity and heat
production in SORLA TG mice
SORLA WT/Cre and SORLA TG mice (7 animals per genotype) were subjected to
metabolic analysis using the LabMaster system. Intake of food (A), physical activity
(B), and heat production (C) were comparable in both genotypes under these
conditions. Parameters are shown separately for day and night phases as well as
combined (total). n.s., not significant.
14
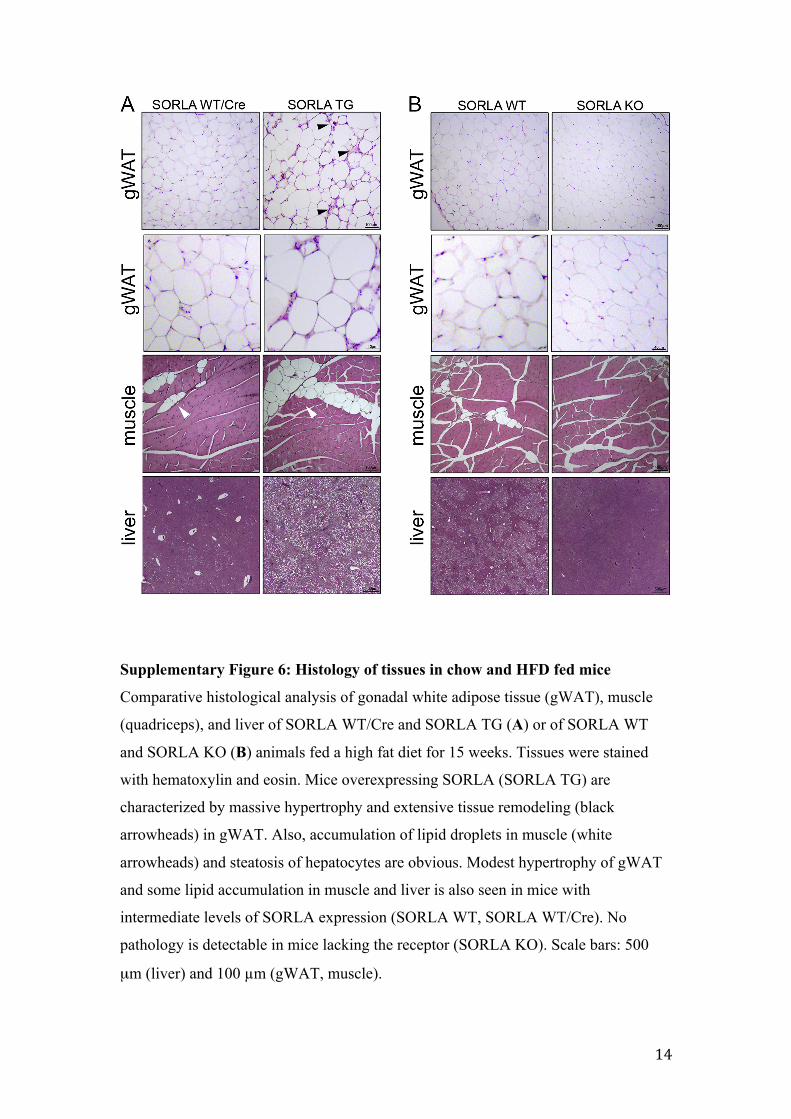
Supplementary Figure 6: Histology of tissues in chow and HFD fed mice
Comparative histological analysis of gonadal white adipose tissue (gWAT), muscle
(quadriceps), and liver of SORLA WT/Cre and SORLA TG (A) or of SORLA WT
and SORLA KO (B) animals fed a high fat diet for 15 weeks. Tissues were stained
with hematoxylin and eosin. Mice overexpressing SORLA (SORLA TG) are
characterized by massive hypertrophy and extensive tissue remodeling (black
arrowheads) in gWAT. Also, accumulation of lipid droplets in muscle (white
arrowheads) and steatosis of hepatocytes are obvious. Modest hypertrophy of gWAT
and some lipid accumulation in muscle and liver is also seen in mice with
intermediate levels of SORLA expression (SORLA WT, SORLA WT/Cre). No
pathology is detectable in mice lacking the receptor (SORLA KO). Scale bars: 500
µm (liver) and 100 µm (gWAT, muscle).

15
Supplementary Figure 7: Glucose metabolism in mice on a normal or a high fat
diet.
(A-B) Fasting plasma levels of glucose (A) and insulin (B) in SORLA TG and
SORLA WT/Cre animals. No differences between genotypes are seen on a normal
chow, but levels of fasting insulin and glucose are significantly increased in SORLA
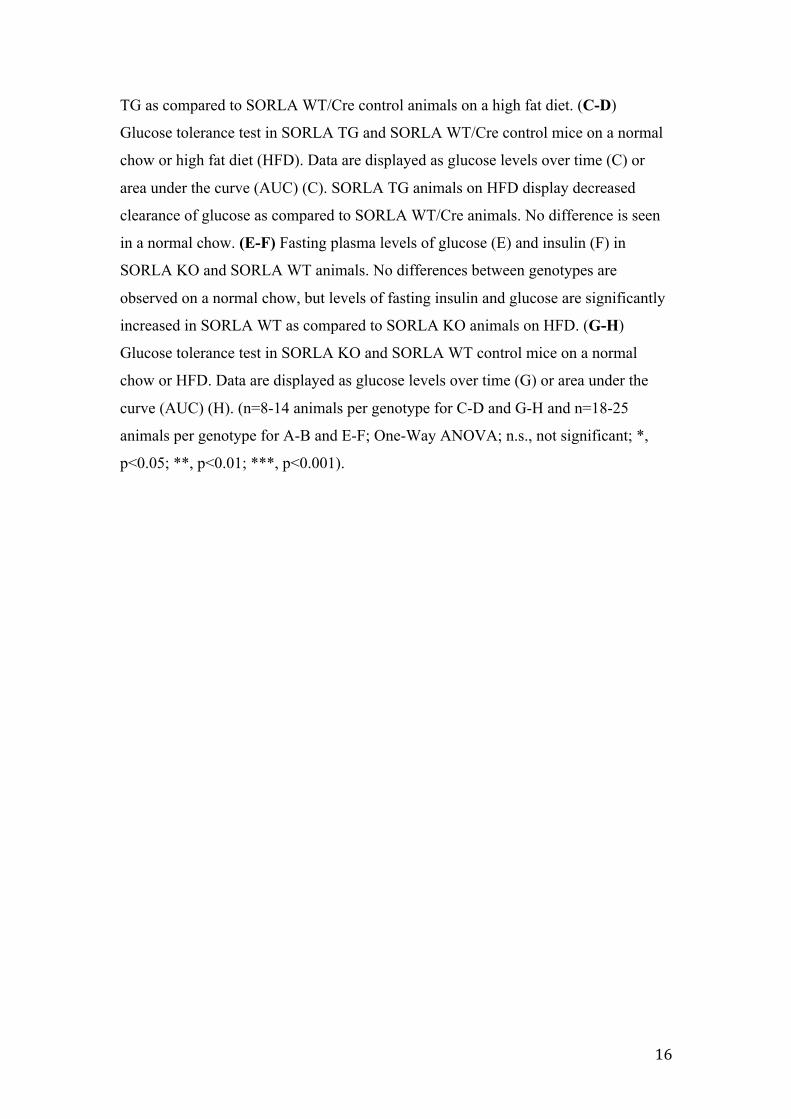
16
TG as compared to SORLA WT/Cre control animals on a high fat diet. (C-D)
Glucose tolerance test in SORLA TG and SORLA WT/Cre control mice on a normal
chow or high fat diet (HFD). Data are displayed as glucose levels over time (C) or
area under the curve (AUC) (C). SORLA TG animals on HFD display decreased
clearance of glucose as compared to SORLA WT/Cre animals. No difference is seen
in a normal chow. (E-F) Fasting plasma levels of glucose (E) and insulin (F) in
SORLA KO and SORLA WT animals. No differences between genotypes are
observed on a normal chow, but levels of fasting insulin and glucose are significantly
increased in SORLA WT as compared to SORLA KO animals on HFD. (G-H)
Glucose tolerance test in SORLA KO and SORLA WT control mice on a normal
chow or HFD. Data are displayed as glucose levels over time (G) or area under the
curve (AUC) (H). (n=8-14 animals per genotype for C-D and G-H and n=18-25
animals per genotype for A-B and E-F; One-Way ANOVA; n.s., not significant; *,
p<0.05; **, p<0.01; ***, p<0.001).
17
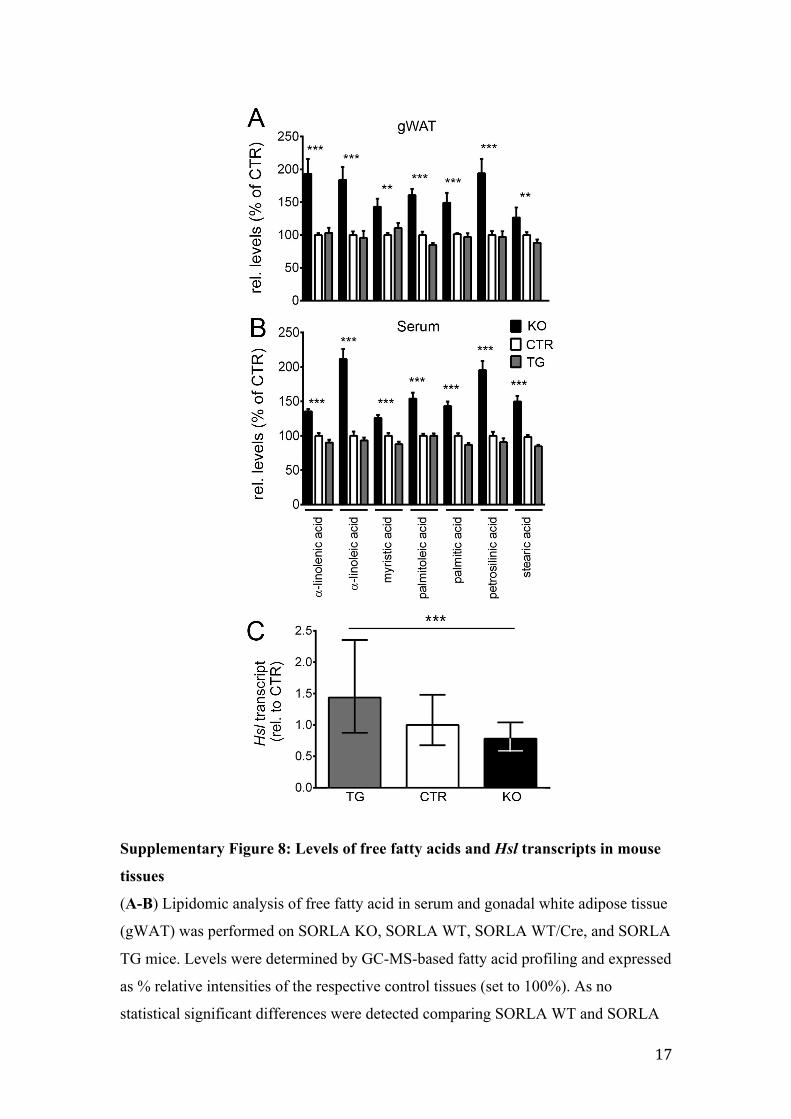
Supplementary Figure 8: Levels of free fatty acids and Hsl transcripts in mouse
tissues
(A-B) Lipidomic analysis of free fatty acid in serum and gonadal white adipose tissue
(gWAT) was performed on SORLA KO, SORLA WT, SORLA WT/Cre, and SORLA
TG mice. Levels were determined by GC-MS-based fatty acid profiling and expressed
as % relative intensities of the respective control tissues (set to 100%). As no
statistical significant differences were detected comparing SORLA WT and SORLA
18
WT/Cre animals, both genotypes were combined as control (CTR) group (n=5-14
animals per genotype; One-Way ANOVA; **, p<0.01; ***, p<0.001). (C)
Quantitative RT-PCR analyses of transcript levels of hormone-sensitive lipase (Hsl)
in gonadal adipose tissue of mice of the indicated SORLA genotypes (n=12-16
animals per genotype; One-Way ANOVA; ***, p<0.001).

19
Supplementary Figure 9: SORL1-genotype dependent response to insulin in mice
(A) Mice were injected i.p. with insulin (40 µg/kg body weight) and gonadal white
adipose tissues were dissected 15 min later. Western blot analysis documents a
comparable increase in phosphorylated insulin receptor (pIR) and phosphorylated
AKT (pAKT) in SORLA KO, SORLA WT, and in SORLA TG animals (lanes 2, 4, 6)
compared to non-injected genotype controls (lanes 1, 3, 5). The immunodetection of
pAKT was derived from duplicate samples run on a separate gel. (B) Densitometric
scanning of replicate Western blots as exemplified in (A) documents a significant
increase in relative SORLA levels in SORLA WT mice injected with insulin as
compared to untreated SORLA WT animals (set to 100%) (n=4 animals per
condition; unpaired Student´s t-test; **, p<0.01). (C) Levels of Sorl1 transcript in
gonadal white adipose tissue are identical in SORLA WT mice either untreated or
injected with insulin as shown by q-PCR (n=6 animals per condition; unpaired
Student´s t-test; n.s., not significant).
20
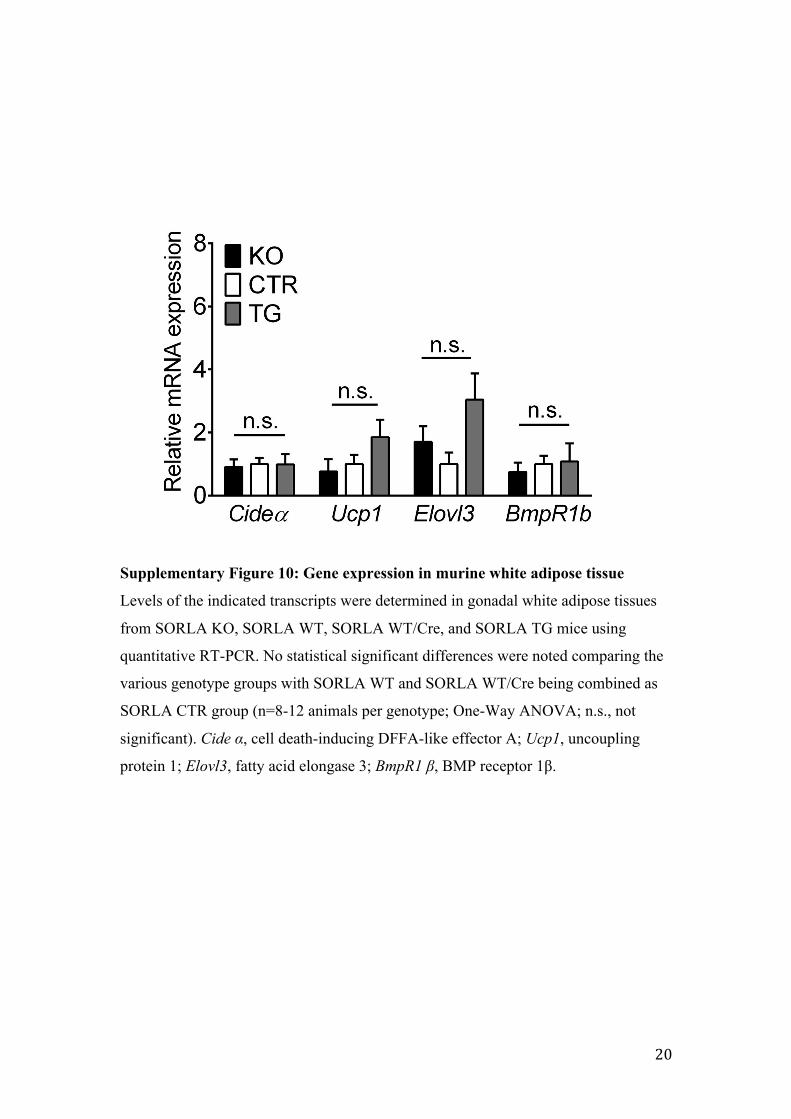
Supplementary Figure 10: Gene expression in murine white adipose tissue
Levels of the indicated transcripts were determined in gonadal white adipose tissues
from SORLA KO, SORLA WT, SORLA WT/Cre, and SORLA TG mice using
quantitative RT-PCR. No statistical significant differences were noted comparing the
various genotype groups with SORLA WT and SORLA WT/Cre being combined as
SORLA CTR group (n=8-12 animals per genotype; One-Way ANOVA; n.s., not
significant). Cide α, cell death-inducing DFFA-like effector A; Ucp1, uncoupling
protein 1; Elovl3, fatty acid elongase 3; BmpR1 β, BMP receptor 1β.
21
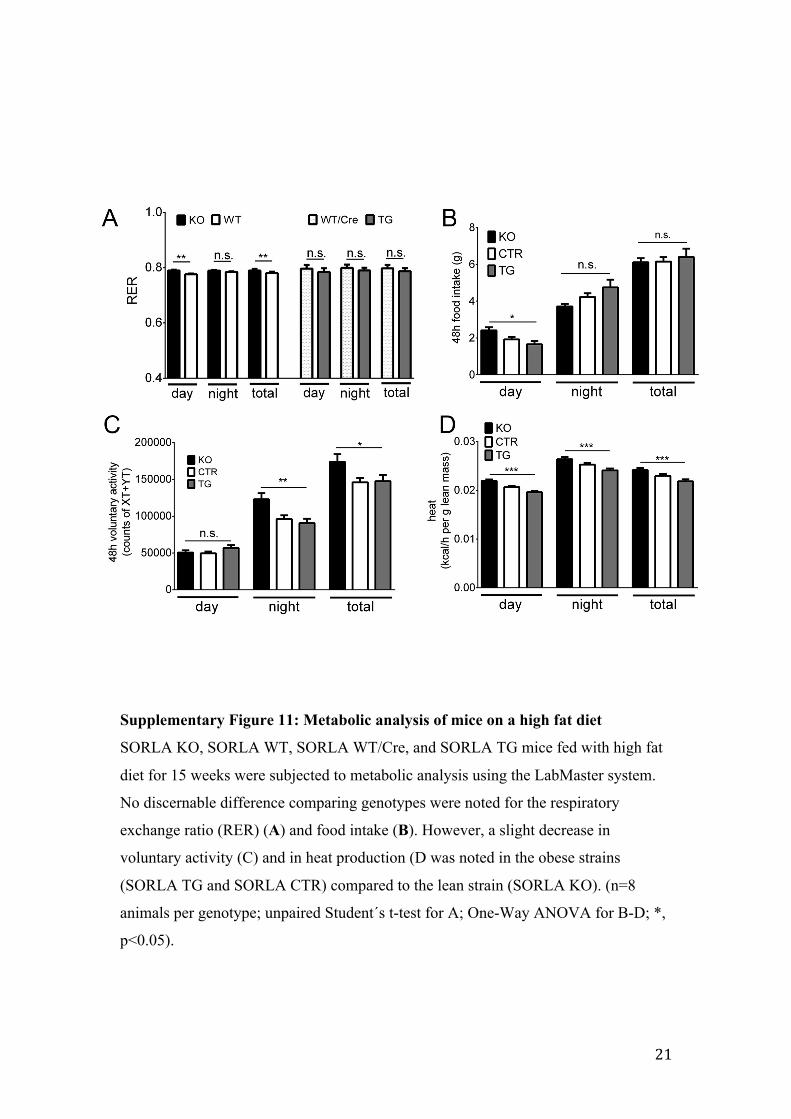
Supplementary Figure 11: Metabolic analysis of mice on a high fat diet
SORLA KO, SORLA WT, SORLA WT/Cre, and SORLA TG mice fed with high fat
diet for 15 weeks were subjected to metabolic analysis using the LabMaster system.
No discernable difference comparing genotypes were noted for the respiratory
exchange ratio (RER) (A) and food intake (B). However, a slight decrease in
voluntary activity (C) and in heat production (D was noted in the obese strains
(SORLA TG and SORLA CTR) compared to the lean strain (SORLA KO). (n=8
animals per genotype; unpaired Student´s t-test for A; One-Way ANOVA for B-D; *,
p<0.05).

22
Supplementary Figure 12: Co-localization of SORLA and insulin receptor in
CHO cells and primary adipocytes
(A-B) Expression of SORLA as shown by Western blot (A) and by
immunocytochemistry (B) in parental Chinese hamster ovary cells (CHO) or in CHO
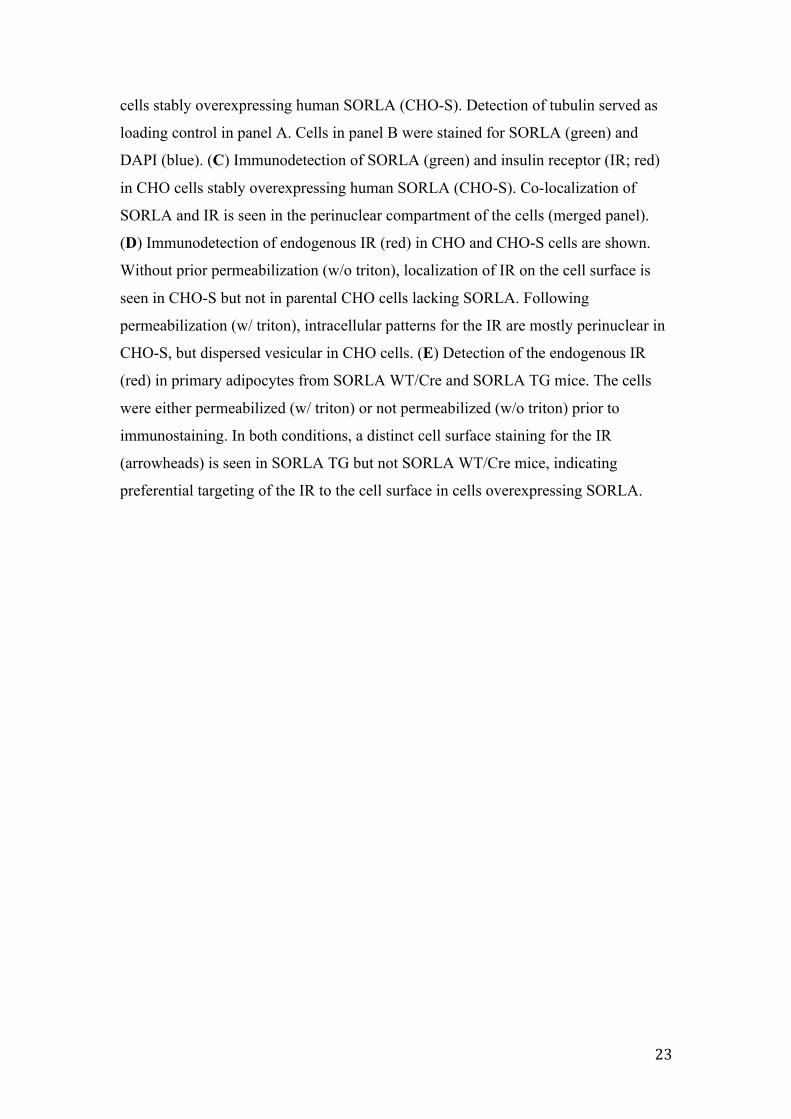
23
cells stably overexpressing human SORLA (CHO-S). Detection of tubulin served as
loading control in panel A. Cells in panel B were stained for SORLA (green) and
DAPI (blue). (C) Immunodetection of SORLA (green) and insulin receptor (IR; red)
in CHO cells stably overexpressing human SORLA (CHO-S). Co-localization of
SORLA and IR is seen in the perinuclear compartment of the cells (merged panel).
(D) Immunodetection of endogenous IR (red) in CHO and CHO-S cells are shown.
Without prior permeabilization (w/o triton), localization of IR on the cell surface is
seen in CHO-S but not in parental CHO cells lacking SORLA. Following
permeabilization (w/ triton), intracellular patterns for the IR are mostly perinuclear in
CHO-S, but dispersed vesicular in CHO cells. (E) Detection of the endogenous IR
(red) in primary adipocytes from SORLA WT/Cre and SORLA TG mice. The cells
were either permeabilized (w/ triton) or not permeabilized (w/o triton) prior to
immunostaining. In both conditions, a distinct cell surface staining for the IR
(arrowheads) is seen in SORLA TG but not SORLA WT/Cre mice, indicating
preferential targeting of the IR to the cell surface in cells overexpressing SORLA.
24
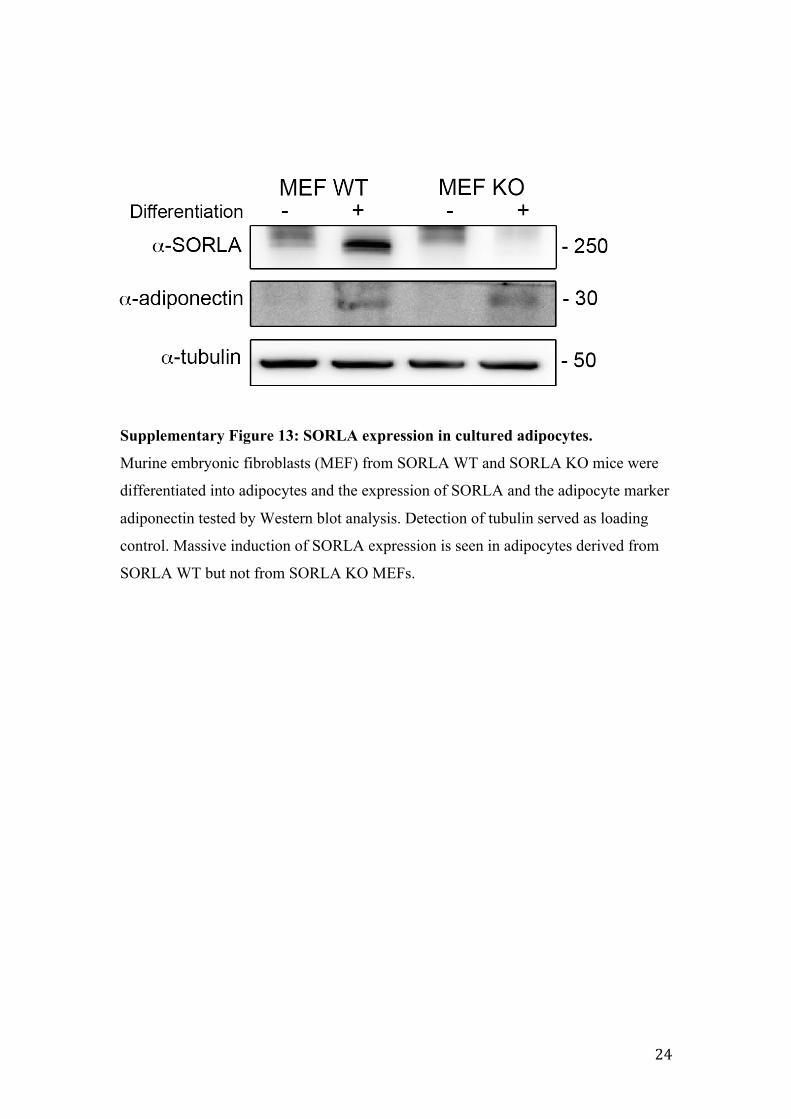
Supplementary Figure 13: SORLA expression in cultured adipocytes.
Murine embryonic fibroblasts (MEF) from SORLA WT and SORLA KO mice were
differentiated into adipocytes and the expression of SORLA and the adipocyte marker
adiponectin tested by Western blot analysis. Detection of tubulin served as loading
control. Massive induction of SORLA expression is seen in adipocytes derived from
SORLA WT but not from SORLA KO MEFs.
25
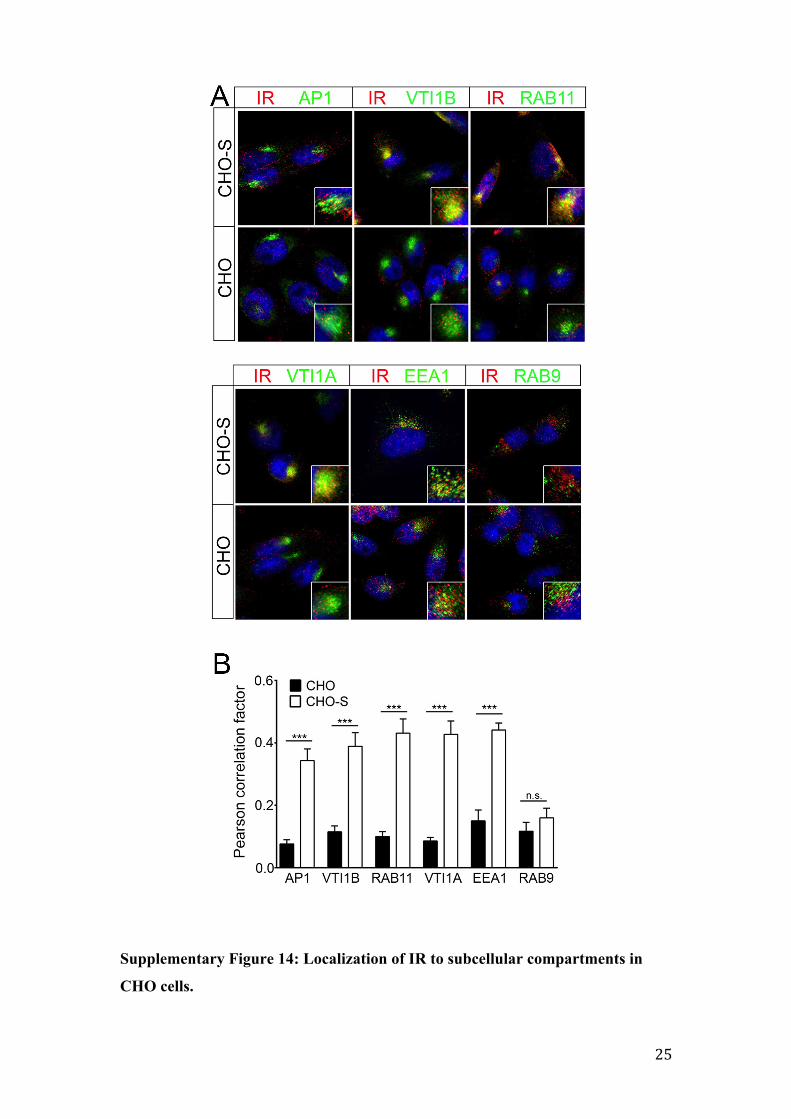
Supplementary Figure 14: Localization of IR to subcellular compartments in
CHO cells.

26
(A) Co-staining of the endogenous insulin receptor (IR; red) with the indicated
markers of subcellular compartments (green). The insets provide higher magnification
of cells in the respective panels. (B) The extent of co-localization of the IR with the
subcellular markers (given in A) was quantified by determination of the respective
Pearson’s correlation coefficient (n=20-30 cells; unpaired Student´s t-test; ***,
p<0.001; n.s., not significant). AP1, adaptor protein 1; EEA1, early endosomal
antigen 1; RAB, Rab associated protein; VTI, vesicle transport through interaction
with T-SNAREs.


![Mechanical and bioactivity assessment of wollastonite/PVA ... · ], and 1 M HCl to obtain a similar ionic concentration as found in human blood plasma [24].The samples, in triplicates,](https://static.fdocuments.in/doc/165x107/5f75307daac3387ac8718230/mechanical-and-bioactivity-assessment-of-wollastonitepva-and-1-m-hcl-to.jpg)


![The Open Transportation Journalrua.ua.es/dspace/bitstream/10045/54854/1/2016_Padilla... · 2016. 5. 11. · Apart from Alicante city, Benidorm (73,768 inhabitants [1] and triplicates](https://static.fdocuments.in/doc/165x107/60aacdc511366976f54208d8/the-open-transportation-2016-5-11-apart-from-alicante-city-benidorm-73768.jpg)
