
Supplemental Material: On the Utility of ToxCastTM and...
22
Environ Health Perspect DOI: 10.1289/ehp.1510352 Note to readers with disabilities: EHP strives to ensure that all journal content is accessible to all readers. However, some figures and Supplemental Material published in EHP articles may not conform to 508 standards due to the complexity of the information being presented. If you need assistance accessing journal content, please contact [email protected]. Our staff will work with you to assess and meet your accessibility needs within 3 working days. Supplemental Material On the Utility of ToxCast TM and ToxPi as Methods for Identifying New Obesogens Amanda Shaine Janesick, Giorgio Dimastrogiovanni, Lenka Vanek, Christy Boulos, Raquel Chamorro-García, Weiyi Tang, and Bruce Blumberg Table of Contents Figure S1. Regression analysis of activation and antagonism curves from Figures 1 and 4. Data points are averages of triplicate transfections (3 biological replicates). Data are depicted as fold induction over vehicle (0.05% DMSO) controls ± S.E.M. EC 50 and IC 50 values were obtained using nonlinear regression, variable slope in GraphPad Prism 5.0 Spirodiclofen did not plateau, therefore, it was constrained at the top dose. Figure S2. Schematic of adipogenesis assays. Top. 3T3-L1 cells were seeded at 2x10 4 cells per well in 12-well plates. After 48 hours, cells were exposed to the adipogenic cocktail MDI (isobutyl-methylxanthine, dexamethasone, and insulin) for 2 days. Induction media was removed and cells were exposed to ToxCast chemicals (or controls) during 5 days replacing the media every 2 days. Bottom. 8x10 4 cells/well mBMSCs were maintained as subconfluent monolayers in basic medium. Once confluent, mBMSCs were induced to differentiate with adipogenic cocktail and ToxCast chemicals (or controls) during 14 days replacing the media every 3 days. Figure S3. ToxPi chemical pyridaben inhibits adipogenesis in 3T3-L1 preadipocytes. Adipogenesis was induced in cells according to Supplemental Material, Figure S2. Lipid accumulation was assessed by measuring the percent of surface area in each well covered by Oil Red 0 positive cells using Image J software. One-way ANOVA was conducted for
Transcript of Supplemental Material: On the Utility of ToxCastTM and...

Environ Health Perspect DOI: 10.1289/ehp.1510352
Note to readers with disabilities: EHP strives to ensure that all journal content is accessible to all
readers. However, some figures and Supplemental Material published in EHP articles may not conform to
508 standards due to the complexity of the information being presented. If you need assistance accessing
journal content, please contact [email protected]. Our staff will work with you to assess and meet
your accessibility needs within 3 working days.
Supplemental Material
On the Utility of ToxCastTM and ToxPi as Methods for Identifying
New Obesogens
Amanda Shaine Janesick, Giorgio Dimastrogiovanni, Lenka Vanek, Christy Boulos, Raquel
Chamorro-García, Weiyi Tang, and Bruce Blumberg
Table of Contents
Figure S1. Regression analysis of activation and antagonism curves from Figures 1 and 4.
Data points are averages of triplicate transfections (3 biological replicates). Data are depicted
as fold induction over vehicle (0.05% DMSO) controls ± S.E.M. EC50 and IC50 values were
obtained using nonlinear regression, variable slope in GraphPad Prism 5.0 Spirodiclofen did
not plateau, therefore, it was constrained at the top dose.
Figure S2. Schematic of adipogenesis assays. Top. 3T3-L1 cells were seeded at 2x10⁴ cells per
well in 12-well plates. After 48 hours, cells were exposed to the adipogenic cocktail MDI
(isobutyl-methylxanthine, dexamethasone, and insulin) for 2 days. Induction media was
removed and cells were exposed to ToxCast chemicals (or controls) during 5 days replacing
the media every 2 days. Bottom. 8x10⁴ cells/well mBMSCs were maintained as subconfluent
monolayers in basic medium. Once confluent, mBMSCs were induced to differentiate with
adipogenic cocktail and ToxCast chemicals (or controls) during 14 days replacing the media
every 3 days.
Figure S3. ToxPi chemical pyridaben inhibits adipogenesis in 3T3-L1 preadipocytes.
Adipogenesis was induced in cells according to Supplemental Material, Figure S2. Lipid
accumulation was assessed by measuring the percent of surface area in each well covered by
Oil Red 0 positive cells using Image J software. One-way ANOVA was conducted for
2
pyridaben treatment groups and DMSO vehicle (VEH), followed by Dunnett's post-hoc test:
*** P ≤ 0.001 compared to DMSO. Unpaired t-test was conducted for the positive control
Rosiglitazone (ROSI) versus DMSO vehicle: ### P ≤ 0.001.
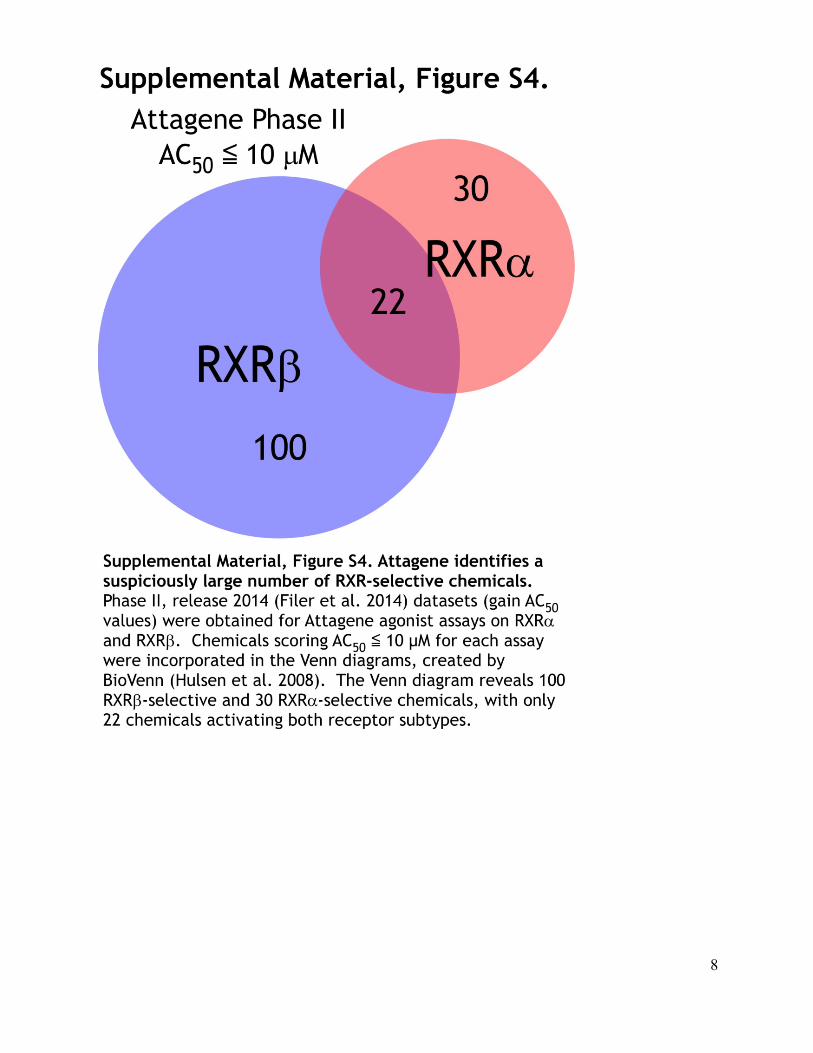
Figure S4. Attagene identifies a suspiciously large number of RXR-selective chemicals.
Phase II, release 2014 (Filer et al. 2014) datasets (gain AC50 values) were obtained for
Attagene agonist assays on RXRα and RXRβ. Chemicals scoring AC50 ≤ 10 µM for each
assay were incorporated in the Venn diagrams, created by BioVenn (Hulsen et al. 2008). The
Venn diagram reveals 100 RXRβ-selective and 30 RXRα-selective chemicals, with only 22
chemicals activating both receptor subtypes.
Figure S5. True positives and false positives are lost when employing ToxCast Phase II new
models. (A) Green triangles: ToxPi Phase I rankings (based solely on AC50 values). Blue
dots: ToxPi Phase II rankings using the Phase I chemical library are based solely on AC50
values. Squares: ToxPi Phase II rankings using Phase I chemical library were constructed by
first removing chemicals with low Z-scores, and then correcting the magnitude each Pi slice
by adding the Z-score to the negative log (AC50). Differences between triangles and dots are
due to discrepancies between Phase I and Phase II assays on the same chemical. Differences
between squares and dots are attributed to the Z-score correction. (B) Circles/dots: Raw Z-
score values derived from ToxPi Phase II data using Phase I chemical library. Triangles: Z-
score corrected AC50 values derived from ToxPi Phase II data using Phase I chemical library.
All true PPARγ activators rank significantly lower in both raw Z-score and Z-score corrected
AC50 values compared to atrazine and quinclorac. However, atrazine is not a PPARγ activator
in Cos7 transient transfection assays (Supplemental Material, Figure S7).
Figure S6. ToxPi regeneration using Phase II, 2014 dataset and Phase I chemical library.
Adipogenesis ToxPi diagrams where slice size (magnitude) represents the activity of a
ToxCast chemical in a particular assay or collection of assays (Supplemental Material, Table
S1). Highest scoring ToxPi chemicals are predicted to be obesogenic. (A) Top scoring Phase
II ToxPi chemicals with Z-score correction. The magnitude of the Pi slice is determined by
adding the Z-score to the negative log (AC50). (B) Top scoring Phase II ToxPi chemicals
without Z-score correction, based solely on AC50 values.
Figure S7. Phase II ToxCast chemical activity on PPARγ and RXRα. The abil ty of a graded
dose series of ToxCast chemicals to activate (A) GAL4-mPPARγ or (B) GAL4-hRXRα was
tested in transiently transfected Cos7 cells. (A, B) Data points are averages of triplicate
3
transfections (3 biological replicates). Cytotoxicity, as measured by decreased β-galactosidase
activity was observed at 33 µM and 100 µM for triclosan. Data are depicted as fold induction
over vehicle (0.05% DMSO) controls ± S.E.M. (A) ToxCast chemicals were tested in 3-fold
serial dilutions from 100 µM through 0.137 µM, with the final data point being 0.05% DMSO.
Rosiglitazone (A) and AGN1934204 (B) serve as a positive control activators and were tested
in 10-fold serial dilutions.
Figure S8. Linear regression analysis of ToxCast Phase I and Phase II assays on the same
endpoint (same chemical/assay pair).
Table S1. 16 assays were used to construct the adipogenic ToxPi models shown in Figure 3.
16 assays from Attagene, NovaScreen, and NCGC were incorporated into ToxPi models
(Figure 3, Supplemental Material, Table S3). These 16 assays were chosen because they were
relevant to the biological process of adipogenesis. All information provided in this table is
derived from ToxCast_Phase_1_Assays_20110110.txt at
http://epa.gov/ncct/toxcast/data_archive.html (2011 release; Knudsen et al. 2011).
ATG_RXRα_TRANS, ATG_GR_TRANS, ATG_GRE_CIS, and NCGC_GR_Agonist assays
showed no activation by any of the 320 ToxCast chemicals. The leftmost column indicates
the assay or collection of assays contributing to a particular slice. For example, the PPARγ
slice in Figure 3A is comprised of three assays: ATG_PPARγ_TRANS,
NCGC_PPARγ_Agonist, and NVS_NR_hPPARγ.
Table S2. List of top scoring chemicals in ToxCast PPARγ assays. AC50 values (µM) from 2
PPARγ agonist assays (Attagene-ATG, NCGC), 1 PPARγ direct binding assay (Novascreen-
NVS), and 1 PPARγ antagonist assay (NCGC/Tox21) are shown here, ranked on the Attagene
assay -- 2011 release (Knudsen et al. 2011). GSID = DSSTox chemical identifier; CASRN =
CAS Registry Number; NA = not active.
Table S3. 24 top, medium, low (zero/negative) scoring chemicals obtained by ToxPi
analysis. Data directly correspond to ToxPi diagrams shown in Figure 3. Assay descriptions
are available in Supplemental Material, Table S1. AC50 values are expressed in µM. Inactive
chemicals were not active in any of the ToxCast assays for adipogenesis, feeding behavior,
islet cell function, or insulin sensitivity. ATGC = Attagene cis-FactorialTM assay; ATGT =
Attagene trans-FactorialTM assay; NCGC = GeneBLAzer agonist assay; NVS = Novascreen
direct binding assay; NA = not active.
Table S4. Primer sequences

4
Table S5. Re-evaluation of PPARγ activators using Phase II data for three ToxCast PPARγ
assays. AC50 values (µM) and Z-scores from ToxCast 2014 release (Filer et al. 2014) is
shown. (A) The Phase I chemical library was ranked based solely on AC50 values (µM) of the
Attagene and Tox21/NCGC PPARγ assays and NovaScreen PPARγ direct binding assay. (B)
Chemicals were first filtered by removing those with cytotoxicity Z-scores less than 3 (U.S.
EPA 2014) and then ranking them based on their Z-score + negative log (AC50). NA = not
active.
Table S6. Continuation of Table 1: Comparison of results in Figures 1 and 2 versus
ToxCast assay data. Column 1 is a list of chemicals used in our PPARγ
activation/antagonism assays and adipogenesis assays. AC50 values (µM) from ToxCast 2011
(Knudsen et al. 2011) and 2014 (Filer et al. 2014) releases are shown. ATG = Attagene
FactorialTM PPARγ agonist assay; NVS = NovaScreen PPARγ direct binding assay; NCGC =
GeneBLAzer PPARγ agonist or antagonist assay; NA = not active.
Table S7. Continuation of Table 2: Comparison of results in Figures 3-7 versus ToxCast
Phase I assay data. Column 1 is a list of the ToxPi chemicals (Figure 3) used in PPARγ or
RXRα activation assays (Figure 4) and adipogenesis assays (Figures 5-7). AC50 values (µM)
from ToxCast 2011 (Knudsen et al. 2011) and 2014 (Filer et al. 2014) releases are shown.
ATG = Attagene FactorialTM agonist assay; NVS = NovaScreen direct binding assay; NCGC
= GeneBLAzer agonist or antagonist assay; NA = not active.
References

5

6

7
8

9

10

11

12
(Filer et al. 2014)
(Hulsen et al. 2008)

13
Table S1.
SLICE AssayName Source AssayDescription AssayTechnology ReferenceCompound
CellLine CatalogNumber
PPRE ATG_PPRE_CIS Attagene FactorialcisPPREReporterGeneAssay
Invitro(Cellular)Reportergeneassay
Rosiglitazone HepG2 AttagenePPRE
PPARγ ATG_PPARγ_TRANS AttageneFactorialtransPPARγReporterGeneAssay
Invitro(Cellular)Reportergeneassay Rosiglitazone HepG2 AttagenePPARγ
PPARγ NCGC_PPARγ_Agonist NCGCGAL4BLAMReporterGene
AssayPPARγAgonistInvitro(Cellular)
Reportergeneassay Rosiglitazone HEK293InvitrogenSKU#
K1419
PPARγ NVS_NR_hPPARγ NovascreenHumanPPARγFluorescent
Ligand CompetitiveBinding Ciglitazone NA Caliper#100-0914
GR NCGC_GR_Agonist NCGC GAL4BLAMReporterGeneAssayGRAgonist
Invitro(Cellular)Reportergeneassay
Dexamethasone Hela InvitrogenSKU#K1391
GR NVS_NR_hGR Novascreen HumanGR3H-Dexamethasone
ReceptorActivation,Radioactivity
Triamcinoloneacetonide
NA Caliper#100-0448
GR ATG_GR_TRANS Attagene FactorialtransGRReporterGeneAssay
Invitro(Cellular)Reportergeneassay Dexamethazone HepG2 AttageneGR
GR ATG_GRE_CIS AttageneFactorialcisGREReporter
GeneAssayInvitro(Cellular)
Reportergeneassay Dexamethazone HepG2 AttageneGRE
LXR ATG_LXRα_TRANS AttageneFactorialtransLXRαReporterGeneAssay
Invitro(Cellular)Reportergeneassay T0901317 HepG2 AttageneLXRα
LXR ATG_LXRβ_TRANS Attagene FactorialtransLXRβReporterGeneAssay
Invitro(Cellular)Reportergeneassay
T0901317 HepG2 AttageneLXRβ
LXR NCGC_LXR_Agonist NCGC GAL4BLAMReporterGeneAssayLXRβAgonist
Invitro(Cellular)Reportergeneassay
T0901317 HEK293T InvitrogenSKU#K1415
LXRE ATG_DR4_LXR_CIS Attagene FactorialcisDR4/LXREReporterGeneAssay
Invitro(Cellular)Reportergeneassay LXRα,β HepG2 AttageneLXRE
CEBP ATG_C_EBP_CIS AttageneFactorialcisC/EBP
ReporterGeneAssayInvitro(Cellular)
Reportergeneassay C/EBP HepG2 AttageneC/EBP
SREBP ATG_SREBP_CIS AttageneFactorialcisSREBPReporterGeneAssay
Invitro(Cellular)Reportergeneassay SREBPFamily HepG2 AttageneSREBP
RXRα ATG_RXRα_TRANS Attagene FactorialtransRXRαReporterGeneAssay
Invitro(Cellular)Reportergeneassay
9-cis-Retinoicacid HepG2 AttageneRXRα
RXRα NCGC_RXRα_Agonist NCGC GAL4BLAMReporterGeneAssayRXRαAgonist
Invitro(Cellular)Reportergeneassay
9-cis-Retinoicacid HEK293T InvitrogenSKU#K1411

14
Table S1. 16 assays were used to construct the adipogenic ToxPi models shown in Figure 3. 16 assays from Attagene, NovaScreen, and NCGC were incorporated into ToxPi models (Figure 3, Supplemental Material, Table S3). These 16 assays were chosen because they were relevant to the biological process of adipogenesis. All information provided in this table is derived from ToxCast_Phase_1_Assays_20110110.txt at http://epa.gov/ncct/toxcast/data_archive.html (2011 release; Knudsen et al. 2011). ATG_RXRα_TRANS, ATG_GR_TRANS, ATG_GRE_CIS, and NCGC_GR_Agonist assays showed no activation by any of the 320 ToxCast chemicals. The leftmost column indicates the assay or collection of assays contributing to a particular slice. For example, the PPARγ slice in Figure 3A is comprised of three assays: ATG_PPARγ_TRANS, NCGC_PPARγ_Agonist, and NVS_NR_hPPARγ.

15
Table S2.
2011Release 2014Release
GCID CASRN NAMEATG
AgonistNVS
AgonistNCGCAgonist
ATGAgonist
NVSAgonist
NCGCAgonist
NCGCAntag.
16201 76-87-9 Triphenyltin 0.022 0.54 NA 0.02 0.28 21.6 0.0216205 79622-59-6 Fluazinam 0.51 0.28 NA 1.2 0.26 0.07 1.316279 50-65-7 Niclosamide 0.56 NA NA 0.56 NA 29.9 35.916322 175013-18-0 Pyraclostrobin 0.76 NA NA 0.61 NA NA 0.716377 156052-68-5 Zoxamide 1.5 NA NA 1.3 NA NA 0.416079 34256-82-1 Acetochlor 1.7 NA NA 1.5 NA NA 4.516106 23184-66-9 Butachlor 2.1 NA NA 2.0 NA NA 26.416372 68694-11-1 Triflumizole 2.8 35 NA 2.2 20.8 67.5 0.316305 67747-09-5 Prochloraz 3.5 NA NA NA 27.5 NA 81.516337 148477-71-8 Spirodiclofen 3.6 NA 2.8 1.9 NA 1.6 NA16082 15972-60-8 Alachlor 3.7 43 NA 2.0 24.9 NA 3.216343 119168-77-3 Tebufenpyrad 4.9 NA NA 2.6 NA NA 23.116166 87674-68-8 Dimethenamid 5.6 NA NA 4.6 NA NA 21.416342 112410-23-8 Tebufenozide 6.3 NA NA 7.6 NA NA 50.816329 124495-18-7 Quinoxyfen 6.6 NA 6.7 5.1 NA 40.6 NA16237 173584-44-6 Indoxacarb 8.5 NA NA 6.1 NA 44.1 10.716199 111812-58-9 (Z,E)-Fenpyroximate 8.6 NA NA 2.4 NA NA 35.916176 28434-00-6 S-Bioallethrin 9.2 NA NA 9.2 NA NA NA16136 120116-88-3 Cyazofamid 11 NA NA 10.1 9.6 NA 32.316168 110488-70-5 Dimethomorph 11 NA NA 9.4 NA NA NA
16118 1897-45-6 Chlorothalonil NA 0.6 NA NA 0.46 82.8 0.9 Table S2. List of top scoring chemicals in ToxCast PPARγ assays. AC50 values (µM) from 2 PPARγ agonist assays (Attagene-ATG, NCGC), 1 PPARγ direct binding assay (Novascreen-NVS), and 1 PPARγ antagonist assay (NCGC/Tox21) are shown here, ranked on the Attagene assay -- 2011 release (Knudsen et al. 2011). GSID = DSSTox chemical identifier; CASRN = CAS Registry Number; NA = not active.

16
Table S3.
Assay→ ATGC ATGC ATGC ATGT ATGT ATGT ATGT ATGC ATGT ATGC NCGC NCGC NCGC NCGC NVS NVS
CASRN ChemicalName CEBP LXRE GRE GR LXRα LXRβ PPARγ PPRE RXRα SREBP GR LXR PPARγ RXRα hGR PPARγHighScoring
96182-53-5 Tebupirimfos NA 9.4 NA NA 30 22 43 NA NA 31 NA 7.1 NA NA NA NA
23031-36-9 Prallethrin 29 NA NA NA NA NA 44 8.4 NA 33 NA 16.7 NA NA NA NA
584-79-2 d-cis,trans-Allethrin 25 NA NA NA NA NA 36 36 NA 48 NA 11.9 NA NA NA NA
131341-86-1 Fludioxonil 21 NA NA NA NA NA 28 24 2.72 NA NA NA NA 2.7 NA NA
120116-88-3 Cyazofamid 8.7 NA NA NA 11 13 11 12 NA NA NA NA NA NA NA NA
85509-19-9 Flusilazole NA NA NA NA NA NA 51 46 NA 20 NA NA NA NA 14 NA
55-38-9 Fenthion NA 34 NA NA 33 37 36 18 NA NA NA NA NA NA NA NA
111812-58-9 Fenpyroximate(Z,E) NA NA NA NA 4.3 8.8 8.6 0.065 NA NA NA 6.9 NA NA NA NA
68157-60-8 Forchlorfenuron 40 NA NA NA NA 37 46 26 NA NA NA NA NA NA NA NA
76-87-9 Triphenyltin NA NA NA NA NA NA 0.022 0.009 NA NA NA NA NA NA NA NA
119168-77-3 Tebufenpyrad NA NA NA NA 0.36 0.46 4.9 0.83 NA NA NA NA NA NA NA NA
MediumScorin
g
80-05-7 BisphenolA NA NA NA NA NA NA 27 37 NA NA NA NA NA NA 11 NA
1763-23-1 PFOS NA NA NA NA NA NA 26 NA NA NA NA NA NA NA 3.5 16
124495-18-7 Quinoxyfen NA NA NA NA NA NA 6.6 2.8 NA NA NA NA 6.7 NA NA NA
35554-44-0 Imazalil NA NA NA NA NA NA 73 NA 3.18 NA NA NA NA 3.2 NA NA
96489-71-3 Pyridaben NA NA NA NA NA NA 14 1.6 NA NA NA NA NA NA NA NA
79622-59-6 Fluazinam NA NA NA NA NA NA 0.51 NA NA NA NA NA NA NA NA 0.28
Inactiv
e
135410-20-7 Acetamiprid NA NA NA NA NA NA NA NA NA NA NA NA NA NA NA NA
3337-71-1 Asulam NA NA NA NA NA NA NA NA NA NA NA NA NA NA NA NA
98967-40-9 Flumetsulam NA NA NA NA NA NA NA NA NA NA NA NA NA NA NA NA
123-33-1 Maleichydrazide NA NA NA NA NA NA NA NA NA NA NA NA NA NA NA NA
6317-18-6 Methylenedithiocyanate NA NA NA NA NA NA NA NA NA NA NA NA NA NA NA NA
6923-22-4 Monocrotophos NA NA NA NA NA NA NA NA NA NA NA NA NA NA NA NA
123312-89-0 Pymetrozine NA NA NA NA NA NA NA NA NA NA NA NA NA NA NA NA
Table S3. 24 top, medium, low (zero/negative) scoring chemicals obtained by ToxPi analysis. Data directly correspond to ToxPi diagrams shown in Figure 3. Assay descriptions are available in Supplemental Material, Table S1. AC50 values are expressed in µM. Inactive chemicals were not active in any of the ToxCast assays for adipogenesis, feeding behavior, islet cell function, or insulin sensitivity. ATGC = Attagene cis-FactorialTM assay; ATGT = Attagene trans-FactorialTM assay; NCGC = GeneBLAzer agonist assay; NVS = Novascreen direct binding assay; NA = not active.

17
Table S4.
Gene Primer Sequence
36B4 Forward AAGCGCGTCCTGGCATTGTCT 36B4 Reverse CCGCAGGGGCAGCAGTGGT
FABP4 Forward GTCACCATCCGGTCAGAGAG FABP4 Reverse TCGACTTTCCATCCCACTTC
LPL Forward ACAACCAGGCCTTCGAGATT LPL Reverse TCAGGCCAGCTGAAGTAGGA
Fsp27 Forward CTGGAGGAAGATGGCACAAT Fsp27 Reverse GGGCCACATCGATCTTCTTA
Table S4. Primer sequences.

18
Table S5.
A.TopScoringPhaseIPPARγActivators(w/oZ-ScoreCorrection) B.TopScoringPhaseIPPARγActivators(withZ-ScoreCorrection)PPARγAssay Attagene NovaScreen Tox21/NCGC PPARγAssay Attagene NovaScreen Tox21/NCGCChemical Z-Score AC50 Z-Score AC50 Z-Score AC50 Chemical Z-Score AC50 Z-Score AC50 Z-Score AC50
Tetramethrin 5.7 0.02 1.4 0.3 -5.8 21.6 Quinclorac 8.9 0.03 17.2 0.0002 NA NAHexaconazole 2.4 1.2 5.0 0.3 7.2 0.1 Atrazine 6.9 15.2 13.4 0.3 14.1 0.2
Atrazine 6.9 15.2 13.4 0.3 14.1 0.2 2-Phenylphenol 14.9 0.1 11.2 1.1 NA NAFlutolanil -0.8 8.5 -1.1 10.3 -3.1 34.1 Iprodione 6.4 20.9 10.0 2.4 5.1 45.5Ametryn 0.4 15.1 -0.8 31.8 1.1 10.2 Methidathion 5.8 30.6 15.2 0.1 NA NA
Monocrotophos 4.0 2.2 0.3 20.8 -1.7 67.5 Triclopyr 4.8 54.7 10.2 2.1 5.3 41.5Triclosan 1.8 8.6 2.1 7.1 0.0 25.8 Fenamiphos 5.5 35.1 6.4 21.2 7.0 14.7Iprodione 6.4 20.9 10.0 2.4 5.1 45.5 MBP 6.6 18.2 15.2 0.1 NA NAMCPA 5.6 33.8 14.7 0.1 2.3 253.0 2,4-D 5.1 46.2 9.3 3.5 5.4 38.8MEHP -2.1 37.1 -1.1 20.1 2.2 2.8 Molinate 5.3 41.3 16.0 0.1 NA NA
Fenamiphos 5.5 35.1 6.4 21.2 7.0 14.7 MCPA 5.6 33.8 14.7 0.1 2.3 253.0Triclopyr 4.8 54.7 10.2 2.1 5.3 41.5 Diclosulam 6.0 26.3 NA NA 9.6 2.9
Triflumizole -1.4 20.4 -0.8 14.1 -3.6 79.9 Simazine 3.6 116.3 10.7 1.5 NA NA2,4-D 5.1 46.2 9.3 3.5 5.4 38.8 Isoxaflutole 7.5 10.4 NA NA 6.0 26.4
2-Phenylphenol 14.9 0.1 11.2 1.1 NA NA Disulfoton 4.1 81.8 10.6 1.6 NA NATri-allate 0.0 29.5 10.9 0.04 NA NA Fluazifop-butyl 9.7 2.8 11.9 0.7 NA NATrichlorfon -0.7 58.4 NA NA 11.0 0.05 Spirodiclofen 4.1 1.9 NA NA 4.3 1.6Fipronil -0.8 39.3 10.8 0.0 NA NA 2,4-DB 5.6 33.4 NA NA 6.7 16.7
Methidathion 5.8 30.6 15.2 0.1 NA NA Acifluorfen 5.4 37.1 7.1 13.5 NA NANiclosamide -0.8 0.6 NA NA -7.4 29.9 Ethoprop 3.6 114.1 9.2 3.9 NA NA
Table S5. Re-evaluation of PPARγ activators using Phase II data for three ToxCast PPARγ assays. AC50 values (µM) and Z-scores from ToxCast 2014 release (Filer et al. 2014) is shown. (A) The Phase I chemical library was ranked based solely on AC50 values (µM) of the Attagene and Tox21/NCGC PPARγ assays and NovaScreen PPARγ direct binding assay. (B) Chemicals were first filtered by removing those with cytotoxicity Z-scores less than 3 (U.S. EPA 2014) and then ranking them based on their Z-score + negative log(AC50). NA = not active.

19
Table S6.
PPARγActivation(AC50Values)andAdipogenesisAssays,Blumberg
PPARγActivationAssaysAC50Values,2011Release
PPARγActivationAssaysAC50Values,2014Release
TOXCAST Adipogenesis Activation ATGAgonist
NVSAgonist
NCGCAgonist
ATGAgonist
NVSAgonist
NCGCAgonist
NCGCAntag.ChemicalName 3T3-L1 COS7
Triphenyltin Positive PPARγActivator 0.02 0.022 0.54 NA 0.02 0.28 21.6 0.02Fluazinam Negative PPARγAntagonist 7.2 0.51 0.28 NA 1.2 0.26 0.07 1.3Niclosamide Negative Inactive NA 0.56 NA NA 0.56 NA 29.9 35.9Pyraclostrobin Negative Inactive NA 0.76 NA NA 0.61 NA NA 0.7Zoxamide Positive PPARγActivator 1.31 1.5 NA NA 1.3 NA NA 0.4Acetochlor Negative PPARγAntagonist 46.7 1.7 NA NA 1.5 NA NA 4.5Butachlor NotTested NotTested NA 2.1 NA NA 2.0 NA NA 26.4Triflumizole Positive PPARγActivator 11.5 2.8 35 NA 2.2 20.8 67.5 0.3Prochloraz Negative Inactive NA 3.5 NA NA NA 27.5 NA 81.5Spirodiclofen Positive PPARγActivator 12.76 3.6 NA 2.8 1.9 NA 1.6 NAAlachlor Negative PPARγAntagonist 4.9 3.7 43 NA 2.0 24.9 NA 3.2
Tebufenpyrad Negative Inactive NA 4.9 NA NA 2.6 NA NA 23.1Dimethenamid Negative Inactive NA 5.6 NA NA 4.6 NA NA 21.4Tebufenozide Negative Inactive NA 6.3 NA NA 7.6 NA NA 50.8Quinoxyfen Positive PPARγActivator 33.4 6.6 NA 6.7 5.1 NA 40.6 NAIndoxacarb Negative Inactive NA 8.5 NA NA 6.1 NA 44.1 10.7
Fenpyroximate(Z,E) Negative Inactive NA 8.6 NA NA 2.4 NA NA 35.9S-Bioallethrin Negative Inactive NA 9.2 NA NA 9.2 NA NA NADimethomorph Negative Inactive NA 11 NA NA 10.1 9.6 NA 32.3Cyazofamid Negative Inactive NA 11 NA NA 9.4 NA NA NAChlorothalonil Negative Inactive NA NA 0.6 NA NA 0.46 82.8 0.9
Table S6. Continuation of Table 1: Comparison of results in Figures 1 and 2 versus ToxCast assay data. Column 1 is a list of chemicals used in our PPARγ activation/antagonism assays and adipogenesis assays. AC50 values (µM) from ToxCast 2011 (Knudsen et al. 2011) and 2014 (Filer et al. 2014) releases are shown. ATG = Attagene FactorialTM PPARγ agonist assay; NVS = NovaScreen PPARγ direct binding assay; NCGC = GeneBLAzer PPARγ agonist or antagonist assay; NA = not active.

20
Table S7.
PPARγActivation(AC50Values)andAdipogenesis
Assays,Blumberg
PPARγActivationAssaysAC50Values,2011Release
PPARγActivationAssaysAC50Values,2014Release
RXRα,2011
RXRActivationAssaysAC50Values,2014Release
Adipo-genesis Activation ATG
AgonistNVS
AgonistNCGCAgonist
ATGAgonist
NVSAgonist
NCGCAgonist
NCGCAntag.
ATGAgonist
ATGRXRα
ATGRXRβ
NCGCAgonist
NCGCAntag.
3T3-L1 COS7Positive Inactive NA 43 NA NA 36.4 NA NA NA NA NA NA NA NANegative Inactive NA 44 NA NA 27.3 NA NA NA NA NA NA NA NANegative Inactive NA 36 NA NA 11.9 NA NA 61.2 NA NA 5.34 17.78 NA
PositiveRXRα
Activator 14.3 28 NA NA 19.3 NA NA 27.4 2.72 23.6 1.63 2.24 NA
Negative Inactive NA 11 NA NA 10.1 9.6 NA 32.3 NA NA NA NA NAPositive Inactive NA 51 NA NA 46.4 NA NA 71.0 NA NA NA NA NANegative Inactive NA 36 NA NA 39.4 NA NA NA NA NA NA NA NANegative Inactive NA 8.6 NA NA 2.4 NA NA 35.9 NA NA NA NA NAPositive Inactive NA 46 NA NA 48.2 NA NA 23.2 NA NA NA NA NA
Positive PPARγActivator
0.02 0.02 NA NA 0.02 0.28 21.6 0.02 NA NA 0.013 NA 2.51
Negative Inactive NA 4.9 NA NA 2.6 NA NA 23.1 NA NA NA NA NAPositive Inactive NA 27 NA NA NA NA NA 2.4 NA NA NA NA NANegative Inactive NA 26 16 NA 26.7 5.9 NA 253.0 NA NA NA NA NA
PositivePPARγ
Activator 33.4 6.6 NA 6.7 5.1 NA 40.6 NA NA NA NA NA 39.81
Negative Inactive NA 73 NA NA 59.9 NA NA NA 3.18 NA NA NA NA
InhibitorPPARγ
Activator 3.0 14 NA NA 10.1 NA NA 23.4 NA NA NA NA NA
Negative PPARγAntagonist
7.2 0.51 0.28 NA 1.2 0.26 0.07 1.3 NA 12.71 NA NA NA
Negative Inactive NA NA NA NA NA NA 104.1 25.7 NA NA NA NA NANegative Inactive NA NA NA NA NA NA NA NA NA NA NA NA NANegative Inactive NA NA NA NA NA NA NA NA NA NA NA NA NANegative Inactive NA NA NA NA NA NA NA NA NA NA NA NA NANegative Inactive NA NA NA NA NA NA NA NA NA NA NA NA NAPositive Inactive NA NA NA NA NA 12.5 NA NA NA NA NA NA NAPositive Inactive NA NA NA NA NA NA NA NA NA NA NA NA NA

21
Table S7. Continuation of Table 2: Comparison of results in Figures 3-7 versus ToxCast Phase I assay data. Column 1 is a list of the ToxPi chemicals (Figure 3) used in PPARγ or RXRα activation assays (Figure 4) and adipogenesis assays (Figures 5-7). AC50 values (µM) from ToxCast 2011 (Knudsen et al. 2011) and 2014 (Filer et al. 2014) releases are shown. ATG = Attagene FactorialTM agonist assay; NVS = NovaScreen direct binding assay; NCGC = GeneBLAzer agonist or antagonist assay; NA = not active.

22
References Filer D, Patisaul HB, Schug T, Reif D, Thayer K. 2014. Test driving ToxCast: endocrine
profiling for 1858 chemicals included in phase II. Curr Opin Pharmacol 19: 145-152.
Hulsen T, de Vlieg J, Alkema W. 2008. BioVenn - a web application for the comparison and
visualization of biological lists using area-proportional Venn diagrams. BMC Genomics 9:
488.
Knudsen TB, Houck KA, Sipes NS, Singh AV, Judson RS, Martin MT, et al. 2011. Activity
profiles of 309 ToxCast chemicals evaluated across 292 biochemical targets. Toxicology
282(1-2): 1-15.
U.S. EPA. 2014. Integrated Bioactivity and Exposure Ranking: A Computational Approach for
Prioritization and Screening Chemicals in the Endocrine Disruptor Screening Program.
Washington, D.C. Available: http://www.regulations.gov/#!documentDetail;D=EPA-HQ-
OPP-2014-0614-0003.


![Retinoic acid signaling and neuronal differentiationblumberg-serv.bio.uci.edu/reprints/janesick-2015a.pdfdifferentiation [37–41]. Zic3 is a direct target of the plu-ripotency factors](https://static.fdocuments.in/doc/165x107/5f097a927e708231d4270561/retinoic-acid-signaling-and-neuronal-differentiationblumberg-servbiouciedureprintsjanesick-2015apdf.jpg)


