Supplemental Information - df6sxcketz7bb.cloudfront.net · Supplemental Information. ... Oleg...
15
Supplemental Information Essential role of Kir5.1 channels in renal salt handling and blood pressure control Oleg Palygin, Vladislav Levchenko, Daria V. Ilatovskaya, Tengis S. Pavlov, Oleh M. Pochynyuk, Howard J. Jacob, Aron M. Geurts, Matthew R. Hodges, and Alexander Staruschenko Key Resources Table REAGENT or RESOURCE SOURCE IDENTIFIER Kir4.1 Alomone Labs APC-035 lot# apc035an1102 Kir5.1 C-terminal Sigma Aldrich SAB4501636 lot# 211083 NCC Dr. David H. Ellison (Oregon University, Portland) N/A p-NCC Dr. David H. Ellison (Oregon University, Portland) PhosphoSolutions N/A p1311-53 NKCC2 StressMarq SPC-401D; lot# 1202 (used for figure 5)
Transcript of Supplemental Information - df6sxcketz7bb.cloudfront.net · Supplemental Information. ... Oleg...

Supplemental Information
Essential role of Kir5.1 channels in renal salt handling and blood pressure control
Oleg Palygin, Vladislav Levchenko, Daria V. Ilatovskaya, Tengis S. Pavlov, Oleh M. Pochynyuk, Howard
J. Jacob, Aron M. Geurts, Matthew R. Hodges, and Alexander Staruschenko
Key Resources Table
REAGENT or RESOURCE
SOURCE IDENTIFIER
Kir4.1 Alomone Labs APC-035 lot# apc035an1102
Kir5.1 C-terminal Sigma Aldrich SAB4501636 lot# 211083
NCC Dr. David H. Ellison (Oregon University, Portland) N/A
p-NCC
Dr. David H. Ellison (Oregon University, Portland)
PhosphoSolutions
N/A
p1311-53
NKCC2 StressMarq
SPC-401D; lot# 1202
(used for figure 5)

p-NKCC2 Dr. Pablo Ortiz (Henry Ford Hospital, Detroit) N/A
NKCC2 Dr. Pablo Ortiz (Henry Ford Hospital, Detroit) N/A (used for figure 8)
ENaC-ɑ Alomone Labs ASC-030 lot# ASC030AN0402
ENaC-β StressMarq SPC-404-D lot# 1006
ENaC-γ StressMarq SPC-405-D lot# 1006
Kir5.1 Abcam ab74130
Kir4.1 Abcam ab105102
AQP2 Santa Cruz Biotechnology sc-28629
Alexa Fluor 488 Molecular Probes A-11034
Alexa Fluor 633 Molecular Probes A-21071
Diets, Chemicals
AIN-76A rodent
0.4% NaCl Dyets, Inc; http://dyets.com/ #D113755
AIN-76A rodent
4% NaCl Dyets, Inc; http://dyets.com/ #D113756
AIN-76A rodent
0.4% NaCl; 2% KCl Dyets, Inc; http://dyets.com/ #D113521
AIN-76A rodent
4% NaCl; 2% KCl Dyets, Inc; http://dyets.com/ #D113522
HCTZ Sigma Aldrich H4759
furosemide Sigma Aldrich PHR1057
benzamil R&D Systems (Tocris) 3380

FITC-inulin TdB Consultancy AB http://tdbcons.com/fitc-inulin-3
Experimental Models
SS-Kcnj16em1Mcwi http://rgd.mcw.edu/ 6893423
SS/JrHsdMcwi http://rgd.mcw.edu/ 61499
Primers for mRNA analysis
KCNJ16-1F TGAGACCCAAACCACCATCG
KCNJ16-1R GTGCGAAATAGCTGAAGCGG
Software and Algorithms
MetaMorph Molecular Devices www.moleculardevices.com
pClamp 10.2 Molecular Devices www.moleculardevices.com
OriginPro 7.0 OriginLab http://originlab.com/
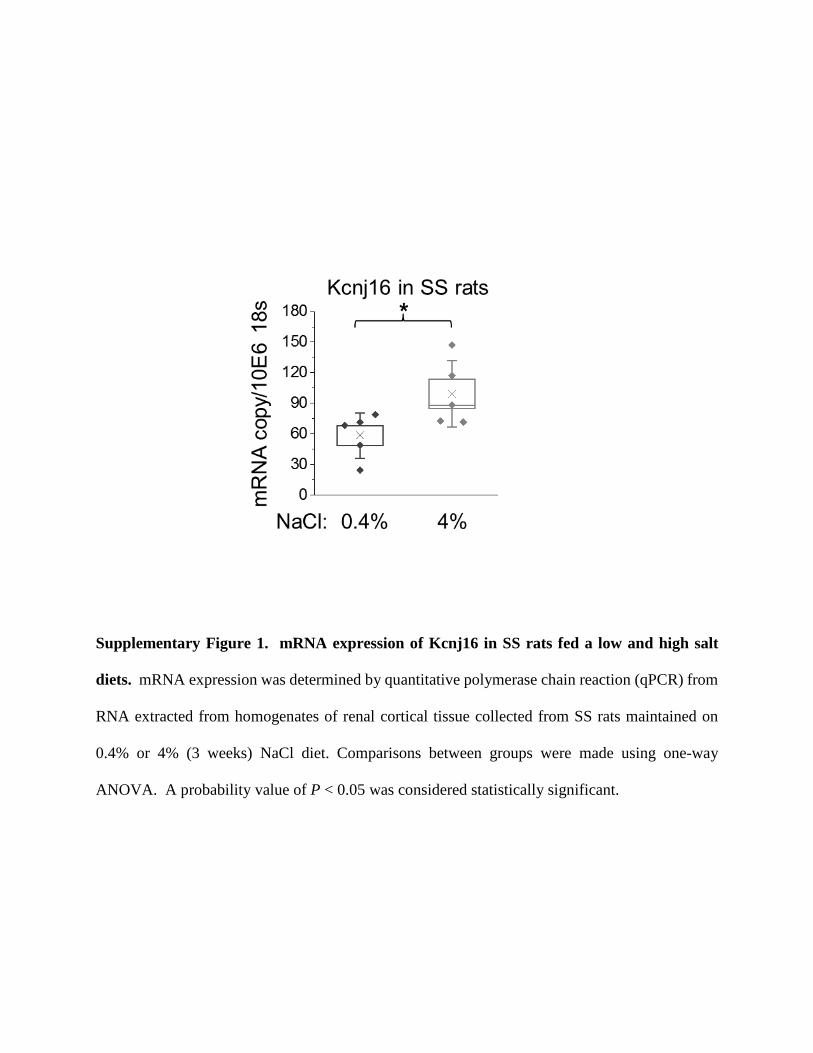
Supplementary Figure 1. mRNA expression of Kcnj16 in SS rats fed a low and high salt
diets. mRNA expression was determined by quantitative polymerase chain reaction (qPCR) from
RNA extracted from homogenates of renal cortical tissue collected from SS rats maintained on
0.4% or 4% (3 weeks) NaCl diet. Comparisons between groups were made using one-way
ANOVA. A probability value of P < 0.05 was considered statistically significant.

Supplementary Figure 2. Renal function of SSKcnj16-/- rats. (A) Difference in glomerular
filtration rate (GFR) between SS and SSKcnj16-/- rats (N=5 rats). Shown are representative FITC-
labeled inulin plasma distribution and elimination curves obtained after a single tail injection of
FITC-inulin, and corresponding summary graph of GFR values normalized to 100 g of body
weight (BW). (B) The blood urea nitrogen (BUN) level is higher in SSKcnj16-/- rats (N≥6).
Comparisons between groups were made using one-way ANOVA. A probability value of P < 0.05
was considered statistically significant.

Supplementary Figure 3. Control staining for image shown on Figure 3A. Immunostaining
images of Aqp2 (marker of collecting duct principal cells) and Kcnj16. Images taken with
transmitted light and control images (stained without primary abs) are also shown. Scale bar is 20
µm.

Supplementary Figure 4. Circadian variations in blood pressure and heart rates in SS and
SSKcnj16-/- rats. (A) Mean arterial pressure (MAP) for SS and SSKcnj16-/- rats in control (0.4% NaCl)
and after 30 days on a high salt diet (4% NaCl, with or without potassium supplement (2% KCl)).
(B) Changes in the heart rates for the same conditions as in (A) (N≥8).

Supplementary Figure 5. Changes in urinary electrolytes during high sodium / high
potassium diet challenge. Urine concentration of K+ (A), Na+ (B), Cl- (C) and Ca2+ (D) measured
by radiometer gas analyzer in control (0.4% NaCl) and weekly after the addition of high salt (4%
NaCl, with or without potassium supplement (2% KCl)) for SS and SSKcnj16-/- rats (N≥8).
Comparisons between groups were made using repeated measures ANOVA. A probability value
of P < 0.05 was considered statistically significant.

Figure 1
SSKcnj16-/-SS
KCNJ16
β-actin

Figure 4
SSKcnj16-/-SS
Kcnj10 GAPDH

Figure 5
NCC
pNCC
β-actin
β-actin
SSKcnj16-/-SS SSKcnj16-/-SS
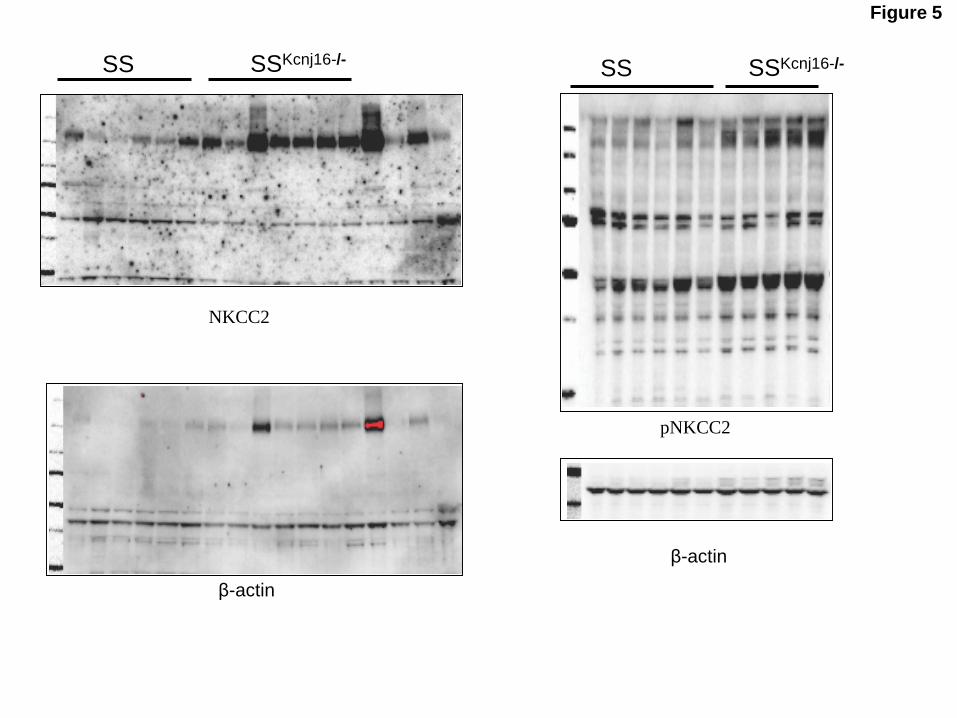
Figure 5
NKCC2
pNKCC2
β-actin
β-actin
SSKcnj16-/-SS SSKcnj16-/-SS

Figure 8ASSKcnj16-/-4% NaCl/2%KClSS 4% NaCl
SS4% NaCl/2%KCl
NKCC2
pNKCC2
β-actin
NCC
pNCC

Figure 8B
α-ENAC
β-ENAC
γ-ENAC
β-actin

Figure 8SSKcnj16-/-4% NaCl/2%KCl
SS 4% NaCl SS4% NaCl/2%KCl
γ-ENAC
β-actin