Supplemental Information for the Consolidated Financial ...
17
1 Supplemental Information for the Consolidated Financial Results for the Fourth Quarter Ended March 31, 2018 2017 年度第 4 四半期連結業績補足資料 April 27, 2018 Sony Corporation ソニー株式会社 Supplemental Financial Data 補足財務データ 2 ■ Average foreign exchange rates 期中平均為替レート 2 ■ Results by segment セグメント別業績 2 ■ Sales to customers by product category (to external customers) 製品カテゴリー別売上高(外部顧客に対するもの) 3 ■ Unit sales of key products 主要製品販売台数 3 ■ Sales to customers by geographic region (to external customers) 地域別売上高(外部顧客に対するもの) 3 ■ Depreciation and amortization (D&A) by segment セグメント別減価償却費及び償却費 4 ■ Amortization of film costs 繰延映画製作費の償却費 4 ■ Additions to long-lived assets and D&A 固定資産の増加額、減価償却費及び償却費 4 ■ Additions to long-lived assets and D&A excluding Financial Services 金融分野を除くソニー連結の固定資産の増加額、減価償却費及び償却費 4 ■ Research and development (R&D) expenses 研究開発費 5 ■ R&D expenses by segment セグメント別研究開発費 5 ■ Restructuring charges by segment (includes accelerated depreciation expense) セグメント別構造改革費用(関連する加速償却費用を含む) 5 ■ Period-end foreign exchange rates 期末為替レート 5 ■ Inventory by segment セグメント別棚卸資産 5 ■ Film costs (balance) 繰延映画製作費(残高) 6 ■ Long-lived assets by segment セグメント別固定資産 6 ■ Goodwill by segment セグメント別営業権 6 ■ Return on Invested Capital (ROIC) セグメント別ROIC 6 Game & Network Services Segment Supplemental Information (English only) 7 ■ Game & Network Services segment sales breakdown 7 ■ PlayStation®4 hardware and software unit sales 7 ■ Number of PlayStation®Plus subscribers 7 ■ Cumulative sell-through units of PlayStation®4 hardware and software 7 Music Segment Supplemental Information (English only) 8 ■ Recorded Music 8 - Recorded Music Revenue breakdown of physical, digital and other revenues - Top 10 best-selling recorded music projects - Noteworthly projects ■ Music Publishing 9 - Number of songs in the music publishing catalog owned and administered Pictures Segment Supplemental Information (English only) 10 ■ Pictures Segment Aggregated U.S. Dollar Information 10 - Pictures segment sales and operating revenue and operating income (loss) - Sales by category and Motion Picture Revenue breakdown - Film costs breakdown ■ Motion Pictures 11 - Motion Pictures Box Office for films released in North America - Select films to be released in the U.S. - Top 10 Home Entertainment titles released - Select Home Entertainment titles to be released ■ Television Productions 13 - Television Series with an original broadcast on a U.S. linear network - Television Series with a new season to premiere on a U.S. linear network - Select Television Series in U.S. off-network syndication - Television Series with an original broadcast on a digital platform - Television Series with a new season to premiere on a digital platform - Television Series with an original broadcast on a non-U.S. linear network ■ Media Networks 15 - Television and Digital Channels Cautionary Statement 17
Transcript of Supplemental Information for the Consolidated Financial ...
1
Supplemental Information for the Consolidated Financial Results for the Fourth Quarter Ended March 31, 2018
2017 年度第 4 四半期連結業績補足資料 April 27, 2018
Sony Corporation ソニー株式会社
Supplemental Financial Data 補足財務データ 2
■ Average foreign exchange rates 期中平均為替レート 2 ■ Results by segment セグメント別業績 2 ■ Sales to customers by product category (to external customers) 製品カテゴリー別売上高(外部顧客に対するもの) 3 ■ Unit sales of key products 主要製品販売台数 3 ■ Sales to customers by geographic region (to external customers) 地域別売上高(外部顧客に対するもの) 3 ■ Depreciation and amortization (D&A) by segment セグメント別減価償却費及び償却費 4 ■ Amortization of film costs 繰延映画製作費の償却費 4 ■ Additions to long-lived assets and D&A 固定資産の増加額、減価償却費及び償却費 4 ■ Additions to long-lived assets and D&A excluding Financial Services 金融分野を除くソニー連結の固定資産の増加額、減価償却費及び償却費 4 ■ Research and development (R&D) expenses 研究開発費 5 ■ R&D expenses by segment セグメント別研究開発費 5 ■ Restructuring charges by segment (includes accelerated depreciation expense) セグメント別構造改革費用(関連する加速償却費用を含む) 5 ■ Period-end foreign exchange rates 期末為替レート 5 ■ Inventory by segment セグメント別棚卸資産 5 ■ Film costs (balance) 繰延映画製作費(残高) 6 ■ Long-lived assets by segment セグメント別固定資産 6 ■ Goodwill by segment セグメント別営業権 6 ■ Return on Invested Capital (ROIC) セグメント別ROIC 6
Game & Network Services Segment Supplemental Information (English only) 7 ■ Game & Network Services segment sales breakdown 7 ■ PlayStation®4 hardware and software unit sales 7 ■ Number of PlayStation®Plus subscribers 7 ■ Cumulative sell-through units of PlayStation®4 hardware and software 7
Music Segment Supplemental Information (English only) 8 ■ Recorded Music 8
- Recorded Music Revenue breakdown of physical, digital and other revenues - Top 10 best-selling recorded music projects - Noteworthly projects
■ Music Publishing 9 - Number of songs in the music publishing catalog owned and administered
Pictures Segment Supplemental Information (English only) 10 ■ Pictures Segment Aggregated U.S. Dollar Information 10
- Pictures segment sales and operating revenue and operating income (loss) - Sales by category and Motion Picture Revenue breakdown - Film costs breakdown
■ Motion Pictures 11 - Motion Pictures Box Office for films released in North America - Select films to be released in the U.S. - Top 10 Home Entertainment titles released - Select Home Entertainment titles to be released
■ Television Productions 13 - Television Series with an original broadcast on a U.S. linear network - Television Series with a new season to premiere on a U.S. linear network - Select Television Series in U.S. off-network syndication - Television Series with an original broadcast on a digital platform - Television Series with a new season to premiere on a digital platform - Television Series with an original broadcast on a non-U.S. linear network
■ Media Networks 15 - Television and Digital Channels
Cautionary Statement 17
2
Supplemental Financial Data 補足財務データ
The data and terminology hereinafter are presented in accordance with generally accepted accounting principles in the United States of America (“U.S. GAAP”). For further detail on terminology, please refer to the notes to the Consolidated Financial Statements on page F-13 and afterwards in Sony’s Form 20-F for the fiscal year ended March 31, 2017. A footnote is added where non-U.S. GAAP data is presented. Definitions of abbreviated names in the charts below are the following:
Official Names Abbreviated Names Official Names Abbreviated Names Game & Network Services segment G&NS Corporate Corp. Home Entertainment & Sound segment HE&S Corporate and elimination Corp. Elim. Imaging Products & Solutions segment IP&S All Other, Corporate and elimination All Other, Corp. Mobile Communications segment MC Consolidated Total Cons. Total Semiconductors segment Semicon Operating income OI Components segment Compo Property, plant and equipment PP&E Financial Services segment Financial
The data hereinafter is presented in accordance with the most recent realignment of the Segments and Categories (product categories containing sales to external customers). For details on this realignment, please refer to Financial Statements and Consolidated Financial Results on page F-13 for the Fiscal Year Ended March 31, 2018.
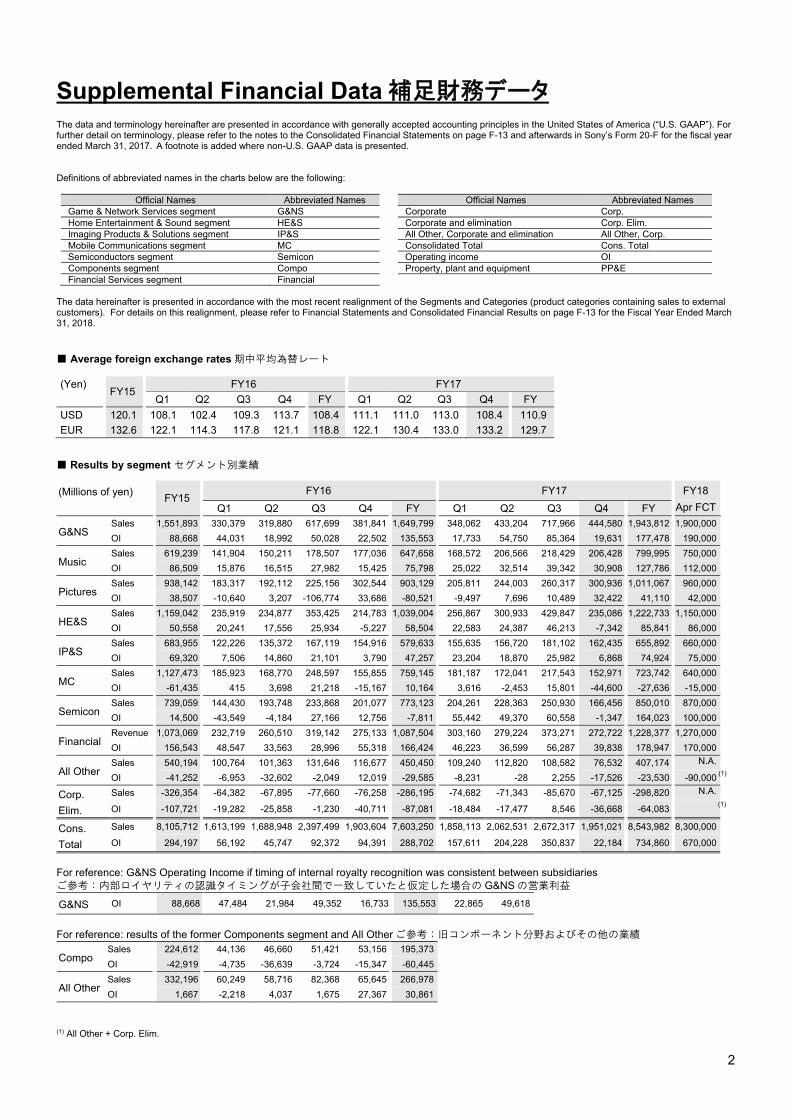
■ Average foreign exchange rates 期中平均為替レート
■ Results by segment セグメント別業績
(Millions of yen) FY15
FY16 FY17 FY18
Q1 Q2 Q3 Q4 FY Q1 Q2 Q3 Q4 FY Apr FCT
G&NS Sales 1,551,893 330,379 319,880 617,699 381,841 1,649,799 348,062 433,204 717,966 444,580 1,943,812 1,900,000
OI 88,668 44,031 18,992 50,028 22,502 135,553 17,733 54,750 85,364 19,631 177,478 190,000
Music Sales 619,239 141,904 150,211 178,507 177,036 647,658 168,572 206,566 218,429 206,428 799,995 750,000
OI 86,509 15,876 16,515 27,982 15,425 75,798 25,022 32,514 39,342 30,908 127,786 112,000
Pictures Sales 938,142 183,317 192,112 225,156 302,544 903,129 205,811 244,003 260,317 300,936 1,011,067 960,000
OI 38,507 -10,640 3,207 -106,774 33,686 -80,521 -9,497 7,696 10,489 32,422 41,110 42,000
HE&S Sales 1,159,042 235,919 234,877 353,425 214,783 1,039,004 256,867 300,933 429,847 235,086 1,222,733 1,150,000
OI 50,558 20,241 17,556 25,934 -5,227 58,504 22,583 24,387 46,213 -7,342 85,841 86,000
IP&S Sales 683,955 122,226 135,372 167,119 154,916 579,633 155,635 156,720 181,102 162,435 655,892 660,000
OI 69,320 7,506 14,860 21,101 3,790 47,257 23,204 18,870 25,982 6,868 74,924 75,000
MC Sales 1,127,473 185,923 168,770 248,597 155,855 759,145 181,187 172,041 217,543 152,971 723,742 640,000
OI -61,435 415 3,698 21,218 -15,167 10,164 3,616 -2,453 15,801 -44,600 -27,636 -15,000
Semicon Sales 739,059 144,430 193,748 233,868 201,077 773,123 204,261 228,363 250,930 166,456 850,010 870,000
OI 14,500 -43,549 -4,184 27,166 12,756 -7,811 55,442 49,370 60,558 -1,347 164,023 100,000
Financial Revenue 1,073,069 232,719 260,510 319,142 275,133 1,087,504 303,160 279,224 373,271 272,722 1,228,377 1,270,000
OI 156,543 48,547 33,563 28,996 55,318 166,424 46,223 36,599 56,287 39,838 178,947 170,000
All Other Sales 540,194 100,764 101,363 131,646 116,677 450,450 109,240 112,820 108,582 76,532 407,174 N.A.
OI -41,252 -6,953 -32,602 -2,049 12,019 -29,585 -8,231 -28 2,255 -17,526 -23,530 -90,000
Corp.
Elim.
Sales -326,354 -64,382 -67,895 -77,660 -76,258 -286,195 -74,682 -71,343 -85,670 -67,125 -298,820 N.A.
OI -107,721 -19,282 -25,858 -1,230 -40,711 -87,081 -18,484 -17,477 8,546 -36,668 -64,083
Cons.
Total
Sales 8,105,712 1,613,199 1,688,948 2,397,499 1,903,604 7,603,250 1,858,113 2,062,531 2,672,317 1,951,021 8,543,982 8,300,000
OI 294,197 56,192 45,747 92,372 94,391 288,702 157,611 204,228 350,837 22,184 734,860 670,000
For reference: G&NS Operating Income if timing of internal royalty recognition was consistent between subsidiaries ご参考:内部ロイヤリティの認識タイミングが子会社間で一致していたと仮定した場合の G&NS の営業利益
G&NS OI 88,668 47,484 21,984 49,352 16,733 135,553 22,865 49,618
For reference: results of the former Components segment and All Other ご参考:旧コンポーネント分野およびその他の業績
Compo Sales 224,612 44,136 46,660 51,421 53,156 195,373
OI -42,919 -4,735 -36,639 -3,724 -15,347 -60,445
All Other Sales 332,196 60,249 58,716 82,368 65,645 266,978
OI 1,667 -2,218 4,037 1,675 27,367 30,861
(1) All Other + Corp. Elim.
(Yen) FY15
FY16 FY17
Q1 Q2 Q3 Q4 FY Q1 Q2 Q3 Q4 FY
USD 120.1 108.1 102.4 109.3 113.7 108.4 111.1 111.0 113.0 108.4 110.9
EUR 132.6 122.1 114.3 117.8 121.1 118.8 122.1 130.4 133.0 133.2 129.7
(1)
(1)
3
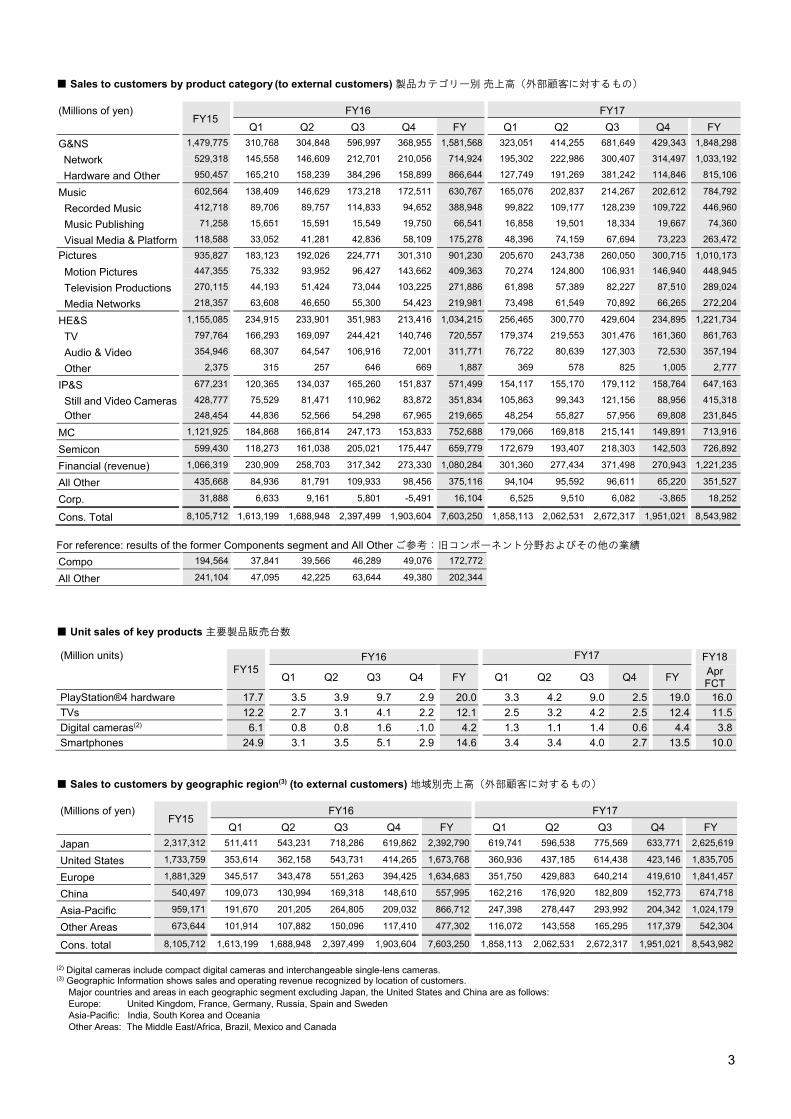
■ Sales to customers by product category (to external customers) 製品カテゴリー別 売上高(外部顧客に対するもの)
(Millions of yen) FY15
FY16 FY17
Q1 Q2 Q3 Q4 FY Q1 Q2 Q3 Q4 FY
G&NS 1,479,775 310,768 304,848 596,997 368,955 1,581,568 323,051 414,255 681,649 429,343 1,848,298
Network 529,318 145,558 146,609 212,701 210,056 714,924 195,302 222,986 300,407 314,497 1,033,192
Hardware and Other 950,457 165,210 158,239 384,296 158,899 866,644 127,749 191,269 381,242 114,846 815,106
Music 602,564 138,409 146,629 173,218 172,511 630,767 165,076 202,837 214,267 202,612 784,792
Recorded Music 412,718 89,706 89,757 114,833 94,652 388,948 99,822 109,177 128,239 109,722 446,960
Music Publishing 71,258 15,651 15,591 15,549 19,750 66,541 16,858 19,501 18,334 19,667 74,360
Visual Media & Platform 118,588 33,052 41,281 42,836 58,109 175,278 48,396 74,159 67,694 73,223 263,472
Pictures 935,827 183,123 192,026 224,771 301,310 901,230 205,670 243,738 260,050 300,715 1,010,173
Motion Pictures 447,355 75,332 93,952 96,427 143,662 409,363 70,274 124,800 106,931 146,940 448,945
Television Productions 270,115 44,193 51,424 73,044 103,225 271,886 61,898 57,389 82,227 87,510 289,024
Media Networks 218,357 63,608 46,650 55,300 54,423 219,981 73,498 61,549 70,892 66,265 272,204
HE&S 1,155,085 234,915 233,901 351,983 213,416 1,034,215 256,465 300,770 429,604 234,895 1,221,734
TV 797,764 166,293 169,097 244,421 140,746 720,557 179,374 219,553 301,476 161,360 861,763
Audio & Video 354,946 68,307 64,547 106,916 72,001 311,771 76,722 80,639 127,303 72,530 357,194
Other 2,375 315 257 646 669 1,887 369 578 825 1,005 2,777
IP&S 677,231 120,365 134,037 165,260 151,837 571,499 154,117 155,170 179,112 158,764 647,163
Still and Video Cameras 428,777 75,529 81,471 110,962 83,872 351,834 105,863 99,343 121,156 88,956 415,318
Other 248,454 44,836 52,566 54,298 67,965 219,665 48,254 55,827 57,956 69,808 231,845
MC 1,121,925 184,868 166,814 247,173 153,833 752,688 179,066 169,818 215,141 149,891 713,916
Semicon 599,430 118,273 161,038 205,021 175,447 659,779 172,679 193,407 218,303 142,503 726,892
Financial (revenue) 1,066,319 230,909 258,703 317,342 273,330 1,080,284 301,360 277,434 371,498 270,943 1,221,235
All Other 435,668 84,936 81,791 109,933 98,456 375,116 94,104 95,592 96,611 65,220 351,527
Corp. 31,888 6,633 9,161 5,801 -5,491 16,104 6,525 9,510 6,082 -3,865 18,252
Cons. Total 8,105,712 1,613,199 1,688,948 2,397,499 1,903,604 7,603,250 1,858,113 2,062,531 2,672,317 1,951,021 8,543,982
For reference: results of the former Components segment and All Other ご参考:旧コンポーネント分野およびその他の業績
Compo 194,564 37,841 39,566 46,289 49,076 172,772
All Other 241,104 47,095 42,225 63,644 49,380 202,344
■ Unit sales of key products 主要製品販売台数
(Million units) FY15
FY16 FY17 FY18
Q1 Q2 Q3 Q4 FY Q1 Q2 Q3 Q4 FY Apr FCT
PlayStation®4 hardware 17.7 3.5 3.9 9.7 2.9 20.0 3.3 4.2 9.0 2.5 19.0 16.0
TVs 12.2 2.7 3.1 4.1 2.2 12.1 2.5 3.2 4.2 2.5 12.4 11.5
Digital cameras(2) 6.1 0.8 0.8 1.6 .1.0 4.2 1.3 1.1 1.4 0.6 4.4 3.8
Smartphones 24.9 3.1 3.5 5.1 2.9 14.6 3.4 3.4 4.0 2.7 13.5 10.0
■ Sales to customers by geographic region(3) (to external customers) 地域別売上高(外部顧客に対するもの)
(Millions of yen) FY15
FY16 FY17
Q1 Q2 Q3 Q4 FY Q1 Q2 Q3 Q4 FY
Japan 2,317,312 511,411 543,231 718,286 619,862 2,392,790 619,741 596,538 775,569 633,771 2,625,619
United States 1,733,759 353,614 362,158 543,731 414,265 1,673,768 360,936 437,185 614,438 423,146 1,835,705
Europe 1,881,329 345,517 343,478 551,263 394,425 1,634,683 351,750 429,883 640,214 419,610 1,841,457
China 540,497 109,073 130,994 169,318 148,610 557,995 162,216 176,920 182,809 152,773 674,718
Asia-Pacific 959,171 191,670 201,205 264,805 209,032 866,712 247,398 278,447 293,992 204,342 1,024,179
Other Areas 673,644 101,914 107,882 150,096 117,410 477,302 116,072 143,558 165,295 117,379 542,304
Cons. total 8,105,712 1,613,199 1,688,948 2,397,499 1,903,604 7,603,250 1,858,113 2,062,531 2,672,317 1,951,021 8,543,982
(2) Digital cameras include compact digital cameras and interchangeable single-lens cameras. (3) Geographic Information shows sales and operating revenue recognized by location of customers. Major countries and areas in each geographic segment excluding Japan, the United States and China are as follows: Europe: United Kingdom, France, Germany, Russia, Spain and Sweden Asia-Pacific: India, South Korea and Oceania Other Areas: The Middle East/Africa, Brazil, Mexico and Canada
4
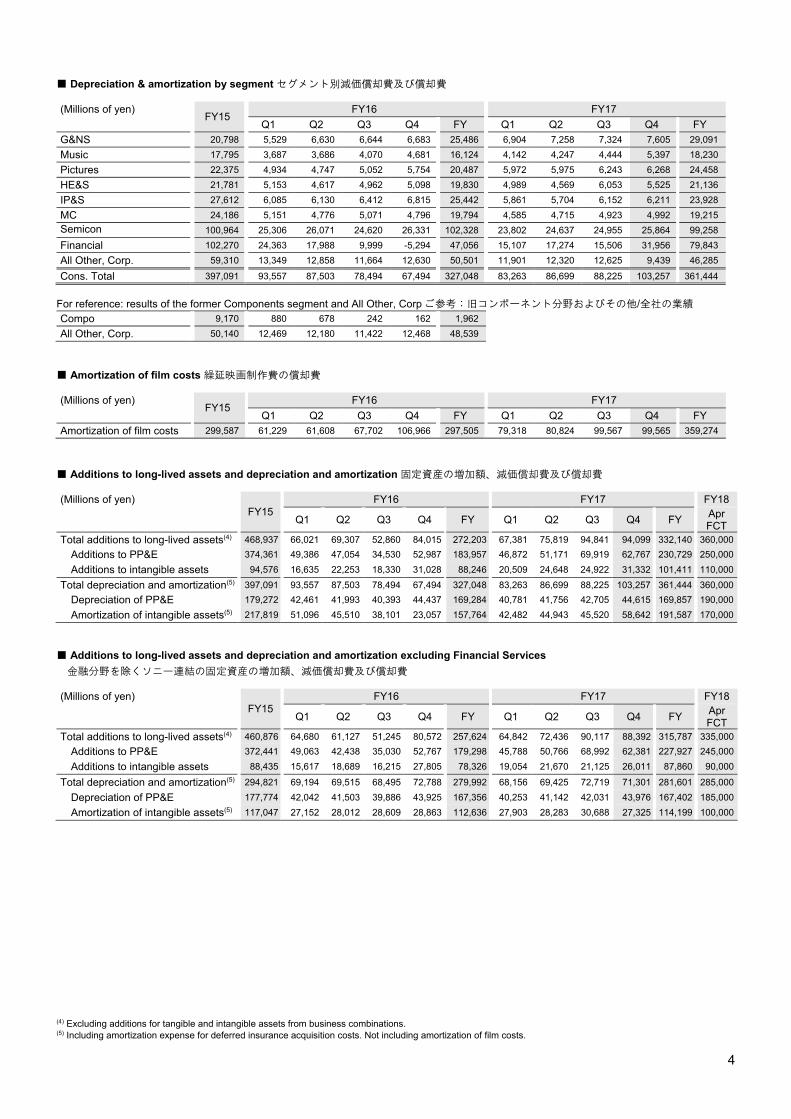
■ Depreciation & amortization by segment セグメント別減価償却費及び償却費
(Millions of yen) FY15
FY16 FY17 Q1 Q2 Q3 Q4 FY Q1 Q2 Q3 Q4 FY
G&NS 20,798 5,529 6,630 6,644 6,683 25,486 6,904 7,258 7,324 7,605 29,091
Music 17,795 3,687 3,686 4,070 4,681 16,124 4,142 4,247 4,444 5,397 18,230
Pictures 22,375 4,934 4,747 5,052 5,754 20,487 5,972 5,975 6,243 6,268 24,458
HE&S 21,781 5,153 4,617 4,962 5,098 19,830 4,989 4,569 6,053 5,525 21,136
IP&S 27,612 6,085 6,130 6,412 6,815 25,442 5,861 5,704 6,152 6,211 23,928
MC 24,186 5,151 4,776 5,071 4,796 19,794 4,585 4,715 4,923 4,992 19,215
Semicon 100,964 25,306 26,071 24,620 26,331 102,328 23,802 24,637 24,955 25,864 99,258
Financial 102,270 24,363 17,988 9,999 -5,294 47,056 15,107 17,274 15,506 31,956 79,843
All Other, Corp. 59,310 13,349 12,858 11,664 12,630 50,501 11,901 12,320 12,625 9,439 46,285
Cons. Total 397,091 93,557 87,503 78,494 67,494 327,048 83,263 86,699 88,225 103,257 361,444
For reference: results of the former Components segment and All Other, Corp ご参考:旧コンポーネント分野およびその他/全社の業績 Compo 9,170 880 678 242 162 1,962
All Other, Corp. 50,140 12,469 12,180 11,422 12,468 48,539
■ Amortization of film costs 繰延映画制作費の償却費
(Millions of yen) FY15
FY16 FY17 Q1 Q2 Q3 Q4 FY Q1 Q2 Q3 Q4 FY
Amortization of film costs 299,587 61,229 61,608 67,702 106,966 297,505 79,318 80,824 99,567 99,565 359,274
■ Additions to long-lived assets and depreciation and amortization 固定資産の増加額、減価償却費及び償却費
(Millions of yen) FY15
FY16 FY17 FY18
Q1 Q2 Q3 Q4 FY Q1 Q2 Q3 Q4 FY Apr FCT
Total additions to long-lived assets(4) 468,937 66,021 69,307 52,860 84,015 272,203 67,381 75,819 94,841 94,099 332,140 360,000
Additions to PP&E 374,361 49,386 47,054 34,530 52,987 183,957 46,872 51,171 69,919 62,767 230,729 250,000
Additions to intangible assets 94,576 16,635 22,253 18,330 31,028 88,246 20,509 24,648 24,922 31,332 101,411 110,000
Total depreciation and amortization(5) 397,091 93,557 87,503 78,494 67,494 327,048 83,263 86,699 88,225 103,257 361,444 360,000
Depreciation of PP&E 179,272 42,461 41,993 40,393 44,437 169,284 40,781 41,756 42,705 44,615 169,857 190,000
Amortization of intangible assets(5) 217,819 51,096 45,510 38,101 23,057 157,764 42,482 44,943 45,520 58,642 191,587 170,000
■ Additions to long-lived assets and depreciation and amortization excluding Financial Services
金融分野を除くソニー連結の固定資産の増加額、減価償却費及び償却費
(Millions of yen) FY15
FY16 FY17 FY18
Q1 Q2 Q3 Q4 FY Q1 Q2 Q3 Q4 FY Apr FCT
Total additions to long-lived assets(4) 460,876 64,680 61,127 51,245 80,572 257,624 64,842 72,436 90,117 88,392 315,787 335,000
Additions to PP&E 372,441 49,063 42,438 35,030 52,767 179,298 45,788 50,766 68,992 62,381 227,927 245,000
Additions to intangible assets 88,435 15,617 18,689 16,215 27,805 78,326 19,054 21,670 21,125 26,011 87,860 90,000
Total depreciation and amortization(5) 294,821 69,194 69,515 68,495 72,788 279,992 68,156 69,425 72,719 71,301 281,601 285,000
Depreciation of PP&E 177,774 42,042 41,503 39,886 43,925 167,356 40,253 41,142 42,031 43,976 167,402 185,000
Amortization of intangible assets(5) 117,047 27,152 28,012 28,609 28,863 112,636 27,903 28,283 30,688 27,325 114,199 100,000
(4) Excluding additions for tangible and intangible assets from business combinations. (5) Including amortization expense for deferred insurance acquisition costs. Not including amortization of film costs.

5
■ Research and development expenses 研究開発費
(Millions of yen) FY15
FY16 FY17 FY18
Q1 Q2 Q3 Q4 FY Q1 Q2 Q3 Q4 FY Apr FCT
Research and development expenses 468,183 110,178 106,157 108,789 122,332 447,456 101,789 108,807 115,783 132,138 458,518 470,000
■ Research and development expenses by segment セグメント別研究開発費
(Millions of yen) FY15 FY16 FY17
G&NS 91,891 95,553 106,227
HE&S 44,830 47,255 58,044
IP&S 61,529 58,622 58,578
MC 78,064 54,852 55,446
Semicon 120,354 117,579 107,209
Corporate R&D 31,302 44,381 44,901
■ Restructuring charges by segment (includes related accelerated depreciation expense(6))
セグメント別構造改革費用(関連する加速減価償却費用を含む)
(Millions of yen) FY15
FY16 FY17 Q1 Q2 Q3 Q4 FY Q1 Q2 Q3 Q4 FY
G&NS 135 110 -104 - 225 231 - - - - -
Music 1,868 110 708 837 1,935 3,590 7 215 1,594 4,814 6,630
Pictures 1,606 835 60 748 824 2,467 570 -127 39 2,440 2,922
HE&S 1,207 12 1 529 210 752 15 4 8 825 852
IP&S 204 7 10 157 466 640 12 9 2 601 624
MC 21,638 322 -174 44 634 826 649 42 538 797 2,026
Semicon -113 3 - -3 -9 -9 - - - 28 28
Financial - - - - - - - - - - -
All Other, Corp. 11,714 346 32,075 2,773 16,524 51,718 1,185 1,448 911 5,779 9,323
Cons. Total 38,259 1,745 32,576 5,085 20,809 60,215 2,438 1,591 3,092 15,284 22,405 For reference: results of the former Components segment and All Other, Corp ご参考:旧コンポーネント分野およびその他/全社の業績 Compo 22 - 32,833 - 10,606 43,439
All Other, Corp. 11,692 346 -758 2,773 5,918 8,279
■ Period-end foreign exchange rates 期末為替レート
(Yen) FY16 FY17 Q1 Q2 Q3 Q4 Q1 Q2 Q3 Q4
Period-end USD rates 102.9 101.1 116.5 112.2 112.0 112.7 113.0 106.2
Period-end EUR rates 114.4 113.4 122.7 119.8 128.0 132.9 134.9 130.5
■ Inventory by segment セグメント別棚卸資産
(Billions of yen) FY16 FY17 Q1 Q2 Q3 Q4 Q1 Q2 Q3 Q4
G&NS 110.6 241.3 114.5 81.7 116.7 229.6 103.3 74.0
Music 14.2 15.8 17.2 14.4 13.8 14.3 15.8 14.1
Pictures 41.7 42.7 48.9 43.0 43.5 44.4 45.9 38.9
HE&S 103.2 128.4 103.1 114.1 135.3 173.8 144.7 121.3
IP&S 67.0 71.1 78.1 62.9 71.5 83.4 90.3 75.6
MC 88.6 105.9 87.9 79.5 87.4 106.3 85.2 78.7
Semicon 229.7 214.2 189.7 203.6 215.2 224.5 216.7 240.9
All Other and Corp. 62.9 43.0 41.7 41.6 44.7 54.4 51.8 49.4
Cons. Total 717.9 862.4 681.1 640.8 728.1 930.7 753.7 692.9 For reference: results of the former Components segment and All Other, Corp ご参考:旧コンポーネント分野およびその他/全社の業績 Compo 37.1 11.7 12.6 11.4
All Other and Corp. 25.8 31.3 29.1 30.2 (6) Accelerated depreciation related to restructuring is incurred when the useful life or salvage value of restructured assets is changed. Accelerated depreciation is not
included in restructuring charges recorded in accordance with U.S. GAAP, but Sony includes it for the purposes of measuring the impact of restructuring. Sony discloses restructuring charges in accordance with U.S.GAAP in Form 20-F and the Quarterly Securities Reports.

6
■ Film costs (balance) 繰延映画製作費(残高)
(Billions of yen) FY16 FY17 Q1 Q2 Q3 Q4 Q1 Q2 Q3 Q4
Film costs 310.3 320.9 369.2 336.9 352.1 367.3 365.8 327.6
■ Long-lived assets(7) by segment セグメント別固定資産
(Billions of yen) FY16
FY17 Q1 Q2 Q3 Q4
G&NS 134.7 137.5 139.4 141.9 136.9
Music 237.7 236.1 235.4 235.0 197.8
Pictures 162.4 160.5 160.2 159.2 150.4
HE&S 37.4 37.1 36.8 38.2 39.6
IP&S 61.6 60.9 56.1 56.3 63.3
MC 66.0 63.7 65.1 63.4 28.7
Semicon 354.0 354.2 348.3 368.5 366.2
Financial 52.0 51.5 59.1 60.4 57.0
All Other and Corp. 236.6 231.8 239.1 239.7 226.7
Cons. Total 1,342.4 1,333.3 1,339.5 1,362.6 1,266.6
■ Goodwill by segment セグメント別営業権
(Billions of yen) FY16
FY17
Q1 Q2 Q3 Q4
G&NS 151.9 152.1 152.5 152.6 150.6
Music 166.1 167.7 173.0 172.1 165.4
Pictures 138.2 138.4 142.0 154.7 144.4
HE&S - - - - -
IP&S 8.2 9.6 9.7 9.7 9.5
MC 3.3 3.3 3.3 3.3 3.3
Semicon 48.0 48.0 48.1 48.2 45.8
Financial 2.4 2.4 7.2 7.2 7.2
All Other and Corp. 4.4 4.4 4.5 4.5 4.3
Cons. Total 522.5 525.9 540.3 552.3 530.5 ■ Return on Invested Capital (ROIC) by segment セグメント別 ROIC
(Billions of yen) FY16 FY17
FY18 Apr FCT
ROIC Return(8) Invested Capital(9)
ROIC Return(8) Invested Capital(9)
ROIC
G&NS 22.0% 89.5 407.6 28.7% 117.2 408.1 33.1%
Music 18.9% 50.0 265.0 36.2% 84.3 233.2 37.0%
Pictures -6.2% -52.9 858.2 3.1% 27.1 876.1 3.0%
HE&S 26.2% 38.6 147.0 32.1% 56.6 176.3 31.8%
IP&S 22.2% 31.2 140.7 33.0% 49.5 149.6 31.9%
MC 3.7% 6.7 182.6 -13.2% -18.2 138.1 -7.7%
Semicon -0.8% -5.2 647.9 17.3% 108.3 627.2 10.2%
(7) Long-lived assets include PP&E and intangible assets. (8) Operating Income after tax. Tax rates applied to all segments are 34% for FY16 and FY17 and 32% for FY18. (9) The total of long-lived assets, goodwill, investment and inventory have been used for G&NS, HE&S, IP&S, MC and Semicon. The total of equity and net debt
have been used for Music and Pictures (deposits in group companies are excluded from debt). The amount of inventory of G&NS, HE&S, IP&S, MC and Semicon and the invested capital of Music and Pictures have been calculated by averaging the amount of each at five points in time – the beginning of the fiscal year and the end of each four quarters. The amount of long-lived assets, goodwill and investment of G&NS, HE&S, IP&S, MC and Semicon have been calculated by averaging the amount at the beginning and the end of the fiscal year.
7
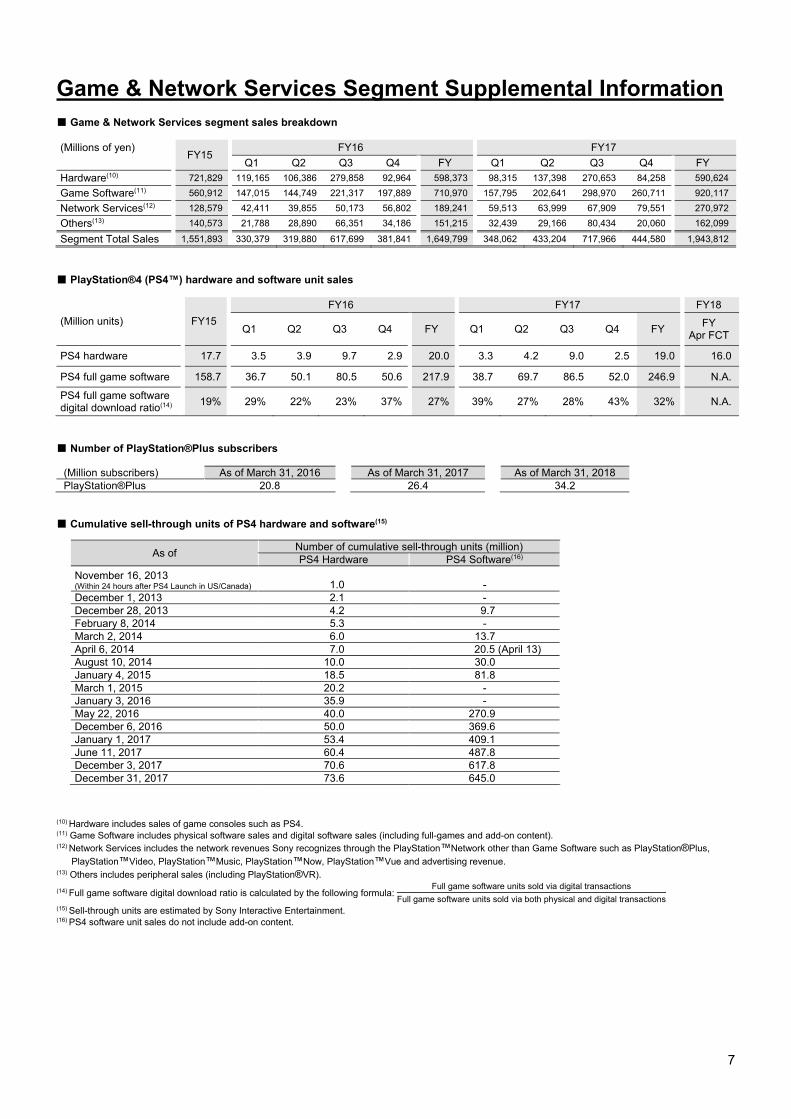
Game & Network Services Segment Supplemental Information
■ Game & Network Services segment sales breakdown
(Millions of yen) FY15
FY16 FY17 Q1 Q2 Q3 Q4 FY Q1 Q2 Q3 Q4 FY
Hardware(10) 721,829 119,165 106,386 279,858 92,964 598,373 98,315 137,398 270,653 84,258 590,624
Game Software(11) 560,912 147,015 144,749 221,317 197,889 710,970 157,795 202,641 298,970 260,711 920,117
Network Services(12) 128,579 42,411 39,855 50,173 56,802 189,241 59,513 63,999 67,909 79,551 270,972
Others(13) 140,573 21,788 28,890 66,351 34,186 151,215 32,439 29,166 80,434 20,060 162,099
Segment Total Sales 1,551,893 330,379 319,880 617,699 381,841 1,649,799 348,062 433,204 717,966 444,580 1,943,812
■ PlayStation®4 (PS4™) hardware and software unit sales
(Million units) FY15
FY16 FY17 FY18
Q1 Q2 Q3 Q4 FY Q1 Q2 Q3 Q4 FY FY
Apr FCT
PS4 hardware 17.7 3.5 3.9 9.7 2.9 20.0 3.3 4.2 9.0 2.5 19.0 16.0
PS4 full game software 158.7 36.7 50.1 80.5 50.6 217.9 38.7 69.7 86.5 52.0 246.9 N.A.
PS4 full game software digital download ratio(14)
19% 29% 22% 23% 37% 27% 39% 27% 28% 43% 32% N.A.
■ Number of PlayStation®Plus subscribers
(Million subscribers) As of March 31, 2016 As of March 31, 2017 As of March 31, 2018 PlayStation®Plus 20.8 26.4 34.2
■ Cumulative sell-through units of PS4 hardware and software(15)
As of Number of cumulative sell-through units (million) PS4 Hardware PS4 Software(16)
November 16, 2013 (Within 24 hours after PS4 Launch in US/Canada) 1.0
-
December 1, 2013 2.1 - December 28, 2013 4.2 9.7 February 8, 2014 5.3 - March 2, 2014 6.0 13.7 April 6, 2014 7.0 20.5 (April 13) August 10, 2014 10.0 30.0 January 4, 2015 18.5 81.8 March 1, 2015 20.2 - January 3, 2016 35.9 - May 22, 2016 40.0 270.9 December 6, 2016 50.0 369.6 January 1, 2017 53.4 409.1 June 11, 2017 60.4 487.8 December 3, 2017 70.6 617.8 December 31, 2017 73.6 645.0
(10) Hardware includes sales of game consoles such as PS4. (11) Game Software includes physical software sales and digital software sales (including full-games and add-on content). (12) Network Services includes the network revenues Sony recognizes through the PlayStation™Network other than Game Software such as PlayStation®Plus,
PlayStation™Video, PlayStation™Music, PlayStation™Now, PlayStation™Vue and advertising revenue. (13) Others includes peripheral sales (including PlayStation®VR).
(14) Full game software digital download ratio is calculated by the following formula: Full game software units sold via digital transactions
Full game software units sold via both physical and digital transactions
(15) Sell-through units are estimated by Sony Interactive Entertainment. (16) PS4 software unit sales do not include add-on content.
8
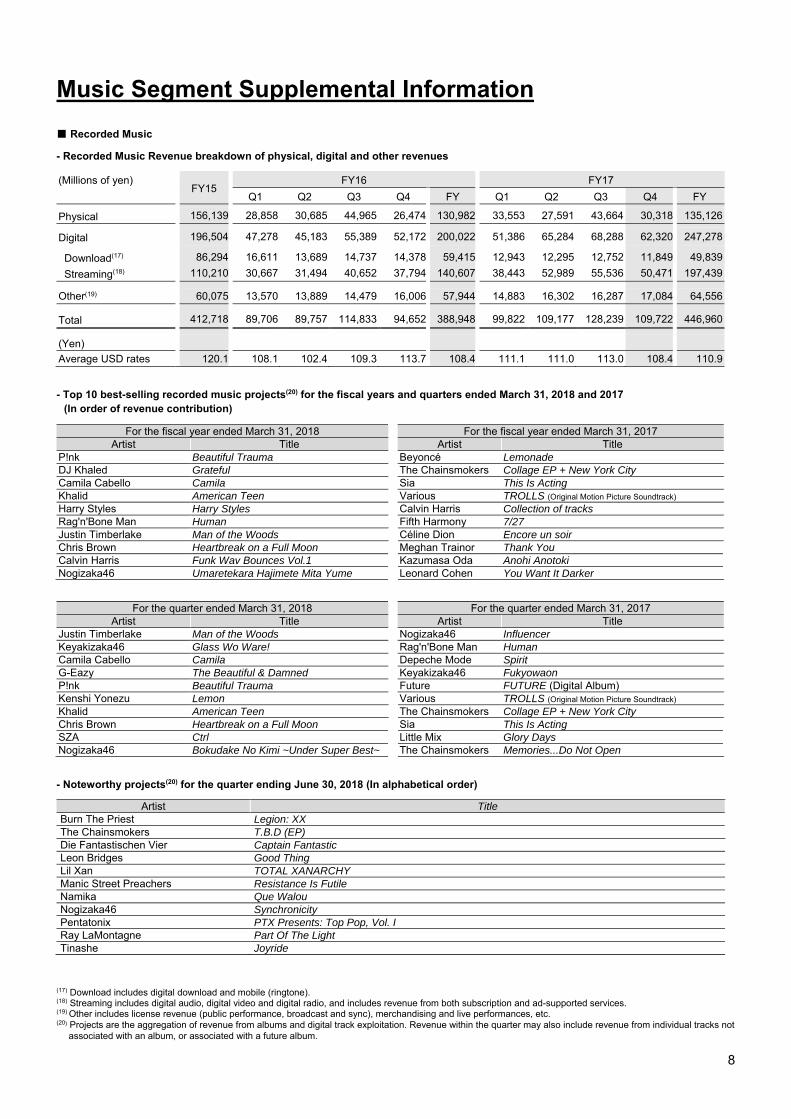
Music Segment Supplemental Information
■ Recorded Music
- Recorded Music Revenue breakdown of physical, digital and other revenues
(Millions of yen) FY15
FY16 FY17
Q1 Q2 Q3 Q4 FY Q1 Q2 Q3 Q4 FY
Physical 156,139 28,858 30,685 44,965 26,474 130,982 33,553 27,591 43,664 30,318 135,126
Digital 196,504 47,278 45,183 55,389 52,172 200,022 51,386 65,284 68,288 62,320 247,278
Download(17) 86,294 16,611 13,689 14,737 14,378 59,415 12,943 12,295 12,752 11,849 49,839
Streaming(18) 110,210 30,667 31,494 40,652 37,794 140,607 38,443 52,989 55,536 50,471 197,439
Other(19) 60,075 13,570 13,889 14,479 16,006 57,944 14,883 16,302 16,287 17,084 64,556
Total 412,718 89,706 89,757 114,833 94,652 388,948 99,822 109,177 128,239 109,722 446,960
(Yen)
Average USD rates 120.1 108.1 102.4 109.3 113.7 108.4 111.1 111.0 113.0 108.4 110.9
- Top 10 best-selling recorded music projects(20) for the fiscal years and quarters ended March 31, 2018 and 2017 (In order of revenue contribution)
For the fiscal year ended March 31, 2018
For the fiscal year ended March 31, 2017 Artist Title Artist Title
P!nk Beautiful Trauma Beyoncé Lemonade DJ Khaled Grateful The Chainsmokers Collage EP + New York City Camila Cabello Camila Sia This Is Acting Khalid American Teen Various TROLLS (Original Motion Picture Soundtrack) Harry Styles Harry Styles Calvin Harris Collection of tracks Rag'n'Bone Man Human Fifth Harmony 7/27 Justin Timberlake Man of the Woods Céline Dion Encore un soir Chris Brown Heartbreak on a Full Moon Meghan Trainor Thank You Calvin Harris Funk Wav Bounces Vol.1 Kazumasa Oda Anohi Anotoki Nogizaka46 Umaretekara Hajimete Mita Yume Leonard Cohen You Want It Darker
For the quarter ended March 31, 2018
For the quarter ended March 31, 2017 Artist Title Artist Title
Justin Timberlake Man of the Woods Nogizaka46 Influencer Keyakizaka46 Glass Wo Ware! Rag'n'Bone Man Human Camila Cabello Camila Depeche Mode Spirit G-Eazy The Beautiful & Damned Keyakizaka46 Fukyowaon P!nk Beautiful Trauma Future FUTURE (Digital Album) Kenshi Yonezu Lemon Various TROLLS (Original Motion Picture Soundtrack) Khalid American Teen The Chainsmokers Collage EP + New York City Chris Brown Heartbreak on a Full Moon Sia This Is Acting SZA Ctrl Little Mix Glory Days Nogizaka46 Bokudake No Kimi ~Under Super Best~ The Chainsmokers Memories...Do Not Open - Noteworthy projects(20) for the quarter ending June 30, 2018 (In alphabetical order)
Artist Title Burn The Priest Legion: XX The Chainsmokers T.B.D (EP) Die Fantastischen Vier Captain Fantastic Leon Bridges Good Thing Lil Xan TOTAL XANARCHY Manic Street Preachers Resistance Is Futile Namika Que Walou Nogizaka46 Synchronicity Pentatonix PTX Presents: Top Pop, Vol. I Ray LaMontagne Part Of The Light Tinashe Joyride
(17) Download includes digital download and mobile (ringtone). (18) Streaming includes digital audio, digital video and digital radio, and includes revenue from both subscription and ad-supported services. (19) Other includes license revenue (public performance, broadcast and sync), merchandising and live performances, etc. (20) Projects are the aggregation of revenue from albums and digital track exploitation. Revenue within the quarter may also include revenue from individual tracks not
associated with an album, or associated with a future album.

9
■ Music Publishing
- Number of songs in the music publishing catalog owned and administered as of March 31, 2018, 2017 and 2016 (Million songs)
As of March 31, 2018 As of March 31, 2017 As of March 31, 2016 Sony 2.30 2.44 2.16
EMI Music Publishing 2.06 2.05 2.05 Total 4.36 4.49 4.21
10
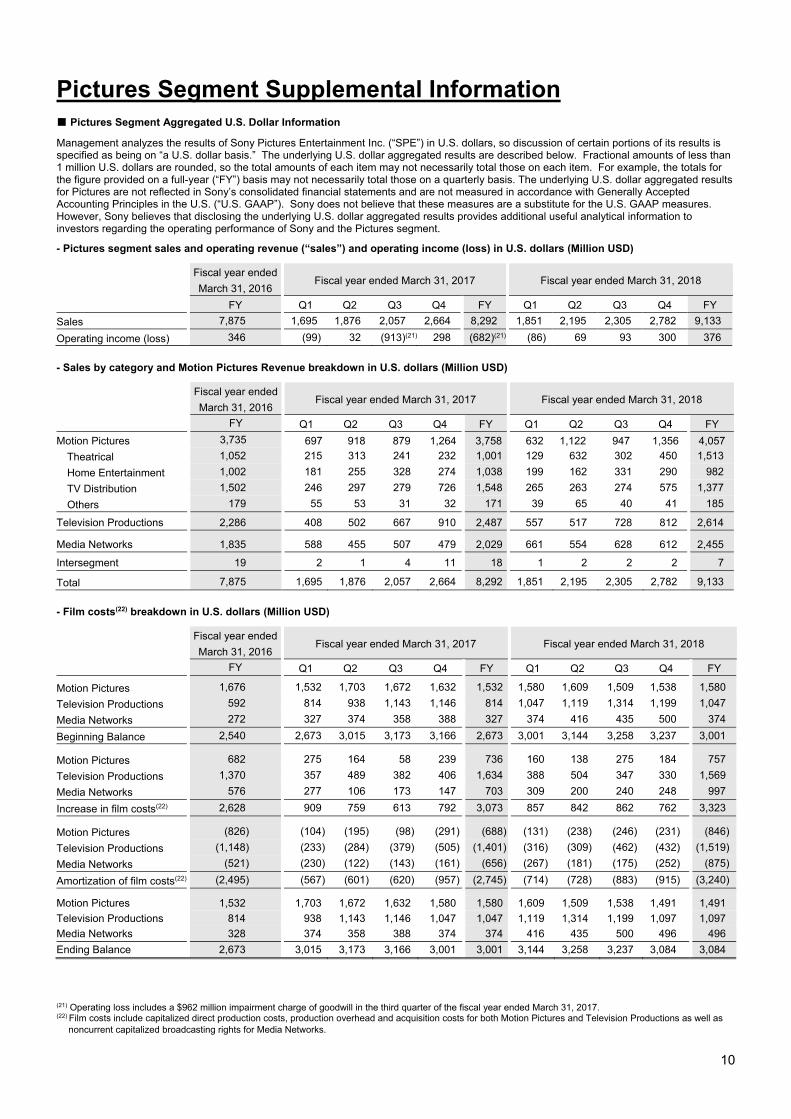
Pictures Segment Supplemental Information
■ Pictures Segment Aggregated U.S. Dollar Information
Management analyzes the results of Sony Pictures Entertainment Inc. (“SPE”) in U.S. dollars, so discussion of certain portions of its results is specified as being on “a U.S. dollar basis.” The underlying U.S. dollar aggregated results are described below. Fractional amounts of less than 1 million U.S. dollars are rounded, so the total amounts of each item may not necessarily total those on each item. For example, the totals for the figure provided on a full-year (“FY”) basis may not necessarily total those on a quarterly basis. The underlying U.S. dollar aggregated results for Pictures are not reflected in Sony’s consolidated financial statements and are not measured in accordance with Generally Accepted Accounting Principles in the U.S. (“U.S. GAAP”). Sony does not believe that these measures are a substitute for the U.S. GAAP measures. However, Sony believes that disclosing the underlying U.S. dollar aggregated results provides additional useful analytical information to investors regarding the operating performance of Sony and the Pictures segment.
- Pictures segment sales and operating revenue (“sales”) and operating income (loss) in U.S. dollars (Million USD)
Fiscal year ended
March 31, 2016 Fiscal year ended March 31, 2017 Fiscal year ended March 31, 2018
FY Q1 Q2 Q3 Q4 FY Q1 Q2 Q3 Q4 FY
Sales 7,875 1,695 1,876 2,057 2,664 8,292 1,851 2,195 2,305 2,782 9,133
Operating income (loss) 346 (99) 32 (913)(21) 298 (682)(21) (86) 69 93 300 376
- Sales by category and Motion Pictures Revenue breakdown in U.S. dollars (Million USD)
Fiscal year ended
March 31, 2016 Fiscal year ended March 31, 2017 Fiscal year ended March 31, 2018
FY Q1 Q2 Q3 Q4 FY Q1 Q2 Q3 Q4 FY
Motion Pictures 3,735 697 918 879 1,264 3,758 632 1,122 947 1,356 4,057
Theatrical 1,052 215 313 241 232 1,001 129 632 302 450 1,513
Home Entertainment 1,002 181 255 328 274 1,038 199 162 331 290 982
TV Distribution 1,502 246 297 279 726 1,548 265 263 274 575 1,377
Others 179 55 53 31 32 171 39 65 40 41 185
Television Productions 2,286 408 502 667 910 2,487 557 517 728 812 2,614
Media Networks 1,835 588 455 507 479 2,029 661 554 628 612 2,455
Intersegment 19 2 1 4 11 18 1 2 2 2 7
Total 7,875 1,695 1,876 2,057 2,664 8,292 1,851 2,195 2,305 2,782 9,133
- Film costs(22) breakdown in U.S. dollars (Million USD)
Fiscal year ended
March 31, 2016 Fiscal year ended March 31, 2017 Fiscal year ended March 31, 2018
FY Q1 Q2 Q3 Q4 FY Q1 Q2 Q3 Q4 FY
Motion Pictures 1,676 1,532 1,703 1,672 1,632 1,532 1,580 1,609 1,509 1,538 1,580
Television Productions 592 814 938 1,143 1,146 814 1,047 1,119 1,314 1,199 1,047
Media Networks 272 327 374 358 388 327 374 416 435 500 374
Beginning Balance 2,540 2,673 3,015 3,173 3,166 2,673 3,001 3,144 3,258 3,237 3,001
Motion Pictures 682 275 164 58 239 736 160 138 275 184 757
Television Productions 1,370 357 489 382 406 1,634 388 504 347 330 1,569
Media Networks 576 277 106 173 147 703 309 200 240 248 997
Increase in film costs(22) 2,628 909 759 613 792 3,073 857 842 862 762 3,323
Motion Pictures (826) (104) (195) (98) (291) (688) (131) (238) (246) (231) (846)
Television Productions (1,148) (233) (284) (379) (505) (1,401) (316) (309) (462) (432) (1,519)
Media Networks (521) (230) (122) (143) (161) (656) (267) (181) (175) (252) (875)
Amortization of film costs(22) (2,495) (567) (601) (620) (957) (2,745) (714) (728) (883) (915) (3,240)
Motion Pictures 1,532 1,703 1,672 1,632 1,580 1,580 1,609 1,509 1,538 1,491 1,491
Television Productions 814 938 1,143 1,146 1,047 1,047 1,119 1,314 1,199 1,097 1,097
Media Networks 328 374 358 388 374 374 416 435 500 496 496
Ending Balance 2,673 3,015 3,173 3,166 3,001 3,001 3,144 3,258 3,237 3,084 3,084 (21) Operating loss includes a $962 million impairment charge of goodwill in the third quarter of the fiscal year ended March 31, 2017. (22) Film costs include capitalized direct production costs, production overhead and acquisition costs for both Motion Pictures and Television Productions as well as
noncurrent capitalized broadcasting rights for Media Networks.
11
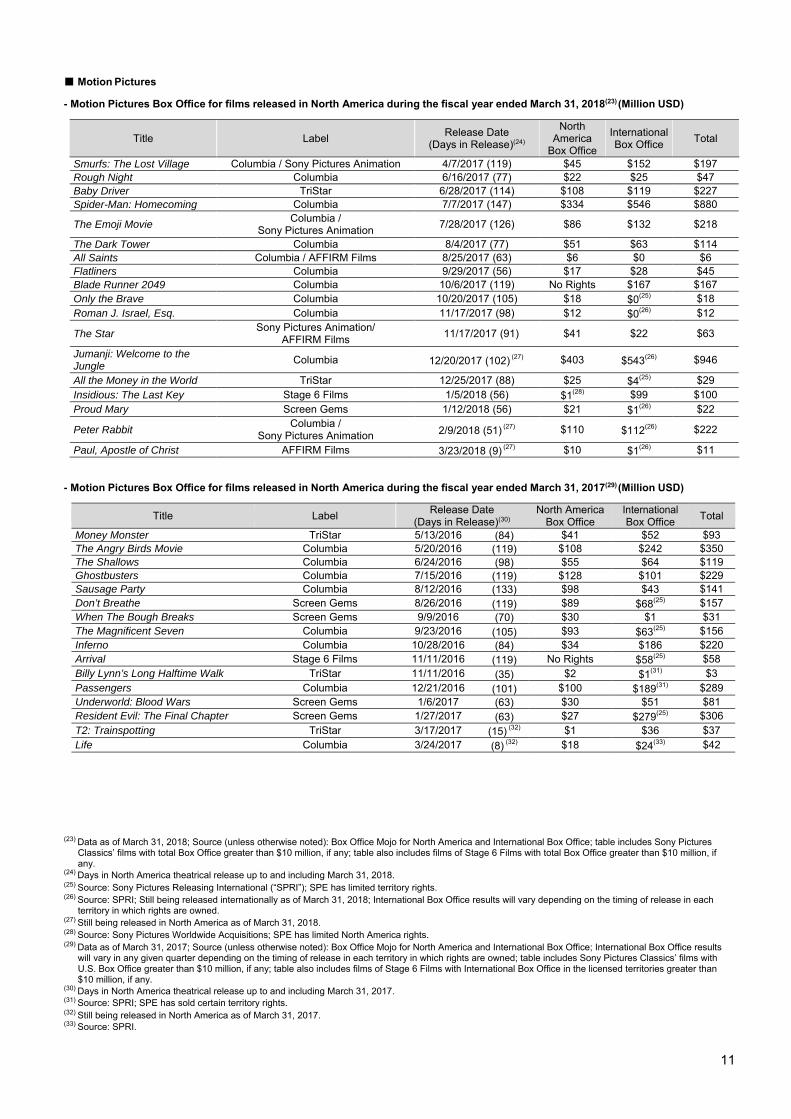
■ Motion Pictures
- Motion Pictures Box Office for films released in North America during the fiscal year ended March 31, 2018(23) (Million USD)
Title Label Release Date
(Days in Release)(24)
North America
Box Office
International Box Office
Total
Smurfs: The Lost Village Columbia / Sony Pictures Animation 4/7/2017 (119) $45 $152 $197 Rough Night Columbia 6/16/2017 (77) $22 $25 $47 Baby Driver TriStar 6/28/2017 (114) $108 $119 $227 Spider-Man: Homecoming Columbia 7/7/2017 (147) $334 $546 $880
The Emoji Movie Columbia /
Sony Pictures Animation 7/28/2017 (126) $86 $132 $218
The Dark Tower Columbia 8/4/2017 (77) $51 $63 $114 All Saints Columbia / AFFIRM Films 8/25/2017 (63) $6 $0 $6 Flatliners Columbia 9/29/2017 (56) $17 $28 $45 Blade Runner 2049 Columbia 10/6/2017 (119) No Rights $167 $167 Only the Brave Columbia 10/20/2017 (105) $18 $0(25) $18 Roman J. Israel, Esq. Columbia 11/17/2017 (98) $12 $0(26) $12
The Star Sony Pictures Animation/
AFFIRM Films 11/17/2017 (91) $41 $22 $63
Jumanji: Welcome to the Jungle
Columbia 12/20/2017 (102) (27) $403 $543(26) $946
All the Money in the World TriStar 12/25/2017 (88) $25 $4(25) $29 Insidious: The Last Key Stage 6 Films 1/5/2018 (56) $1(28) $99 $100 Proud Mary Screen Gems 1/12/2018 (56) $21 $1(26) $22
Peter Rabbit Columbia /
Sony Pictures Animation 2/9/2018 (51) (27) $110 $112(26) $222
Paul, Apostle of Christ AFFIRM Films 3/23/2018 (9) (27) $10 $1(26) $11
- Motion Pictures Box Office for films released in North America during the fiscal year ended March 31, 2017(29) (Million USD)
Title Label Release Date
(Days in Release)(30)
North America Box Office
International Box Office
Total
Money Monster TriStar 5/13/2016 (84) $41 $52 $93 The Angry Birds Movie Columbia 5/20/2016 (119) $108 $242 $350 The Shallows Columbia 6/24/2016 (98) $55 $64 $119 Ghostbusters Columbia 7/15/2016 (119) $128 $101 $229 Sausage Party Columbia 8/12/2016 (133) $98 $43 $141 Don’t Breathe Screen Gems 8/26/2016 (119) $89 $68(25)
$157 When The Bough Breaks Screen Gems 9/9/2016 (70) $30 $1 $31 The Magnificent Seven Columbia 9/23/2016 (105) $93 $63(25)
$156 Inferno Columbia 10/28/2016 (84) $34 $186 $220 Arrival Stage 6 Films 11/11/2016 (119) No Rights $58(25) $58 Billy Lynn’s Long Halftime Walk TriStar 11/11/2016 (35) $2 $1(31)
$3 Passengers Columbia 12/21/2016 (101) $100 $189(31)
$289 Underworld: Blood Wars Screen Gems 1/6/2017 (63) $30 $51 $81 Resident Evil: The Final Chapter Screen Gems 1/27/2017 (63) $27 $279(25)
$306 T2: Trainspotting TriStar 3/17/2017 (15) (32)
$1 $36 $37 Life Columbia 3/24/2017 (8) (32)
$18 $24(33) $42
(23) Data as of March 31, 2018; Source (unless otherwise noted): Box Office Mojo for North America and International Box Office; table includes Sony Pictures Classics’ films with total Box Office greater than $10 million, if any; table also includes films of Stage 6 Films with total Box Office greater than $10 million, if any.
(24) Days in North America theatrical release up to and including March 31, 2018. (25) Source: Sony Pictures Releasing International (“SPRI”); SPE has limited territory rights. (26) Source: SPRI; Still being released internationally as of March 31, 2018; International Box Office results will vary depending on the timing of release in each
territory in which rights are owned. (27) Still being released in North America as of March 31, 2018. (28) Source: Sony Pictures Worldwide Acquisitions; SPE has limited North America rights. (29) Data as of March 31, 2017; Source (unless otherwise noted): Box Office Mojo for North America and International Box Office; International Box Office results
will vary in any given quarter depending on the timing of release in each territory in which rights are owned; table includes Sony Pictures Classics’ films with U.S. Box Office greater than $10 million, if any; table also includes films of Stage 6 Films with International Box Office in the licensed territories greater than $10 million, if any.
(30) Days in North America theatrical release up to and including March 31, 2017. (31) Source: SPRI; SPE has sold certain territory rights. (32) Still being released in North America as of March 31, 2017. (33) Source: SPRI.
12
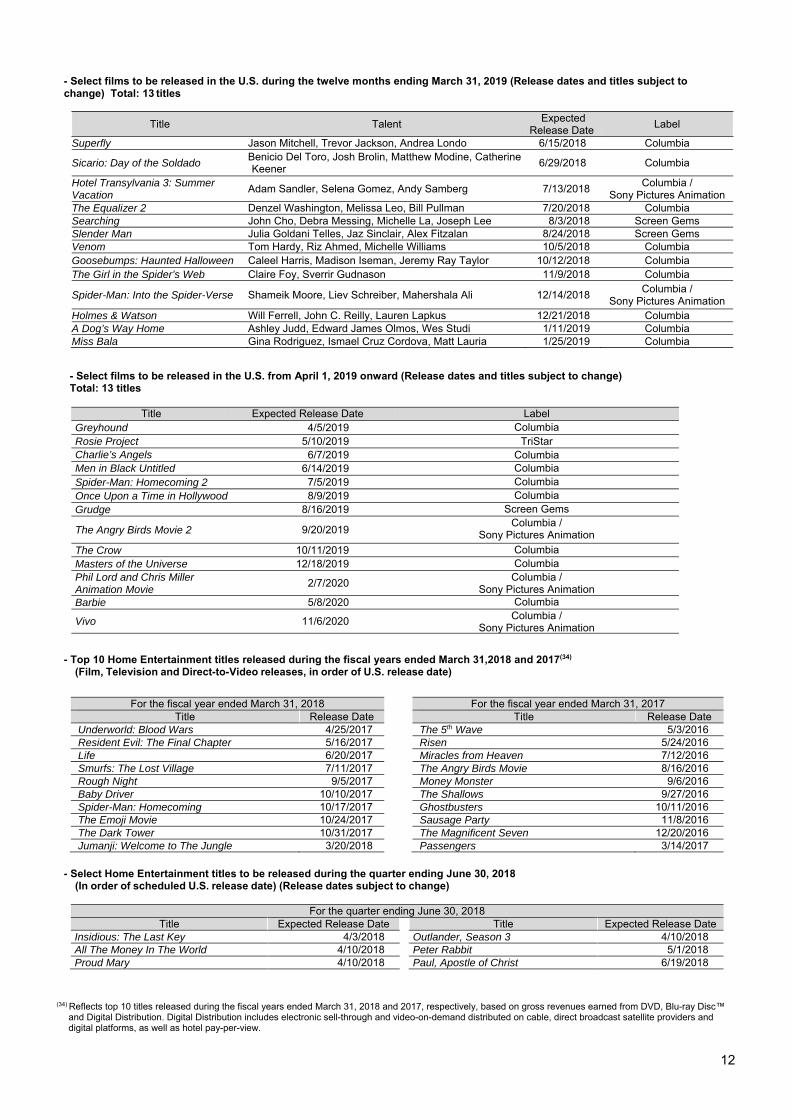
- Select films to be released in the U.S. during the twelve months ending March 31, 2019 (Release dates and titles subject to change) Total: 13 titles
Title Talent Expected
Release Date Label
Superfly Jason Mitchell, Trevor Jackson, Andrea Londo 6/15/2018 Columbia
Sicario: Day of the Soldado Benicio Del Toro, Josh Brolin, Matthew Modine, Catherine Keener
6/29/2018 Columbia
Hotel Transylvania 3: Summer Vacation
Adam Sandler, Selena Gomez, Andy Samberg 7/13/2018 Columbia /
Sony Pictures Animation The Equalizer 2 Denzel Washington, Melissa Leo, Bill Pullman 7/20/2018 Columbia Searching John Cho, Debra Messing, Michelle La, Joseph Lee 8/3/2018 Screen Gems Slender Man Julia Goldani Telles, Jaz Sinclair, Alex Fitzalan 8/24/2018 Screen Gems Venom Tom Hardy, Riz Ahmed, Michelle Williams 10/5/2018 Columbia Goosebumps: Haunted Halloween Caleel Harris, Madison Iseman, Jeremy Ray Taylor 10/12/2018 Columbia The Girl in the Spider’s Web Claire Foy, Sverrir Gudnason 11/9/2018 Columbia
Spider-Man: Into the Spider-Verse Shameik Moore, Liev Schreiber, Mahershala Ali 12/14/2018 Columbia /
Sony Pictures Animation Holmes & Watson Will Ferrell, John C. Reilly, Lauren Lapkus 12/21/2018 Columbia A Dog’s Way Home Ashley Judd, Edward James Olmos, Wes Studi 1/11/2019 Columbia Miss Bala Gina Rodriguez, Ismael Cruz Cordova, Matt Lauria 1/25/2019 Columbia
- Select films to be released in the U.S. from April 1, 2019 onward (Release dates and titles subject to change) Total: 13 titles
Title Expected Release Date Label
Greyhound 4/5/2019 Columbia Rosie Project 5/10/2019 TriStar Charlie’s Angels 6/7/2019 Columbia Men in Black Untitled 6/14/2019 Columbia Spider-Man: Homecoming 2 7/5/2019 Columbia Once Upon a Time in Hollywood 8/9/2019 Columbia Grudge 8/16/2019 Screen Gems
The Angry Birds Movie 2 9/20/2019 Columbia /
Sony Pictures Animation
The Crow 10/11/2019 Columbia Masters of the Universe 12/18/2019 Columbia Phil Lord and Chris Miller Animation Movie
2/7/2020 Columbia /
Sony Pictures Animation Barbie 5/8/2020 Columbia
Vivo 11/6/2020 Columbia / Sony Pictures Animation
- Top 10 Home Entertainment titles released during the fiscal years ended March 31,2018 and 2017(34) (Film, Television and Direct-to-Video releases, in order of U.S. release date)
For the fiscal year ended March 31, 2018 For the fiscal year ended March 31, 2017
Title Release Date Title Release Date Underworld: Blood Wars 4/25/2017 The 5th Wave 5/3/2016 Resident Evil: The Final Chapter 5/16/2017 Risen 5/24/2016 Life 6/20/2017 Miracles from Heaven 7/12/2016 Smurfs: The Lost Village 7/11/2017 The Angry Birds Movie 8/16/2016 Rough Night 9/5/2017 Money Monster 9/6/2016 Baby Driver 10/10/2017 The Shallows 9/27/2016 Spider-Man: Homecoming 10/17/2017 Ghostbusters 10/11/2016 The Emoji Movie 10/24/2017 Sausage Party 11/8/2016 The Dark Tower 10/31/2017 The Magnificent Seven 12/20/2016 Jumanji: Welcome to The Jungle 3/20/2018 Passengers 3/14/2017
- Select Home Entertainment titles to be released during the quarter ending June 30, 2018
(In order of scheduled U.S. release date) (Release dates subject to change)
For the quarter ending June 30, 2018 Title Expected Release Date Title Expected Release Date
Insidious: The Last Key 4/3/2018 Outlander, Season 3 4/10/2018 All The Money In The World 4/10/2018 Peter Rabbit 5/1/2018 Proud Mary 4/10/2018 Paul, Apostle of Christ 6/19/2018
(34) Reflects top 10 titles released during the fiscal years ended March 31, 2018 and 2017, respectively, based on gross revenues earned from DVD, Blu-ray Disc™ and Digital Distribution. Digital Distribution includes electronic sell-through and video-on-demand distributed on cable, direct broadcast satellite providers and digital platforms, as well as hotel pay-per-view.
13
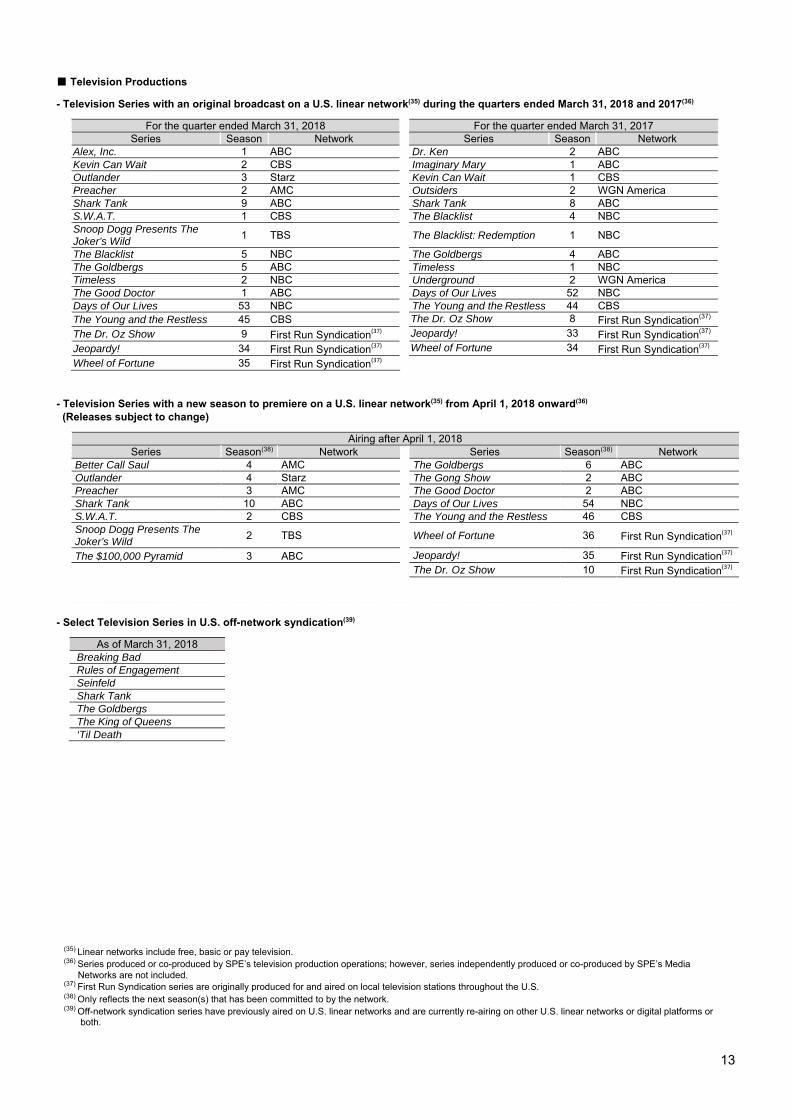
■ Television Productions
- Television Series with an original broadcast on a U.S. linear network(35) during the quarters ended March 31, 2018 and 2017(36)
For the quarter ended March 31, 2018
For the quarter ended March 31, 2017 Series Season Network Series Season Network
Alex, Inc. 1 ABC Dr. Ken 2 ABC Kevin Can Wait 2 CBS Imaginary Mary 1 ABC Outlander 3 Starz Kevin Can Wait 1 CBS Preacher 2 AMC Outsiders 2 WGN America Shark Tank 9 ABC Shark Tank 8 ABC S.W.A.T. 1 CBS The Blacklist 4 NBC Snoop Dogg Presents The Joker’s Wild
1 TBS The Blacklist: Redemption 1 NBC
The Blacklist 5 NBC The Goldbergs 4 ABC The Goldbergs 5 ABC Timeless 1 NBC Timeless 2 NBC Underground 2 WGN America The Good Doctor 1 ABC Days of Our Lives 52 NBC Days of Our Lives 53 NBC The Young and the Restless 44 CBS The Young and the Restless 45 CBS The Dr. Oz Show 8 First Run Syndication(37) The Dr. Oz Show 9 First Run Syndication(37) Jeopardy! 33 First Run Syndication(37) Jeopardy! 34 First Run Syndication(37) Wheel of Fortune 34 First Run Syndication(37) Wheel of Fortune 35 First Run Syndication(37)
- Television Series with a new season to premiere on a U.S. linear network(35) from April 1, 2018 onward(36)
(Releases subject to change)
Airing after April 1, 2018 Series Season(38) Network Series Season(38) Network
Better Call Saul 4 AMC The Goldbergs 6 ABC Outlander 4 Starz The Gong Show 2 ABC Preacher 3 AMC The Good Doctor 2 ABC Shark Tank 10 ABC Days of Our Lives 54 NBC S.W.A.T. 2 CBS The Young and the Restless 46 CBS Snoop Dogg Presents The Joker’s Wild
2 TBS
Wheel of Fortune 36 First Run Syndication(37)
The $100,000 Pyramid 3 ABC Jeopardy! 35 First Run Syndication(37) The Dr. Oz Show 10 First Run Syndication(37)
- Select Television Series in U.S. off-network syndication(39)
As of March 31, 2018 Breaking Bad Rules of Engagement Seinfeld Shark Tank The Goldbergs The King of Queens ‘Til Death
(35) Linear networks include free, basic or pay television. (36) Series produced or co-produced by SPE’s television production operations; however, series independently produced or co-produced by SPE’s Media
Networks are not included. (37) First Run Syndication series are originally produced for and aired on local television stations throughout the U.S. (38) Only reflects the next season(s) that has been committed to by the network. (39) Off-network syndication series have previously aired on U.S. linear networks and are currently re-airing on other U.S. linear networks or digital platforms or
both.
14
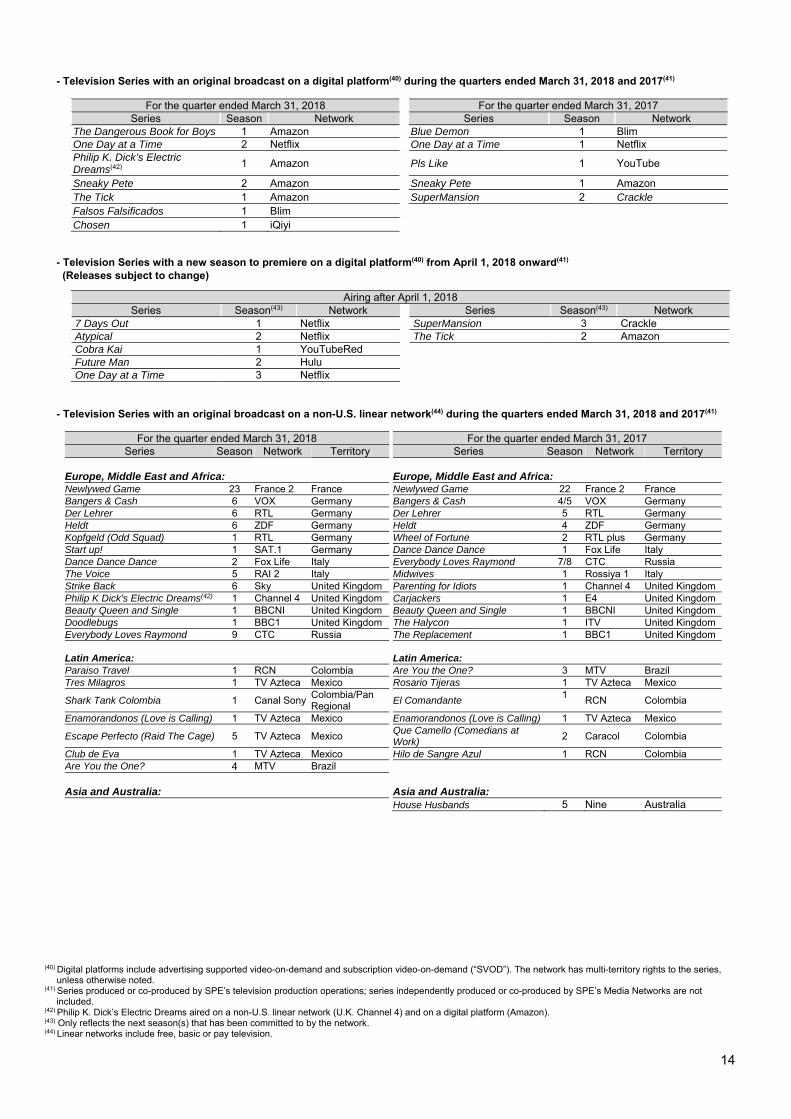
- Television Series with an original broadcast on a digital platform(40) during the quarters ended March 31, 2018 and 2017(41)
For the quarter ended March 31, 2018
For the quarter ended March 31, 2017 Series Season Network Series Season Network
The Dangerous Book for Boys 1 Amazon Blue Demon 1 Blim One Day at a Time 2 Netflix One Day at a Time 1 Netflix Philip K. Dick’s Electric Dreams(42)
1 Amazon Pls Like 1 YouTube
Sneaky Pete 2 Amazon Sneaky Pete 1 Amazon The Tick 1 Amazon SuperMansion 2 Crackle Falsos Falsificados 1 Blim Chosen 1 iQiyi
- Television Series with a new season to premiere on a digital platform(40) from April 1, 2018 onward(41)
(Releases subject to change)
Airing after April 1, 2018 Series Season(43) Network Series Season(43) Network
7 Days Out 1 Netflix SuperMansion 3 Crackle Atypical 2 Netflix The Tick 2 Amazon Cobra Kai 1 YouTubeRed Future Man 2 Hulu One Day at a Time 3 Netflix
- Television Series with an original broadcast on a non-U.S. linear network(44) during the quarters ended March 31, 2018 and 2017(41)
For the quarter ended March 31, 2018 For the quarter ended March 31, 2017 Series Season Network Territory Series Season Network Territory
Europe, Middle East and Africa: Europe, Middle East and Africa: Newlywed Game 23 France 2 France Newlywed Game 22 France 2 France Bangers & Cash 6 VOX Germany Bangers & Cash 4/5 VOX Germany Der Lehrer 6 RTL Germany Der Lehrer 5 RTL Germany Heldt 6 ZDF Germany Heldt 4 ZDF Germany Kopfgeld (Odd Squad) 1 RTL Germany Wheel of Fortune 2 RTL plus Germany Start up! 1 SAT.1 Germany Dance Dance Dance 1 Fox Life Italy Dance Dance Dance 2 Fox Life Italy Everybody Loves Raymond 7/8 CTC Russia The Voice 5 RAI 2 Italy Midwives 1 Rossiya 1 Italy Strike Back 6 Sky United Kingdom Parenting for Idiots 1 Channel 4 United Kingdom Philip K Dick's Electric Dreams(42) 1 Channel 4 United Kingdom Carjackers 1 E4 United Kingdom Beauty Queen and Single 1 BBCNI United Kingdom Beauty Queen and Single 1 BBCNI United Kingdom Doodlebugs 1 BBC1 United Kingdom The Halycon 1 ITV United Kingdom Everybody Loves Raymond 9 CTC Russia The Replacement 1 BBC1 United Kingdom Latin America:
Latin America:
Paraiso Travel 1 RCN Colombia Are You the One? 3 MTV Brazil Tres Milagros 1 TV Azteca Mexico Rosario Tijeras 1 TV Azteca Mexico
Shark Tank Colombia 1 Canal Sony Colombia/Pan Regional
El Comandante 1
RCN Colombia
Enamorandonos (Love is Calling) 1 TV Azteca Mexico Enamorandonos (Love is Calling) 1 TV Azteca Mexico
Escape Perfecto (Raid The Cage) 5 TV Azteca Mexico Que Camello (Comedians at Work)
2 Caracol Colombia
Club de Eva 1 TV Azteca Mexico Hilo de Sangre Azul 1 RCN Colombia Are You the One? 4 MTV Brazil Asia and Australia:
Asia and Australia:
House Husbands 5 Nine Australia
(40) Digital platforms include advertising supported video-on-demand and subscription video-on-demand (“SVOD”). The network has multi-territory rights to the series, unless otherwise noted.
(41) Series produced or co-produced by SPE’s television production operations; series independently produced or co-produced by SPE’s Media Networks are not included.
(42) Philip K. Dick’s Electric Dreams aired on a non-U.S. linear network (U.K. Channel 4) and on a digital platform (Amazon).
(43) Only reflects the next season(s) that has been committed to by the network. (44)
Linear networks include free, basic or pay television.
15
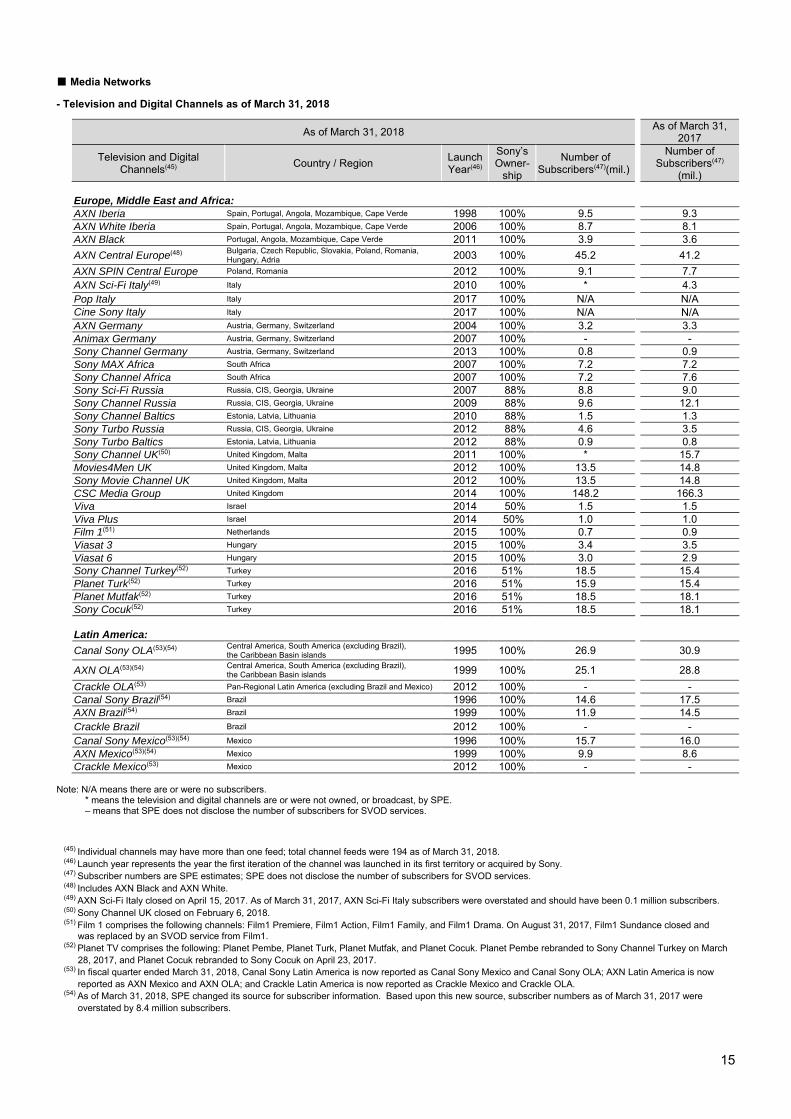
■ Media Networks
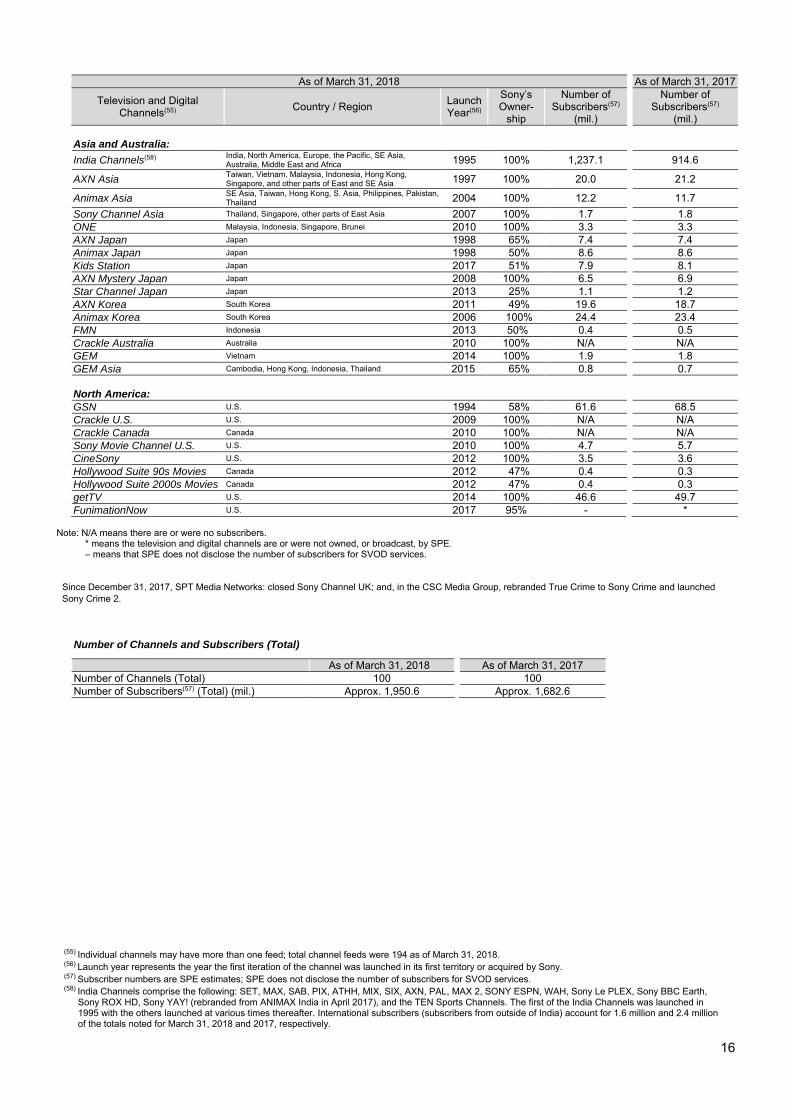
- Television and Digital Channels as of March 31, 2018
Note: N/A means there are or were no subscribers. * means the television and digital channels are or were not owned, or broadcast, by SPE. – means that SPE does not disclose the number of subscribers for SVOD services.
(45) Individual channels may have more than one feed; total channel feeds were 194 as of March 31, 2018. (46) Launch year represents the year the first iteration of the channel was launched in its first territory or acquired by Sony. (47) Subscriber numbers are SPE estimates; SPE does not disclose the number of subscribers for SVOD services. (48) Includes AXN Black and AXN White. (49) AXN Sci-Fi Italy closed on April 15, 2017. As of March 31, 2017, AXN Sci-Fi Italy subscribers were overstated and should have been 0.1 million subscribers. (50) Sony Channel UK closed on February 6, 2018. (51) Film 1 comprises the following channels: Film1 Premiere, Film1 Action, Film1 Family, and Film1 Drama. On August 31, 2017, Film1 Sundance closed and
was replaced by an SVOD service from Film1. (52) Planet TV comprises the following: Planet Pembe, Planet Turk, Planet Mutfak, and Planet Cocuk. Planet Pembe rebranded to Sony Channel Turkey on March
28, 2017, and Planet Cocuk rebranded to Sony Cocuk on April 23, 2017. (53) In fiscal quarter ended March 31, 2018, Canal Sony Latin America is now reported as Canal Sony Mexico and Canal Sony OLA; AXN Latin America is now
reported as AXN Mexico and AXN OLA; and Crackle Latin America is now reported as Crackle Mexico and Crackle OLA. (54) As of March 31, 2018, SPE changed its source for subscriber information. Based upon this new source, subscriber numbers as of March 31, 2017 were
overstated by 8.4 million subscribers.
As of March 31, 2018 As of March 31,
2017
Television and Digital Channels(45)
Country / Region Launch Year(46)
Sony’s Owner-
ship
Number of Subscribers(47)(mil.)
Number of Subscribers(47)
(mil.) Europe, Middle East and Africa:
AXN Iberia Spain, Portugal, Angola, Mozambique, Cape Verde 1998 100% 9.5 9.3 AXN White Iberia Spain, Portugal, Angola, Mozambique, Cape Verde 2006 100% 8.7 8.1 AXN Black Portugal, Angola, Mozambique, Cape Verde 2011 100% 3.9 3.6
AXN Central Europe(48) Bulgaria, Czech Republic, Slovakia, Poland, Romania, Hungary, Adria 2003 100% 45.2 41.2
AXN SPIN Central Europe Poland, Romania 2012 100% 9.1 7.7 AXN Sci-Fi Italy(49) Italy 2010 100% * 4.3 Pop Italy Italy 2017 100% N/A N/A Cine Sony Italy Italy 2017 100% N/A N/A AXN Germany Austria, Germany, Switzerland 2004 100% 3.2
3.3 Animax Germany Austria, Germany, Switzerland 2007 100% - - Sony Channel Germany Austria, Germany, Switzerland 2013 100% 0.8 0.9 Sony MAX Africa South Africa 2007 100% 7.2 7.2 Sony Channel Africa South Africa 2007 100% 7.2 7.6 Sony Sci-Fi Russia Russia, CIS, Georgia, Ukraine 2007 88% 8.8 9.0 Sony Channel Russia Russia, CIS, Georgia, Ukraine 2009 88% 9.6 12.1 Sony Channel Baltics Estonia, Latvia, Lithuania 2010 88% 1.5 1.3 Sony Turbo Russia Russia, CIS, Georgia, Ukraine 2012 88% 4.6 3.5 Sony Turbo Baltics Estonia, Latvia, Lithuania 2012 88% 0.9 0.8 Sony Channel UK(50) United Kingdom, Malta 2011 100% * 15.7 Movies4Men UK United Kingdom, Malta 2012 100% 13.5 14.8 Sony Movie Channel UK United Kingdom, Malta 2012 100% 13.5 14.8 CSC Media Group United Kingdom 2014 100% 148.2 166.3 Viva Israel 2014 50% 1.5 1.5 Viva Plus Israel 2014 50% 1.0 1.0 Film 1(51) Netherlands 2015 100% 0.7 0.9 Viasat 3 Hungary 2015 100% 3.4 3.5 Viasat 6 Hungary 2015 100% 3.0 2.9 Sony Channel Turkey(52) Turkey 2016 51% 18.5 15.4 Planet Turk(52) Turkey 2016 51% 15.9 15.4 Planet Mutfak(52) Turkey 2016 51% 18.5 18.1 Sony Cocuk(52) Turkey 2016 51% 18.5 18.1 Latin America:
Canal Sony OLA(53)(54) Central America, South America (excluding Brazil), the Caribbean Basin islands 1995 100% 26.9 30.9
AXN OLA(53)(54) Central America, South America (excluding Brazil), the Caribbean Basin islands 1999 100% 25.1 28.8
Crackle OLA(53) Pan-Regional Latin America (excluding Brazil and Mexico) 2012 100% - - Canal Sony Brazil(54) Brazil 1996 100% 14.6 17.5 AXN Brazil(54) Brazil 1999 100% 11.9 14.5 Crackle Brazil Brazil 2012 100% - - Canal Sony Mexico(53)(54) Mexico 1996 100% 15.7 16.0 AXN Mexico(53)(54) Mexico 1999 100% 9.9 8.6 Crackle Mexico(53) Mexico 2012 100% - -
16
Note: N/A means there are or were no subscribers. * means the television and digital channels are or were not owned, or broadcast, by SPE. – means that SPE does not disclose the number of subscribers for SVOD services.
Since December 31, 2017, SPT Media Networks: closed Sony Channel UK; and, in the CSC Media Group, rebranded True Crime to Sony Crime and launched Sony Crime 2.
Number of Channels and Subscribers (Total)
As of March 31, 2018 As of March 31, 2017 Number of Channels (Total) 100 100 Number of Subscribers(57) (Total) (mil.) Approx. 1,950.6 Approx. 1,682.6
(55) Individual channels may have more than one feed; total channel feeds were 194 as of March 31, 2018. (56) Launch year represents the year the first iteration of the channel was launched in its first territory or acquired by Sony. (57) Subscriber numbers are SPE estimates; SPE does not disclose the number of subscribers for SVOD services. (58) India Channels comprise the following: SET, MAX, SAB, PIX, ATHH, MIX, SIX, AXN, PAL, MAX 2, SONY ESPN, WAH, Sony Le PLEX, Sony BBC Earth,
Sony ROX HD, Sony YAY! (rebranded from ANIMAX India in April 2017), and the TEN Sports Channels. The first of the India Channels was launched in 1995 with the others launched at various times thereafter. International subscribers (subscribers from outside of India) account for 1.6 million and 2.4 million of the totals noted for March 31, 2018 and 2017, respectively.
As of March 31, 2018 As of March 31, 2017
Television and Digital Channels(55)
Country / Region Launch Year(56)
Sony’s Owner-
ship
Number of Subscribers(57)
(mil.)
Number of Subscribers(57)
(mil.) Asia and Australia:
India Channels(58) India, North America, Europe, the Pacific, SE Asia, Australia, Middle East and Africa 1995 100% 1,237.1 914.6
AXN Asia Taiwan, Vietnam, Malaysia, Indonesia, Hong Kong, Singapore, and other parts of East and SE Asia 1997 100% 20.0 21.2
Animax Asia SE Asia, Taiwan, Hong Kong, S. Asia, Philippines, Pakistan, Thailand 2004 100% 12.2 11.7
Sony Channel Asia Thailand, Singapore, other parts of East Asia 2007 100% 1.7 1.8 ONE Malaysia, Indonesia, Singapore, Brunei 2010 100% 3.3 3.3 AXN Japan Japan 1998 65% 7.4 7.4 Animax Japan Japan 1998 50% 8.6 8.6 Kids Station Japan 2017 51% 7.9 8.1 AXN Mystery Japan Japan 2008 100% 6.5 6.9 Star Channel Japan Japan 2013 25% 1.1 1.2 AXN Korea South Korea 2011 49% 19.6 18.7 Animax Korea South Korea 2006 100% 24.4 23.4 FMN Indonesia 2013 50% 0.4 0.5 Crackle Australia Australia 2010 100% N/A N/A GEM Vietnam 2014 100% 1.9 1.8 GEM Asia Cambodia, Hong Kong, Indonesia, Thailand 2015 65% 0.8 0.7 North America:
GSN U.S. 1994 58% 61.6 68.5 Crackle U.S. U.S. 2009 100% N/A N/A Crackle Canada Canada 2010 100% N/A N/A Sony Movie Channel U.S. U.S. 2010 100% 4.7
5.7 CineSony U.S. 2012 100% 3.5 3.6 Hollywood Suite 90s Movies Canada 2012 47% 0.4 0.3 Hollywood Suite 2000s Movies Canada 2012 47% 0.4 0.3 getTV U.S. 2014 100% 46.6 49.7 FunimationNow U.S. 2017 95% - *
17
Cautionary Statement
Statements made in this document with respect to Sony’s current plans, estimates, strategies and beliefs and other statements that are not historical facts are forward-looking statements about the future performance of Sony. Forward-looking statements include, but are not limited to, those statements using words such as “believe,” “expect,” “plans,” “strategy,” “prospects,” “forecast,” “estimate,” “project,” “anticipate,” “aim,” “intend,” “seek,” “may,” “might,” “could” or “should,” and words of similar meaning in connection with a discussion of future operations, financial performance, events or conditions. From time to time, oral or written forward-looking statements may also be included in other materials released to the public. These statements are based on management’s assumptions, judgments and beliefs in light of the information currently available to it. Sony cautions investors that a number of important risks and uncertainties could cause actual results to differ materially from those discussed in the forward-looking statements, and therefore investors should not place undue reliance on them. Investors also should not rely on any obligation of Sony to update or revise any forward-looking statements, whether as a result of new information, future events or otherwise. Sony disclaims any such obligation. Risks and uncertainties that might affect Sony include, but are not limited to:
(i) the global economic and political environment in which Sony operates and the economic and political conditions in Sony’s markets, particularly levels of consumer spending;
(ii) foreign exchange rates, particularly between the yen and the U.S. dollar, the euro and other currencies in which Sony makes significant sales and incurs production costs, or in which Sony’s assets and liabilities are denominated;
(iii) Sony’s ability to continue to design and develop and win acceptance of, as well as achieve sufficient cost reductions for, its products and services, including image sensors, game and network platforms, smartphones and televisions, which are offered in highly competitive markets characterized by severe price competition and continual new product and service introductions, rapid development in technology and subjective and changing customer preferences;
(iv) Sony’s ability and timing to recoup large-scale investments required for technology development and production capacity; (v) Sony’s ability to implement successful business restructuring and transformation efforts under changing market and regulatory
conditions; (vi) changes in laws, regulations and government policies in the markets in which Sony operates, including those related to taxation and
corporate social responsibility; (vii) Sony’s ability to implement successful hardware, software, and content integration strategies, and to develop and implement
successful sales and distribution strategies in light of new technologies and distribution platforms; (viii) Sony’s continued ability to devote sufficient resources to research and development and, with respect to capital expenditures, to
prioritize investments correctly (particularly in the electronics businesses); (ix) Sony’s ability to maintain product quality and customer satisfaction with its products and services; (x) the effectiveness of Sony’s strategies and their execution, including but not limited to the success of Sony’s acquisitions, joint ventures
and other strategic investments; (xi) significant volatility and disruption in the global financial markets or a ratings downgrade; (xii) Sony’s ability to forecast demands, manage timely procurement and control inventories; (xiii) Sony's reliance on external business partners, including for the procurement of parts, components, software and network services for
its products or services, the manufacturing, supply and distribution of its products, and its other business operations; (xiv) the outcome of pending and/or future legal and/or regulatory proceedings; (xv) shifts in customer demand for financial services such as life insurance and Sony’s ability to conduct successful asset liability
management in the Financial Services segment; (xvi) the impact of changes in interest rates and unfavorable conditions or developments (including market fluctuations or volatility) in the
Japanese equity markets on the revenue and operating income of the Financial Services segment; (xvii) the ability of Sony, its third-party service providers or business partners to anticipate and manage cybersecurity risk, including the risk
of unauthorized access to Sony’s business information, potential business disruptions or financial losses; and (xviii) risks related to catastrophic disasters or similar events.
Risks and uncertainties also include the impact of any future events with material adverse impact.