SUPPLEMENTAL FINANCIAL PACKAGE
36
1 2Q21 SUPPLEMENTAL FINANCIAL PACKAGE GREENSIDE APARTMENTS
Transcript of SUPPLEMENTAL FINANCIAL PACKAGE
1
2Q21SUPPLEMENTAL FINANCIAL PACKAGE
GREENSIDE APARTMENTS
2
T A B L E O F C O N T E N T S
Forward-Looking Statements
Corporate Profile
Highlights
2021 Outlook & Assumptions
Summary Information
Net Asset Value Component Data
Summary Balance Sheet
Summary Income Statement
FFO, Normalized FFO & Adjusted FFO
Outstanding Debt
Debt Information
Core Debt to Core EBITDA
Capitalization & Financial Ratios
Property Portfolio
Development Pipeline
Mezzanine Investments
Acquisitions & Dispositions
Construction Business Summary
Same Store NOI by Segment
Top 10 Tenants by Annualized Base Rent
Lease Summary
Office Lease Expirations
Retail Lease Expirations
COVID-19 Deferrals
Appendix – Definitions & Reconciliations
Same Store vs Non-Same Store
Reconciliation to Core EBITDA
Reconciliation to Property Portfolio NOI
Reconciliation to GAAP Net Income
03
04
05
06
07
08
09
10
11
12
13
14
15
16
18
20
21
22
23
24
25
26
27
28
29
33
34
35
36
3
This Supplemental Financial Package should be read in conjunction with the unaudited condensed consolidated financial statements appearing in our press
release dated August 3, 2021, which has been furnished as Exhibit 99.1 to our Form 8-K filed on August 3, 2021. The Company makes statements in this
Supplemental Financial Package that are forward-looking statements within the meaning of the Private Securities Litigation Reform Act of 1995 (set forth in
Section 27A of the Securities Act of 1933, as amended (the “Securities Act”), and Section 21E of the Securities Exchange Act of 1934, as amended (the
“Exchange Act”)). These forward-looking statements may include comments relating to the current and future performance of the Company’s operating
property portfolio, the Company’s development pipeline, the Company’s construction and development business, including backlog and timing of deliveries and
estimated costs, financing activities, and the Company’s financial outlook and expectations. For a description of factors that may cause the Company’s actual
results or performance to differ from its forward-looking statements, please review the information under the heading “Risk Factors” included in the Company’s
Annual Report on Form 10-K for the year ended December 31, 2020 and the other documents filed by the Company with the Securities and Exchange
Commission (the “SEC”) from time to time. The Company’s actual future results and trends may differ materially from expectations depending on a variety of
factors discussed in the Company’s filings with the SEC. These factors include, without limitation: (a) the impact of the coronavirus (COVID-19) pandemic on
macroeconomic conditions and economic conditions in the markets in which the Company operates, including, among others: (i) disruptions in, or a lack of
access to, the capital markets or disruptions in the Company’s ability to borrow amounts subject to existing construction loan commitments; (ii) adverse
impacts to the Company’s tenants’ and other third parties’ businesses and financial conditions that adversely affect the ability and willingness of the
Company’s tenants and other third parties to satisfy their rent and other obligations to the Company, including deferred rent; (iii) the ability and willingness of
the Company’s tenants to renew their leases with the Company upon expiration of the leases or to re-lease the Company’s properties on the same or better
terms in the event of nonrenewal or early termination of existing leases; and (iv) federal, state and local government initiatives to mitigate the impact of the
COVID-19 pandemic, including additional restrictions on business activities, shelter-in place orders and other restrictions, and the timing and amount of
economic stimulus or other initiatives; (b) the Company’s ability to continue construction on development and construction projects, in each case on the
timeframes and on terms currently anticipated; (c) the Company’s ability to accurately assess and predict the impact of the COVID-19 pandemic on its results
of operations, financial condition, dividend policy, acquisition and disposition activities and growth opportunities; and (d) the Company’s ability to maintain
compliance with the covenants under its existing debt agreements or to obtain modifications to such covenants from the applicable lenders. The Company
expressly disclaims any responsibility to update forward-looking statements, whether as a result of new information, future events or otherwise, except as
required by law.
FORWARD-LOOKING STATEMENTS
4
BOARD OF DIRECTORS
Daniel A. Hoffler, Executive Chairman of the Board Louis S. Haddad, Vice Chairman of the BoardJames C. Cherry, Lead Independent Director George F. Allen, Independent Director James A. Carroll, Independent DirectorEva S. Hardy, Independent Director A. Russell Kirk, Director Dorothy S. McAuliffe, Independent DirectorJohn W. Snow, Independent Director
CORPORATE OFFICERS
Louis S. Haddad, President and Chief Executive Officer Michael P. O’Hara, Chief Financial OfficerShawn J. Tibbetts, Chief Operating OfficerEric E. Apperson, President of ConstructionShelly R. Hampton, President of Asset Management
Robert W. Baird & Co.David Rodgers(216) [email protected]
Janney, Montgomery, & Scott LLCRobert Stevenson(646) [email protected]
Raymond James & AssociatesBill Crow(727) [email protected]
Bank of America Merrill LynchJames Feldman/Elvis Rodriguez(646) 855-5808/(646) [email protected]/[email protected]
ANALYST COVERAGE
Armada Hoffler Properties, Inc. (NYSE: AHH) is a vertically-integrated, self-managed real estate investment trust with fourdecades of experience developing, building, acquiring and managing high-quality office, retail and multifamily propertieslocated primarily in the Mid-Atlantic and Southeastern United States. The Company also provides general construction anddevelopment services to third-party clients, in addition to developing and building properties to be placed in their stabilizedportfolio. Founded in 1979 by Daniel A. Hoffler, Armada Hoffler has elected to be taxed as a REIT for U.S. federal income taxpurposes. For more information visit ArmadaHoffler.com.
CORPORATE PROFILE
JefferiesPeter Abramowitz(212) [email protected]
5
HIGHLIGHTS
• Net income attributable to common stockholders and OP Unit holders of $5.6 million, or $0.07 per diluted share, compared to $11.2
million, or $0.14 per diluted share, for the three months ended June 30, 2020.
• Funds from operations attributable to common stockholders and OP Unit holders ("FFO") of $22.9 million, or $0.28 per diluted share,
compared to $22.0 million, or $0.28 per diluted share, for the three months ended June 30, 2020. See "Non-GAAP Financial Measures."
• Normalized funds from operations attributable to common stockholders and OP Unit holders ("Normalized FFO") of $23.3 million, or $0.29
per diluted share, compared to $22.6 million, or $0.29 per diluted share, for the three months ended June 30, 2020. Second quarter
Normalized FFO included $0.03 per diluted share attributable to the early repayment of the Solis Apartments at Interlock mezzanine loan
that would have been recognized during the second half of 2021, which was included in prior guidance.
• Raised 2021 full-year Normalized FFO guidance to $1.02 to $1.06 per diluted share from the Company's previous guidance range of
$0.98 to $1.02 per diluted share because of higher forecast net operating income ("NOI") from the operating portfolio and acquisitions.
• Stabilized operating property portfolio occupancy increased to 94.1% as of June 30, 2021. Office occupancy was 96.5%, retail occupancy
was 94.7%, and multifamily occupancy was 92.2%. Within the multifamily segment, conventional apartment occupancy was 96.6% and
student housing occupancy was 83.5%.
• Positive releasing spreads on retail lease renewals during the second quarter of 8.0% on a GAAP basis and 6.9% on a cash basis. There
were no office renewals during the second quarter.
• Same Store NOI increased 0.7% on a GAAP basis and 13.5% on a cash basis compared to the quarter ended June 30, 2020. Highlights
include:
• Multifamily Same Store NOI increased 6.6% on a GAAP basis and 1.7% on a cash basis compared to the quarter ended June 30,
2020; excluding student housing, multifamily Same Store NOI increased 14.9% on a GAAP basis and 12.3% on a cash basis.
• Retail Same Store NOI increased 24.6% on a cash basis compared to the quarter ended June 30, 2020 due to tenants returning
to their pre-COVID rent schedules.
• Leased 80,000 square feet of commercial office and retail space since the Company’s previous quarterly update, including leases with
Transamerica and RBC at Wills Wharf in Harbor Point Baltimore.
• Increased second quarter cash dividend of $0.16 per common share, resulting in a 45.5% cumulative increase year-to-date.
• Announced the pending off-market acquisition of Greenbrier Square, a Kroger-anchored retail center in Chesapeake, Virginia. In July,
completed the off-market acquisition of Overlook Village, a 150,000 square foot retail center in Asheville, North Carolina anchored by T.J.
Maxx | Homegoods and Ross.
6
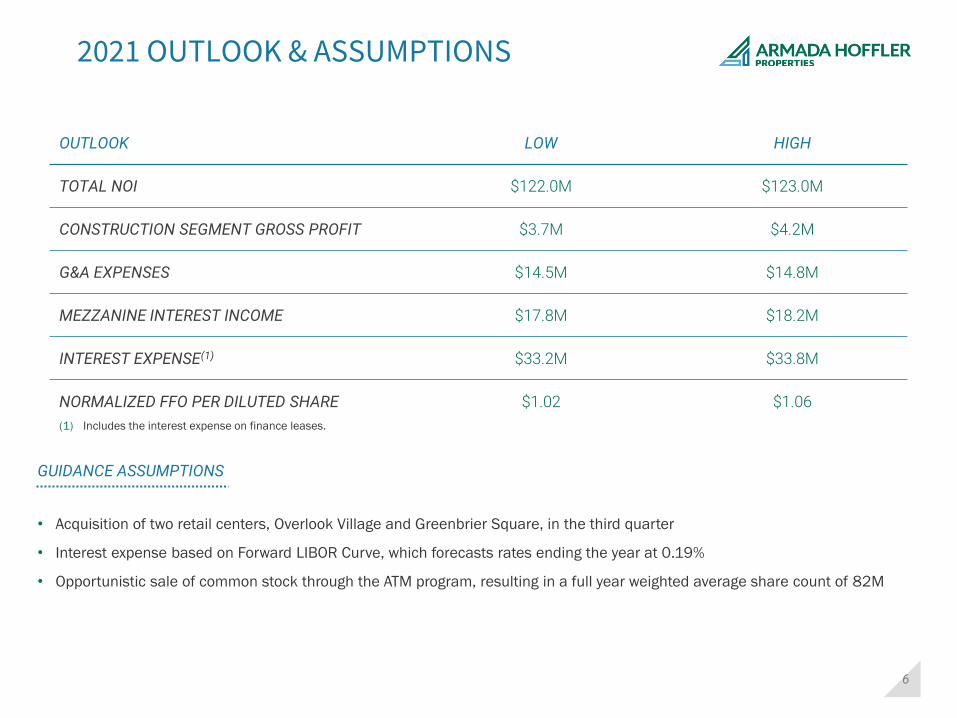
2021 OUTLOOK & ASSUMPTIONS
OUTLOOK LOW HIGH
TOTAL NOI $122.0M $123.0M
CONSTRUCTION SEGMENT GROSS PROFIT $3.7M $4.2M
G&A EXPENSES $14.5M $14.8M
MEZZANINE INTEREST INCOME $17.8M $18.2M
INTEREST EXPENSE(1) $33.2M $33.8M
NORMALIZED FFO PER DILUTED SHARE $1.02 $1.06
• Acquisition of two retail centers, Overlook Village and Greenbrier Square, in the third quarter
• Interest expense based on Forward LIBOR Curve, which forecasts rates ending the year at 0.19%
• Opportunistic sale of common stock through the ATM program, resulting in a full year weighted average share count of 82M
GUIDANCE ASSUMPTIONS
(1) Includes the interest expense on finance leases.
7
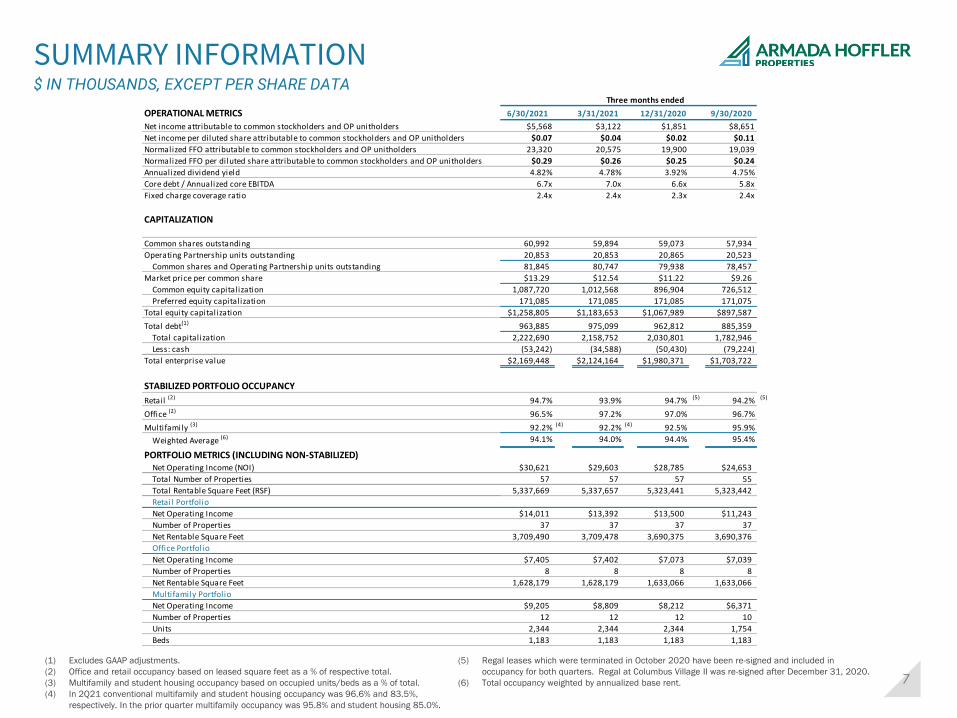
SUMMARY INFORMATION$ IN THOUSANDS, EXCEPT PER SHARE DATA
(1) Excludes GAAP adjustments.
(2) Office and retail occupancy based on leased square feet as a % of respective total.
(3) Multifamily and student housing occupancy based on occupied units/beds as a % of total.
(4) In 2Q21 conventional multifamily and student housing occupancy was 96.6% and 83.5%,
respectively. In the prior quarter multifamily occupancy was 95.8% and student housing 85.0%.
(5) Regal leases which were terminated in October 2020 have been re-signed and included in
occupancy for both quarters. Regal at Columbus Village II was re-signed after December 31, 2020.
(6) Total occupancy weighted by annualized base rent.
Three months ended
OPERATIONAL METRICS 6/30/2021 3/31/2021 12/31/2020 9/30/2020
Net income attributable to common stockholders and OP unitholders $5,568 $3,122 $1,851 $8,651
Net income per diluted share attributable to common stockholders and OP unitholders $0.07 $0.04 $0.02 $0.11
Normalized FFO attributable to common stockholders and OP unitholders 23,320 20,575 19,900 19,039
Normalized FFO per diluted share attributable to common stockholders and OP unitholders $0.29 $0.26 $0.25 $0.24
Annualized dividend yield 4.82% 4.78% 3.92% 4.75%
Core debt / Annualized core EBITDA 6.7x 7.0x 6.6x 5.8x
Fixed charge coverage ratio 2.4x 2.4x 2.3x 2.4x
CAPITALIZATION
Common shares outstanding 60,992 59,894 59,073 57,934
Operating Partnership units outstanding 20,853 20,853 20,865 20,523
Common shares and Operating Partnership units outstanding 81,845 80,747 79,938 78,457
Market price per common share $13.29 $12.54 $11.22 $9.26
Common equity capitalization 1,087,720 1,012,568 896,904 726,512
Preferred equity capitalization 171,085 171,085 171,085 171,075
Total equity capitalization $1,258,805 $1,183,653 $1,067,989 $897,587
Total debt(1) 963,885 975,099 962,812 885,359
Total capitalization 2,222,690 2,158,752 2,030,801 1,782,946
Less: cash (53,242) (34,588) (50,430) (79,224)
Total enterprise value $2,169,448 $2,124,164 $1,980,371 $1,703,722
STABILIZED PORTFOLIO OCCUPANCY
Retail (2) 94.7% 93.9% 94.7% (5) 94.2% (5)
Office (2) 96.5% 97.2% 97.0% 96.7%
Multifamily (3) 92.2% (4) 92.2% (4) 92.5% 95.9%
Weighted Average (6) 94.1% 94.0% 94.4% 95.4%
PORTFOLIO METRICS (INCLUDING NON-STABILIZED)Net Operating Income (NOI) $30,621 $29,603 $28,785 $24,653
Total Number of Properties 57 57 57 55
Total Rentable Square Feet (RSF) 5,337,669 5,337,657 5,323,441 5,323,442
Retail Portfolio
Net Operating Income $14,011 $13,392 $13,500 $11,243
Number of Properties 37 37 37 37
Net Rentable Square Feet 3,709,490 3,709,478 3,690,375 3,690,376
Office Portfolio
Net Operating Income $7,405 $7,402 $7,073 $7,039
Number of Properties 8 8 8 8
Net Rentable Square Feet 1,628,179 1,628,179 1,633,066 1,633,066
Multifamily Portfolio
Net Operating Income $9,205 $8,809 $8,212 $6,371
Number of Properties 12 12 12 10
Units 2,344 2,344 2,344 1,754
Beds 1,183 1,183 1,183 1,183
8
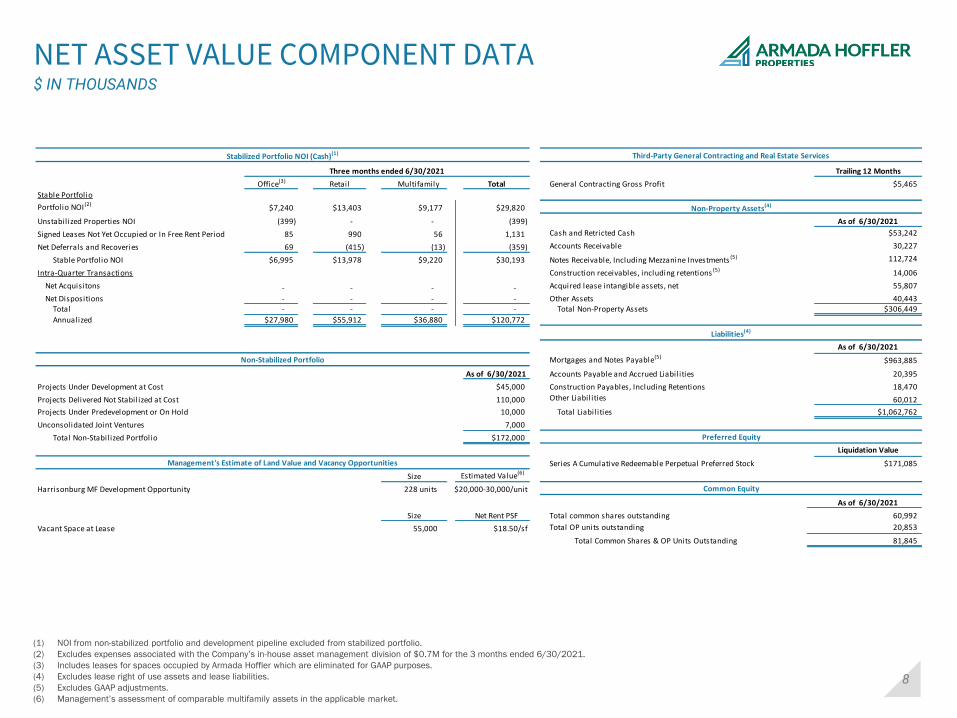
NET ASSET VALUE COMPONENT DATA$ IN THOUSANDS
(1) NOI from non-stabilized portfolio and development pipeline excluded from stabilized portfolio.
(2) Excludes expenses associated with the Company’s in-house asset management division of $0.7M for the 3 months ended 6/30/2021.
(3) Includes leases for spaces occupied by Armada Hoffler which are eliminated for GAAP purposes.
(4) Excludes lease right of use assets and lease liabilities.
(5) Excludes GAAP adjustments.
(6) Management’s assessment of comparable multifamily assets in the applicable market.
Stabilized Portfolio NOI (Cash)(1) Third-Party General Contracting and Real Estate Services
Three months ended 6/30/2021 Trailing 12 Months
Office(3) Retail Multifamily Total General Contracting Gross Profit $5,465
Stable Portfolio
Portfolio NOI (2)$7,240 $13,403 $9,177 $29,820 Non-Property Assets(4)
Unstabilized Properties NOI (399) - - (399) As of 6/30/2021
Signed Leases Not Yet Occupied or In Free Rent Period 85 990 56 1,131 Cash and Retricted Cash $53,242
Net Deferrals and Recoveries 69 (415) (13) (359) Accounts Receivable 30,227
Stable Portfolio NOI $6,995 $13,978 $9,220 $30,193 Notes Receivable, Including Mezzanine Investments (5) 112,724
Intra-Quarter Transactions Construction receivables, including retentions (5) 14,006
Net Acquisitons - - - - Acquired lease intangible assets, net 55,807
Net Dispositions - - - - Other Assets 40,443 Total - - - - Total Non-Property Assets $306,449
Annualized $27,980 $55,912 $36,880 $120,772
Liabilities(4)
As of 6/30/2021
Non-Stabilized Portfolio Mortgages and Notes Payable(5)$963,885
As of 6/30/2021 Accounts Payable and Accrued Liabilities 20,395
Projects Under Development at Cost $45,000 Construction Payables, Including Retentions 18,470
Projects Delivered Not Stabilized at Cost 110,000 Other Liabilities 60,012
Projects Under Predevelopment or On Hold 10,000 Total Liabilities $1,062,762
Unconsolidated Joint Ventures 7,000
Total Non-Stabilized Portfolio $172,000 Preferred Equity
Liquidation Value
Management's Estimate of Land Value and Vacancy Opportunities Series A Cumulative Redeemable Perpetual Preferred Stock $171,085
Size Estimated Value(6)
Harrisonburg MF Development Opportunity 228 units $20,000-30,000/unit Common Equity
As of 6/30/2021
Size Net Rent PSF Total common shares outstanding 60,992
Vacant Space at Lease 55,000 $18.50/sf Total OP units outstanding 20,853
Total Common Shares & OP Units Outstanding 81,845
9
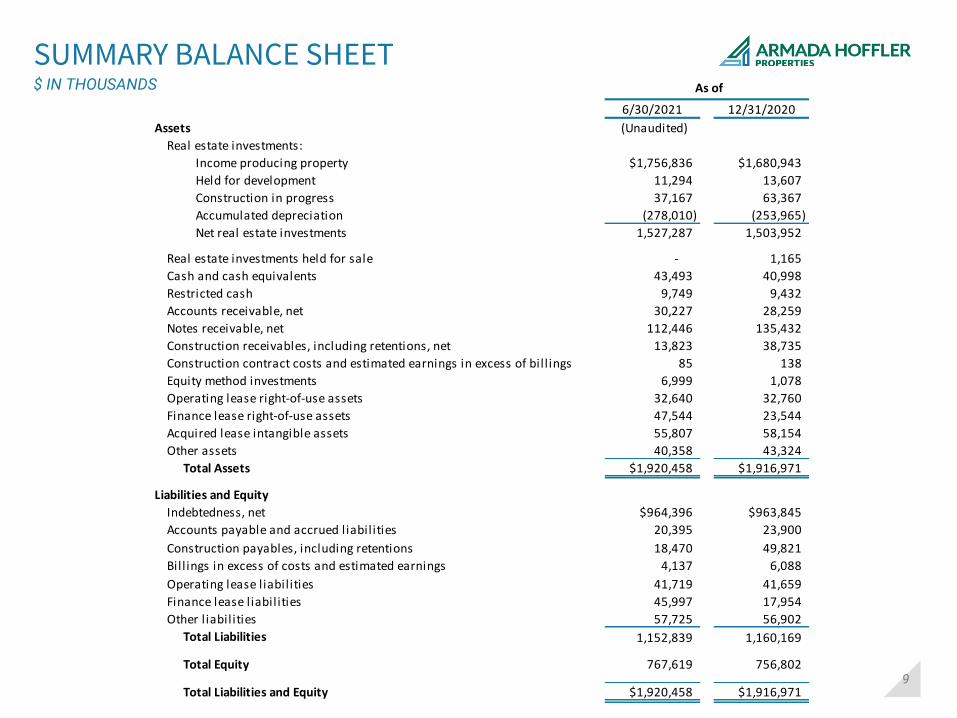
SUMMARY BALANCE SHEET$ IN THOUSANDS
6/30/2021 12/31/2020
Assets (Unaudited)
Real estate investments:
Income producing property $1,756,836 $1,680,943
Held for development 11,294 13,607
Construction in progress 37,167 63,367
Accumulated depreciation (278,010) (253,965)
Net real estate investments 1,527,287 1,503,952
Real estate investments held for sale - 1,165
Cash and cash equivalents 43,493 40,998
Restricted cash 9,749 9,432
Accounts receivable, net 30,227 28,259
Notes receivable, net 112,446 135,432
Construction receivables, including retentions, net 13,823 38,735
Construction contract costs and estimated earnings in excess of bil l ings 85 138
Equity method investments 6,999 1,078
Operating lease right-of-use assets 32,640 32,760
Finance lease right-of-use assets 47,544 23,544
Acquired lease intangible assets 55,807 58,154
Other assets 40,358 43,324
Total Assets $1,920,458 $1,916,971
Liabilities and Equity
Indebtedness, net $964,396 $963,845
Accounts payable and accrued liabilities 20,395 23,900
Construction payables, including retentions 18,470 49,821
Bil l ings in excess of costs and estimated earnings 4,137 6,088
Operating lease liabilities 41,719 41,659
Finance lease liabilities 45,997 17,954
Other l iabilities 57,725 56,902
Total Liabilities 1,152,839 1,160,169
Total Equity 767,619 756,802
Total Liabilities and Equity $1,920,458 $1,916,971
As of
10
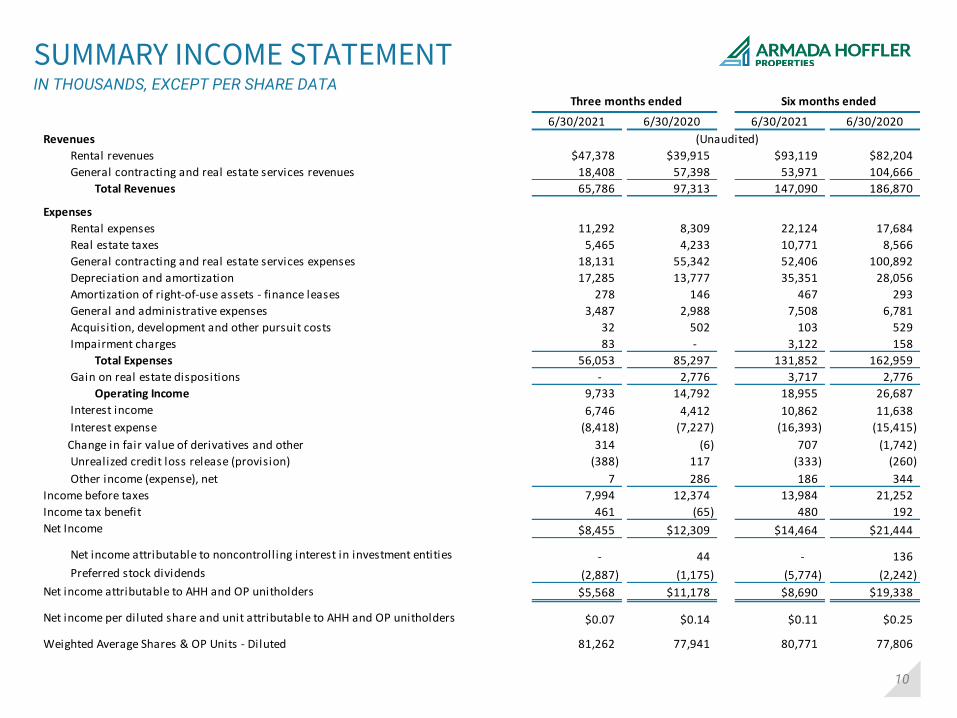
SUMMARY INCOME STATEMENTIN THOUSANDS, EXCEPT PER SHARE DATA
Three months ended Six months ended
6/30/2021 6/30/2020 6/30/2021 6/30/2020
Revenues (Unaudited)
Rental revenues $47,378 $39,915 $93,119 $82,204
General contracting and real estate services revenues 18,408 57,398 53,971 104,666
Total Revenues 65,786 97,313 147,090 186,870
Expenses
Rental expenses 11,292 8,309 22,124 17,684
Real estate taxes 5,465 4,233 10,771 8,566
General contracting and real estate services expenses 18,131 55,342 52,406 100,892
Depreciation and amortization 17,285 13,777 35,351 28,056
Amortization of right-of-use assets - finance leases 278 146 467 293
General and administrative expenses 3,487 2,988 7,508 6,781
Acquisition, development and other pursuit costs 32 502 103 529
Impairment charges 83 - 3,122 158
Total Expenses 56,053 85,297 131,852 162,959
Gain on real estate dispositions - 2,776 3,717 2,776
Operating Income 9,733 14,792 18,955 26,687
Interest income 6,746 4,412 10,862 11,638
Interest expense (8,418) (7,227) (16,393) (15,415)
Change in fair value of derivatives and other 314 (6) 707 (1,742)
Unrealized credit loss release (provision) (388) 117 (333) (260)
Other income (expense), net 7 286 186 344
Income before taxes 7,994 12,374 13,984 21,252
Income tax benefit 461 (65) 480 192
Net Income $8,455 $12,309 $14,464 $21,444
Net income attributable to noncontrolling interest in investment entities - 44 - 136
Preferred stock dividends (2,887) (1,175) (5,774) (2,242)
Net income attributable to AHH and OP unitholders $5,568 $11,178 $8,690 $19,338
Net income per diluted share and unit attributable to AHH and OP unitholders $0.07 $0.14 $0.11 $0.25
Weighted Average Shares & OP Units - Diluted 81,262 77,941 80,771 77,806
11
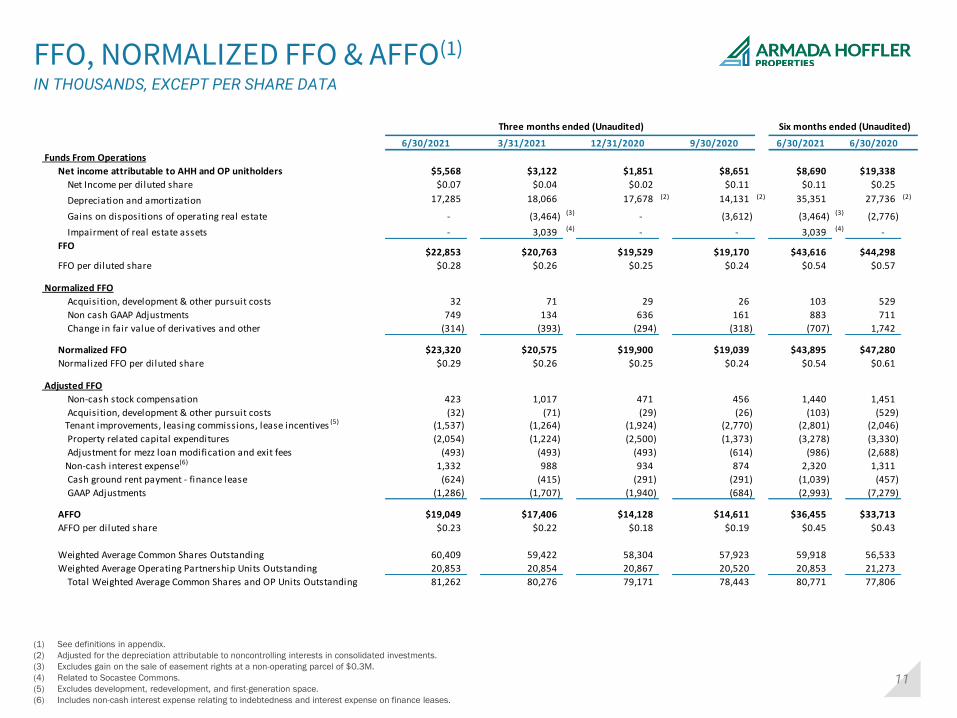
FFO, NORMALIZED FFO & AFFO(1)
IN THOUSANDS, EXCEPT PER SHARE DATA
(1) See definitions in appendix.
(2) Adjusted for the depreciation attributable to noncontrolling interests in consolidated investments.
(3) Excludes gain on the sale of easement rights at a non-operating parcel of $0.3M.
(4) Related to Socastee Commons.
(5) Excludes development, redevelopment, and first-generation space.
(6) Includes non-cash interest expense relating to indebtedness and interest expense on finance leases.
Three months ended (Unaudited)
6/30/2021 3/31/2021 12/31/2020 9/30/2020 6/30/2021 6/30/2020
Funds From Operations
Net income attributable to AHH and OP unitholders $5,568 $3,122 $1,851 $8,651 $8,690 $19,338
Net Income per diluted share $0.07 $0.04 $0.02 $0.11 $0.11 $0.25
Depreciation and amortization 17,285 18,066 17,678 (2) 14,131 (2) 35,351 27,736 (2)
Gains on dispositions of operating real estate - (3,464) (3) - (3,612) (3,464) (3) (2,776)
Impairment of real estate assets - 3,039 (4) - - 3,039 (4) -
FFO$22,853 $20,763 $19,529 $19,170 $43,616 $44,298
FFO per diluted share $0.28 $0.26 $0.25 $0.24 $0.54 $0.57
Normalized FFO
Acquisition, development & other pursuit costs 32 71 29 26 103 529
Non cash GAAP Adjustments 749 134 636 161 883 711
Change in fair value of derivatives and other (314) (393) (294) (318) (707) 1,742
Normalized FFO $23,320 $20,575 $19,900 $19,039 $43,895 $47,280
Normalized FFO per diluted share $0.29 $0.26 $0.25 $0.24 $0.54 $0.61
Adjusted FFO
Non-cash stock compensation 423 1,017 471 456 1,440 1,451
Acquisition, development & other pursuit costs (32) (71) (29) (26) (103) (529) Tenant improvements, leasing commissions, lease incentives (5) (1,537) (1,264) (1,924) (2,770) (2,801) (2,046)
Property related capital expenditures (2,054) (1,224) (2,500) (1,373) (3,278) (3,330)
Adjustment for mezz loan modification and exit fees (493) (493) (493) (614) (986) (2,688)
Non-cash interest expense(6) 1,332 988 934 874 2,320 1,311
Cash ground rent payment - finance lease (624) (415) (291) (291) (1,039) (457)
GAAP Adjustments (1,286) (1,707) (1,940) (684) (2,993) (7,279)
AFFO $19,049 $17,406 $14,128 $14,611 $36,455 $33,713
AFFO per diluted share $0.23 $0.22 $0.18 $0.19 $0.45 $0.43
Weighted Average Common Shares Outstanding 60,409 59,422 58,304 57,923 59,918 56,533
Weighted Average Operating Partnership Units Outstanding 20,853 20,854 20,867 20,520 20,853 21,273
Total Weighted Average Common Shares and OP Units Outstanding 81,262 80,276 79,171 78,443 80,771 77,806
Six months ended (Unaudited)
12
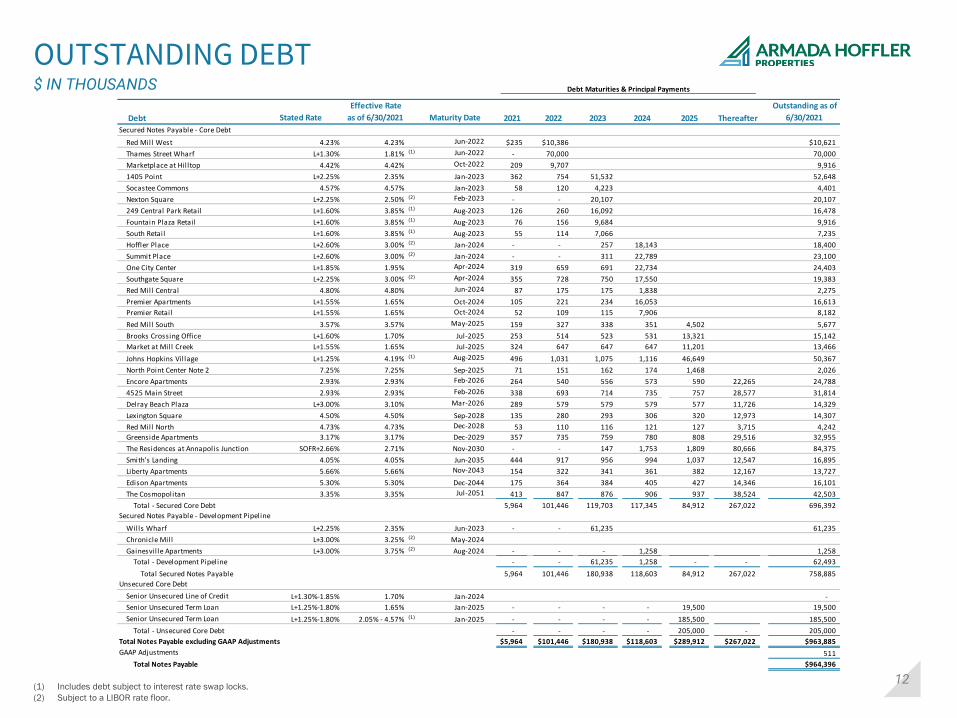
OUTSTANDING DEBT$ IN THOUSANDS
(1) Includes debt subject to interest rate swap locks.
(2) Subject to a LIBOR rate floor.
Debt Stated Rate
Effective Rate
as of 6/30/2021 Maturity Date 2021 2022 2023 2024 2025 Thereafter
Outstanding as of
6/30/2021
Secured Notes Payable - Core Debt
Red Mill West 4.23% 4.23% Jun-2022 $235 $10,386 $10,621
Thames Street Wharf L+1.30% 1.81% (1) Jun-2022 - 70,000 70,000
Marketplace at Hilltop 4.42% 4.42% Oct-2022 209 9,707 9,916
1405 Point L+2.25% 2.35% Jan-2023 362 754 51,532 52,648
Socastee Commons 4.57% 4.57% Jan-2023 58 120 4,223 4,401
Nexton Square L+2.25% 2.50% (2) Feb-2023 - - 20,107 20,107
249 Central Park Retail L+1.60% 3.85% (1) Aug-2023 126 260 16,092 16,478
Fountain Plaza Retail L+1.60% 3.85% (1) Aug-2023 76 156 9,684 9,916
South Retail L+1.60% 3.85% (1) Aug-2023 55 114 7,066 7,235
Hoffler Place L+2.60% 3.00% (2) Jan-2024 - - 257 18,143 18,400
Summit Place L+2.60% 3.00% (2) Jan-2024 - - 311 22,789 23,100
One City Center L+1.85% 1.95% Apr-2024 319 659 691 22,734 24,403
Southgate Square L+2.25% 3.00% (2) Apr-2024 355 728 750 17,550 19,383
Red Mill Central 4.80% 4.80% Jun-2024 87 175 175 1,838 2,275
Premier Apartments L+1.55% 1.65% Oct-2024 105 221 234 16,053 16,613
Premier Retail L+1.55% 1.65% Oct-2024 52 109 115 7,906 8,182
Red Mill South 3.57% 3.57% May-2025 159 327 338 351 4,502 5,677
Brooks Crossing Office L+1.60% 1.70% Jul-2025 253 514 523 531 13,321 15,142
Market at Mill Creek L+1.55% 1.65% Jul-2025 324 647 647 647 11,201 13,466
Johns Hopkins Village L+1.25% 4.19% (1) Aug-2025 496 1,031 1,075 1,116 46,649 50,367
North Point Center Note 2 7.25% 7.25% Sep-2025 71 151 162 174 1,468 2,026
Encore Apartments 2.93% 2.93% Feb-2026 264 540 556 573 590 22,265 24,788
4525 Main Street 2.93% 2.93% Feb-2026 338 693 714 735 757 28,577 31,814
Delray Beach Plaza L+3.00% 3.10% Mar-2026 289 579 579 579 577 11,726 14,329
Lexington Square 4.50% 4.50% Sep-2028 135 280 293 306 320 12,973 14,307
Red Mill North 4.73% 4.73% Dec-2028 53 110 116 121 127 3,715 4,242
Greenside Apartments 3.17% 3.17% Dec-2029 357 735 759 780 808 29,516 32,955
The Residences at Annapolis Junction SOFR+2.66% 2.71% Nov-2030 - - 147 1,753 1,809 80,666 84,375
Smith's Landing 4.05% 4.05% Jun-2035 444 917 956 994 1,037 12,547 16,895
Liberty Apartments 5.66% 5.66% Nov-2043 154 322 341 361 382 12,167 13,727
Edison Apartments 5.30% 5.30% Dec-2044 175 364 384 405 427 14,346 16,101
The Cosmopolitan 3.35% 3.35% Jul-2051 413 847 876 906 937 38,524 42,503
Total - Secured Core Debt 5,964 101,446 119,703 117,345 84,912 267,022 696,392
Secured Notes Payable - Development Pipeline
Wills Wharf L+2.25% 2.35% Jun-2023 - - 61,235 61,235
Chronicle Mill L+3.00% 3.25% (2) May-2024
Gainesvil le Apartments L+3.00% 3.75% (2) Aug-2024 - - - 1,258 1,258
Total - Development Pipeline - - 61,235 1,258 - - 62,493
Total Secured Notes Payable 5,964 101,446 180,938 118,603 84,912 267,022 758,885
Unsecured Core Debt
Senior Unsecured Line of Credit L+1.30%-1.85% 1.70% Jan-2024 -
Senior Unsecured Term Loan L+1.25%-1.80% 1.65% Jan-2025 - - - - 19,500 19,500
Senior Unsecured Term Loan L+1.25%-1.80% 2.05% - 4.57% (1) Jan-2025 - - - - 185,500 185,500
Total - Unsecured Core Debt - - - - 205,000 - 205,000
Total Notes Payable excluding GAAP Adjustments $5,964 $101,446 $180,938 $118,603 $289,912 $267,022 $963,885
GAAP Adjustments 511
Total Notes Payable $964,396
Debt Maturities & Principal Payments
13
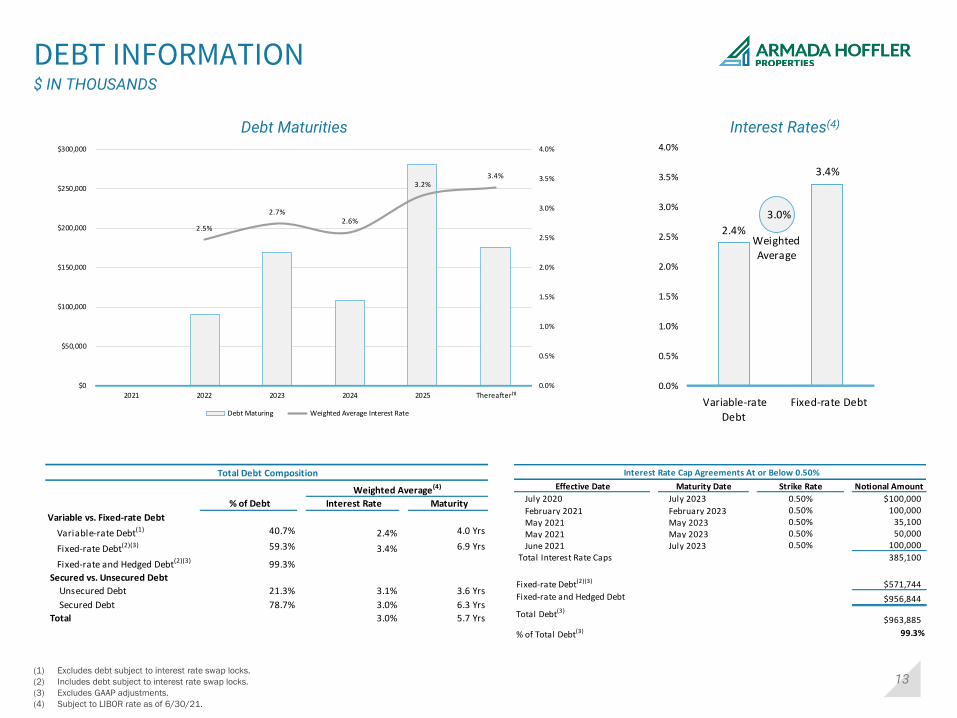
DEBT INFORMATION
Interest Rates(4)
(1) Excludes debt subject to interest rate swap locks.
(2) Includes debt subject to interest rate swap locks.
(3) Excludes GAAP adjustments.
(4) Subject to LIBOR rate as of 6/30/21.
$ IN THOUSANDS
Debt Maturities
2.5%
2.7%2.6%
3.2%3.4%
0.0%
0.5%
1.0%
1.5%
2.0%
2.5%
3.0%
3.5%
4.0%
$0
$50,000
$100,000
$150,000
$200,000
$250,000
$300,000
2021 2022 2023 2024 2025 Thereafter⁽¹⁾
Debt Maturing Weighted Average Interest Rate
Interest Rate Cap Agreements At or Below 0.50%
Effective Date Maturity Date Strike Rate Notional Amount
July 2020 July 2023 0.50% $100,000
February 2021 February 2023 0.50% 100,000
May 2021 May 2023 0.50% 35,100
May 2021 May 2023 0.50% 50,000
June 2021 July 2023 0.50% 100,000
Total Interest Rate Caps 385,100
Fixed-rate Debt(2)(3) $571,744
Fixed-rate and Hedged Debt $956,844
Total Debt(3)
$963,885
% of Total Debt(3) 99.3%
Total Debt Composition
Weighted Average(4)
% of Debt Interest Rate Maturity
Variable vs. Fixed-rate Debt
Variable-rate Debt(1) 40.7% 2.4% 4.0 Yrs
Fixed-rate Debt(2)(3) 59.3% 3.4% 6.9 Yrs
Fixed-rate and Hedged Debt(2)(3) 99.3%
Secured vs. Unsecured Debt
Unsecured Debt 21.3% 3.1% 3.6 Yrs
Secured Debt 78.7% 3.0% 6.3 Yrs
Total 3.0% 5.7 Yrs
2.4%
3.4%
0.0%
0.5%
1.0%
1.5%
2.0%
2.5%
3.0%
3.5%
4.0%
Variable-rate
Debt
Fixed-rate Debt
3.0%
WeightedAverage
14
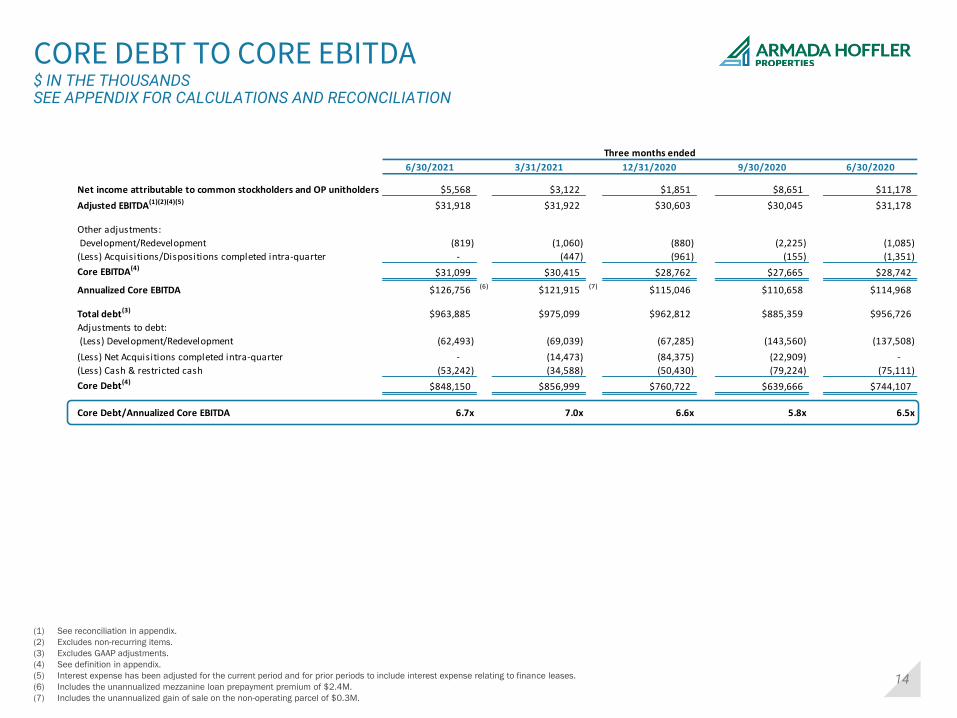
(1) See reconciliation in appendix.
(2) Excludes non-recurring items.
(3) Excludes GAAP adjustments.
(4) See definition in appendix.
(5) Interest expense has been adjusted for the current period and for prior periods to include interest expense relating to finance leases.
(6) Includes the unannualized mezzanine loan prepayment premium of $2.4M.
(7) Includes the unannualized gain of sale on the non-operating parcel of $0.3M.
CORE DEBT TO CORE EBITDA $ IN THE THOUSANDSSEE APPENDIX FOR CALCULATIONS AND RECONCILIATION
Three months ended
6/30/2021 3/31/2021 12/31/2020 9/30/2020 6/30/2020
Net income attributable to common stockholders and OP unitholders $5,568 $3,122 $1,851 $8,651 $11,178
Adjusted EBITDA(1)(2)(4)(5) $31,918 $31,922 $30,603 $30,045 $31,178
Other adjustments:
Development/Redevelopment (819) (1,060) (880) (2,225) (1,085)
(Less) Acquisitions/Dispositions completed intra-quarter - (447) (961) (155) (1,351)
Core EBITDA(4)$31,099 $30,415 $28,762 $27,665 $28,742
Annualized Core EBITDA $126,756 (6) $121,915 (7) $115,046 $110,658 $114,968
Total debt(3) $963,885 $975,099 $962,812 $885,359 $956,726
Adjustments to debt:
(Less) Development/Redevelopment (62,493) (69,039) (67,285) (143,560) (137,508)
(Less) Net Acquisitions completed intra-quarter - (14,473) (84,375) (22,909) -
(Less) Cash & restricted cash (53,242) (34,588) (50,430) (79,224) (75,111)
Core Debt(4)$848,150 $856,999 $760,722 $639,666 $744,107
Core Debt/Annualized Core EBITDA 6.7x 7.0x 6.6x 5.8x 6.5x
15
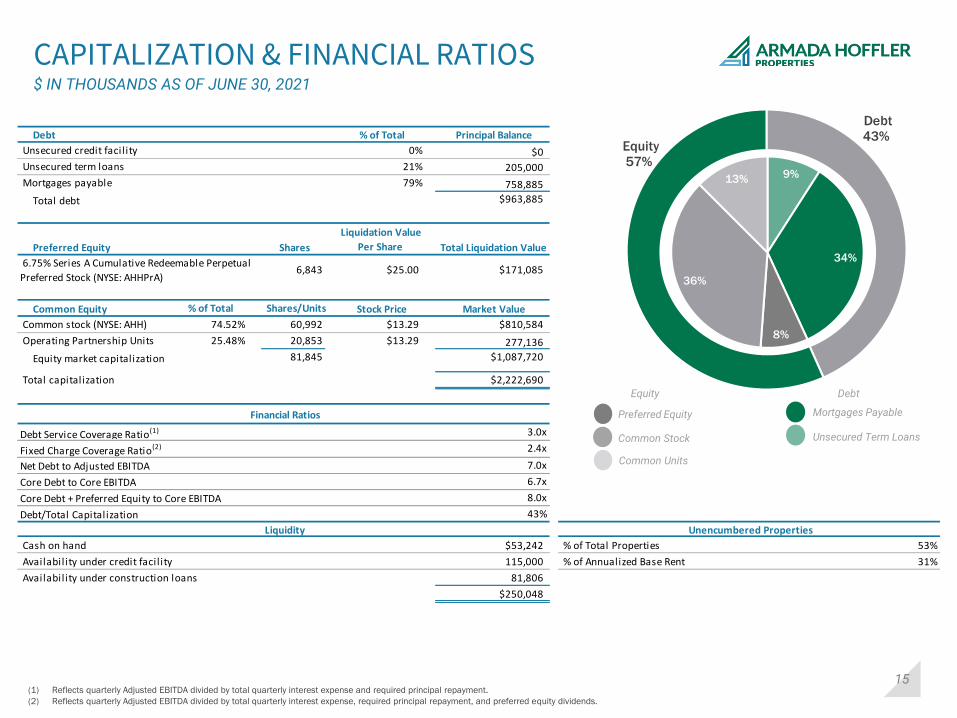
CAPITALIZATION & FINANCIAL RATIOS$ IN THOUSANDS AS OF JUNE 30, 2021
(1) Reflects quarterly Adjusted EBITDA divided by total quarterly interest expense and required principal repayment.
(2) Reflects quarterly Adjusted EBITDA divided by total quarterly interest expense, required principal repayment, and preferred equity dividends.
Unsecured Term Loans
Mortgages Payable Preferred Equity
Common Stock
Common Units
Equity Debt
Debt43%
Equity57%
9%
34%
8%
36%
13%
Debt % of Total Principal Balance
Unsecured credit facil ity 0% $0
Unsecured term loans 21% 205,000
Mortgages payable 79% 758,885
Total debt $963,885
Preferred Equity Shares
Liquidation Value
Per Share Total Liquidation Value
6,843 $25.00 $171,085
Common Equity % of Total Shares/Units Stock Price Market Value
Common stock (NYSE: AHH) 74.52% 60,992 $13.29 $810,584
Operating Partnership Units 25.48% 20,853 $13.29 277,136
Equity market capitalization 81,845 $1,087,720
Total capitalization $2,222,690
Financial Ratios
Debt Service Coverage Ratio(1) 3.0x
Fixed Charge Coverage Ratio(2) 2.4x
Net Debt to Adjusted EBITDA 7.0x
Core Debt to Core EBITDA 6.7x
Core Debt + Preferred Equity to Core EBITDA 8.0x
Debt/Total Capitalization 43%
Liquidity Unencumbered Properties
Cash on hand $53,242 % of Total Properties 53%
Availability under credit facil ity 115,000 % of Annualized Base Rent 31%
Availability under construction loans 81,806
$250,048
6.75% Series A Cumulative Redeemable Perpetual
Preferred Stock (NYSE: AHHPrA)
16
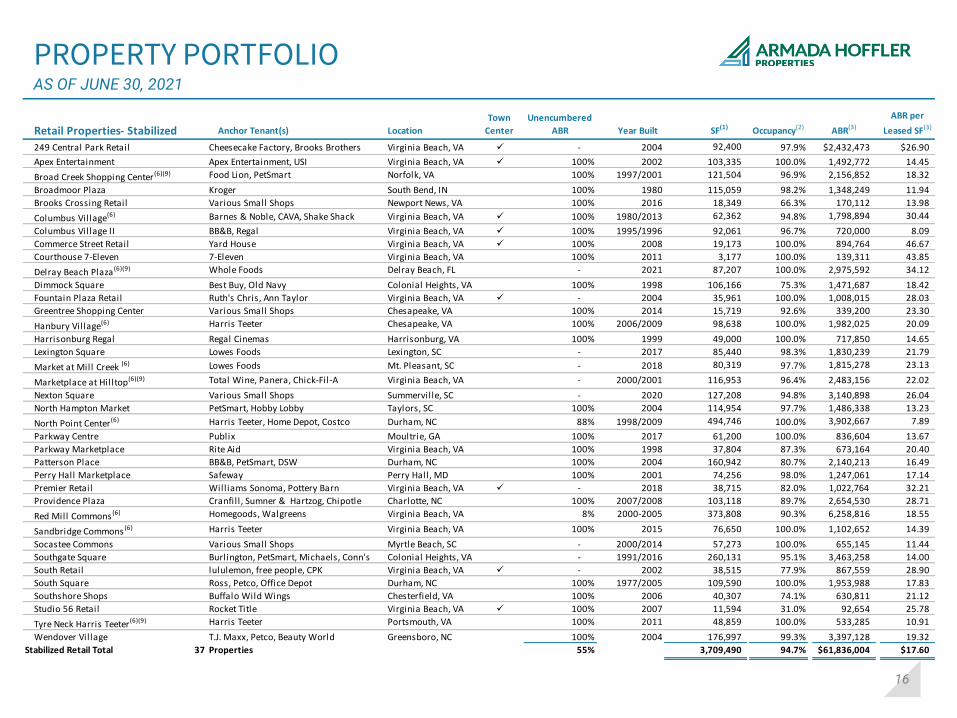
PROPERTY PORTFOLIOAS OF JUNE 30, 2021
Retail Properties- Stabilized Anchor Tenant(s) Location
Town
Center
Unencumbered
ABR Year Built SF(1) Occupancy(2) ABR(3)
ABR per
Leased SF(3)
249 Central Park Retail Cheesecake Factory, Brooks Brothers Virginia Beach, VA ✓ - 2004 92,400 97.9% $2,432,473 $26.90
Apex Entertainment Apex Entertainment, USI Virginia Beach, VA ✓ 100% 2002 103,335 100.0% 1,492,772 14.45
Broad Creek Shopping Center (6)(9) Food Lion, PetSmart Norfolk, VA 100% 1997/2001 121,504 96.9% 2,156,852 18.32
Broadmoor Plaza Kroger South Bend, IN 100% 1980 115,059 98.2% 1,348,249 11.94
Brooks Crossing Retail Various Small Shops Newport News, VA 100% 2016 18,349 66.3% 170,112 13.98
Columbus Village(6) Barnes & Noble, CAVA, Shake Shack Virginia Beach, VA ✓ 100% 1980/2013 62,362 94.8% 1,798,894 30.44
Columbus Village II BB&B, Regal Virginia Beach, VA ✓ 100% 1995/1996 92,061 96.7% 720,000 8.09
Commerce Street Retail Yard House Virginia Beach, VA ✓ 100% 2008 19,173 100.0% 894,764 46.67
Courthouse 7-Eleven 7-Eleven Virginia Beach, VA 100% 2011 3,177 100.0% 139,311 43.85
Delray Beach Plaza (6)(9) Whole Foods Delray Beach, FL - 2021 87,207 100.0% 2,975,592 34.12
Dimmock Square Best Buy, Old Navy Colonial Heights, VA 100% 1998 106,166 75.3% 1,471,687 18.42
Fountain Plaza Retail Ruth's Chris, Ann Taylor Virginia Beach, VA ✓ - 2004 35,961 100.0% 1,008,015 28.03
Greentree Shopping Center Various Small Shops Chesapeake, VA 100% 2014 15,719 92.6% 339,200 23.30
Hanbury Village(6) Harris Teeter Chesapeake, VA 100% 2006/2009 98,638 100.0% 1,982,025 20.09
Harrisonburg Regal Regal Cinemas Harrisonburg, VA 100% 1999 49,000 100.0% 717,850 14.65
Lexington Square Lowes Foods Lexington, SC - 2017 85,440 98.3% 1,830,239 21.79
Market at Mill Creek (6) Lowes Foods Mt. Pleasant, SC - 2018 80,319 97.7% 1,815,278 23.13
Marketplace at Hilltop(6)(9) Total Wine, Panera, Chick-Fil-A Virginia Beach, VA - 2000/2001 116,953 96.4% 2,483,156 22.02
Nexton Square Various Small Shops Summerville, SC - 2020 127,208 94.8% 3,140,898 26.04
North Hampton Market PetSmart, Hobby Lobby Taylors, SC 100% 2004 114,954 97.7% 1,486,338 13.23
North Point Center(6) Harris Teeter, Home Depot, Costco Durham, NC 88% 1998/2009 494,746 100.0% 3,902,667 7.89
Parkway Centre Publix Moultrie, GA 100% 2017 61,200 100.0% 836,604 13.67
Parkway Marketplace Rite Aid Virginia Beach, VA 100% 1998 37,804 87.3% 673,164 20.40
Patterson Place BB&B, PetSmart, DSW Durham, NC 100% 2004 160,942 80.7% 2,140,213 16.49
Perry Hall Marketplace Safeway Perry Hall, MD 100% 2001 74,256 98.0% 1,247,061 17.14
Premier Retail Will iams Sonoma, Pottery Barn Virginia Beach, VA ✓ - 2018 38,715 82.0% 1,022,764 32.21
Providence Plaza Cranfil l , Sumner & Hartzog, Chipotle Charlotte, NC 100% 2007/2008 103,118 89.7% 2,654,530 28.71
Red Mill Commons (6) Homegoods, Walgreens Virginia Beach, VA 8% 2000-2005 373,808 90.3% 6,258,816 18.55
Sandbridge Commons (6) Harris Teeter Virginia Beach, VA 100% 2015 76,650 100.0% 1,102,652 14.39
Socastee Commons Various Small Shops Myrtle Beach, SC - 2000/2014 57,273 100.0% 655,145 11.44
Southgate Square Burlington, PetSmart, Michaels, Conn's Colonial Heights, VA - 1991/2016 260,131 95.1% 3,463,258 14.00
South Retail lululemon, free people, CPK Virginia Beach, VA ✓ - 2002 38,515 77.9% 867,559 28.90
South Square Ross, Petco, Office Depot Durham, NC 100% 1977/2005 109,590 100.0% 1,953,988 17.83
Southshore Shops Buffalo Wild Wings Chesterfield, VA 100% 2006 40,307 74.1% 630,811 21.12
Studio 56 Retail Rocket Title Virginia Beach, VA ✓ 100% 2007 11,594 31.0% 92,654 25.78
Tyre Neck Harris Teeter(6)(9) Harris Teeter Portsmouth, VA 100% 2011 48,859 100.0% 533,285 10.91
Wendover Village T.J. Maxx, Petco, Beauty World Greensboro, NC 100% 2004 176,997 99.3% 3,397,128 19.32
Stabilized Retail Total 37 Properties 55% 3,709,490 94.7% $61,836,004 $17.60
17
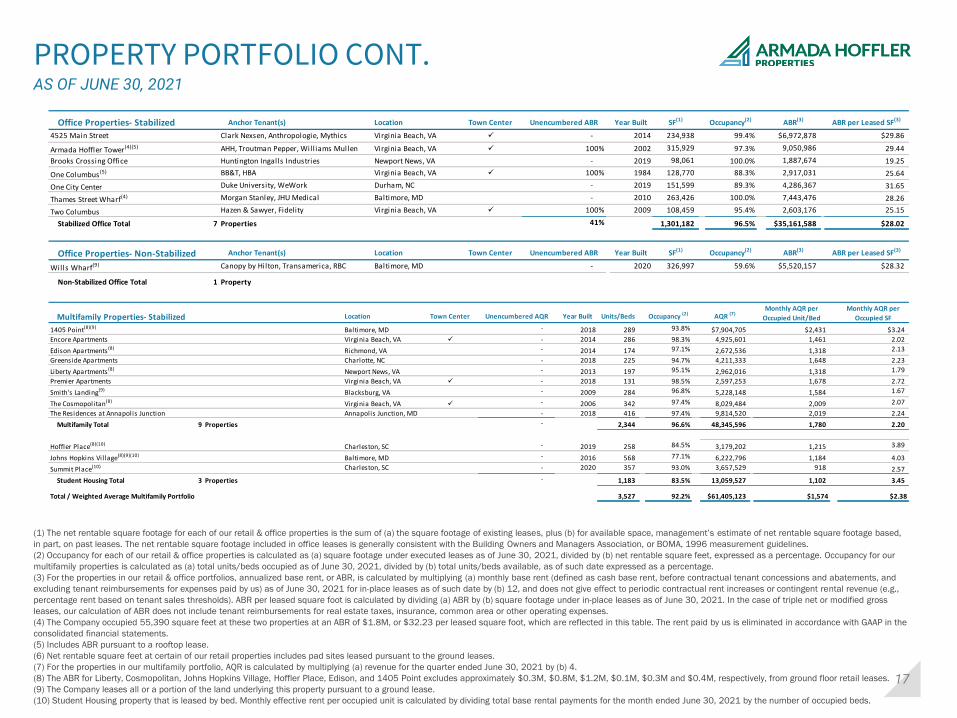
PROPERTY PORTFOLIO CONT.AS OF JUNE 30, 2021
(1) The net rentable square footage for each of our retail & office properties is the sum of (a) the square footage of existing leases, plus (b) for available space, management’s estimate of net rentable square footage based,
in part, on past leases. The net rentable square footage included in office leases is generally consistent with the Building Owners and Managers Association, or BOMA, 1996 measurement guidelines.
(2) Occupancy for each of our retail & office properties is calculated as (a) square footage under executed leases as of June 30, 2021, divided by (b) net rentable square feet, expressed as a percentage. Occupancy for our
multifamily properties is calculated as (a) total units/beds occupied as of June 30, 2021, divided by (b) total units/beds available, as of such date expressed as a percentage.
(3) For the properties in our retail & office portfolios, annualized base rent, or ABR, is calculated by multiplying (a) monthly base rent (defined as cash base rent, before contractual tenant concessions and abatements, and
excluding tenant reimbursements for expenses paid by us) as of June 30, 2021 for in-place leases as of such date by (b) 12, and does not give effect to periodic contractual rent increases or contingent rental revenue (e.g.,
percentage rent based on tenant sales thresholds). ABR per leased square foot is calculated by dividing (a) ABR by (b) square footage under in-place leases as of June 30, 2021. In the case of triple net or modified gross
leases, our calculation of ABR does not include tenant reimbursements for real estate taxes, insurance, common area or other operating expenses.
(4) The Company occupied 55,390 square feet at these two properties at an ABR of $1.8M, or $32.23 per leased square foot, which are reflected in this table. The rent paid by us is eliminated in accordance with GAAP in the
consolidated financial statements.
(5) Includes ABR pursuant to a rooftop lease.
(6) Net rentable square feet at certain of our retail properties includes pad sites leased pursuant to the ground leases.
(7) For the properties in our multifamily portfolio, AQR is calculated by multiplying (a) revenue for the quarter ended June 30, 2021 by (b) 4.
(8) The ABR for Liberty, Cosmopolitan, Johns Hopkins Village, Hoffler Place, Edison, and 1405 Point excludes approximately $0.3M, $0.8M, $1.2M, $0.1M, $0.3M and $0.4M, respectively, from ground floor retail leases.
(9) The Company leases all or a portion of the land underlying this property pursuant to a ground lease.
(10) Student Housing property that is leased by bed. Monthly effective rent per occupied unit is calculated by dividing total base rental payments for the month ended June 30, 2021 by the number of occupied beds.
Multifamily Properties- Stabilized Location Town Center Unencumbered AQR Year Built Units/Beds Occupancy (2) AQR (7)Monthly AQR per
Occupied Unit/Bed
Monthly AQR per
Occupied SF
1405 Point(8)(9) Baltimore, MD - 2018 289 93.8% $7,904,705 $2,431 $3.24
Encore Apartments Virginia Beach, VA ✓ - 2014 286 98.3% 4,925,601 1,461 2.02
Edison Apartments (8) Richmond, VA - 2014 174 97.1% 2,672,536 1,318 2.13
Greenside Apartments Charlotte, NC - 2018 225 94.7% 4,211,333 1,648 2.23
Liberty Apartments (8) Newport News, VA - 2013 197 95.1% 2,962,016 1,318 1.79
Premier Apartments Virginia Beach, VA ✓ - 2018 131 98.5% 2,597,253 1,678 2.72
Smith's Landing(9) Blacksburg, VA - 2009 284 96.8% 5,228,148 1,584 1.67
The Cosmopolitan(8) Virginia Beach, VA ✓ - 2006 342 97.4% 8,029,484 2,009 2.07
The Residences at Annapolis Junction Annapolis Junction, MD - 2018 416 97.4% 9,814,520 2,019 2.24
Multifamily Total 9 Properties - 2,344 96.6% 48,345,596 1,780 2.20
Hoffler Place(8)(10) Charleston, SC - 2019 258 84.5% 3,179,202 1,215 3.89
Johns Hopkins Village(8)(9)(10) Baltimore, MD - 2016 568 77.1% 6,222,796 1,184 4.03
Summit Place(10) Charleston, SC - 2020 357 93.0% 3,657,529 918 2.57
Student Housing Total 3 Properties - 1,183 83.5% 13,059,527 1,102 3.45
Total / Weighted Average Multifamily Portfolio 3,527 92.2% $61,405,123 $1,574 $2.38
Office Properties- Stabilized Anchor Tenant(s) Location Town Center Unencumbered ABR Year Built SF(1) Occupancy(2) ABR(3) ABR per Leased SF(3)
4525 Main Street Clark Nexsen, Anthropologie, Mythics Virginia Beach, VA ✓ - 2014 234,938 99.4% $6,972,878 $29.86
Armada Hoffler Tower(4)(5) AHH, Troutman Pepper, Will iams Mullen Virginia Beach, VA ✓ 100% 2002 315,929 97.3% 9,050,986 29.44
Brooks Crossing Office Huntington Ingalls Industries Newport News, VA - 2019 98,061 100.0% 1,887,674 19.25
One Columbus (5) BB&T, HBA Virginia Beach, VA ✓ 100% 1984 128,770 88.3% 2,917,031 25.64
One City Center Duke University, WeWork Durham, NC - 2019 151,599 89.3% 4,286,367 31.65
Thames Street Wharf(4) Morgan Stanley, JHU Medical Baltimore, MD - 2010 263,426 100.0% 7,443,476 28.26
Two Columbus Hazen & Sawyer, Fidelity Virginia Beach, VA ✓ 100% 2009 108,459 95.4% 2,603,176 25.15
Stabilized Office Total 7 Properties 41% 1,301,182 96.5% $35,161,588 $28.02
Office Properties- Non-Stabilized Anchor Tenant(s) Location Town Center Unencumbered ABR Year Built SF(1) Occupancy(2) ABR(3) ABR per Leased SF(3)
Wills Wharf(9) Canopy by Hilton, Transamerica, RBC Baltimore, MD - 2020 326,997 59.6% $5,520,157 $28.32
Non-Stabilized Office Total 1 Property
18
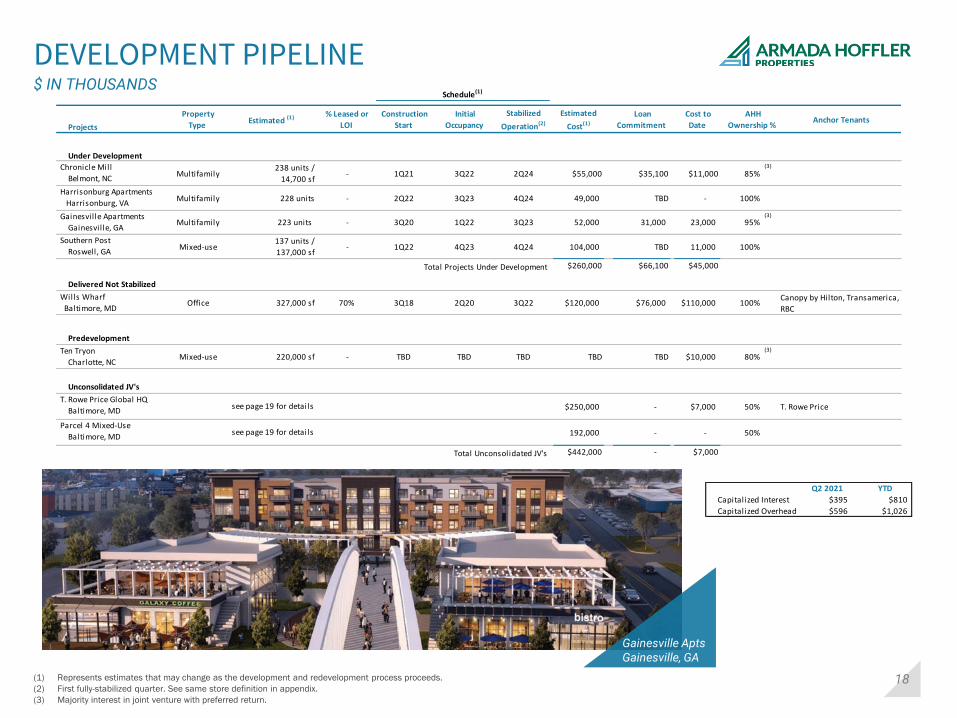
DEVELOPMENT PIPELINE$ IN THOUSANDS
(1) Represents estimates that may change as the development and redevelopment process proceeds.
(2) First fully-stabilized quarter. See same store definition in appendix.
(3) Majority interest in joint venture with preferred return.
Gainesville AptsGainesville, GA
Q2 2021 YTD
Capitalized Interest $395 $810
Capitalized Overhead $596 $1,026
Projects
Property
TypeEstimated (1) % Leased or
LOI
Construction
Start
Initial
Occupancy
Stabilized
Operation(2)
Estimated
Cost(1)
Loan
Commitment
Cost to
Date
AHH
Ownership % Anchor Tenants
Under Development
Chronicle Mill
Belmont, NC Multifamily
238 units /
14,700 sf - 1Q21 3Q22 2Q24 $55,000 $35,100 $11,000 85%
(3)
Harrisonburg Apartments
Harrisonburg, VA Multifamily 228 units - 2Q22 3Q23 4Q24 49,000 TBD - 100%
Gainesville Apartments
Gainesville, GA Multifamily 223 units - 3Q20 1Q22 3Q23 52,000 31,000 23,000 95%
(3)
Southern Post
Roswell, GA Mixed-use
137 units /
137,000 sf - 1Q22 4Q23 4Q24 104,000 TBD 11,000 100%
Total Projects Under Development $260,000 $66,100 $45,000
Delivered Not Stabilized
Wills Wharf
Baltimore, MD Office 327,000 sf 70% 3Q18 2Q20 3Q22 $120,000 $76,000 $110,000 100%
Canopy by Hilton, Transamerica,
RBC
Predevelopment
Ten Tryon
Charlotte, NC Mixed-use 220,000 sf - TBD TBD TBD TBD TBD $10,000 80%
(3)
Unconsolidated JV's
T. Rowe Price Global HQ
Baltimore, MD $250,000 - $7,000 50% T. Rowe Price
Parcel 4 Mixed-Use
Baltimore, MD 192,000 - - 50%
Total Unconsolidated JV's $442,000 - $7,000
see page 19 for details
see page 19 for details
Schedule(1)
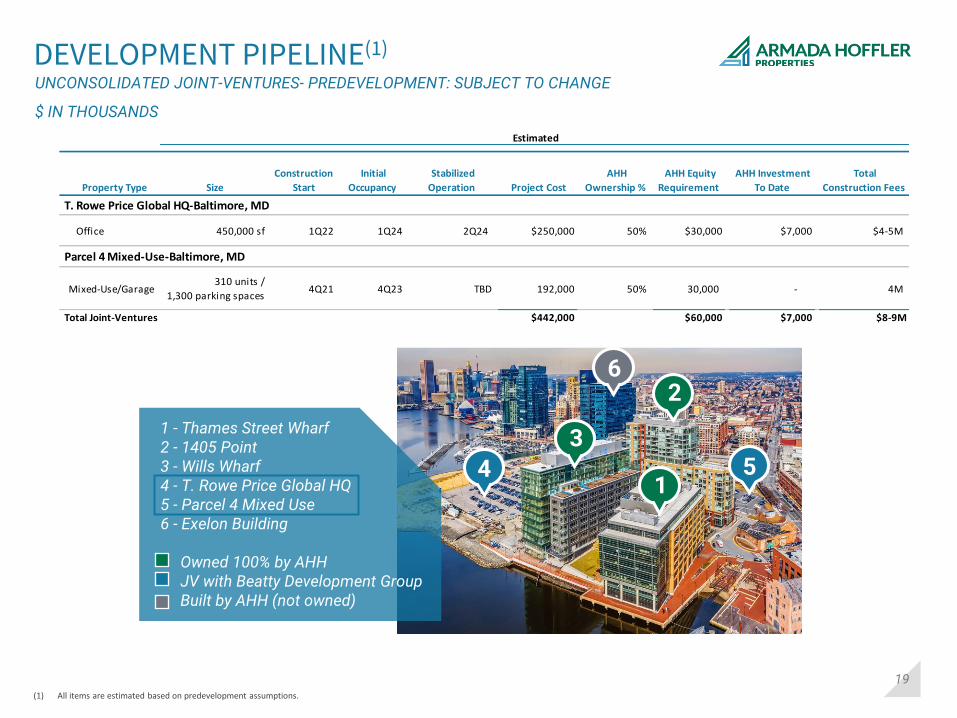
19
T Rowe Price Global HQBaltimore, MD
1 - Thames Street Wharf2 - 1405 Point3 - Wills Wharf4 - T. Rowe Price Global HQ5 - Parcel 4 Mixed Use6 - Exelon Building
Owned 100% by AHHJV with Beatty Development GroupBuilt by AHH (not owned)
62
1
3
4 5
DEVELOPMENT PIPELINE(1)
UNCONSOLIDATED JOINT-VENTURES- PREDEVELOPMENT: SUBJECT TO CHANGE
$ IN THOUSANDS
(1) All items are estimated based on predevelopment assumptions.
Estimated
Property Type Size
Construction
Start
Initial
Occupancy
Stabilized
Operation Project Cost
AHH
Ownership %
AHH Equity
Requirement
AHH Investment
To Date
Total
Construction Fees
T. Rowe Price Global HQ-Baltimore, MD
Office 450,000 sf 1Q22 1Q24 2Q24 $250,000 50% $30,000 $7,000 $4-5M
Parcel 4 Mixed-Use-Baltimore, MD
Mixed-Use/Garage310 units /
1,300 parking spaces 4Q21 4Q23 TBD 192,000 50% 30,000 - 4M
Total Joint-Ventures $442,000 $60,000 $7,000 $8-9M
20
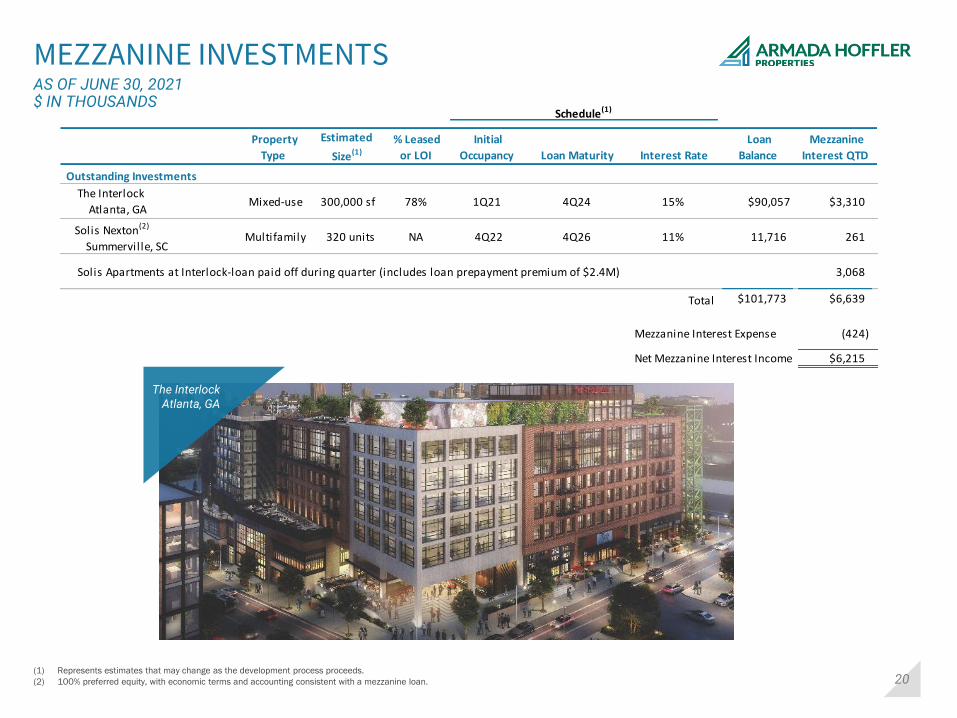
MEZZANINE INVESTMENTS
(1) Represents estimates that may change as the development process proceeds.
(2) 100% preferred equity, with economic terms and accounting consistent with a mezzanine loan.
The Interlock Atlanta, GA
AS OF JUNE 30, 2021$ IN THOUSANDS
The Interlock Atlanta, GA
Property
Type
Estimated
Size(1)
% Leased
or LOI
Initial
Occupancy Loan Maturity Interest Rate
Loan
Balance
Mezzanine
Interest QTD
Outstanding Investments
The Interlock
Atlanta, GA Mixed-use 300,000 sf 78% 1Q21 4Q24 15% $90,057 $3,310
Solis Nexton(2)
Summerville, SC Multifamily 320 units NA 4Q22 4Q26 11% 11,716 261
Solis Apartments at Interlock-loan paid off during quarter (includes loan prepayment premium of $2.4M) 3,068
Total $101,773 $6,639
Mezzanine Interest Expense (424)
Net Mezzanine Interest Income $6,215
Schedule(1)
21
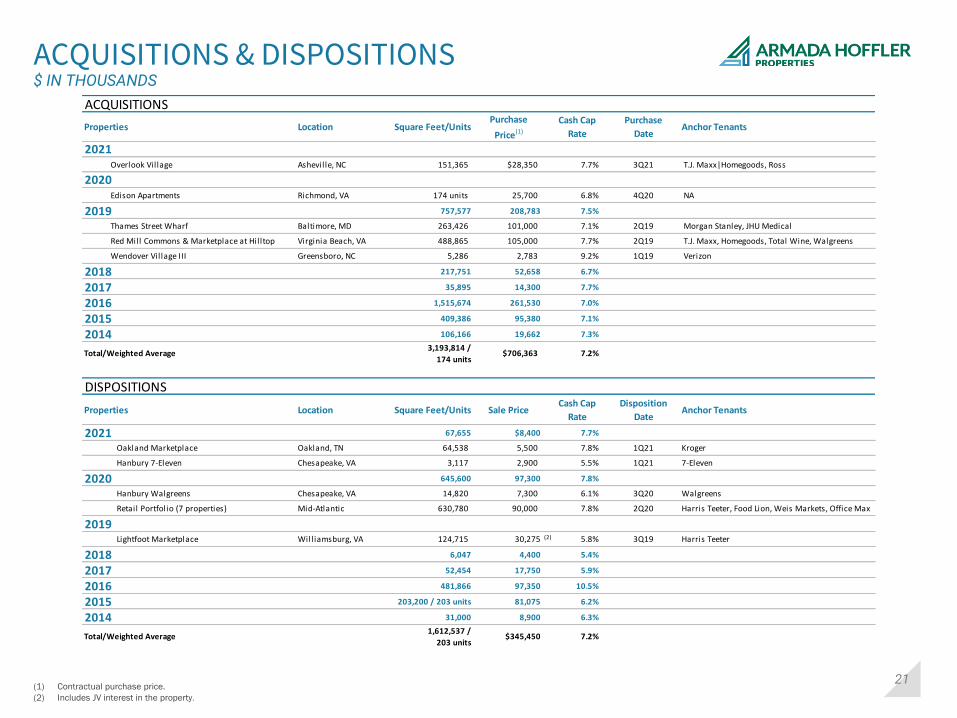
ACQUISITIONS & DISPOSITIONS$ IN THOUSANDS
(1) Contractual purchase price.
(2) Includes JV interest in the property.
ACQUISITIONS
Properties Location Square Feet/UnitsPurchase
Price(1)
Cash Cap
Rate
Purchase
DateAnchor Tenants
2021 Overlook Village Asheville, NC 151,365 $28,350 7.7% 3Q21 T.J. Maxx|Homegoods, Ross
2020 Edison Apartments Richmond, VA 174 units 25,700 6.8% 4Q20 NA
2019 757,577 208,783 7.5%
Thames Street Wharf Baltimore, MD 263,426 101,000 7.1% 2Q19 Morgan Stanley, JHU Medical
Red Mill Commons & Marketplace at Hilltop Virginia Beach, VA 488,865 105,000 7.7% 2Q19 T.J. Maxx, Homegoods, Total Wine, Walgreens
Wendover Village III Greensboro, NC 5,286 2,783 9.2% 1Q19 Verizon
2018 217,751 52,658 6.7%
2017 35,895 14,300 7.7%
2016 1,515,674 261,530 7.0%
2015 409,386 95,380 7.1%
2014 106,166 19,662 7.3%
Total/Weighted Average 3,193,814 /
174 units $706,363 7.2%
DISPOSITIONS
Properties Location Square Feet/Units Sale PriceCash Cap
Rate
Disposition
DateAnchor Tenants
2021 67,655 $8,400 7.7%
Oakland Marketplace Oakland, TN 64,538 5,500 7.8% 1Q21 Kroger
Hanbury 7-Eleven Chesapeake, VA 3,117 2,900 5.5% 1Q21 7-Eleven
2020 645,600 97,300 7.8%
Hanbury Walgreens Chesapeake, VA 14,820 7,300 6.1% 3Q20 Walgreens
Retail Portfolio (7 properties) Mid-Atlantic 630,780 90,000 7.8% 2Q20 Harris Teeter, Food Lion, Weis Markets, Office Max
2019 Lightfoot Marketplace Will iamsburg, VA 124,715 30,275 (2) 5.8% 3Q19 Harris Teeter
2018 6,047 4,400 5.4%
2017 52,454 17,750 5.9%
2016 481,866 97,350 10.5%
2015 203,200 / 203 units 81,075 6.2%
2014 31,000 8,900 6.3%
Total/Weighted Average1,612,537 /
203 units$345,450 7.2%
22
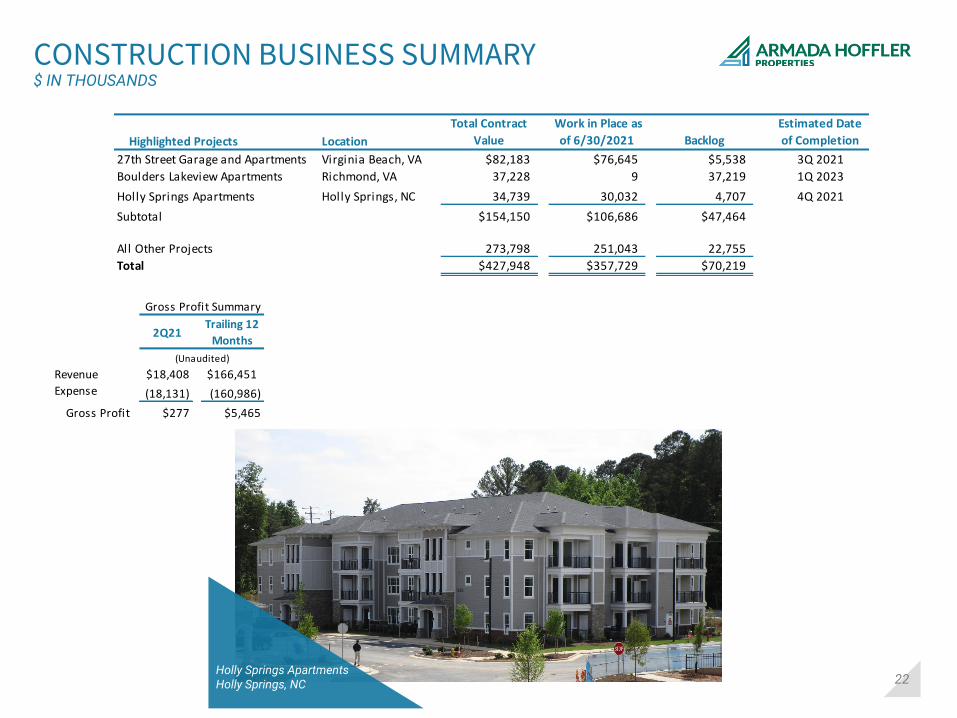
CONSTRUCTION BUSINESS SUMMARY$ IN THOUSANDS
Holly Springs ApartmentsHolly Springs, NC
Gross Profit Summary
2Q21Trailing 12
Months
(Unaudited)
Revenue $18,408 $166,451
Expense (18,131) (160,986)
Gross Profit $277 $5,465
Highlighted Projects Location
Total Contract
Value
Work in Place as
of 6/30/2021 Backlog
Estimated Date
of Completion
27th Street Garage and Apartments Virginia Beach, VA $82,183 $76,645 $5,538 3Q 2021
Boulders Lakeview Apartments Richmond, VA 37,228 9 37,219 1Q 2023
Holly Springs Apartments Holly Springs, NC 34,739 30,032 4,707 4Q 2021
Subtotal $154,150 $106,686 $47,464
All Other Projects 273,798 251,043 22,755
Total $427,948 $357,729 $70,219
23
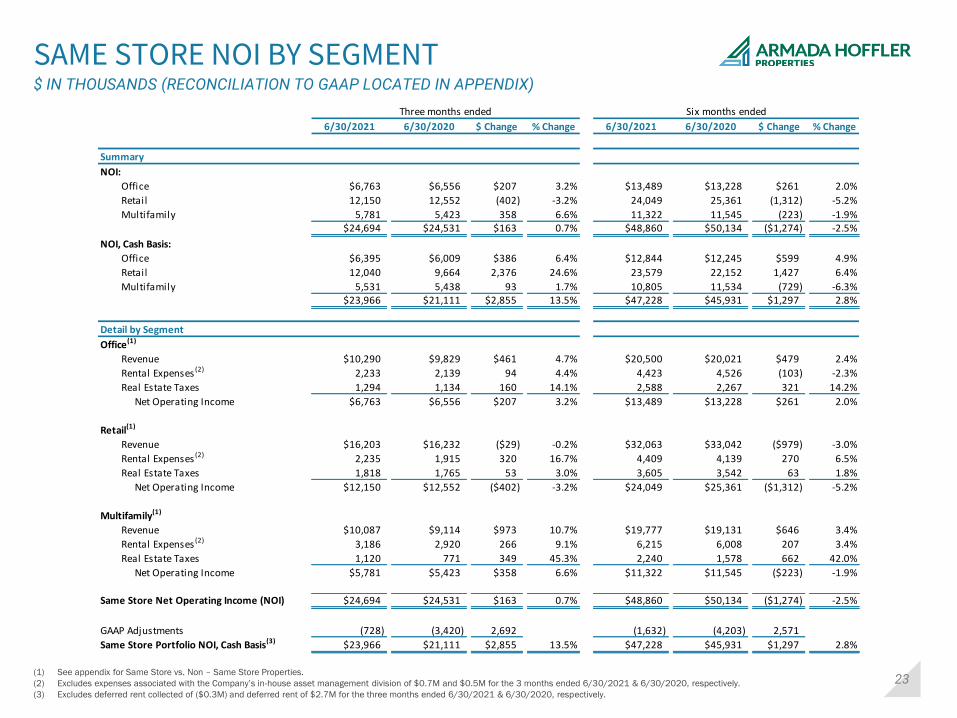
SAME STORE NOI BY SEGMENT$ IN THOUSANDS (RECONCILIATION TO GAAP LOCATED IN APPENDIX)
(1) See appendix for Same Store vs. Non – Same Store Properties.
(2) Excludes expenses associated with the Company’s in-house asset management division of $0.7M and $0.5M for the 3 months ended 6/30/2021 & 6/30/2020, respectively.
(3) Excludes deferred rent collected of ($0.3M) and deferred rent of $2.7M for the three months ended 6/30/2021 & 6/30/2020, respectively.
Three months ended Six months ended
6/30/2021 6/30/2020 $ Change % Change 6/30/2021 6/30/2020 $ Change % Change
Summary
NOI:
Office $6,763 $6,556 $207 3.2% $13,489 $13,228 $261 2.0%
Retail 12,150 12,552 (402) -3.2% 24,049 25,361 (1,312) -5.2%
Multifamily 5,781 5,423 358 6.6% 11,322 11,545 (223) -1.9%$24,694 $24,531 $163 0.7% $48,860 $50,134 ($1,274) -2.5%
NOI, Cash Basis:
Office $6,395 $6,009 $386 6.4% $12,844 $12,245 $599 4.9%
Retail 12,040 9,664 2,376 24.6% 23,579 22,152 1,427 6.4%
Multifamily 5,531 5,438 93 1.7% 10,805 11,534 (729) -6.3%$23,966 $21,111 $2,855 13.5% $47,228 $45,931 $1,297 2.8%
Detail by Segment
Office(1)
Revenue $10,290 $9,829 $461 4.7% $20,500 $20,021 $479 2.4%
Rental Expenses (2) 2,233 2,139 94 4.4% 4,423 4,526 (103) -2.3%
Real Estate Taxes 1,294 1,134 160 14.1% 2,588 2,267 321 14.2%
Net Operating Income $6,763 $6,556 $207 3.2% $13,489 $13,228 $261 2.0%
Retail(1)
Revenue $16,203 $16,232 ($29) -0.2% $32,063 $33,042 ($979) -3.0%
Rental Expenses (2) 2,235 1,915 320 16.7% 4,409 4,139 270 6.5%
Real Estate Taxes 1,818 1,765 53 3.0% 3,605 3,542 63 1.8%
Net Operating Income $12,150 $12,552 ($402) -3.2% $24,049 $25,361 ($1,312) -5.2%
Multifamily(1)
Revenue $10,087 $9,114 $973 10.7% $19,777 $19,131 $646 3.4%
Rental Expenses (2) 3,186 2,920 266 9.1% 6,215 6,008 207 3.4%
Real Estate Taxes 1,120 771 349 45.3% 2,240 1,578 662 42.0%
Net Operating Income $5,781 $5,423 $358 6.6% $11,322 $11,545 ($223) -1.9%
Same Store Net Operating Income (NOI) $24,694 $24,531 $163 0.7% $48,860 $50,134 ($1,274) -2.5%
GAAP Adjustments (728) (3,420) 2,692 (1,632) (4,203) 2,571
$23,966 $21,111 $2,855 13.5% $47,228 $45,931 $1,297 2.8%Same Store Portfolio NOI, Cash Basis(3)
24
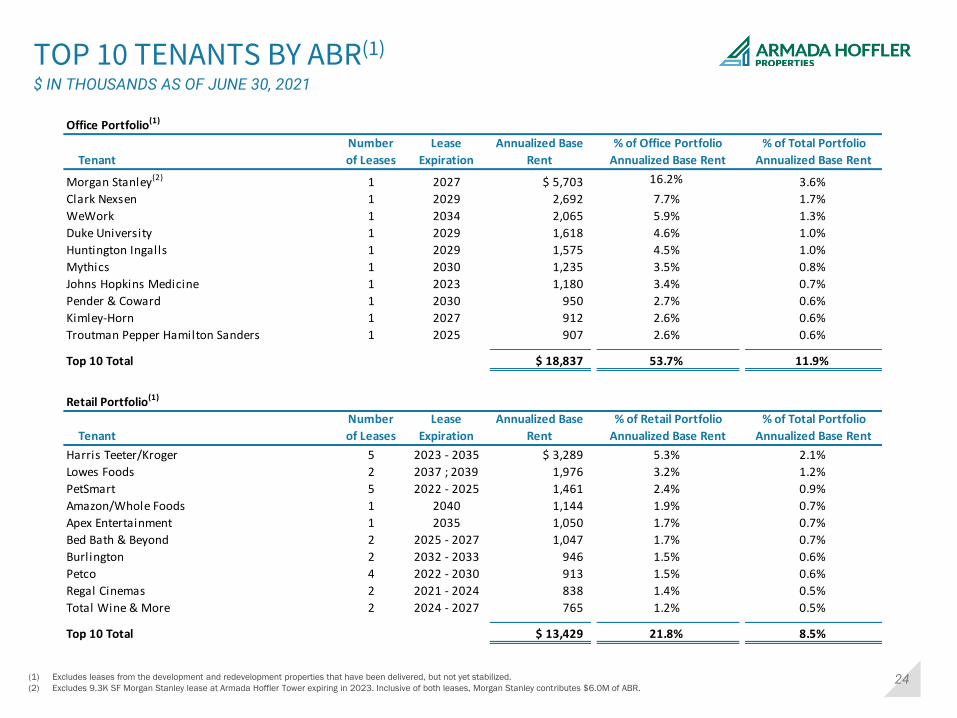
TOP 10 TENANTS BY ABR(1)
$ IN THOUSANDS AS OF JUNE 30, 2021
(1) Excludes leases from the development and redevelopment properties that have been delivered, but not yet stabilized.
(2) Excludes 9.3K SF Morgan Stanley lease at Armada Hoffler Tower expiring in 2023. Inclusive of both leases, Morgan Stanley contributes $6.0M of ABR.
Office Portfolio(1)
Tenant
Number
of Leases
Lease
Expiration
Annualized Base
Rent
% of Office Portfolio
Annualized Base Rent
% of Total Portfolio
Annualized Base Rent
Morgan Stanley(2) 1 2027 $ 5,703 16.2% 3.6%
Clark Nexsen 1 2029 2,692 7.7% 1.7%
WeWork 1 2034 2,065 5.9% 1.3%
Duke University 1 2029 1,618 4.6% 1.0%
Huntington Ingalls 1 2029 1,575 4.5% 1.0%
Mythics 1 2030 1,235 3.5% 0.8%
Johns Hopkins Medicine 1 2023 1,180 3.4% 0.7%
Pender & Coward 1 2030 950 2.7% 0.6%
Kimley-Horn 1 2027 912 2.6% 0.6%
Troutman Pepper Hamilton Sanders 1 2025 907 2.6% 0.6%
Top 10 Total $ 18,837 53.7% 11.9%
Retail Portfolio(1)
Tenant
Number
of Leases
Lease
Expiration
Annualized Base
Rent
% of Retail Portfolio
Annualized Base Rent
% of Total Portfolio
Annualized Base Rent
Harris Teeter/Kroger 5 2023 - 2035 $ 3,289 5.3% 2.1%
Lowes Foods 2 2037 ; 2039 1,976 3.2% 1.2%
PetSmart 5 2022 - 2025 1,461 2.4% 0.9%
Amazon/Whole Foods 1 2040 1,144 1.9% 0.7%
Apex Entertainment 1 2035 1,050 1.7% 0.7%
Bed Bath & Beyond 2 2025 - 2027 1,047 1.7% 0.7%
Burlington 2 2032 - 2033 946 1.5% 0.6%
Petco 4 2022 - 2030 913 1.5% 0.6%
Regal Cinemas 2 2021 - 2024 838 1.4% 0.5%
Total Wine & More 2 2024 - 2027 765 1.2% 0.5%
Top 10 Total $ 13,429 21.8% 8.5%
25
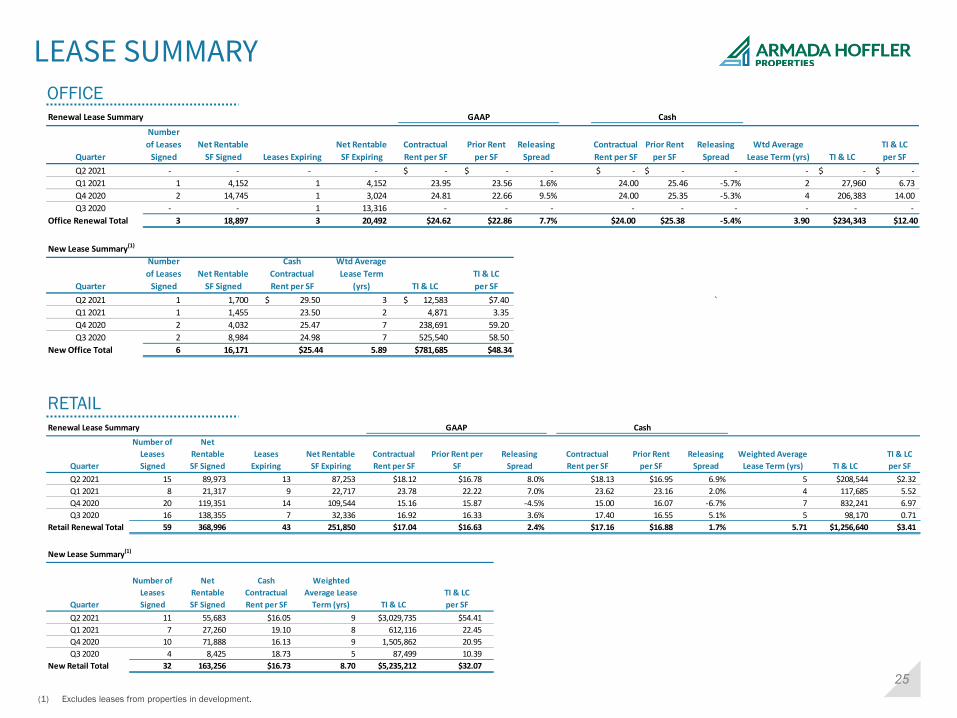
LEASE SUMMARYOFFICE
RETAIL
(1) Excludes leases from properties in development.
Renewal Lease Summary GAAP Cash
Quarter
Number
of Leases
Signed
Net Rentable
SF Signed Leases Expiring
Net Rentable
SF Expiring
Contractual
Rent per SF
Prior Rent
per SF
Releasing
Spread
Contractual
Rent per SF
Prior Rent
per SF
Releasing
Spread
Wtd Average
Lease Term (yrs) TI & LC
TI & LC
per SF
Q2 2021 - - - - -$ -$ - -$ -$ - - -$ -$
Q1 2021 1 4,152 1 4,152 23.95 23.56 1.6% 24.00 25.46 -5.7% 2 27,960 6.73
Q4 2020 2 14,745 1 3,024 24.81 22.66 9.5% 24.00 25.35 -5.3% 4 206,383 14.00
Q3 2020 - - 1 13,316 - - - - - - - - -
Office Renewal Total 3 18,897 3 20,492 $24.62 $22.86 7.7% $24.00 $25.38 -5.4% 3.90 $234,343 $12.40
New Lease Summary(1)
Quarter
Number
of Leases
Signed
Net Rentable
SF Signed
Cash
Contractual
Rent per SF
Wtd Average
Lease Term
(yrs) TI & LC
TI & LC
per SF
Q2 2021 1 1,700 29.50$ 3 12,583$ $7.40 `
Q1 2021 1 1,455 23.50 2 4,871 3.35
Q4 2020 2 4,032 25.47 7 238,691 59.20
Q3 2020 2 8,984 24.98 7 525,540 58.50
New Office Total 6 16,171 $25.44 5.89 $781,685 $48.34
Renewal Lease Summary GAAP Cash
Quarter
Number of
Leases
Signed
Net
Rentable
SF Signed
Leases
Expiring
Net Rentable
SF Expiring
Contractual
Rent per SF
Prior Rent per
SF
Releasing
Spread
Contractual
Rent per SF
Prior Rent
per SF
Releasing
Spread
Weighted Average
Lease Term (yrs) TI & LC
TI & LC
per SF
Q2 2021 15 89,973 13 87,253 $18.12 $16.78 8.0% $18.13 $16.95 6.9% 5 $208,544 $2.32
Q1 2021 8 21,317 9 22,717 23.78 22.22 7.0% 23.62 23.16 2.0% 4 117,685 5.52
Q4 2020 20 119,351 14 109,544 15.16 15.87 -4.5% 15.00 16.07 -6.7% 7 832,241 6.97
Q3 2020 16 138,355 7 32,336 16.92 16.33 3.6% 17.40 16.55 5.1% 5 98,170 0.71
Retail Renewal Total 59 368,996 43 251,850 $17.04 $16.63 2.4% $17.16 $16.88 1.7% 5.71 $1,256,640 $3.41
New Lease Summary(1)
Quarter
Number of
Leases
Signed
Net
Rentable
SF Signed
Cash
Contractual
Rent per SF
Weighted
Average Lease
Term (yrs) TI & LC
TI & LC
per SF
Q2 2021 11 55,683 $16.05 9 $3,029,735 $54.41
Q1 2021 7 27,260 19.10 8 612,116 22.45
Q4 2020 10 71,888 16.13 9 1,505,862 20.95
Q3 2020 4 8,425 18.73 5 87,499 10.39
New Retail Total 32 163,256 $16.73 8.70 $5,235,212 $32.07
26
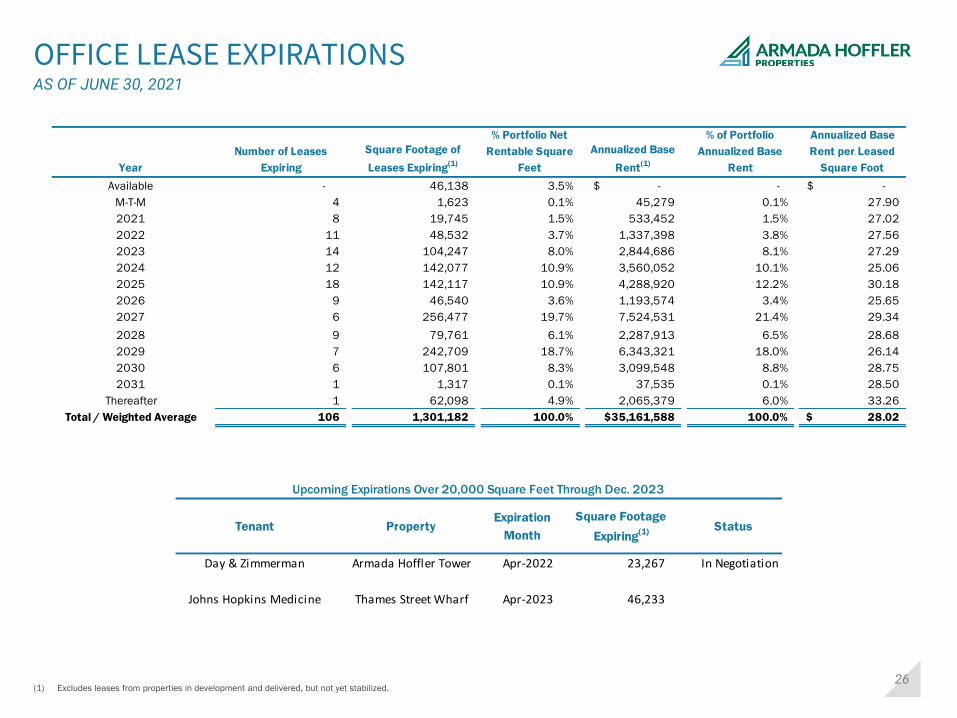
OFFICE LEASE EXPIRATIONSAS OF JUNE 30, 2021
(1) Excludes leases from properties in development and delivered, but not yet stabilized.
Upcoming Expirations Over 20,000 Square Feet Through Dec. 2023
Tenant PropertyExpiration
Month
Square Footage
Expiring(1) Status
Day & Zimmerman Armada Hoffler Tower Apr-2022 23,267 In Negotiation
Johns Hopkins Medicine Thames Street Wharf Apr-2023 46,233
Upcoming Expirations Over 20,000 Square Feet Through Dec. 2023
Year
Number of Leases
Expiring
Square Footage of
Leases Expiring(1)
% Portfolio Net
Rentable Square
Feet
Annualized Base
Rent(1)
% of Portfolio
Annualized Base
Rent
Annualized Base
Rent per Leased
Square Foot
Available - 46,138 3.5% -$ - -$
M-T-M 4 1,623 0.1% 45,279 0.1% 27.90
2021 8 19,745 1.5% 533,452 1.5% 27.02
2022 11 48,532 3.7% 1,337,398 3.8% 27.56
2023 14 104,247 8.0% 2,844,686 8.1% 27.29
2024 12 142,077 10.9% 3,560,052 10.1% 25.06
2025 18 142,117 10.9% 4,288,920 12.2% 30.18
2026 9 46,540 3.6% 1,193,574 3.4% 25.65
2027 6 256,477 19.7% 7,524,531 21.4% 29.34
2028 9 79,761 6.1% 2,287,913 6.5% 28.68
2029 7 242,709 18.7% 6,343,321 18.0% 26.14
2030 6 107,801 8.3% 3,099,548 8.8% 28.75
2031 1 1,317 0.1% 37,535 0.1% 28.50
Thereafter 1 62,098 4.9% 2,065,379 6.0% 33.26
Total / Weighted Average 106 1,301,182 100.0% $35,161,588 100.0% 28.02$
27
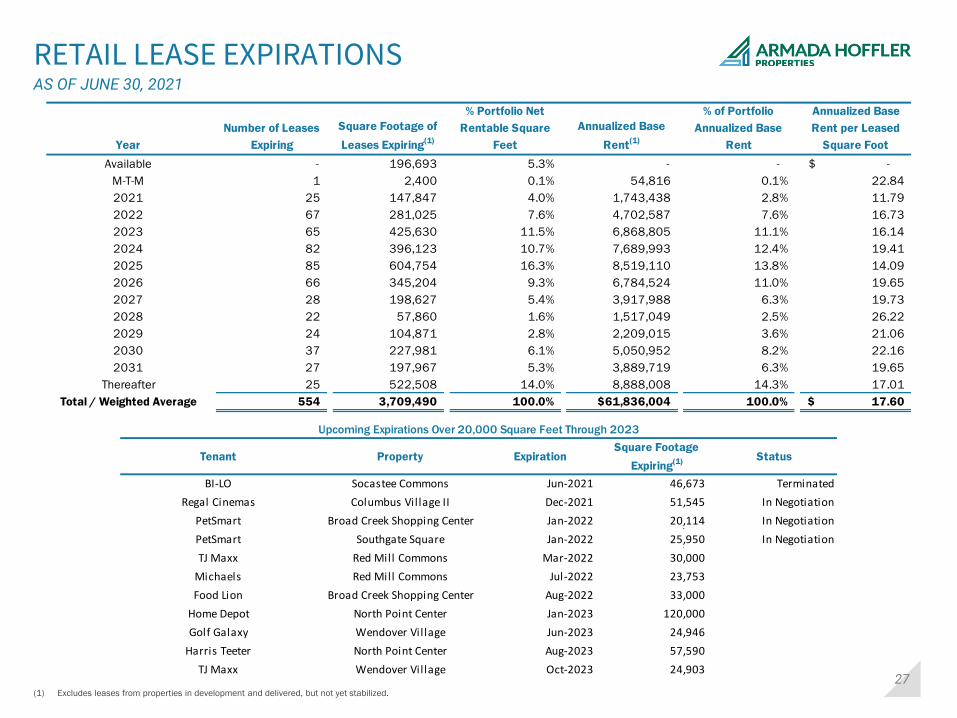
RETAIL LEASE EXPIRATIONSAS OF JUNE 30, 2021
(1) Excludes leases from properties in development and delivered, but not yet stabilized.
Upcoming Expirations Over 20,000 Square Feet Through 2023
Tenant Property ExpirationSquare Footage
Expiring(1) Status
BI-LO Socastee Commons Jun-2021 46,673 Terminated0 01/0/1900Regal Cinemas Columbus Village II Dec-2021 51,545 In Negotiation0 01/0/1900
-
PetSmart Broad Creek Shopping Center Jan-2022 20,114 In Negotiation0 0 Jun-2021 46,673
PetSmart Southgate Square Jan-2022 25,950 In Negotiation0 0 Jun-2021 46,673
TJ Maxx Red Mill Commons Mar-2022 30,000 0 0
Michaels Red Mill Commons Jul-2022 23,753 0 0
Food Lion Broad Creek Shopping Center Aug-2022 33,000 0 0
Home Depot North Point Center Jan-2023 120,000 0 0
Golf Galaxy Wendover Village Jun-2023 24,946 0 0
Harris Teeter North Point Center Aug-2023 57,590 0 0
TJ Maxx Wendover Village Oct-2023 24,903
Year
Number of Leases
Expiring
Square Footage of
Leases Expiring(1)
% Portfolio Net
Rentable Square
Feet
Annualized Base
Rent(1)
% of Portfolio
Annualized Base
Rent
Annualized Base
Rent per Leased
Square Foot
Available - 196,693 5.3% - - -$
M-T-M 1 2,400 0.1% 54,816 0.1% 22.84
2021 25 147,847 4.0% 1,743,438 2.8% 11.79
2022 67 281,025 7.6% 4,702,587 7.6% 16.73
2023 65 425,630 11.5% 6,868,805 11.1% 16.14
2024 82 396,123 10.7% 7,689,993 12.4% 19.41
2025 85 604,754 16.3% 8,519,110 13.8% 14.09
2026 66 345,204 9.3% 6,784,524 11.0% 19.65
2027 28 198,627 5.4% 3,917,988 6.3% 19.73
2028 22 57,860 1.6% 1,517,049 2.5% 26.22
2029 24 104,871 2.8% 2,209,015 3.6% 21.06
2030 37 227,981 6.1% 5,050,952 8.2% 22.16
2031 27 197,967 5.3% 3,889,719 6.3% 19.65
Thereafter 25 522,508 14.0% 8,888,008 14.3% 17.01
Total / Weighted Average 554 3,709,490 100.0% $61,836,004 100.0% 17.60$
28
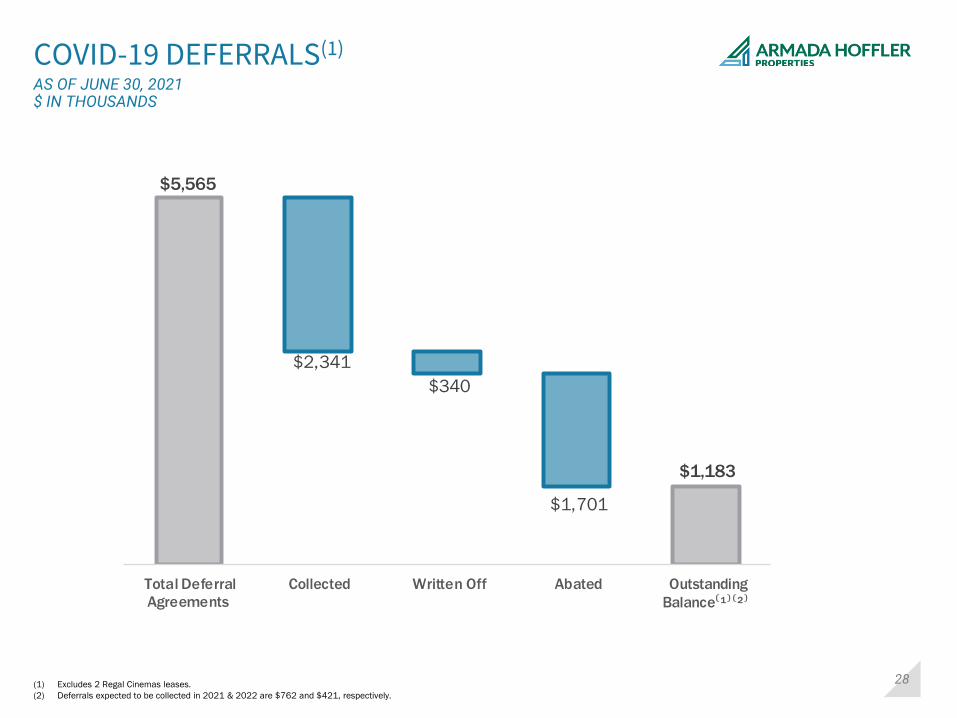
$5,565
$1,183
$2,341
$340
$1,701
Total Deferral
Agreements
Collected Written Off Abated Outstanding
Balance⁽¹⁾⁽²⁾
COVID-19 DEFERRALS(1)
AS OF JUNE 30, 2021$ IN THOUSANDS
(1) Excludes 2 Regal Cinemas leases.
(2) Deferrals expected to be collected in 2021 & 2022 are $762 and $421, respectively.
29
APPENDIX DEFINITIONS & RECONCILIATIONS
Town CenterVirginia Beach, VA
30
D E F I N I T I O N S
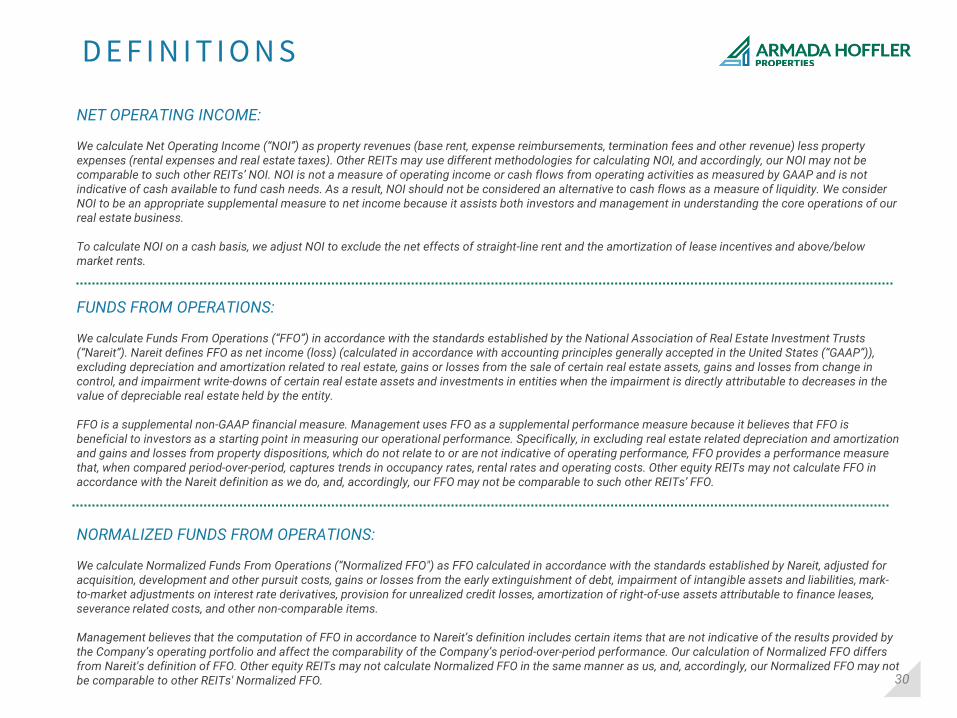
FUNDS FROM OPERATIONS:
We calculate Funds From Operations (“FFO”) in accordance with the standards established by the National Association of Real Estate Investment Trusts (“Nareit”). Nareit defines FFO as net income (loss) (calculated in accordance with accounting principles generally accepted in the United States (“GAAP”)), excluding depreciation and amortization related to real estate, gains or losses from the sale of certain real estate assets, gains and losses from change in control, and impairment write-downs of certain real estate assets and investments in entities when the impairment is directly attributable to decreases in the value of depreciable real estate held by the entity.
FFO is a supplemental non-GAAP financial measure. Management uses FFO as a supplemental performance measure because it believes that FFO is beneficial to investors as a starting point in measuring our operational performance. Specifically, in excluding real estate related depreciation and amortization and gains and losses from property dispositions, which do not relate to or are not indicative of operating performance, FFO provides a performance measure that, when compared period-over-period, captures trends in occupancy rates, rental rates and operating costs. Other equity REITs may not calculate FFO in accordance with the Nareit definition as we do, and, accordingly, our FFO may not be comparable to such other REITs’ FFO.
NET OPERATING INCOME:
We calculate Net Operating Income (“NOI”) as property revenues (base rent, expense reimbursements, termination fees and other revenue) less property expenses (rental expenses and real estate taxes). Other REITs may use different methodologies for calculating NOI, and accordingly, our NOI may not be comparable to such other REITs’ NOI. NOI is not a measure of operating income or cash flows from operating activities as measured by GAAP and is not indicative of cash available to fund cash needs. As a result, NOI should not be considered an alternative to cash flows as a measure of liquidity. We consider NOI to be an appropriate supplemental measure to net income because it assists both investors and management in understanding the core operations of our real estate business.
To calculate NOI on a cash basis, we adjust NOI to exclude the net effects of straight-line rent and the amortization of lease incentives and above/below market rents.
NORMALIZED FUNDS FROM OPERATIONS:
We calculate Normalized Funds From Operations (“Normalized FFO") as FFO calculated in accordance with the standards established by Nareit, adjusted for acquisition, development and other pursuit costs, gains or losses from the early extinguishment of debt, impairment of intangible assets and liabilities, mark-to-market adjustments on interest rate derivatives, provision for unrealized credit losses, amortization of right-of-use assets attributable to finance leases, severance related costs, and other non-comparable items.
Management believes that the computation of FFO in accordance to Nareit’s definition includes certain items that are not indicative of the results provided by the Company’s operating portfolio and affect the comparability of the Company’s period-over-period performance. Our calculation of Normalized FFO differs from Nareit's definition of FFO. Other equity REITs may not calculate Normalized FFO in the same manner as us, and, accordingly, our Normalized FFO may not be comparable to other REITs' Normalized FFO.
31
D E F I N I T I O N S
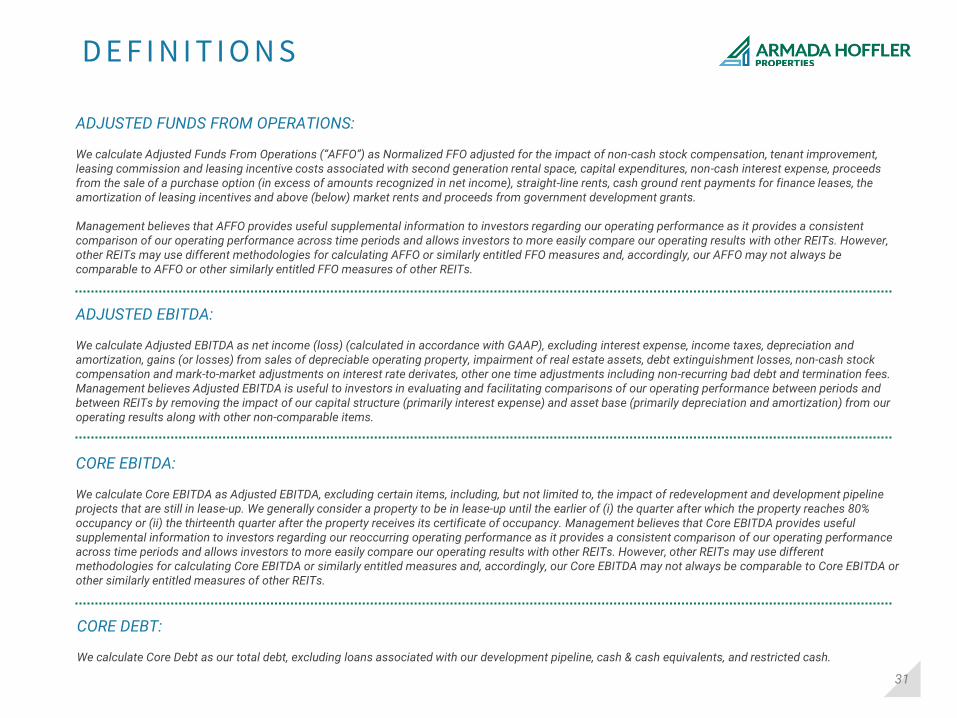
ADJUSTED FUNDS FROM OPERATIONS:
We calculate Adjusted Funds From Operations (“AFFO”) as Normalized FFO adjusted for the impact of non-cash stock compensation, tenant improvement, leasing commission and leasing incentive costs associated with second generation rental space, capital expenditures, non-cash interest expense, proceeds from the sale of a purchase option (in excess of amounts recognized in net income), straight-line rents, cash ground rent payments for finance leases, the amortization of leasing incentives and above (below) market rents and proceeds from government development grants.
Management believes that AFFO provides useful supplemental information to investors regarding our operating performance as it provides a consistent comparison of our operating performance across time periods and allows investors to more easily compare our operating results with other REITs. However, other REITs may use different methodologies for calculating AFFO or similarly entitled FFO measures and, accordingly, our AFFO may not always be comparable to AFFO or other similarly entitled FFO measures of other REITs.
ADJUSTED EBITDA:
We calculate Adjusted EBITDA as net income (loss) (calculated in accordance with GAAP), excluding interest expense, income taxes, depreciation and amortization, gains (or losses) from sales of depreciable operating property, impairment of real estate assets, debt extinguishment losses, non-cash stock compensation and mark-to-market adjustments on interest rate derivates, other one time adjustments including non-recurring bad debt and termination fees. Management believes Adjusted EBITDA is useful to investors in evaluating and facilitating comparisons of our operating performance between periods and between REITs by removing the impact of our capital structure (primarily interest expense) and asset base (primarily depreciation and amortization) from our operating results along with other non-comparable items.
CORE EBITDA:
We calculate Core EBITDA as Adjusted EBITDA, excluding certain items, including, but not limited to, the impact of redevelopment and development pipeline projects that are still in lease-up. We generally consider a property to be in lease-up until the earlier of (i) the quarter after which the property reaches 80% occupancy or (ii) the thirteenth quarter after the property receives its certificate of occupancy. Management believes that Core EBITDA provides useful supplemental information to investors regarding our reoccurring operating performance as it provides a consistent comparison of our operating performance across time periods and allows investors to more easily compare our operating results with other REITs. However, other REITs may use different methodologies for calculating Core EBITDA or similarly entitled measures and, accordingly, our Core EBITDA may not always be comparable to Core EBITDA or other similarly entitled measures of other REITs.
CORE DEBT:
We calculate Core Debt as our total debt, excluding loans associated with our development pipeline, cash & cash equivalents, and restricted cash.
32
D E F I N I T I O N S
SAME STORE PORTFOLIO:
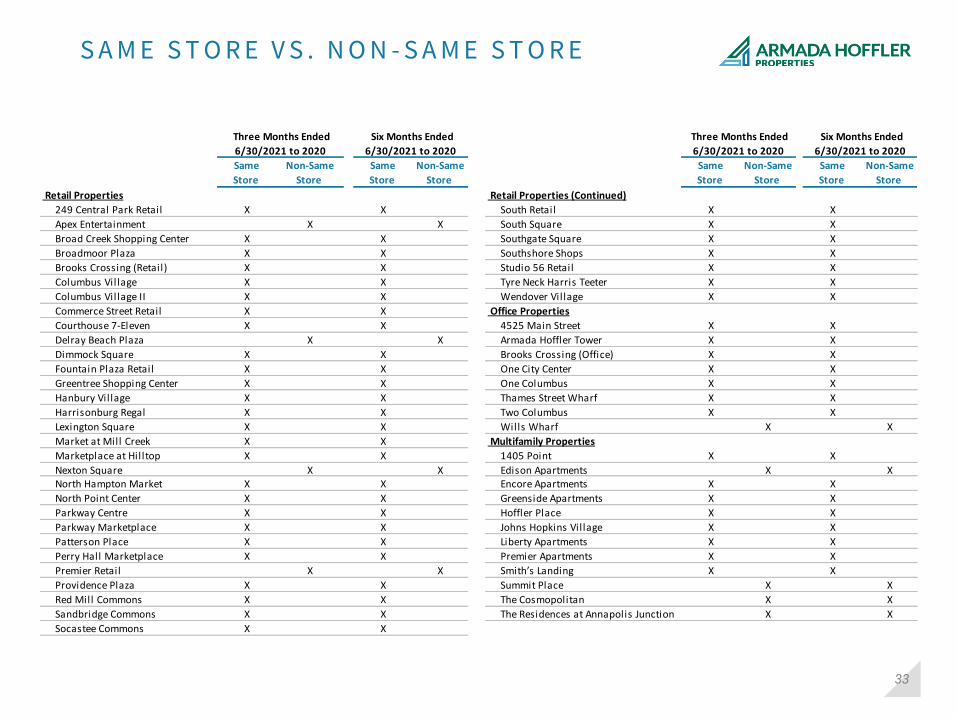
We define same store properties as those that we owned and operated and that were stabilized for the entirety of both periods compared. We generally consider a property to be stabilized upon the earlier of: (i) the quarter after the property reaches 80% occupancy or (ii) the thirteenth quarter after the property receives its certificate of occupancy. Additionally, any property that is fully or partially taken out of service for the purpose of redevelopment is no longer considered stabilized until the redevelopment activities are complete, the asset is placed back into service, and the stabilization criteria above are again met. A property may also be fully or partially taken out of service as a result of a disposition, depending on the significance of the portion of the property disposed. Finally, any property classified as Held for Sale is taken out of service for the purpose computing same store operating results. The following table shows the properties included in the same store and non-same store portfolio for the comparative periods presented.
33
S A M E S T O R E V S . N O N - S A M E S T O R E
Same
Store
Non-Same
Store
Same
Store
Non-Same
Store
Same
Store
Non-Same
Store
Same
Store
Non-Same
Store
Retail Properties Retail Properties (Continued)
249 Central Park Retail X X South Retail X X
Apex Entertainment X X South Square X X
Broad Creek Shopping Center X X Southgate Square X X
Broadmoor Plaza X X Southshore Shops X X
Brooks Crossing (Retail) X X Studio 56 Retail X X
Columbus Village X X Tyre Neck Harris Teeter X X
Columbus Village II X X Wendover Village X X
Commerce Street Retail X X Office Properties
Courthouse 7-Eleven X X 4525 Main Street X X
Delray Beach Plaza X X Armada Hoffler Tower X X
Dimmock Square X X Brooks Crossing (Office) X X
Fountain Plaza Retail X X One City Center X X
Greentree Shopping Center X X One Columbus X X
Hanbury Village X X Thames Street Wharf X X
Harrisonburg Regal X X Two Columbus X X
Lexington Square X X Wills Wharf X X
Market at Mill Creek X X Multifamily Properties
Marketplace at Hilltop X X 1405 Point X X
Nexton Square X X Edison Apartments X X North Hampton Market X X Encore Apartments X X
North Point Center X X Greenside Apartments X X
Parkway Centre X X Hoffler Place X X
Parkway Marketplace X X Johns Hopkins Village X X
Patterson Place X X Liberty Apartments X X
Perry Hall Marketplace X X Premier Apartments X X
Premier Retail X X Smith’s Landing X X
Providence Plaza X X Summit Place X X
Red Mill Commons X X The Cosmopolitan X X
Sandbridge Commons X X The Residences at Annapolis Junction X X
Socastee Commons X X
Six Months Ended
6/30/2021 to 2020
Three Months Ended
6/30/2021 to 2020
Three Months Ended
6/30/2021 to 2020
Six Months Ended
6/30/2021 to 2020
34
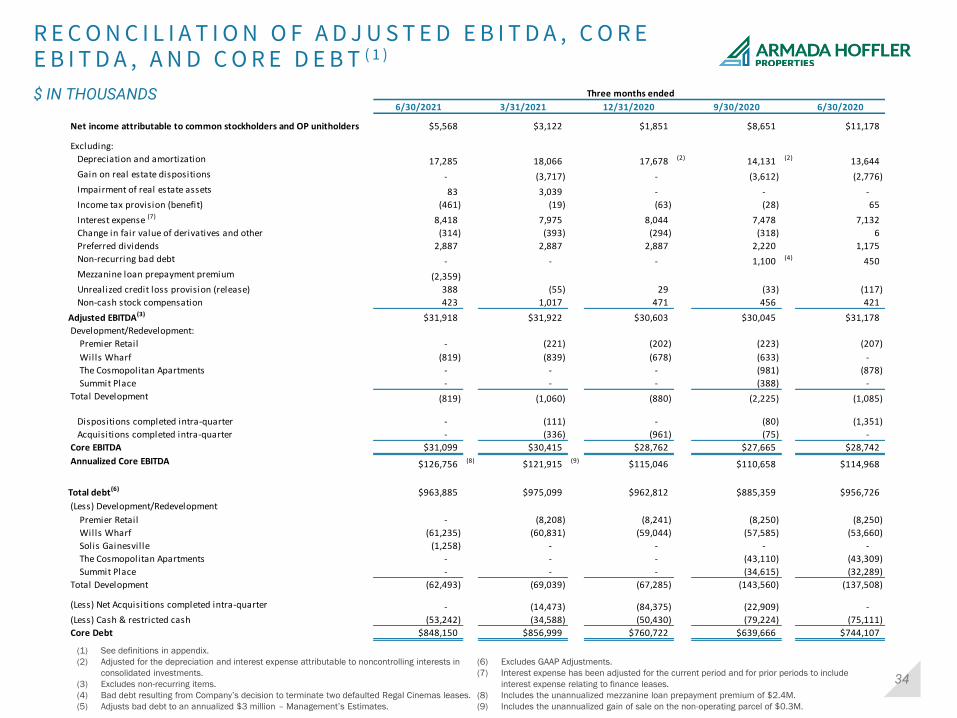
R E C O N C I L I A T I O N O F A D J U S T E D E B I T D A , C O R E E B I T D A , A N D C O R E D E B T ( 1 )
$ IN THOUSANDS
(1) See definitions in appendix.
(2) Adjusted for the depreciation and interest expense attributable to noncontrolling interests in
consolidated investments.
(3) Excludes non-recurring items.
(4) Bad debt resulting from Company’s decision to terminate two defaulted Regal Cinemas leases.
(5) Adjusts bad debt to an annualized $3 million – Management’s Estimates.
(6) Excludes GAAP Adjustments.
(7) Interest expense has been adjusted for the current period and for prior periods to include
interest expense relating to finance leases.
(8) Includes the unannualized mezzanine loan prepayment premium of $2.4M.
(9) Includes the unannualized gain of sale on the non-operating parcel of $0.3M.
Three months ended
6/30/2021 3/31/2021 12/31/2020 9/30/2020 6/30/2020
Net income attributable to common stockholders and OP unitholders $5,568 $3,122 $1,851 $8,651 $11,178
Excluding:
Depreciation and amortization 17,285 18,066 17,678 (2) 14,131 (2) 13,644
Gain on real estate dispositions - (3,717) - (3,612) (2,776)
Impairment of real estate assets 83 3,039 - - -
Income tax provision (benefit) (461) (19) (63) (28) 65
Interest expense (7) 8,418 7,975 8,044 7,478 7,132
Change in fair value of derivatives and other (314) (393) (294) (318) 6
Preferred dividends 2,887 2,887 2,887 2,220 1,175
Non-recurring bad debt - - - 1,100 (4) 450
Mezzanine loan prepayment premium (2,359)
Unrealized credit loss provision (release) 388 (55) 29 (33) (117)
Non-cash stock compensation 423 1,017 471 456 421
Adjusted EBITDA(3) $31,918 $31,922 $30,603 $30,045 $31,178
Development/Redevelopment:
Premier Retail - (221) (202) (223) (207)
Wills Wharf (819) (839) (678) (633) -
The Cosmopolitan Apartments - - - (981) (878)
Summit Place - - - (388) -
Total Development (819) (1,060) (880) (2,225) (1,085)
Dispositions completed intra-quarter - (111) - (80) (1,351)
Acquisitions completed intra-quarter - (336) (961) (75) -
Core EBITDA $31,099 $30,415 $28,762 $27,665 $28,742
Annualized Core EBITDA $126,756 (8) $121,915 (9) $115,046 $110,658 $114,968
Total debt(6) $963,885 $975,099 $962,812 $885,359 $956,726
(Less) Development/Redevelopment
Premier Retail - (8,208) (8,241) (8,250) (8,250)
Wills Wharf (61,235) (60,831) (59,044) (57,585) (53,660)
Solis Gainesville (1,258) - - - -
The Cosmopolitan Apartments - - - (43,110) (43,309)
Summit Place - - - (34,615) (32,289)
Total Development (62,493) (69,039) (67,285) (143,560) (137,508)
(Less) Net Acquisitions completed intra-quarter - (14,473) (84,375) (22,909) -
(Less) Cash & restricted cash (53,242) (34,588) (50,430) (79,224) (75,111)
Core Debt $848,150 $856,999 $760,722 $639,666 $744,107
35
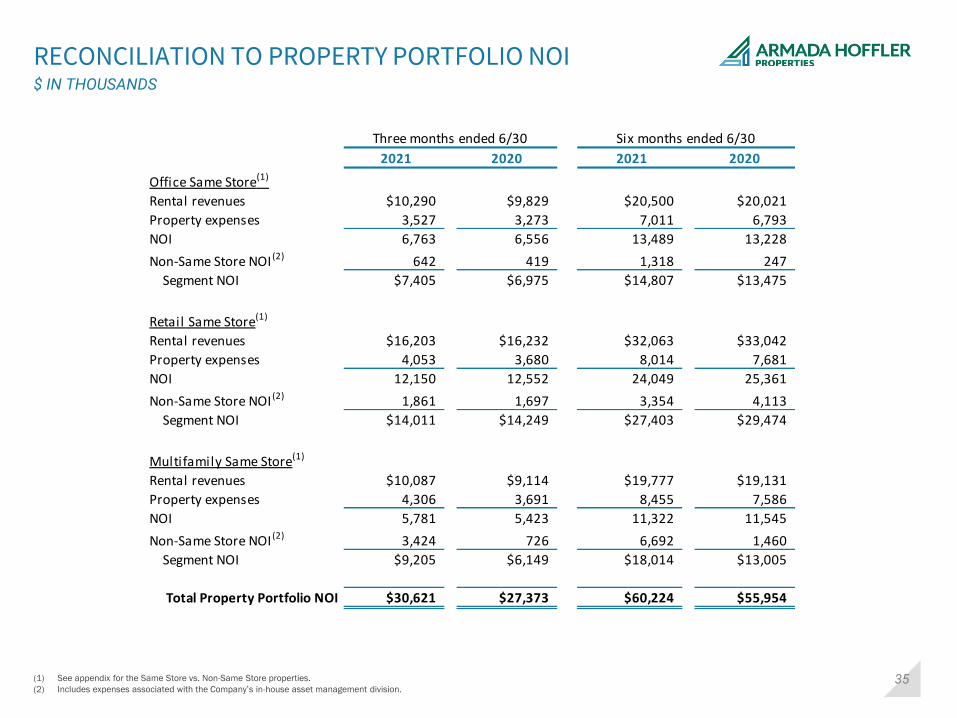
RECONCILIATION TO PROPERTY PORTFOLIO NOI$ IN THOUSANDS
(1) See appendix for the Same Store vs. Non-Same Store properties.
(2) Includes expenses associated with the Company’s in-house asset management division.
Three months ended 6/30 Six months ended 6/30
2021 2020 2021 2020
Office Same Store(1)
Rental revenues $10,290 $9,829 $20,500 $20,021
Property expenses 3,527 3,273 7,011 6,793
NOI 6,763 6,556 13,489 13,228
Non-Same Store NOI (2) 642 419 1,318 247
Segment NOI $7,405 $6,975 $14,807 $13,475
Retail Same Store(1)
Rental revenues $16,203 $16,232 $32,063 $33,042
Property expenses 4,053 3,680 8,014 7,681
NOI 12,150 12,552 24,049 25,361
Non-Same Store NOI (2) 1,861 1,697 3,354 4,113
Segment NOI $14,011 $14,249 $27,403 $29,474
Multifamily Same Store(1)
Rental revenues $10,087 $9,114 $19,777 $19,131
Property expenses 4,306 3,691 8,455 7,586
NOI 5,781 5,423 11,322 11,545
Non-Same Store NOI (2) 3,424 726 6,692 1,460
Segment NOI $9,205 $6,149 $18,014 $13,005
Total Property Portfolio NOI $30,621 $27,373 $60,224 $55,954
36
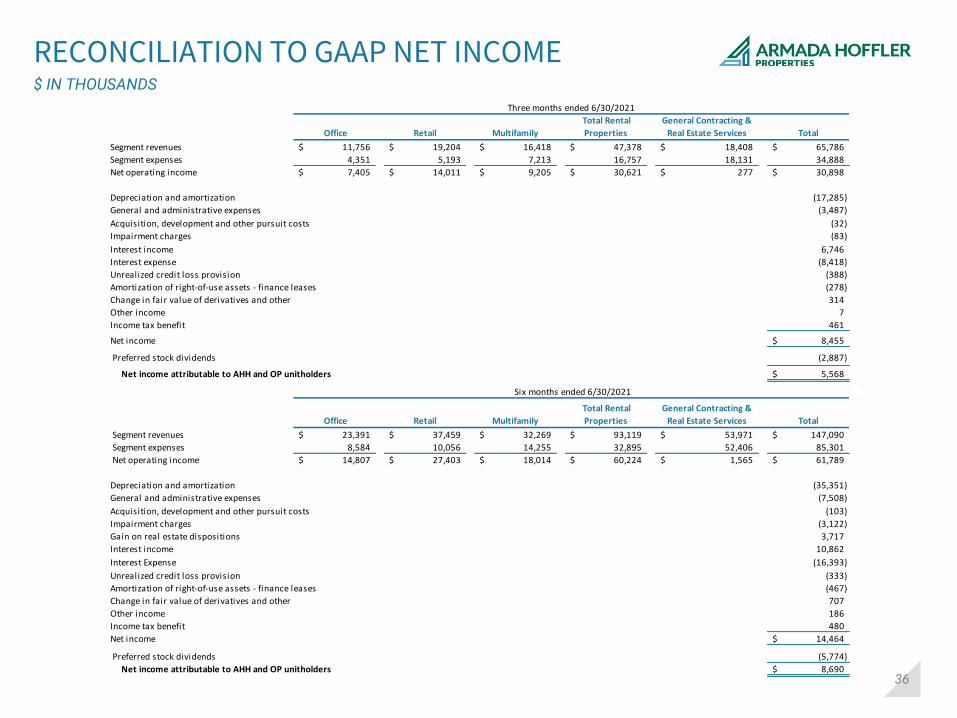
RECONCILIATION TO GAAP NET INCOME$ IN THOUSANDS
Office Retail Multifamily
Total Rental
Properties
General Contracting &
Real Estate Services Total
Segment revenues 11,756$ 19,204$ 16,418$ 47,378$ 18,408$ 65,786$
Segment expenses 4,351 5,193 7,213 16,757 18,131 34,888
Net operating income 7,405$ 14,011$ 9,205$ 30,621$ 277$ 30,898$
Depreciation and amortization (17,285)
General and administrative expenses (3,487)
Acquisition, development and other pursuit costs (32)
Impairment charges (83)
Interest income 6,746
Interest expense (8,418)
Unrealized credit loss provision (388)
Amortization of right-of-use assets - finance leases (278)
Change in fair value of derivatives and other 314
Other income 7
Income tax benefit 461
Net income 8,455$
Preferred stock dividends (2,887)
Net income attributable to AHH and OP unitholders 5,568$
Six months ended 6/30/2021
Office Retail Multifamily
Total Rental
Properties
General Contracting &
Real Estate Services Total
Segment revenues 23,391$ 37,459$ 32,269$ 93,119$ 53,971$ 147,090$
Segment expenses 8,584 10,056 14,255 32,895 52,406 85,301
Net operating income 14,807$ 27,403$ 18,014$ 60,224$ 1,565$ 61,789$
Depreciation and amortization (35,351)
General and administrative expenses (7,508)
Acquisition, development and other pursuit costs (103)
Impairment charges (3,122)
Gain on real estate dispositions 3,717
Interest income 10,862
Interest Expense (16,393)
Unrealized credit loss provision (333)
Amortization of right-of-use assets - finance leases (467)
Change in fair value of derivatives and other 707
Other income 186
Income tax benefit 480
Net income 14,464$
Preferred stock dividends (5,774)
Net income attributable to AHH and OP unitholders 8,690$
Three months ended 6/30/2021