SUPPLEMENTAL FINANCIAL, OPERATING, PROPERTY INFORMATION · This Supplemental Financial, Operating,...
47
PROPRIETARY MATERIALS © 2012 Alexandria Real Estate Equities, Inc. SUPPLEMENTAL FINANCIAL, OPERATING, & PROPERTY INFORMATION Fourth Quarter and Year Ended December 31, 2011 Conference Call Information: Wednesday, February 8, 2012 3:00 pm Eastern Time / 12:00 pm Pacific Time Number: (800) 510-0219 Confirmation Code: 46221155 385 EAST COLORADO BOULEVARD, SUITE 299 PASADENA, CALIFORNIA 91101 626.396.4828 ALEXANDRIA CENTER FOR LIFE SCIENCE – NEW YORK CITY ALEXANDRIA’S TECHNOLOGY SQUARE – CAMBRIDGE ALEXANDRIA CENTER FOR SCIENCE AND TECHNOLOGY – MISSION BAY
Transcript of SUPPLEMENTAL FINANCIAL, OPERATING, PROPERTY INFORMATION · This Supplemental Financial, Operating,...
PROPRIETARY MATERIALS
© 2012 Alexandria Real Estate Equities, Inc.
SUPPLEMENTAL FINANCIAL, OPERATING, & PROPERTY INFORMATION
Fourth Quarter and Year Ended
December 31, 2011
Conference Call Information: Wednesday, February 8, 2012
3:00 pm Eastern Time / 12:00 pm Pacific Time Number: (800) 510-0219
Confirmation Code: 46221155
385 EAST COLORADO BOULEVARD, SUITE 299 PASADENA, CALIFORNIA 91101
626.396.4828
ALEXANDRIA CENTER FOR LIFE SCIENCE – NEW YORK CITY
ALEXANDRIA’S TECHNOLOGY SQUARE – CAMBRIDGE
ALEXANDRIA CENTER FOR SCIENCE AND TECHNOLOGY – MISSION BAY
2 ALEXANDRIA REAL ESTATE EQUITIES, INC. ALL RIGHTS RESERVED © 2012
ALEXANDRIA REAL ESTATE EQUITIES, INC.
Table of Contents December 31, 2011
Page Company Profile ................................................................................................................................................................................................................................................................3 Investor Information ................................................................................................................................................................................................................................................................4 Results Fourth Quarter and Year Ended December 31, 2011, Financial and Operating Results ................................................................................................................................................................5 Condensed Consolidated Statements of Income ................................................................................................................................................................................................................................11 Condensed Consolidated Balance Sheets ................................................................................................................................................................................................................................12 Funds from Operations ................................................................................................................................................................................................................................................................13 Adjusted Funds from Operations ................................................................................................................................................................................................................................14 Financial and Asset Base Highlights ................................................................................................................................................................................................................................15 Guidance Guidance ................................................................................................................................................................................................................................................................16 Balance Sheet Credit Metrics ................................................................................................................................................................................................................................................................17 Summary of Debt ................................................................................................................................................................................................................................................................18 Summary of Dispositions of Properties and Discontinued Operations ................................................................................................................................................................................................20 Core Operating Metrics Core Operating Metrics ................................................................................................................................................................................................................................................................21 Summary of Same Property Comparisons ................................................................................................................................................................................................................................22 Summary of Leasing Activity ................................................................................................................................................................................................................................ 23 Summary of Lease Expirations ................................................................................................................................................................................................................................25 Summary of Properties and Summary of Occupancy Percentages ................................................................................................................................................................................................26 Property Listing ................................................................................................................................................................................................................................................................27 Top 20 Tenants and Client Tenant Mix ................................................................................................................................................................................................................................30 Value Added Opportunities and External Growth Value-Added Projects ................................................................................................................................................................................................................................................................31 Summary of Real Estate and Development and Redevelopment................................................................................................................................................................................................32 Development and Redevelopment ................................................................................................................................................................................................................................33 Summary of Capital Expenditures and Non-Income Producing Real Estate as a Percentage of Gross Investment in Real Estate ................................................................................................34 Future Value-Added Projects ................................................................................................................................................................................................................................ 35 Definitions and Other Information Definitions and Other Information ................................................................................................................................................................................................................................36
This Supplemental Financial, Operating, & Property Information package includes “forward-looking statements” within the meaning of Section 27A of the Securities Act of 1933, as amended, and Section 21E of the Securities Exchange Act of 1934, as amended. You can identify the forward-looking statements by their use of forward-looking words, such as “believes,” “expects,” “may,” “will,” “should,” “seeks,” “approximately,” “intends,” “plans,” “estimates,” or “anticipates,” or the negative of those words or similar words. Our actual results may differ materially from those projected in such forward-looking statements. Factors that might cause such a difference include, without limitation, our failure to obtain capital (debt, construction financing, and/or equity) or refinance debt maturities, increased interest rates and operating costs, adverse economic or real estate developments in our markets, our failure to successfully complete and lease our existing space held for redevelopment and new properties acquired for that purpose and any properties undergoing development, our failure to successfully operate or lease acquired properties, lower rental rates or higher vacancy rates or failure to renew or replace expiring leases, defaults on or non-renewal of leases by tenants, general and local economic conditions, and other risks and uncertainties detailed in our filings with the Securities and Exchange Commission (“SEC”). All forward-looking statements are made as of February 7, 2012, the date this Supplemental Financial, Operating, & Property Information package was first made available on our website, and we assume no obligation to update this information. For more discussion relating to risks and uncertainties that could cause actual results to differ materially from those anticipated in our forward-looking statements, and risks to our business in general, please refer to our SEC filings, including our most recent annual report on Form 10-K and any subsequent quarterly reports on Form 10-Q.
This Supplemental Financial, Operating, & Property Information package is not an offer to sell or solicitation to buy securities of Alexandria Real Estate Equities, Inc.
Any offers to sell or solicitations to buy securities of Alexandria Real Estate Equities, Inc. shall be made only by means of a prospectus approved for that purpose. Unless otherwise indicated, the “Company,” “we,” “us,” and “our” refer to Alexandria Real Estate Equities, Inc. and its consolidated subsidiaries.

3 ALEXANDRIA REAL ESTATE EQUITIES, INC. ALL RIGHTS RESERVED © 2012
ALEXANDRIA REAL ESTATE EQUITIES, INC.
Company Profile December 31, 2011
The Company
Alexandria Real Estate Equities, Inc. (the “Company” or “Alexandria”), a self-administered and self-managed real estate investment trust (“REIT”), is the largest owner and preeminent REIT, and leading life science real estate company, focused principally on science-driven cluster formation. Our operating platform is based on the principle of “clustering” with high-quality assets and operations located adjacent to life science research and innovation entities driving growth and technological advances. The Company has significant real estate assets adjacent to these key life science entities which we believe results in higher occupancy levels, longer lease terms, higher rental income, and higher returns. Our targeted locations are in the best submarkets within each of the top life science cluster destinations, including San Francisco and San Diego, California; Greater Boston; New York City, New Jersey, and Suburban Philadelphia; Research Triangle Park, North Carolina; Suburban Washington, D.C.; Seattle, Washington; and international locations. Client tenants include institutional (universities and independent non-profit institutions), pharmaceutical, biotechnology, medical device, product, and service entities, and government agencies. The Company was founded in 1994 by Jerry M. Sudarsky and Joel S. Marcus and the Company executed its initial public offering in 1997.
Management
Alexandria’s executive and senior management team is highly experienced in the REIT industry (uniquely with both real estate and life science experience and expertise) and is the most accomplished team focused on providing high-quality, environmentally sustainable real estate, technical infrastructure, and unique expertise to the broad and diverse life science industry. Our deep and talented team has decades of life science industry experience. Our management team also includes highly experienced regional market directors averaging over 20 years of real estate experience, including approximately 10 years with Alexandria. We believe that our expertise, experience, reputation, and key life science relationships and networks provide Alexandria significant competitive advantages in attracting new business opportunities.
Strategy
Alexandria’s primary business objective is to maximize stockholder value by providing its stockholders with the greatest possible total return based on a multifaceted platform of internal and external growth. The key elements to our strategy include our consistent focus on high-quality assets and operations in the top life science cluster locations with our properties located adjacent to life science entities driving growth and technological advances within each cluster. These adjacency locations are characterized by high barriers to entry and exit, limited supply of available space, and represent highly desirable locations for tenancy by life science entities. Alexandria’s strategy also includes drawing on its deep and broad life science and real estate relationships in order to attract new and leading life science client tenants and value-added real estate opportunities.
Summary as of December 31, 2011
Corporate headquarters Pasadena, California
Markets San Francisco, San Diego, Greater Boston, NYC/New Jersey/Suburban Philadelphia, Research Triangle Park, Suburban Washington, D.C., Seattle, and International
Fiscal year-end December 31 Total properties 173 Total rentable square feet 15.3 million
Dividend – quarter/annualized $0.49/$1.96 Dividend yield – annualized 2.8% Closing stock price $68.97 Common shares outstanding 61.6 million Total market capitalization $7.4 billion

4 ALEXANDRIA REAL ESTATE EQUITIES, INC. ALL RIGHTS RESERVED © 2012
ALEXANDRIA REAL ESTATE EQUITIES, INC.
Investor Information December 31, 2011
Executive/Senior Management Joel S. Marcus Chairman, Chief Executive Officer, & Founder Thomas J. Andrews EVP-Regional Market Director-Greater Boston Dean A. Shigenaga SVP, Chief Financial Officer, & Treasurer John J. Cox SVP-Regional Market Director-Seattle Stephen A. Richardson Chief Operating Officer & Regional Market Director-
San Francisco John H. Cunningham SVP-Regional Market Director-NY & Strategic Operations Larry J. Diamond SVP-Regional Market Director-Mid Atlantic
Peter M. Moglia Chief Investment Officer Daniel J. Ryan SVP-Regional Market Director-San Diego & Strategic Operations Jennifer J. Pappas SVP, General Counsel, & Corporate Secretary
Vincent R. Ciruzzi SVP-Construction & Development
Company Information Corporate Headquarters Trading Symbols Information Requests
385 East Colorado Boulevard, Suite 299 New York Stock Exchange (“NYSE”) Phone: (626) 396-4828 Pasadena, California 91101 Common stock: ARE E-mail: [email protected]
Series C preferred stock: ARE-C Web: www.are.com
Common Stock Data (NYSE: ARE) 4Q11 3Q11 2Q11 1Q11 4Q10 High trading price $ 71.07 $ 85.33 $ 83.08 $ 80.72 $ 76.19 Low trading price $ 56.10 $ 59.33 $ 75.09 $ 72.99 $ 65.60 Closing stock price, average for period $ 65.83 $ 72.68 $ 78.31 $ 76.79 $ 71.25 Closing stock price, at the end of the quarter $ 68.97 $ 61.39 $ 77.42 $ 77.97 $ 73.26 Dividends per share – annualized $ 1.96 $ 1.88 $ 1.80 $ 1.80 $ 1.80 Closing dividend yield – annualized 2.8% 3.1% 2.3% 2.3% 2.5% Common shares outstanding at the end of the quarter 61,560,472 61,463,839 61,380,268 55,049,730 54,966,925 Closing market value of outstanding common shares (in thousands) $ 4,245,826 $ 3,773,265 $ 4,752,060 $ 4,292,227 $ 4,026,877
Equity Research Coverage Argus Research The Goldman Sachs Group, Inc. Morningstar William Eddleman, Jr. (212) 425-7500 Jonathan Habermann (917) 343-4260 Phillip Martin (312) 286-9905
Sloan Bohlen (212) 902-2796 Jason Ren (312) 244-7008 Conor Fennerty (212) 902-4227
Banc of America Securities-Merrill Lynch Green Street Advisors RBC Capital Markets James Feldman (646) 855-5808 John Stewart (949) 640-8780 Dave Rodgers (440) 715-2647 Jeffrey Spector (646) 855-1363 John Hornbeak (949) 640-8780 Michael Carroll (440) 715-2649 Ji Zhang (646) 855-2926
Barclays Capital International Strategy & Investment Group Inc. RW Baird Ross Smotrich (212) 526-2306 George Auerbach (212) 446-9459 David AuBuchon (314) 445-6520 Matthew Rand (212) 526-0248 Steve Sakwa (212) 446-9462 Justin Webb (314) 445-6515
Gwen Clark (212) 446-5611
Citigroup Global Markets JMP Securities Standard & Poor’s Michael Bilerman (212) 816-1383 William Marks (415) 835-8944 Robert McMillan (212) 438-9522 Quentin Velleley (212) 816-6981 Rochan Raichura (415) 835-3909 David Shamis (212) 816-5186
Cowen and Company JP Morgan Securities UBS James Sullivan (646) 562-1380 Anthony Paolone (212) 622-6682 Ross Nussbaum (212) 713-2484 Michael Gorman (646) 562-1381 Joseph Dazio (212) 622-6416 Gabriel Hilmoe (212) 713-3876
Jeremy Woods (212) 713-1102
Credit Suisse Keefe, Bruyette & Woods Andrew Rosivach (415) 249-7942 Sheila McGrath (212) 887-7793
Kristin Brown (212) 887-7738
Rating Agencies Moody’s Investors Service Standard & Poor’s Philip Kibel (212) 553-4569 Lisa Sarajian (212) 438-2597 Maria Maslovsky (212) 553-4831 George Skoufis (212) 438-2608
Alexandria Real Estate Equities, Inc. is currently covered by the research analysts listed above. This list may not be complete and is subject to change as firms initiate or discontinue coverage of our company. Please note that any opinions, estimates, or forecasts regarding our historical or predicted performance made by these analysts are theirs alone and do not represent opinions, forecasts, or predictions of Alexandria Real Estate Equities, Inc. or its management. Alexandria Real Estate Equities, Inc. does not by its reference above or distribution imply its endorsement of or concurrence with such information, conclusions, or recommendations. Interested persons may obtain copies of analysts’ reports on their own as we do not distribute these reports. Several of these firms may from time-to-time own our stock and/or hold other long or short positions in our stock, and may provide compensated services to us.

5 ALEXANDRIA REAL ESTATE EQUITIES, INC. ALL RIGHTS RESERVED © 2012
ALEXANDRIA REAL ESTATE EQUITIES, INC.
RESULTS
5 ALEXANDRIA REAL ESTATE EQUITIES, INC. ALL RIGHTS RESERVED © 2012
ALEXANDRIA REAL ESTATE EQUITIES, INC. Fourth Quarter and Year Ended December 31, 2011, Financial and Operating Results
(Tabular dollar amounts in thousands, except per share amounts) RESULTS Funds from operations
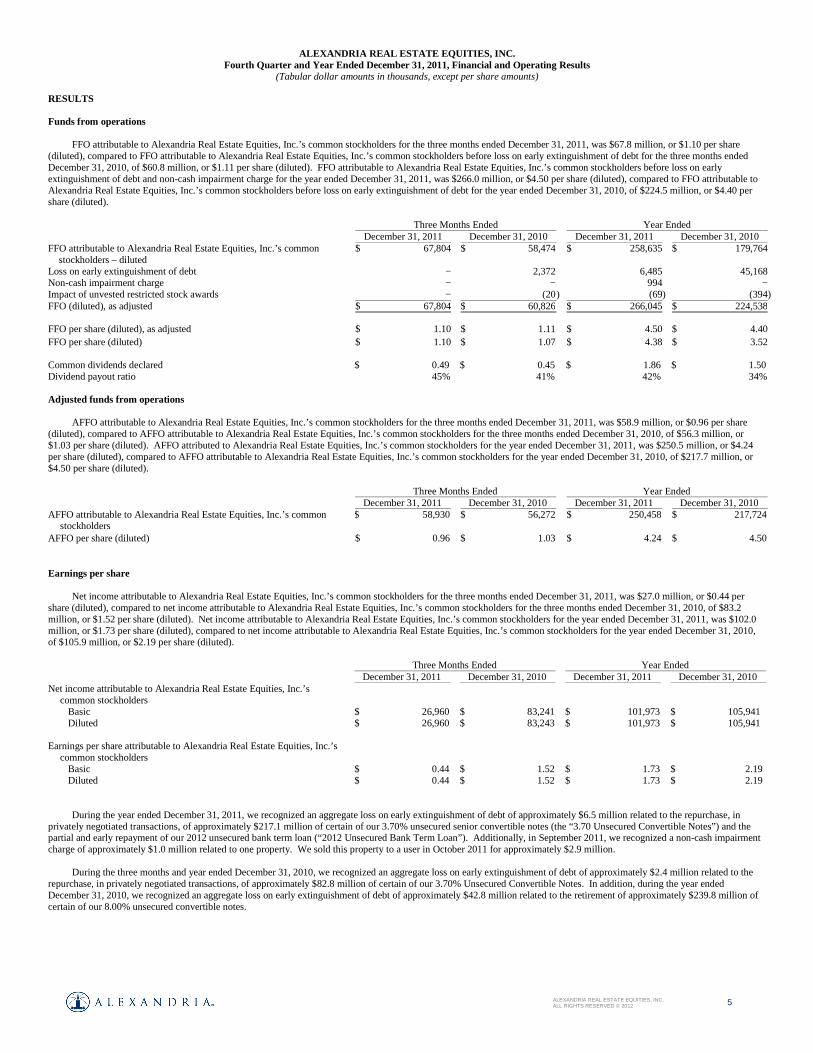
FFO attributable to Alexandria Real Estate Equities, Inc.’s common stockholders for the three months ended December 31, 2011, was $67.8 million, or $1.10 per share (diluted), compared to FFO attributable to Alexandria Real Estate Equities, Inc.’s common stockholders before loss on early extinguishment of debt for the three months ended December 31, 2010, of $60.8 million, or $1.11 per share (diluted). FFO attributable to Alexandria Real Estate Equities, Inc.’s common stockholders before loss on early extinguishment of debt and non-cash impairment charge for the year ended December 31, 2011, was $266.0 million, or $4.50 per share (diluted), compared to FFO attributable to Alexandria Real Estate Equities, Inc.’s common stockholders before loss on early extinguishment of debt for the year ended December 31, 2010, of $224.5 million, or $4.40 per share (diluted).
Three Months Ended Year Ended
December 31, 2011 December 31, 2010 December 31, 2011 December 31, 2010 FFO attributable to Alexandria Real Estate Equities, Inc.’s common
stockholders – diluted $ 67,804 $ 58,474 $ 258,635 $ 179,764
Loss on early extinguishment of debt − 2,372 6,485 45,168 Non-cash impairment charge − − 994 − Impact of unvested restricted stock awards − (20 ) (69) (394) FFO (diluted), as adjusted $ 67,804 $ 60,826 $ 266,045 $ 224,538 FFO per share (diluted), as adjusted $ 1.10 $ 1.11 $ 4.50 $ 4.40 FFO per share (diluted) $ 1.10 $ 1.07 $ 4.38 $ 3.52 Common dividends declared $ 0.49 $ 0.45 $ 1.86 $ 1.50 Dividend payout ratio 45% 41% 42% 34% Adjusted funds from operations
AFFO attributable to Alexandria Real Estate Equities, Inc.’s common stockholders for the three months ended December 31, 2011, was $58.9 million, or $0.96 per share (diluted), compared to AFFO attributable to Alexandria Real Estate Equities, Inc.’s common stockholders for the three months ended December 31, 2010, of $56.3 million, or $1.03 per share (diluted). AFFO attributed to Alexandria Real Estate Equities, Inc.’s common stockholders for the year ended December 31, 2011, was $250.5 million, or $4.24 per share (diluted), compared to AFFO attributable to Alexandria Real Estate Equities, Inc.’s common stockholders for the year ended December 31, 2010, of $217.7 million, or $4.50 per share (diluted).
Three Months Ended Year Ended December 31, 2011 December 31, 2010 December 31, 2011 December 31, 2010 AFFO attributable to Alexandria Real Estate Equities, Inc.’s common
stockholders $ 58,930 $ 56,272 $ 250,458 $ 217,724
AFFO per share (diluted) $ 0.96 $ 1.03 $ 4.24 $ 4.50 Earnings per share
Net income attributable to Alexandria Real Estate Equities, Inc.’s common stockholders for the three months ended December 31, 2011, was $27.0 million, or $0.44 per share (diluted), compared to net income attributable to Alexandria Real Estate Equities, Inc.’s common stockholders for the three months ended December 31, 2010, of $83.2 million, or $1.52 per share (diluted). Net income attributable to Alexandria Real Estate Equities, Inc.’s common stockholders for the year ended December 31, 2011, was $102.0 million, or $1.73 per share (diluted), compared to net income attributable to Alexandria Real Estate Equities, Inc.’s common stockholders for the year ended December 31, 2010, of $105.9 million, or $2.19 per share (diluted).
Three Months Ended Year Ended December 31, 2011 December 31, 2010 December 31, 2011 December 31, 2010
Net income attributable to Alexandria Real Estate Equities, Inc.’s common stockholders
Basic $ 26,960 $ 83,241 $ 101,973 $ 105,941 Diluted $ 26,960 $ 83,243 $ 101,973 $ 105,941 Earnings per share attributable to Alexandria Real Estate Equities, Inc.’s
common stockholders
Basic $ 0.44 $ 1.52 $ 1.73 $ 2.19 Diluted $ 0.44 $ 1.52 $ 1.73 $ 2.19
During the year ended December 31, 2011, we recognized an aggregate loss on early extinguishment of debt of approximately $6.5 million related to the repurchase, in
privately negotiated transactions, of approximately $217.1 million of certain of our 3.70% unsecured senior convertible notes (the “3.70 Unsecured Convertible Notes”) and the partial and early repayment of our 2012 unsecured bank term loan (“2012 Unsecured Bank Term Loan”). Additionally, in September 2011, we recognized a non-cash impairment charge of approximately $1.0 million related to one property. We sold this property to a user in October 2011 for approximately $2.9 million.
During the three months and year ended December 31, 2010, we recognized an aggregate loss on early extinguishment of debt of approximately $2.4 million related to the repurchase, in privately negotiated transactions, of approximately $82.8 million of certain of our 3.70% Unsecured Convertible Notes. In addition, during the year ended December 31, 2010, we recognized an aggregate loss on early extinguishment of debt of approximately $42.8 million related to the retirement of approximately $239.8 million of certain of our 8.00% unsecured convertible notes.

6 ALEXANDRIA REAL ESTATE EQUITIES, INC. ALL RIGHTS RESERVED © 2012
ALEXANDRIA REAL ESTATE EQUITIES, INC. Fourth Quarter and Year Ended December 31, 2011, Financial and Operating Results
(Tabular dollar amounts in thousands, except per share amounts) Earnings per share (continued)
The following table highlights certain items noted above impacting comparability of results:
Three Months Ended Year Ended December 31, 2011 December 31, 2010 December 31, 2011 December 31, 2010 Income from continuing operations before loss on early extinguishment of debt
$ 35,574 $ 34,922 $ 142,720 $ 123,642
Loss on early extinguishment of debt − (2,372 ) (6,485 ) (45,168 ) Income from continuing operations 35,574 32,550 136,235 78,474 (Loss) income from discontinued operations before non-cash
impairment charge and gain on sales of real estate (112 ) 8 106 1,082
Non-cash impairment charge − − (994 ) − Gain on sales of real estate − − − 24 (Loss) income from discontinued operations, net (112 ) 8 (888 ) 1,106 Gain on sales of land parcels − 59,442 46 59,442 Net income $ 35,462 $ 92,000 $ 135,393 $ 139,022 BALANCE SHEET Investment grade ratings and credit metrics
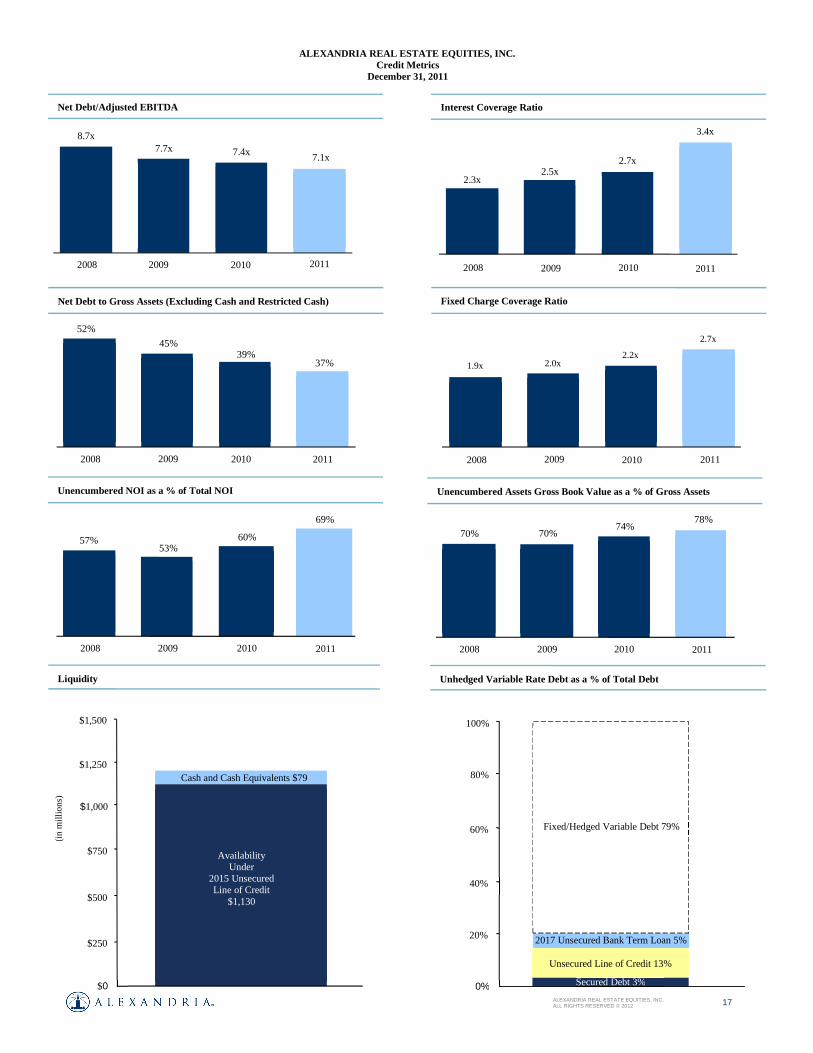
In July 2011, we received investment grade ratings from two major rating agencies. Receipt of our investment grade ratings was a significant milestone for the Company that we believe will provide long-term value to our stockholders. Key strengths of our balance sheet and business which highlight our investment grade credit profile include, among others, balance sheet liquidity, diverse and credit worthy tenant base, well located properties proximate to leading research institutions, favorable lease terms, stable occupancy and cash flows, and demonstrated life science and real estate expertise. This significant milestone broadens our access to another key source of debt capital and allows us to continue to pursue our long-term capital, investment, and operating strategies. Issuance of investment grade unsecured notes will allow us to transition from bank debt financing to unsecured notes, from variable rate debt to fixed rate debt, and from short-term debt to long-term debt. Three Months Ended (1) Year Ended Credit Metrics December 31, 2011 December 31, 2010 December 31, 2011 December 31, 2010 Net debt to Adjusted EBITDA 7.1x 6.9x 7.1x 7.4x Net debt to Gross Assets at end of period 37% 39% 37% 39% Fixed charge coverage ratio 2.7x 2.6x 2.7x 2.2x Interest coverage ratio 3.4x 3.2x 3.4x 2.7x Unencumbered net operating income as a percentage of total net operating income
70% 60% 69% 60%
Liquidity – unsecured line of credit availability and unrestricted cash $1.2 billion $0.5 billion $1.2 billion $0.5 billion Non-income producing assets as a percentage of gross real estate 24% 24% 24% 24% (1) Represents annualized three months ended December 31, 2011 and 2010. Unhedged variable rate debt
We expect to transition from short-term and medium-term bank debt to long-term fixed rate debt over the next several years. While this transition of bank debt is in process, we will utilize interest rate swap and/or cap agreements to reduce our interest rate risk. In December 2011, we executed interest rate swap agreements and reduced our unhedged variable rate debt exposure from 51% as of September 30, 2011, to 21% as of December 31, 2011. We expect to keep our unhedged variable rate debt at approximately 20% or less of our total debt. Year Ended December 31, 2011 December 31, 2010
Unhedged variable rate debt as a percentage of total debt 21% 37% Unhedged variable rate debt $ 596,720 $ 948,960 Debt financings
During 2011, we refinanced and extended debt maturities, significantly increasing our liquidity as of December 31, 2011.
December 31, 2011 Amount Weighted Average Date Key Debt Financings Maturity Date Outstanding Interest Rate (2) of Loan 2017 Unsecured Bank Term Loan 1/31/2017 $ 600,000 1.93% December 2011 Refinancing of a secured loan 4/20/2014 76,000 2.29% December 2011 2016 Unsecured Bank Term Loan 6/30/2016 750,000 3.28% June 2011 Unsecured line of credit (1) 1/31/2015 370,000 2.59% January 2011 $ 1,796,000 2.65% (1) Total commitments available for borrowing aggregate $1.5 billion under our unsecured line of credit. As of December 31, 2011, we had $1.1 billion available for borrowing
under our unsecured line of credit. (2) Represents the contractual interest rate as of the end of the period plus the impact of our interest rate hedge agreements.

7 ALEXANDRIA REAL ESTATE EQUITIES, INC. ALL RIGHTS RESERVED © 2012
ALEXANDRIA REAL ESTATE EQUITIES, INC. Fourth Quarter and Year Ended December 31, 2011, Financial and Operating Results
(Tabular dollar amounts in thousands, except per square foot amounts) Debt financings (continued) 2017 unsecured bank term loan
In December 2011, we closed a $600 million unsecured bank term loan (the “2017 Unsecured Bank Term Loan”), which matures in January 2017, assuming we exercise our
sole right to extend the maturity date by one year. The applicable margin for LIBOR borrowings under the 2017 Unsecured Bank Term Loan as of December 31, 2011, was 1.50%. Our 2017 Unsecured Bank Term Loan may be repaid at any date prior to maturity without a prepayment penalty. Net proceeds from the 2017 Unsecured Bank Term Loan were used to reduce outstanding borrowings on our unsecured line of credit. Refinancing of secured loan
In December 2011, we extended the maturity date of a $76 million secured loan to April 2014. As of December 31, 2011, the interest rate for this secured loan was 2.29%.
2016 unsecured bank term loan
In February 2011, we entered into a $250 million unsecured bank term loan. In June 2011, we amended this $250 million unsecured bank term loan (as amended, the “2016 Unsecured Bank Term Loan”) to, among other things, increase the borrowings from $250 million to $750 million and to extend the maturity from January 2015 to June 2016, assuming we exercise our sole right to extend the maturity date by one year. The applicable margin for the LIBOR borrowings under the 2016 Unsecured Bank Term Loan as of December 31, 2011, was 1.65%. The 2016 Unsecured Bank Term Loan may be repaid at any date prior to maturity without a prepayment penalty. The net proceeds from this 2016 Unsecured Bank Term Loan were used to reduce outstanding borrowings on the 2012 Unsecured Bank Term Loan (defined below) from $750 million to $250 million. As a result of this early repayment, in the three months ended June 30, 2011, we recognized a loss on early extinguishment of debt of approximately $1.2 million related to the write-off of unamortized loan fees. Unsecured line of credit
In January 2011, we entered into a third amendment (the “Third Amendment”) to our second amended and restated credit agreement dated October 31, 2006, as further amended on December 1, 2006, and May 2, 2007 (the “Prior Credit Agreement,” and as amended by the Third Amendment, the “Amended Credit Agreement”), with Bank of America, N.A., as administrative agent, and certain lenders. The Third Amendment amended the Prior Credit Agreement to, among other things, increase the maximum permitted borrowings under the unsecured line of credit from $1.15 billion to $1.5 billion, plus a $750 million unsecured bank term loan (the “2012 Unsecured Bank Term Loan” and together with the unsecured line of credit, the “Unsecured Credit Facility”) and provided an accordion option to increase commitments under the Unsecured Credit Facility by up to an additional $300 million. The applicable margin for LIBOR borrowings outstanding under our unsecured line of credit as of December 31, 2011, was 2.30%. The applicable margin for the LIBOR borrowings under the 2012 Unsecured Bank Term Loan was not amended in the Third Amendment and was 0.70% as of December 31, 2011.
Under the Third Amendment, the maturity date for the unsecured line of credit is January 2015, assuming we exercise our sole right under the amendment to extend this maturity date twice by an additional six months after each exercise. The maturity date of the 2012 Unsecured Bank Term Loan is October 2012. The Third Amendment modified certain financial covenants with respect to the Unsecured Credit Facility, including the fixed charge coverage ratio, secured debt ratio, leverage ratio, and minimum book value, and added covenants relating to an unsecured leverage ratio and unsecured debt yield. Debt repayments
During the year ended December 31, 2011, we reduced the outstanding balances of our 3.70% Unsecured Convertible Notes, 2012 Unsecured Bank Term Loan, and various secured loans.
Three Months Ended December 31, 2011 Year Ended December 31, 2011 Loss on Early Loss on Early Debt Extinguishment Debt Extinguishment Repayments of Debt Repayments of Debt
Repurchase of 3.70% Unsecured Convertible Notes $ − $ − $ 217,133 $ 5,237 Repayment of 2012 Unsecured Bank Term Loan (1) − − 500,000 1,248 Secured loan repayments 34,060 − 55,677 − $ 34,060 $ − $ 772,810 $ 6,485 (1) See 2016 Unsecured Bank Term Loan discussion above.
At the beginning of 2011, our strategy was to reduce a portion of our outstanding balance of the 3.70% Unsecured Convertible Notes. We were also focused on the refinancing of certain near term bank debt maturities, prior to engaging in the rating assessment process with certain rating agencies. During the year ended December 31, 2011, we repurchased, in privately negotiated transactions, approximately $217.1 million of certain of our 3.70% Unsecured Convertible Notes for an aggregate cash price of approximately $221.4 million. As a result of these repurchases, we recognized an aggregate loss on early extinguishment of debt of approximately $5.2 million for the year ended December 31, 2011. We did not repurchase any of our 3.70% Unsecured Convertible Notes during the three months ended December 31, 2011. During January 2012, we repurchased approximately $83.8 million in principal amount of our 3.70% Unsecured Convertible Notes at par, pursuant to options exercised by holders thereof under the indenture governing the notes. We do not expect to recognize any gain or loss as a result of this repurchase. As of February 7, 2012, approximately $1.0 million of our 3.70% Unsecured Convertible Notes remained outstanding. Asset sales
During the year ended December 31, 2011, we sold two properties. The net proceeds from these sales were used to reduce outstanding borrowings under our unsecured line of credit.
Date of Sale Sale Price Sale Price Per
Rentable Square Foot Gain on Sale Land parcel in San Diego, California August 2011 $ 17,300 $ 70 $ 46 13-15 DeAngelo Drive, Suburbs of Boston, Massachusetts October 2011 2,900 97 − $ 20,200 $ 72 $ 46

8 ALEXANDRIA REAL ESTATE EQUITIES, INC. ALL RIGHTS RESERVED © 2012
ALEXANDRIA REAL ESTATE EQUITIES, INC. Fourth Quarter and Year Ended December 31, 2011, Financial and Operating Results
(Tabular dollar amounts in thousands, except per share amounts) Asset sales (continued)
In August 2011, we sold a parcel of land located in San Diego, California, for approximately $17.3 million at a gain of $46,000. The buyer is expected to construct a
building with approximately 249,000 rentable square feet, representing a sale price of approximately $70 per rentable square foot.
During the three months ended September 30, 2011, 13-15 DeAngelo Drive, a vacant 30,000 rentable square foot property, located in the suburbs of Boston, Massachusetts, met the criteria for classification as “held for sale.” This property had been occupied by a life science tenant through June 30, 2011. Upon move out, a user of the building presented an offer for the purchase of the building in the three months ended September 30, 2011. As a result, we recognized an impairment charge of approximately $1.0 million in the three months ended September 30, 2011, to adjust the carrying value to the estimated fair value less costs to sell. In October 2011, we sold 13-15 DeAngelo Drive to that user for approximately $2.9 million, representing a sale price of approximately $97 per rentable square foot. Follow-on common stock offering
In May 2011, we completed a follow-on common stock offering to fund the purchase of 409 and 499 Illinois Street and to fund construction activities among other uses. We acquired 409 and 499 Illinois Street, a newly and partially completed world-class 453,256 rentable square foot laboratory/office development project located on a highly desirable waterfront location in Mission Bay, San Francisco, for approximately $293 million. 409 Illinois Street is a 241,659 rentable square foot tower that is 97% leased to a life science company through November 2023. 499 Illinois Street is a vacant 211,597 rentable square foot tower in shell condition for which we plan to complete the development. Date of Offering Net Proceeds Shares Follow-on common stock offering May 2011 $ 451,539 6,250,651 CORE OPERATING METRICS Total revenues, net operating income, and operating margin
Total revenues for the three months ended December 31, 2011, were $145.8 million, as compared to total revenues for the three months ended December 31, 2010, of $131.8
million. Total revenues for the year ended December 31, 2011, were $573.4 million as compared to the total revenues for the year ended December 31, 2010, of $485.7 million. Net operating income for the three months ended December 31, 2011, was $101.8 million, compared to net operating income for the three months ended December 31, 2010, of $95.1 million. Net operating income for the year ended December 31, 2011, was $404.8 million, compared to net operating income for the year ended December 31, 2010 of $353.6 million. Our operating margin for the three months ended December 31, 2011, was 70%, compared to operating margin for the three months ended December 31, 2010, of 72%. Our operating margin for the year ended December 31, 2011, was 71%, compared to operating margin for the year ended December 31, 2010, of 73%.
Net operating income is projected to increase significantly quarter to quarter from the three months ended December 31, 2011, to the three months ended December 31, 2012, primarily related to the completion and delivery of current and future redevelopment and development projects, a significant amount of which is pre-leased. Additionally, the increase in net operating income is also due to recent and anticipated leasing activity, and lease-up of vacant space. See additional information related to projected net operating income for the three months ended December 31, 2012, in the guidance section of this report. As we complete and deliver projects currently under construction, certain project costs, including interest, property taxes, and other project costs, will no longer qualify for capitalization and will be expensed as incurred.
Three Months Ended Year Ended December 31, 2011 December 31, 2010 December 31, 2011 December 31, 2010 Rental revenues $ 109,042 $ 99,531 $ 431,359 $ 367,184 Tenant recoveries 35,153 30,614 136,322 113,351 Other income 1,584 1,633 5,762 5,213 Total revenues 145,779 131,778 573,443 485,748 Rental operations 43,959 36,688 168,627 132,181 Net operating income $ 101,820 $ 95,090 $ 404,816 $ 353,567 Operating margin 70% 72% 71% 73% Leasing activity
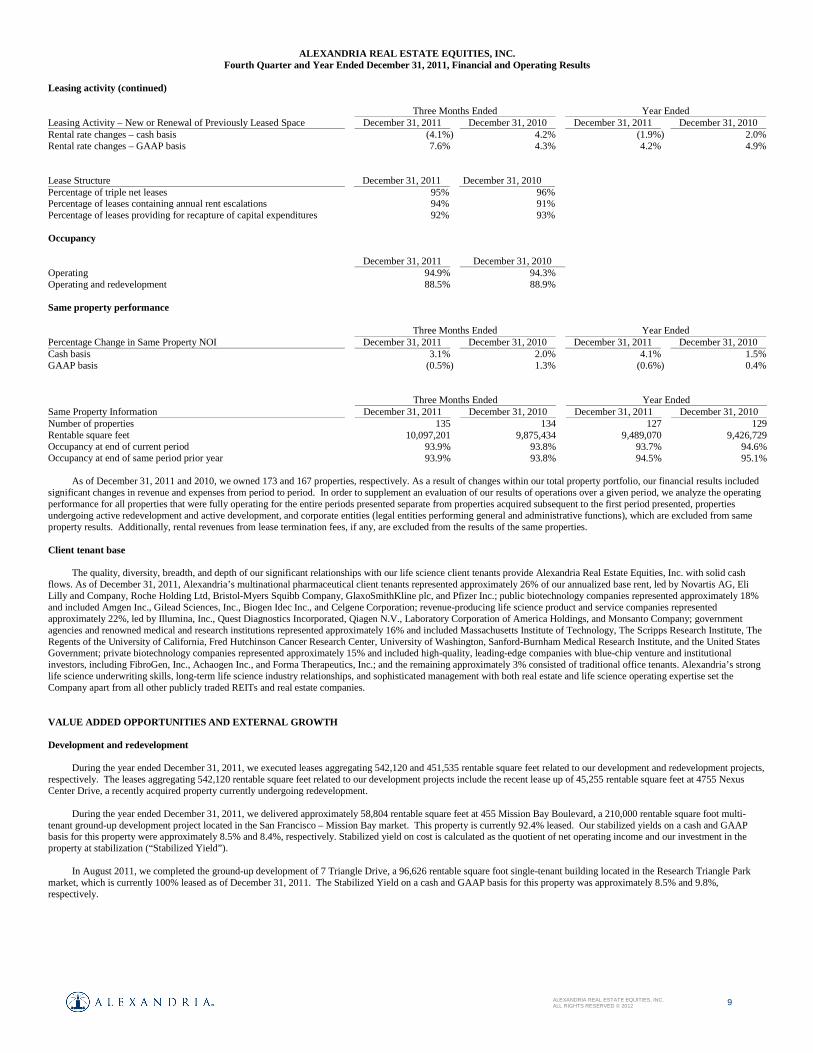
For the three months ended December 31, 2011, we executed a total of 58 leases for approximately 1,142,000 rentable square feet at 38 different properties (excluding month-to-month leases), representing the highest level of leasing activity in a single quarter in the history of the Company. Of this total, approximately 650,000 rentable square feet related to new or renewal leases of previously leased space (renewed/re-leased space) and approximately 492,000 rentable square feet related to developed, redeveloped, or previously vacant space. Of the 492,000 rentable square feet, approximately 356,000 rentable square feet were related to our development or redevelopment programs, with the remaining approximately 136,000 rentable square feet related to previously vacant space. Rental rates for these new or renewal leases (renewed/re-leased space) were on average approximately 4.1% lower on a cash basis and approximately 7.6% higher on a GAAP basis than rental rates for the respective expiring leases.
For the year ended December 31, 2011, we executed a total of 190 leases for approximately 3,407,000 rentable square feet at 87 different properties (excluding month-to-month leases), representing the highest level of leasing activity in a single year in the history of the Company. Of this total, approximately 1,822,000 rentable square feet related to new or renewal leases of previously leased space (renewed/re-leased space) and approximately 1,585,000 rentable square feet related to developed, redeveloped, or previously vacant space. Of the 1,585,000 rentable square feet, approximately 993,000 rentable square feet were related to our development or redevelopment programs, and the remaining approximately 592,000 rentable square feet were related to previously vacant space. Rental rates for these new or renewal leases (renewed/re-leased space) were on average approximately 1.9% lower on a cash basis and approximately 4.2% higher on a GAAP basis than rental rates for the respective expiring leases. Three Months Ended Year Ended Leasing Activity December 31, 2011 December 31, 2010 December 31, 2011 December 31, 2010 New or renewal of previously leased space 650,163 758,344 1,821,866 1,777,966 Development/redevelopment space leased 355,641 274,696 993,655 711,622 Previously vacant space leased 136,251 41,195 591,955 254,651 Total leasing activity 1,142,055 1,074,235 3,407,476 2,744,239
9 ALEXANDRIA REAL ESTATE EQUITIES, INC. ALL RIGHTS RESERVED © 2012
ALEXANDRIA REAL ESTATE EQUITIES, INC. Fourth Quarter and Year Ended December 31, 2011, Financial and Operating Results
Leasing activity (continued) Three Months Ended Year Ended Leasing Activity – New or Renewal of Previously Leased Space December 31, 2011 December 31, 2010 December 31, 2011 December 31, 2010 Rental rate changes – cash basis (4.1%) 4.2% (1.9%) 2.0% Rental rate changes – GAAP basis 7.6% 4.3% 4.2% 4.9% Lease Structure December 31, 2011 December 31, 2010 Percentage of triple net leases 95% 96% Percentage of leases containing annual rent escalations 94% 91% Percentage of leases providing for recapture of capital expenditures 92% 93% Occupancy December 31, 2011 December 31, 2010 Operating 94.9% 94.3% Operating and redevelopment 88.5% 88.9% Same property performance Three Months Ended Year Ended Percentage Change in Same Property NOI December 31, 2011 December 31, 2010 December 31, 2011 December 31, 2010 Cash basis 3.1% 2.0% 4.1% 1.5% GAAP basis (0.5%) 1.3% (0.6%) 0.4% Three Months Ended Year Ended Same Property Information December 31, 2011 December 31, 2010 December 31, 2011 December 31, 2010 Number of properties 135 134 127 129Rentable square feet 10,097,201 9,875,434 9,489,070 9,426,729Occupancy at end of current period 93.9% 93.8% 93.7% 94.6% Occupancy at end of same period prior year 93.9% 93.8% 94.5% 95.1%
As of December 31, 2011 and 2010, we owned 173 and 167 properties, respectively. As a result of changes within our total property portfolio, our financial results included significant changes in revenue and expenses from period to period. In order to supplement an evaluation of our results of operations over a given period, we analyze the operating performance for all properties that were fully operating for the entire periods presented separate from properties acquired subsequent to the first period presented, properties undergoing active redevelopment and active development, and corporate entities (legal entities performing general and administrative functions), which are excluded from same property results. Additionally, rental revenues from lease termination fees, if any, are excluded from the results of the same properties. Client tenant base
The quality, diversity, breadth, and depth of our significant relationships with our life science client tenants provide Alexandria Real Estate Equities, Inc. with solid cash flows. As of December 31, 2011, Alexandria’s multinational pharmaceutical client tenants represented approximately 26% of our annualized base rent, led by Novartis AG, Eli Lilly and Company, Roche Holding Ltd, Bristol-Myers Squibb Company, GlaxoSmithKline plc, and Pfizer Inc.; public biotechnology companies represented approximately 18% and included Amgen Inc., Gilead Sciences, Inc., Biogen Idec Inc., and Celgene Corporation; revenue-producing life science product and service companies represented approximately 22%, led by Illumina, Inc., Quest Diagnostics Incorporated, Qiagen N.V., Laboratory Corporation of America Holdings, and Monsanto Company; government agencies and renowned medical and research institutions represented approximately 16% and included Massachusetts Institute of Technology, The Scripps Research Institute, The Regents of the University of California, Fred Hutchinson Cancer Research Center, University of Washington, Sanford-Burnham Medical Research Institute, and the United States Government; private biotechnology companies represented approximately 15% and included high-quality, leading-edge companies with blue-chip venture and institutional investors, including FibroGen, Inc., Achaogen Inc., and Forma Therapeutics, Inc.; and the remaining approximately 3% consisted of traditional office tenants. Alexandria’s strong life science underwriting skills, long-term life science industry relationships, and sophisticated management with both real estate and life science operating expertise set the Company apart from all other publicly traded REITs and real estate companies. VALUE ADDED OPPORTUNITIES AND EXTERNAL GROWTH Development and redevelopment
During the year ended December 31, 2011, we executed leases aggregating 542,120 and 451,535 rentable square feet related to our development and redevelopment projects,
respectively. The leases aggregating 542,120 rentable square feet related to our development projects include the recent lease up of 45,255 rentable square feet at 4755 Nexus Center Drive, a recently acquired property currently undergoing redevelopment.
During the year ended December 31, 2011, we delivered approximately 58,804 rentable square feet at 455 Mission Bay Boulevard, a 210,000 rentable square foot multi-tenant ground-up development project located in the San Francisco – Mission Bay market. This property is currently 92.4% leased. Our stabilized yields on a cash and GAAP basis for this property were approximately 8.5% and 8.4%, respectively. Stabilized yield on cost is calculated as the quotient of net operating income and our investment in the property at stabilization (“Stabilized Yield”).
In August 2011, we completed the ground-up development of 7 Triangle Drive, a 96,626 rentable square foot single-tenant building located in the Research Triangle Park
market, which is currently 100% leased as of December 31, 2011. The Stabilized Yield on a cash and GAAP basis for this property was approximately 8.5% and 9.8%, respectively.

10 ALEXANDRIA REAL ESTATE EQUITIES, INC. ALL RIGHTS RESERVED © 2012
ALEXANDRIA REAL ESTATE EQUITIES, INC. Fourth Quarter and Year Ended December 31, 2011, Financial and Operating Results
(Tabular dollar amounts in thousands) Development and redevelopment (continued)
In October 2011, we commenced the ground up development of a 303,143 rentable square feet single tenant building for Biogen Idec, Inc. at Alexandria CenterTM at Kendall
Square. We expect to achieve a Stabilized Yield on a cash and GAAP basis for this property of 7.5% and 8.1%, respectively.
Key development and redevelopment projects completed in 2011 are as follows: Completion RSF Delivered Total Development/ Occupancy Investment Stabilized Yield (1) Key Development Projects Completed in 2011 Date In 2011 Redevelopment RSF (1) as of 12/31/11 (2) at Completion (1) Cash GAAP 455 Mission Bay Boulevard 12/2011 58,804 210,000 92.4% $ 109,950 8.5% 8.4% 7 Triangle Drive 8/2011 96,626 96,626 100% $ 32,511 8.5% 9.8% 400/450 East Jamie Court 9/2011 62,548 163,307 100% $ 108,490 4.2% 4.3% Key Redevelopment Projects Completed in 2011 10300 Campus Point Drive 11/2011 89,576 279,138 100% $ 131,600 7.6% 7.7% 500 Arsenal Street 9/2011 48,516 48,516 100% $ 24,348 6.9% 7.4% (1) Represents rentable square feet, investment at completion, and Stabilized Yield of the entire development or redevelopment project. Portions of certain projects may still be
under construction. (2) Represents occupancy related operating rentable square feet. Acquisitions
In June 2011, we acquired 285 Bear Hill Road, a 26,270 rentable square foot office property located in the Greater Boston market, for approximately $3.9 million. We commenced the redevelopment of this property into life science laboratory space during the three months ended December 31, 2011. Based on our view of existing market conditions and certain assumptions, we expect to achieve a Stabilized Yield on a cash and GAAP basis for this property of approximately 8.0% and 8.6%, respectively.
In April 2011, we acquired 409 and 499 Illinois Street, a newly and partially completed world-class 453,256 rentable square foot life science laboratory development project
located on a highly desirable waterfront location in Mission Bay, San Francisco, for approximately $293 million. 409 Illinois Street is a 241,659 rentable square foot tower that is 97% leased to a life science company through November 2023. 499 Illinois Street is a vacant 211,597 rentable square foot tower in shell condition for which we plan to complete the development. Based on our view of existing market conditions and certain assumptions at the time of the acquisition, we expect to achieve a Stabilized Yield on a cash and GAAP basis for this property in the range of 6.5% to 7.0% and 7.2% to 7.6%, respectively.
During the three months ended March 31, 2011, we acquired 4755 Nexus Center Drive, a newly and partially completed 45,255 rentable square foot development project located in University Town Center, San Diego for approximately $7.4 million. During the three months ended December 31, 2011, we leased 100% of this building to a biopharmaceutical company. We expect to achieve a Stabilized Yield on a cash and GAAP basis for this property of 7.0% and 7.7%, respectively.
Significant announcements • In October 2011, our Board of Directors elected Stephen A. Richardson as Chief Operating Officer and Regional Market Director − San Francisco. • In April 2011, we were awarded LEED® Platinum certification for 10300 Campus Point Drive, a property located in University Town Center in the San Diego market. • During the three months ended March 31, 2011, we were awarded LEED Gold certifications for four properties, 1) Alexandria Center™ for Life Science – New York City;
2) 199 E. Blaine Street, a property located in the Seattle market; 3) 1500 Owens Street, San Francisco/Mission Bay; and 4) 455 Mission Bay Blvd., San Francisco/Mission Bay.
Earnings call information
We will host a conference call on Wednesday, February 8, 2012, at 3:00 p.m. Eastern Time (“ET”)/12:00 p.m. noon Pacific Time (“PT”) that is open to the general public to discuss our financial and operating results for the three months and year ended December 31, 2011. To participate in this conference call, dial (800) 510-0219 and confirmation code 46221155, shortly before 3:00 p.m. ET/12:00 p.m. noon PT. The audio web cast can be accessed at: www.are.com, in the Corporate Information section. A replay of the call will be available for a limited time from 6:00 p.m. ET/3:00 p.m. PT on Wednesday, February 8, 2012. The replay number is (888) 286-8010 and the confirmation code is 98479916.
Additionally, a copy of Alexandria Real Estate Equities, Inc.’s Supplemental Financial, Operating, & Property Information and this press release for the three months and year ended December 31, 2011, are available in the Corporate Information section of our website at www.are.com.
Acquisition Occupancy Purchase Stabilized Yield Property/Market Date RSF at Acquisition Price Cash GAAP 285 Bear Hill Road, Greater Boston June 2011 26,270 N/A (1) $ 3,900 8.0% 8.6% 409/499 Illinois Street, San Francisco April 2011 453,256 100% (2) $ 293,000 6.5% - 7.0% 7.2% - 7.6% 4755 Nexus Center Drive, San Diego March 2011 45,255 N/A (3) $ 7,400 7.0% 7.7% (1) Currently under redevelopment. (2) Approximately 234,249 rentable square feet is leased, occupied, and in service. The remaining 219,007 rentable square feet is currently under development. (3) Currently under development and 100% leased.

11 ALEXANDRIA REAL ESTATE EQUITIES, INC. ALL RIGHTS RESERVED © 2012
ALEXANDRIA REAL ESTATE EQUITIES, INC.
Condensed Consolidated Statements of Income (Dollars in thousands, except per share amounts)
(Unaudited)
Three Months Ended Year Ended 12/31/11 9/30/11 6/30/11 3/31/11 12/31/10 12/31/11 12/31/10 Net income attributable to Alexandria Real Estate
Equities, Inc.’s common stockholders –basic $ 26,960 $ 24,662 $ 25,986 $ 24,365 $ 83,241 $ 101,973
$ 105,941
Effect of assumed conversion and dilutive securities:
Assumed conversion of 8.00% unsecured convertible notes − − − − 2 − −
Net income attributable to Alexandria Real Estate Equities, Inc.’s common stockholders –diluted $ 26,960 $ 24,662 $ 25,986 $ 24,365 $ 83,243 $ 101,973 $ 105,941
Weighted average shares of common stock outstanding for
calculating earnings per share attributable to Alexandria Real Estate Equities, Inc.’s common stockholders – basic
61,427,495 61,295,659 58,500,055 54,948,345 54,865,654 59,066,812 48,375,474
Effect of assumed conversion and dilutive securities: Assumed conversion of 8.00% unsecured convertible notes
− − − − 6,047 − −
Dilutive effect of stock options 3,939 8,310 13,067 19,410 21,709 10,798 29,566 Weighted average shares of common stock outstanding for
calculating earnings per share attributable to Alexandria Real Estate Equities, Inc.’s common stockholders – diluted 61,431,434 61,303,969 58,513,122 54,967,755 54,893,410 59,077,610 48,405,040
Three Months Ended Year Ended 12/31/11 9/30/11 6/30/11 3/31/11 12/31/10 12/31/11 12/31/10 Revenues
Rental $ 109,042 $ 106,614 $ 109,450 $ 106,253 $ 99,531 $ 431,359 $ 367,184 Tenant recoveries 35,153 35,104 33,175 32,890 30,614 136,322 113,351 Other income 1,584 2,475 926 777 1,633 5,762 5,213
Total revenues 145,779 144,193 143,551 139,920 131,778 573,443 485,748 Expenses
Rental operations 43,959 42,986 40,621 41,061 36,688 168,627 132,181 General and administrative 10,604 10,297 10,765 9,497 8,601 41,163 34,383 Interest 14,757 14,273 16,567 17,810 17,158 63,407 69,509 Depreciation and amortization 40,885 39,848 40,211 36,582 34,409 157,526 126,033
Total expenses 110,205 107,404 108,164 104,950 96,856 430,723 362,106 Income from continuing operations before loss on early
extinguishment of debt 35,574 36,789 35,387 34,970 34,922 142,720 123,642
Loss on early extinguishment of debt − (2,742 ) (1,248 ) (2,495 ) (2,372 ) (6,485 ) (45,168 ) Income from continuing operations 35,574 34,047 34,139 32,475 32,550 136,235 78,474 (Loss) income from discontinued operations, net (112 ) (1,098 ) 172 150 8 (888 ) 1,106 Gain on sales of land parcels − 46 − − 59,442 46 59,442 Net income 35,462 32,995 34,311 32,625 92,000 135,393 139,022 Net income attributable to noncontrolling interests 1,142 966 938 929 944 3,975 3,729 Dividends on preferred stock 7,090 7,089 7,089 7,089 7,089 28,357 28,357 Net income attributable to unvested restricted stock
awards 270 278 298 242 726 1,088 995 Net income attributable to Alexandria Real Estate Equities, Inc.’s common stockholders $ 26,960 $ 24,662 $ 25,986 $ 24,365 $ 83,241 $ 101,973 $ 105,941 Earnings per share attributable to Alexandria Real Estate
Equities, Inc.’s common stockholders – basic Continuing operations $ 0.44 $ 0.42 $ 0.44 $ 0.44 $ 1.52 $ 1.75 $ 2.17 Discontinued operations, net − (0.02 ) − − − (0.02 ) 0.02 Earnings per share – basic $ 0.44 $ 0.40 $ 0.44 $ 0.44 $ 1.52 $ 1.73 $ 2.19
Earnings per share attributable to Alexandria Real Estate
Equities, Inc.’s common stockholders – diluted Continuing operations $ 0.44 $ 0.42 $ 0.44 $ 0.44 $ 1.52 $ 1.75 $ 2.17 Discontinued operations, net − (0.02 ) − − − (0.02 ) 0.02 Earnings per share – diluted $ 0.44 $ 0.40 $ 0.44 $ 0.44 $ 1.52 $ 1.73 $ 2.19

12 ALEXANDRIA REAL ESTATE EQUITIES, INC. ALL RIGHTS RESERVED © 2012
ALEXANDRIA REAL ESTATE EQUITIES, INC.
Condensed Consolidated Balance Sheets (Dollars in thousands)
(Unaudited) December 31, September 30, June 30, March 31, December 31, 2011 2011 2011 2011 2010
Assets Investments in real estate $ 6,750,975 $ 6,635,872 $ 6,534,433 $ 6,145,499 $ 6,060,821 Less: accumulated depreciation (742,535 ) (710,580 ) (679,081 ) (647,034 ) (616,007) Investments in real estate, net 6,008,440 5,925,292 5,855,352 5,498,465 5,444,814 Cash and cash equivalents 78,539 73,056 60,925 78,196 91,232 Restricted cash 23,332 27,929 23,432 30,513 28,354 Tenant receivables 7,480 6,599 4,487 7,018 5,492 Deferred rent receivable 142,097 132,954 125,867 123,091 116,849 Deferred leasing and financing costs, net 135,550 134,366 130,147 111,315 89,046 Investments 95,777 88,777 88,862 88,694 83,899 Other assets 82,914 66,583 54,212 48,051 46,175 Total assets $ 6,574,129 $ 6,455,556 $ 6,343,284 $ 5,983,343 $ 5,905,861
Liabilities, Noncontrolling Interests, and Equity Secured notes payable $ 724,305 $ 760,882 $ 774,691 $ 787,945 $ 790,869 Unsecured line of credit 370,000 814,000 575,000 679,000 748,000 Unsecured bank term loans 1,600,000 1,000,000 1,000,000 1,000,000 750,000 Unsecured convertible notes 84,959 84,484 203,638 202,521 295,293 Accounts payable, accrued expenses, and tenant security deposits 325,393 330,044 300,030 283,013 304,257 Dividends payable 36,579 35,287 34,068 31,172 31,114 Total liabilities 3,141,236 3,024,697 2,887,427 2,983,651 2,919,533 Redeemable noncontrolling interests 16,034 15,931 15,899 15,915 15,920 Alexandria Real Estate Equities, Inc.’s stockholders’ equity:
Series C preferred stock 129,638 129,638 129,638 129,638 129,638 Series D cumulative convertible preferred stock 250,000 250,000 250,000 250,000 250,000 Common stock 616 614 614 551 550 Additional paid-in capital 3,028,558 3,025,444 3,024,603 2,568,976 2,566,238 Retained earnings − − − 360 734 Accumulated other comprehensive loss (34,511 ) (32,202 ) (6,272 ) (7,193 ) (18,335)
Alexandria Real Estate Equities, Inc.’s stockholders’ equity 3,374,301 3,373,494 3,398,583 2,942,332 2,928,825 Noncontrolling interests 42,558 41,434 41,375 41,445 41,583 Total equity 3,416,859 3,414,928 3,439,958 2,983,777 2,970,408 Total liabilities, noncontrolling interests, and equity $ 6,574,129 $ 6,455,556 $ 6,343,284 $ 5,983,343 $ 5,905,861
13 ALEXANDRIA REAL ESTATE EQUITIES, INC. ALL RIGHTS RESERVED © 2012
ALEXANDRIA REAL ESTATE EQUITIES, INC.
Funds from Operations (Dollars in thousands, except per share amounts)
(Unaudited) Funds from operations (“FFO”)
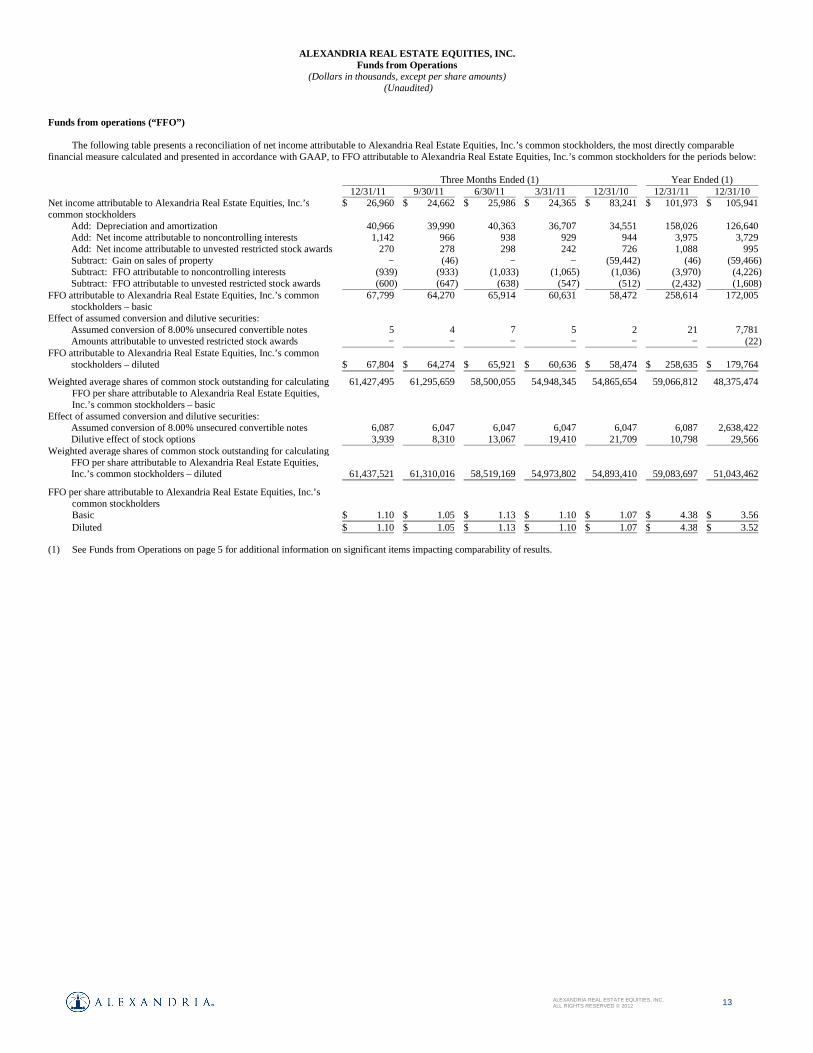
The following table presents a reconciliation of net income attributable to Alexandria Real Estate Equities, Inc.’s common stockholders, the most directly comparable financial measure calculated and presented in accordance with GAAP, to FFO attributable to Alexandria Real Estate Equities, Inc.’s common stockholders for the periods below: Three Months Ended (1) Year Ended (1) 12/31/11 9/30/11 6/30/11 3/31/11 12/31/10 12/31/11 12/31/10 Net income attributable to Alexandria Real Estate Equities, Inc.’s common stockholders
$ 26,960 $ 24,662 $ 25,986 $ 24,365 $ 83,241 $ 101,973
$ 105,941
Add: Depreciation and amortization 40,966 39,990 40,363 36,707 34,551 158,026 126,640 Add: Net income attributable to noncontrolling interests 1,142 966 938 929 944 3,975 3,729 Add: Net income attributable to unvested restricted stock awards 270 278 298 242 726 1,088 995 Subtract: Gain on sales of property − (46 ) − − (59,442) (46) (59,466 ) Subtract: FFO attributable to noncontrolling interests (939) (933 ) (1,033) (1,065 ) (1,036) (3,970) (4,226 ) Subtract: FFO attributable to unvested restricted stock awards (600) (647 ) (638) (547 ) (512) (2,432) (1,608 ) FFO attributable to Alexandria Real Estate Equities, Inc.’s common
stockholders – basic 67,799 64,270 65,914 60,631 58,472 258,614
172,005
Effect of assumed conversion and dilutive securities:
Assumed conversion of 8.00% unsecured convertible notes 5 4 7 5 2 21 7,781 Amounts attributable to unvested restricted stock awards − − − − − − (22 )
FFO attributable to Alexandria Real Estate Equities, Inc.’s common stockholders – diluted $ 67,804 $ 64,274 $ 65,921 $ 60,636 $ 58,474 $ 258,635 $ 179,764
Weighted average shares of common stock outstanding for calculating FFO per share attributable to Alexandria Real Estate Equities, Inc.’s common stockholders – basic
61,427,495 61,295,659 58,500,055 54,948,345 54,865,654 59,066,812
48,375,474
Effect of assumed conversion and dilutive securities:
Assumed conversion of 8.00% unsecured convertible notes 6,087 6,047 6,047 6,047 6,047 6,087 2,638,422 Dilutive effect of stock options 3,939 8,310 13,067 19,410 21,709 10,798 29,566
Weighted average shares of common stock outstanding for calculating FFO per share attributable to Alexandria Real Estate Equities, Inc.’s common stockholders – diluted 61,437,521 61,310,016 58,519,169 54,973,802 54,893,410 59,083,697 51,043,462
FFO per share attributable to Alexandria Real Estate Equities, Inc.’s common stockholders Basic $ 1.10 $ 1.05 $ 1.13 $ 1.10 $ 1.07 $ 4.38 $ 3.56 Diluted $ 1.10 $ 1.05 $ 1.13 $ 1.10 $ 1.07 $ 4.38 $ 3.52 (1) See Funds from Operations on page 5 for additional information on significant items impacting comparability of results.

14 ALEXANDRIA REAL ESTATE EQUITIES, INC. ALL RIGHTS RESERVED © 2012
ALEXANDRIA REAL ESTATE EQUITIES, INC.
Adjusted Funds from Operations (Dollars in thousands, except per share amounts)
(Unaudited) Adjusted funds from operations (“AFFO”)
The following table presents a reconciliation of FFO attributable to Alexandria Real Estate Equities, Inc.’s common stockholders to AFFO attributable to Alexandria Real Estate Equities, Inc.’s common stockholders:
Three Months Ended Year Ended 12/31/11 9/30/11 6/30/11 3/31/11 12/31/10 12/31/11 12/31/10 FFO attributable to Alexandria Real Estate Equities, Inc.’s common
stockholders $ 67,799 $ 64,270 $ 65,914 $ 60,631 $ 58,472 $ 258,614 $ 172,005
Add/(deduct): Major and recurring capital expenditures (1) (675 ) (550 ) (698 ) (608 ) (260 ) (2,531 ) (1,332 ) Tenant improvements and leasing costs (1) (6,083 ) (2,119 ) (1,595 ) (803 ) (2,583 ) (10,600 ) (6,725 ) Amortization of loan fees 2,551 2,144 2,327 2,278 1,999 9,300 7,892 Amortization of debt premiums/discounts 565 750 1,169 1,335 2,032 3,819 9,999 Amortization of acquired above and below market leases (812 ) (940 ) (2,726 ) (4,854 ) (2,364 ) (9,332 ) (7,868 ) Deferred rent/straight-line rent (9,558 ) (7,647 ) (2,885 ) (6,707 ) (9,092 ) (26,797 ) (22,832 ) Stock compensation 3,306 3,344 2,749 2,356 2,767 11,755 10,816 Capitalized income from development projects 537 930 1,078 1,428 1,486 3,973 5,688 Deferred rent/straight-line rent on ground leases 1,221 1,143 1,099 1,241 1,424 4,704 5,337 Loss on early extinguishment of debt − 2,742 1,248 2,495 2,372 6,485 45,168 Impairment of real estate − 994 − − − 994 − Allocation to unvested restricted stock awards 79 (7 ) (14 ) 16 19 74 (424 ) AFFO attributable to Alexandria Real Estate Equities, Inc.’s common
stockholders
$ 58,930 $ 65,054 $ 67,666 $ 58,808 $ 56,272 $ 250,458
$ 217,724
Weighted average shares of common stock outstanding for calculating
AFFO per share attributable to Alexandria Real Estate Equities, Inc.’s common stockholders – basic
61,427,495 61,295,659 58,500,055 54,948,345 54,865,654 59,066,812 48,375,474
Add: Dilutive effect of stock options 3,939 8,310 13,067 19,410 21,709 10,798 29,566 Weighted average shares of common stock outstanding for calculating
AFFO per share attributable to Alexandria Real Estate Equities, Inc.’s common stockholders – diluted
61,431,434 61,303,969 58,513,122 54,967,755 54,887,363 59,077,610 48,405,040
AFFO per share attributable to Alexandria Real Estate Equities, Inc.’s common stockholders Basic $ 0.96 $ 1.06 $ 1.16 $ 1.07 $ 1.03 $ 4.24 $ 4.50 Diluted $ 0.96 $ 1.06 $ 1.16 $ 1.07 $ 1.03 $ 4.24 $ 4.50 (1) See page 34 for further information.
15 ALEXANDRIA REAL ESTATE EQUITIES, INC. ALL RIGHTS RESERVED © 2012
ALEXANDRIA REAL ESTATE EQUITIES, INC.
Financial and Asset Base Highlights (Dollars in thousands, except per share and per square foot amounts)
(Unaudited)
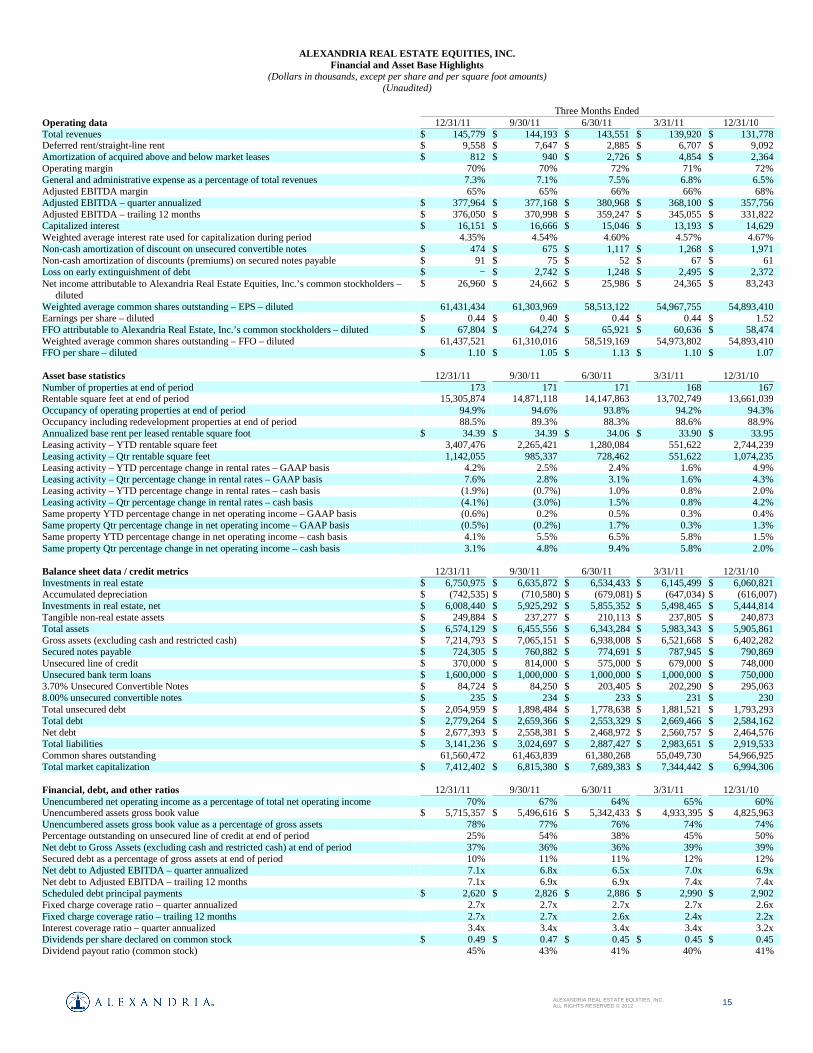
Three Months Ended Operating data 12/31/11 9/30/11 6/30/11 3/31/11 12/31/10 Total revenues $ 145,779 $ 144,193 $ 143,551 $ 139,920 $ 131,778 Deferred rent/straight-line rent $ 9,558 $ 7,647 $ 2,885 $ 6,707 $ 9,092 Amortization of acquired above and below market leases $ 812 $ 940 $ 2,726 $ 4,854 $ 2,364 Operating margin 70% 70% 72% 71% 72% General and administrative expense as a percentage of total revenues 7.3% 7.1% 7.5% 6.8% 6.5% Adjusted EBITDA margin 65% 65% 66% 66% 68% Adjusted EBITDA – quarter annualized $ 377,964 $ 377,168 $ 380,968 $ 368,100 $ 357,756 Adjusted EBITDA – trailing 12 months $ 376,050 $ 370,998 $ 359,247 $ 345,055 $ 331,822 Capitalized interest $ 16,151 $ 16,666 $ 15,046 $ 13,193 $ 14,629 Weighted average interest rate used for capitalization during period 4.35% 4.54% 4.60% 4.57% 4.67% Non-cash amortization of discount on unsecured convertible notes $ 474 $ 675 $ 1,117 $ 1,268 $ 1,971 Non-cash amortization of discounts (premiums) on secured notes payable $ 91 $ 75 $ 52 $ 67 $ 61 Loss on early extinguishment of debt $ − $ 2,742 $ 1,248 $ 2,495 $ 2,372 Net income attributable to Alexandria Real Estate Equities, Inc.’s common stockholders –
diluted $ 26,960 $ 24,662 $ 25,986 $ 24,365 $ 83,243
Weighted average common shares outstanding – EPS – diluted 61,431,434 61,303,969 58,513,122 54,967,755 54,893,410 Earnings per share – diluted $ 0.44 $ 0.40 $ 0.44 $ 0.44 $ 1.52 FFO attributable to Alexandria Real Estate, Inc.’s common stockholders – diluted $ 67,804 $ 64,274 $ 65,921 $ 60,636 $ 58,474 Weighted average common shares outstanding – FFO – diluted 61,437,521 61,310,016 58,519,169 54,973,802 54,893,410 FFO per share – diluted $ 1.10 $ 1.05 $ 1.13 $ 1.10 $ 1.07
Asset base statistics 12/31/11 9/30/11 6/30/11 3/31/11 12/31/10 Number of properties at end of period 173 171 171 168 167 Rentable square feet at end of period 15,305,874 14,871,118 14,147,863 13,702,749 13,661,039 Occupancy of operating properties at end of period 94.9% 94.6% 93.8% 94.2% 94.3% Occupancy including redevelopment properties at end of period 88.5% 89.3% 88.3% 88.6% 88.9% Annualized base rent per leased rentable square foot $ 34.39 $ 34.39 $ 34.06 $ 33.90 $ 33.95 Leasing activity – YTD rentable square feet 3,407,476 2,265,421 1,280,084 551,622 2,744,239 Leasing activity – Qtr rentable square feet 1,142,055 985,337 728,462 551,622 1,074,235 Leasing activity – YTD percentage change in rental rates – GAAP basis 4.2% 2.5% 2.4% 1.6% 4.9% Leasing activity – Qtr percentage change in rental rates – GAAP basis 7.6% 2.8% 3.1% 1.6% 4.3% Leasing activity – YTD percentage change in rental rates – cash basis (1.9% ) (0.7% ) 1.0% 0.8% 2.0% Leasing activity – Qtr percentage change in rental rates – cash basis (4.1% ) (3.0% ) 1.5% 0.8% 4.2% Same property YTD percentage change in net operating income – GAAP basis (0.6% ) 0.2% 0.5% 0.3% 0.4% Same property Qtr percentage change in net operating income – GAAP basis (0.5% ) (0.2% ) 1.7% 0.3% 1.3% Same property YTD percentage change in net operating income – cash basis 4.1% 5.5% 6.5% 5.8% 1.5% Same property Qtr percentage change in net operating income – cash basis 3.1% 4.8% 9.4% 5.8% 2.0%
Balance sheet data / credit metrics 12/31/11 9/30/11 6/30/11 3/31/11 12/31/10 Investments in real estate $ 6,750,975 $ 6,635,872 $ 6,534,433 $ 6,145,499 $ 6,060,821 Accumulated depreciation $ (742,535 ) $ (710,580 ) $ (679,081 ) $ (647,034 ) $ (616,007 ) Investments in real estate, net $ 6,008,440
$ 5,925,292
$ 5,855,352 $ 5,498,465 $ 5,444,814
Tangible non-real estate assets $ 249,884 $ 237,277 $ 210,113 $ 237,805 $ 240,873 Total assets $ 6,574,129 $ 6,455,556 $ 6,343,284 $ 5,983,343 $ 5,905,861 Gross assets (excluding cash and restricted cash) $ 7,214,793 $ 7,065,151 $ 6,938,008 $ 6,521,668 $ 6,402,282 Secured notes payable $ 724,305 $ 760,882 $ 774,691 $ 787,945 $ 790,869 Unsecured line of credit $ 370,000 $ 814,000 $ 575,000 $ 679,000 $ 748,000 Unsecured bank term loans $ 1,600,000 $ 1,000,000 $ 1,000,000 $ 1,000,000 $ 750,000 3.70% Unsecured Convertible Notes $ 84,724 $ 84,250 $ 203,405 $ 202,290 $ 295,063 8.00% unsecured convertible notes $ 235 $ 234 $ 233 $ 231 $ 230 Total unsecured debt $ 2,054,959 $ 1,898,484 $ 1,778,638 $ 1,881,521 $ 1,793,293 Total debt $ 2,779,264 $ 2,659,366 $ 2,553,329 $ 2,669,466 $ 2,584,162 Net debt $ 2,677,393 $ 2,558,381 $ 2,468,972 $ 2,560,757 $ 2,464,576 Total liabilities $ 3,141,236 $ 3,024,697 $ 2,887,427 $ 2,983,651 $ 2,919,533 Common shares outstanding 61,560,472 61,463,839 61,380,268 55,049,730 54,966,925 Total market capitalization $ 7,412,402 $ 6,815,380 $ 7,689,383 $ 7,344,442 $ 6,994,306
Financial, debt, and other ratios 12/31/11 9/30/11 6/30/11 3/31/11 12/31/10 Unencumbered net operating income as a percentage of total net operating income 70% 67% 64% 65% 60% Unencumbered assets gross book value $ 5,715,357 $ 5,496,616 $ 5,342,433 $ 4,933,395 $ 4,825,963 Unencumbered assets gross book value as a percentage of gross assets 78% 77% 76% 74% 74% Percentage outstanding on unsecured line of credit at end of period 25% 54% 38% 45% 50% Net debt to Gross Assets (excluding cash and restricted cash) at end of period 37% 36% 36% 39% 39% Secured debt as a percentage of gross assets at end of period 10% 11% 11% 12% 12% Net debt to Adjusted EBITDA – quarter annualized 7.1x 6.8x 6.5x 7.0x 6.9x Net debt to Adjusted EBITDA – trailing 12 months 7.1x 6.9x 6.9x 7.4x 7.4x Scheduled debt principal payments $ 2,620 $ 2,826 $ 2,886 $ 2,990 $ 2,902 Fixed charge coverage ratio – quarter annualized 2.7x 2.7x 2.7x 2.7x 2.6x Fixed charge coverage ratio – trailing 12 months 2.7x 2.7x 2.6x 2.4x 2.2x Interest coverage ratio – quarter annualized 3.4x 3.4x 3.4x 3.4x 3.2x Dividends per share declared on common stock $ 0.49 $ 0.47 $ 0.45 $ 0.45 $ 0.45 Dividend payout ratio (common stock) 45% 43% 41% 40% 41%

PROPRIETARY MATERIALS
© 2012 Alexandria Real Estate Equities, Inc.
SUPPLEMENTAL FINANCIAL, OPERATING, & PROPERTY INFORMATION
Fourth Quarter and Year Ended
December 31, 2011
Conference Call Information: Wednesday, February 8, 2012
3:00 pm Eastern Time / 12:00 pm Pacific Time Number: (800) 510-0219
Confirmation Code: 46221155
385 EAST COLORADO BOULEVARD, SUITE 299 PASADENA, CALIFORNIA 91101
626.396.4828
ALEXANDRIA CENTER FOR LIFE SCIENCE – NEW YORK CITY
ALEXANDRIA’S TECHNOLOGY SQUARE – CAMBRIDGE
ALEXANDRIA CENTER FOR SCIENCE AND TECHNOLOGY – MISSION BAY
GUIDANCE
16 ALEXANDRIA REAL ESTATE EQUITIES, INC. ALL RIGHTS RESERVED © 2012
ALEXANDRIA REAL ESTATE EQUITIES, INC.
Guidance December 31, 2011
Earnings outlook
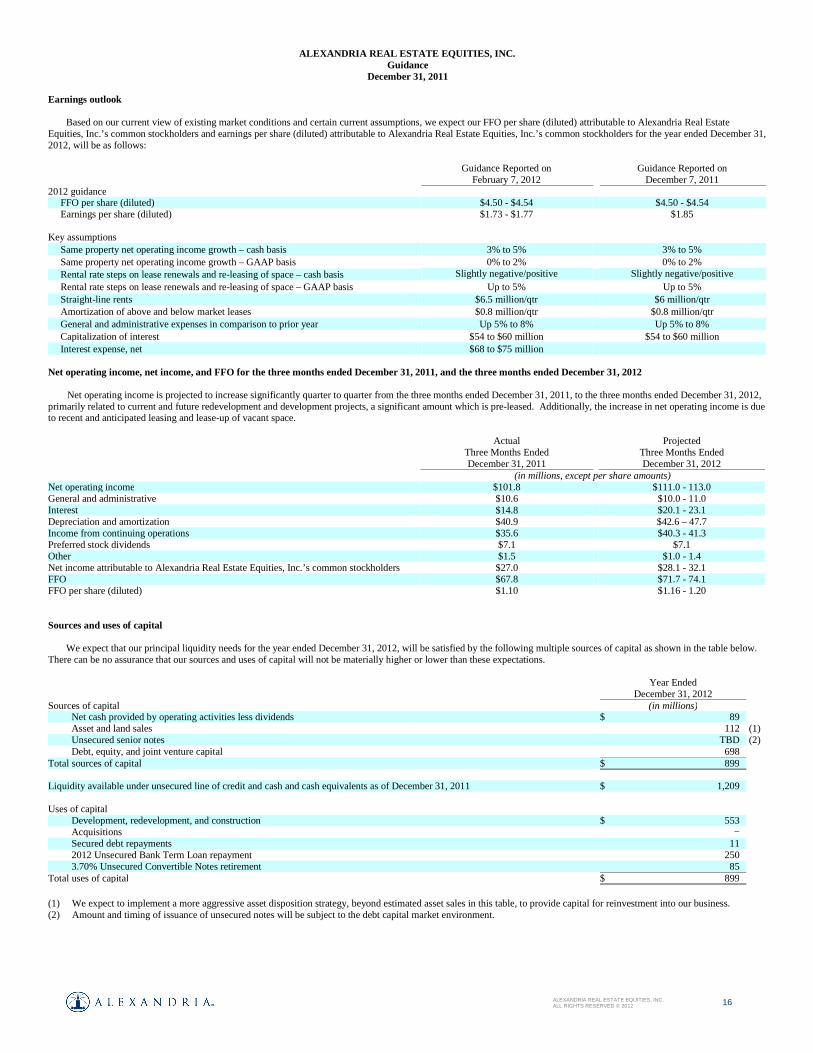
Based on our current view of existing market conditions and certain current assumptions, we expect our FFO per share (diluted) attributable to Alexandria Real Estate Equities, Inc.’s common stockholders and earnings per share (diluted) attributable to Alexandria Real Estate Equities, Inc.’s common stockholders for the year ended December 31, 2012, will be as follows:
Guidance Reported on
February 7, 2012 Guidance Reported on
December 7, 2011 2012 guidance FFO per share (diluted) $4.50 - $4.54 $4.50 - $4.54 Earnings per share (diluted) $1.73 - $1.77 $1.85 Key assumptions Same property net operating income growth – cash basis 3% to 5% 3% to 5% Same property net operating income growth – GAAP basis 0% to 2% 0% to 2% Rental rate steps on lease renewals and re-leasing of space – cash basis Slightly negative/positive
Slightly negative/positive
Rental rate steps on lease renewals and re-leasing of space – GAAP basis Up to 5% Up to 5% Straight-line rents $6.5 million/qtr $6 million/qtr Amortization of above and below market leases $0.8 million/qtr $0.8 million/qtr General and administrative expenses in comparison to prior year Up 5% to 8% Up 5% to 8% Capitalization of interest $54 to $60 million $54 to $60 million Interest expense, net $68 to $75 million
Net operating income, net income, and FFO for the three months ended December 31, 2011, and the three months ended December 31, 2012
Net operating income is projected to increase significantly quarter to quarter from the three months ended December 31, 2011, to the three months ended December 31, 2012, primarily related to current and future redevelopment and development projects, a significant amount which is pre-leased. Additionally, the increase in net operating income is due to recent and anticipated leasing and lease-up of vacant space. Actual Projected
Three Months Ended December 31, 2011
Three Months Ended December 31, 2012
(in millions, except per share amounts) Net operating income $101.8 $111.0 - 113.0 General and administrative $10.6 $10.0 - 11.0 Interest $14.8 $20.1 - 23.1 Depreciation and amortization $40.9 $42.6 – 47.7 Income from continuing operations $35.6 $40.3 - 41.3 Preferred stock dividends $7.1 $7.1 Other $1.5 $1.0 - 1.4 Net income attributable to Alexandria Real Estate Equities, Inc.’s common stockholders $27.0 $28.1 - 32.1 FFO $67.8 $71.7 - 74.1 FFO per share (diluted) $1.10 $1.16 - 1.20 Sources and uses of capital
We expect that our principal liquidity needs for the year ended December 31, 2012, will be satisfied by the following multiple sources of capital as shown in the table below. There can be no assurance that our sources and uses of capital will not be materially higher or lower than these expectations.
Year Ended
December 31, 2012
Sources of capital (in millions) Net cash provided by operating activities less dividends $ 89 Asset and land sales 112 (1) Unsecured senior notes TBD (2) Debt, equity, and joint venture capital 698 Total sources of capital $ 899 Liquidity available under unsecured line of credit and cash and cash equivalents as of December 31, 2011 $ 1,209 Uses of capital Development, redevelopment, and construction $ 553 Acquisitions − Secured debt repayments 11 2012 Unsecured Bank Term Loan repayment 250 3.70% Unsecured Convertible Notes retirement 85 Total uses of capital $ 899 (1) We expect to implement a more aggressive asset disposition strategy, beyond estimated asset sales in this table, to provide capital for reinvestment into our business. (2) Amount and timing of issuance of unsecured notes will be subject to the debt capital market environment. (1)

16 ALEXANDRIA REAL ESTATE EQUITIES, INC. ALL RIGHTS RESERVED © 2012
ALEXANDRIA REAL ESTATE EQUITIES, INC.
BALANCE SHEET
17 ALEXANDRIA REAL ESTATE EQUITIES, INC. ALL RIGHTS RESERVED © 2012
ALEXANDRIA REAL ESTATE EQUITIES, INC.
Credit Metrics December 31, 2011
Net Debt/Adjusted EBITDA
8.7x 7.7x 7.4x 7.1x
2008 2009 2011 2010
Interest Coverage Ratio
2.3x
2.5x 2.7x
3.4x
2008 2009 2010 2011
Fixed Charge Coverage Ratio
1.9x 2.0x 2.2x
2.7x
2008 2009 2010 2011
Unencumbered NOI as a % of Total NOI
57% 53%
60%
69%
2008 2009 2010 2011
Unencumbered Assets Gross Book Value as a % of Gross Assets
70% 70% 74%
78%
2008 2009 2010 2011
Cash and Cash Equivalents $79
Availability Under
2015 Unsecured Line of Credit
$1,130
$1,500
$1,250
$1,000
$750
$500
$250
Liquidity
(in
mill
ions
)
$0
2017 Unsecured Bank Term Loan 5%
80%
60%
40%
20%
Unhedged Variable Rate Debt as a % of Total Debt
0%
100%
Unsecured Line of Credit 13%
Secured Debt 3%
Fixed/Hedged Variable Debt 79%
Net Debt to Gross Assets (Excluding Cash and Restricted Cash)
52%
45% 39%
37%
2008 2009 2010 2011
18 ALEXANDRIA REAL ESTATE EQUITIES, INC. ALL RIGHTS RESERVED © 2012
ALEXANDRIA REAL ESTATE EQUITIES, INC.
Summary of Debt December 31, 2011
(Tabular dollar amounts in thousands) (Unaudited)
Debt maturities Secured Notes Payable Unsecured Debt Noncontrolling
Interests’ Share
Total
Consolidated
Line of Credit and Bank Term Loans
Convertible Notes
Our Share
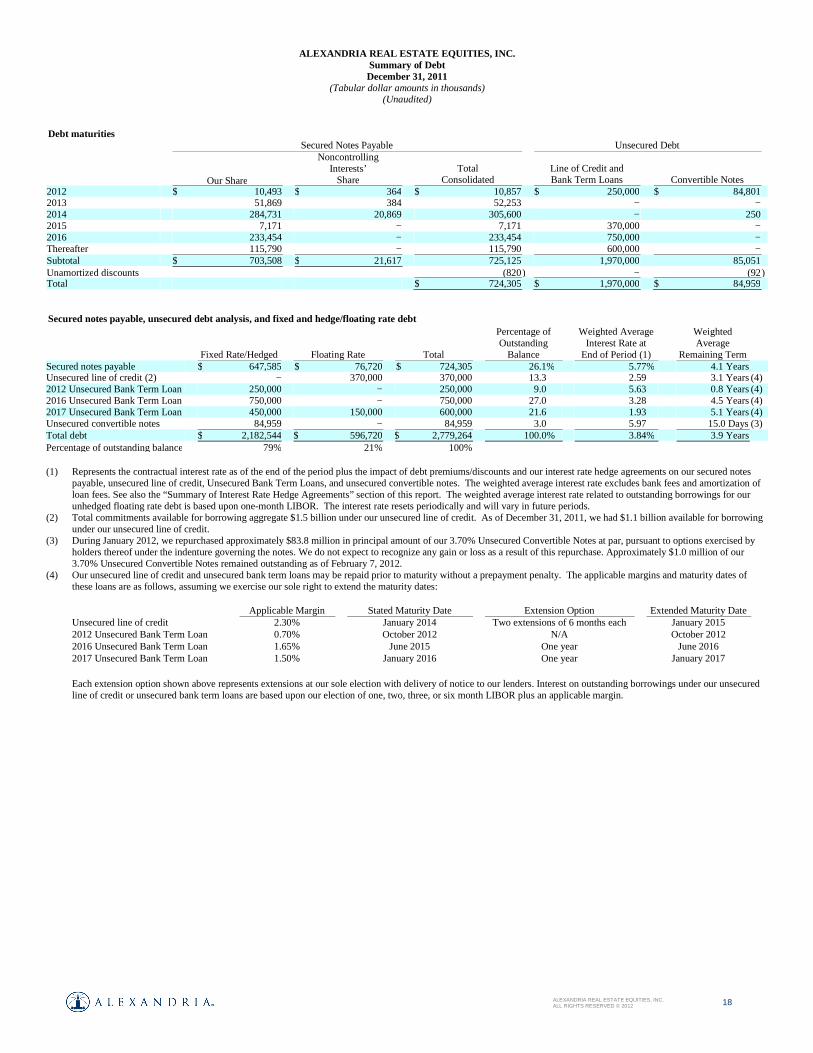
2012 $ 10,493 $ 364 $ 10,857 $ 250,000 $ 84,801 2013 51,869 384 52,253 − − 2014 284,731 20,869 305,600 − 250 2015 7,171 − 7,171 370,000 − 2016 233,454 − 233,454 750,000 − Thereafter 115,790 − 115,790 600,000 − Subtotal $ 703,508 $ 21,617 725,125 1,970,000 85,051 Unamortized discounts (820 ) − (92 ) Total $ 724,305 $ 1,970,000 $ 84,959
Secured notes payable, unsecured debt analysis, and fixed and hedge/floating rate debt
Fixed Rate/Hedged Floating Rate
Total
Percentage of Outstanding
Balance
Weighted Average Interest Rate at
End of Period (1)
Weighted Average
Remaining Term Secured notes payable $ 647,585 $ 76,720 $ 724,305 26.1% 5.77% 4.1 Years Unsecured line of credit (2) − 370,000 370,000 13.3 2.59 3.1 Years (4) 2012 Unsecured Bank Term Loan 250,000 − 250,000 9.0 5.63 0.8 Years (4) 2016 Unsecured Bank Term Loan 750,000 − 750,000 27.0 3.28 4.5 Years (4) 2017 Unsecured Bank Term Loan 450,000 150,000 600,000 21.6 1.93 5.1 Years (4) Unsecured convertible notes 84,959 − 84,959 3.0 5.97 15.0 Days (3) Total debt $ 2,182,544 $ 596,720 $ 2,779,264 100.0% 3.84% 3.9 Years Percentage of outstanding balance 79% 21% 100% (1) Represents the contractual interest rate as of the end of the period plus the impact of debt premiums/discounts and our interest rate hedge agreements on our secured notes
payable, unsecured line of credit, Unsecured Bank Term Loans, and unsecured convertible notes. The weighted average interest rate excludes bank fees and amortization of loan fees. See also the “Summary of Interest Rate Hedge Agreements” section of this report. The weighted average interest rate related to outstanding borrowings for our unhedged floating rate debt is based upon one-month LIBOR. The interest rate resets periodically and will vary in future periods.
(2) Total commitments available for borrowing aggregate $1.5 billion under our unsecured line of credit. As of December 31, 2011, we had $1.1 billion available for borrowing under our unsecured line of credit.
(3) During January 2012, we repurchased approximately $83.8 million in principal amount of our 3.70% Unsecured Convertible Notes at par, pursuant to options exercised by holders thereof under the indenture governing the notes. We do not expect to recognize any gain or loss as a result of this repurchase. Approximately $1.0 million of our 3.70% Unsecured Convertible Notes remained outstanding as of February 7, 2012.
(4) Our unsecured line of credit and unsecured bank term loans may be repaid prior to maturity without a prepayment penalty. The applicable margins and maturity dates of these loans are as follows, assuming we exercise our sole right to extend the maturity dates:
Applicable Margin Stated Maturity Date Extension Option Extended Maturity Date
Unsecured line of credit 2.30% January 2014 Two extensions of 6 months each January 2015 2012 Unsecured Bank Term Loan 0.70% October 2012 N/A October 2012 2016 Unsecured Bank Term Loan 1.65% June 2015 One year June 2016 2017 Unsecured Bank Term Loan 1.50% January 2016 One year January 2017 Each extension option shown above represents extensions at our sole election with delivery of notice to our lenders. Interest on outstanding borrowings under our unsecured line of credit or unsecured bank term loans are based upon our election of one, two, three, or six month LIBOR plus an applicable margin.
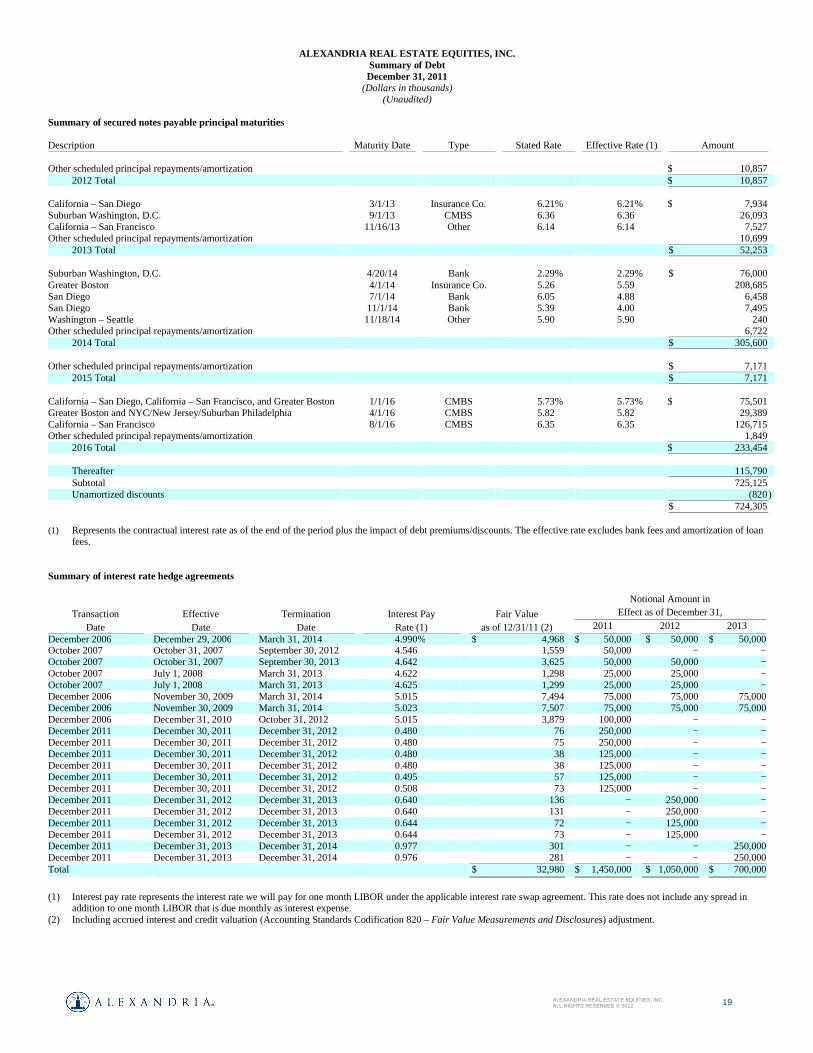
19 ALEXANDRIA REAL ESTATE EQUITIES, INC. ALL RIGHTS RESERVED © 2012
ALEXANDRIA REAL ESTATE EQUITIES, INC.
Summary of Debt December 31, 2011
(Dollars in thousands) (Unaudited)
Summary of secured notes payable principal maturities
Description Maturity Date Type Stated Rate Effective Rate (1) Amount Other scheduled principal repayments/amortization $ 10,857
2012 Total $ 10,857 California – San Diego 3/1/13 Insurance Co. 6.21% 6.21% $ 7,934 Suburban Washington, D.C. 9/1/13 CMBS 6.36 6.36 26,093 California – San Francisco 11/16/13 Other 6.14 6.14 7,527 Other scheduled principal repayments/amortization 10,699
2013 Total $ 52,253
Suburban Washington, D.C. 4/20/14 Bank 2.29% 2.29% $ 76,000 Greater Boston 4/1/14 Insurance Co. 5.26 5.59 208,685 San Diego 7/1/14 Bank 6.05 4.88 6,458 San Diego 11/1/14 Bank 5.39 4.00 7,495 Washington – Seattle 11/18/14 Other 5.90 5.90 240 Other scheduled principal repayments/amortization 6,722
2014 Total $ 305,600 Other scheduled principal repayments/amortization $ 7,171
2015 Total $ 7,171 California – San Diego, California – San Francisco, and Greater Boston 1/1/16 CMBS 5.73% 5.73% $ 75,501 Greater Boston and NYC/New Jersey/Suburban Philadelphia 4/1/16 CMBS 5.82 5.82 29,389 California – San Francisco 8/1/16 CMBS 6.35 6.35 126,715 Other scheduled principal repayments/amortization 1,849
2016 Total $ 233,454
Thereafter 115,790 Subtotal 725,125 Unamortized discounts (820 )
$ 724,305
(1) Represents the contractual interest rate as of the end of the period plus the impact of debt premiums/discounts. The effective rate excludes bank fees and amortization of loan fees.
Summary of interest rate hedge agreements
Notional Amount in
Transaction Effective Termination Interest Pay Fair Value Effect as of December 31,
Date Date Date Rate (1) as of 12/31/11 (2) 2011 2012 2013 December 2006 December 29, 2006 March 31, 2014 4.990% $ 4,968 $ 50,000 $ 50,000 $ 50,000October 2007 October 31, 2007 September 30, 2012 4.546 1,559 50,000 − −October 2007 October 31, 2007 September 30, 2013 4.642 3,625 50,000 50,000 −October 2007 July 1, 2008 March 31, 2013 4.622 1,298 25,000 25,000 −October 2007 July 1, 2008 March 31, 2013 4.625 1,299 25,000 25,000 −December 2006 November 30, 2009 March 31, 2014 5.015 7,494 75,000 75,000 75,000December 2006 November 30, 2009 March 31, 2014 5.023 7,507 75,000 75,000 75,000December 2006 December 31, 2010 October 31, 2012 5.015 3,879 100,000 − −December 2011 December 30, 2011 December 31, 2012 0.480 76 250,000 − −December 2011 December 30, 2011 December 31, 2012 0.480 75 250,000 − −December 2011 December 30, 2011 December 31, 2012 0.480 38 125,000 − −December 2011 December 30, 2011 December 31, 2012 0.480 38 125,000 − −December 2011 December 30, 2011 December 31, 2012 0.495 57 125,000 − −December 2011 December 30, 2011 December 31, 2012 0.508 73 125,000 − −December 2011 December 31, 2012 December 31, 2013 0.640 136 − 250,000 −December 2011 December 31, 2012 December 31, 2013 0.640 131 − 250,000 −December 2011 December 31, 2012 December 31, 2013 0.644 72 − 125,000 −December 2011 December 31, 2012 December 31, 2013 0.644 73 − 125,000 −December 2011 December 31, 2013 December 31, 2014 0.977 301 − − 250,000December 2011 December 31, 2013 December 31, 2014 0.976 281 − − 250,000Total $ 32,980 $ 1,450,000 $ 1,050,000 $ 700,000
(1) Interest pay rate represents the interest rate we will pay for one month LIBOR under the applicable interest rate swap agreement. This rate does not include any spread in
addition to one month LIBOR that is due monthly as interest expense. (2) Including accrued interest and credit valuation (Accounting Standards Codification 820 – Fair Value Measurements and Disclosures) adjustment.
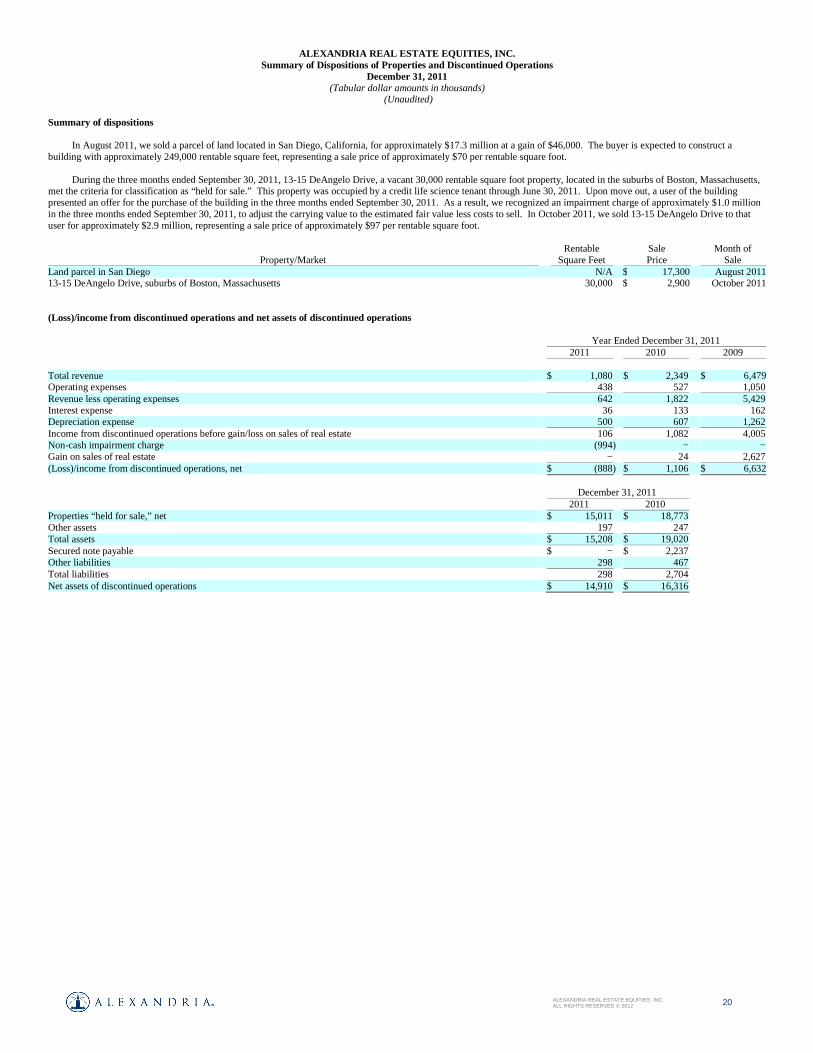
20 ALEXANDRIA REAL ESTATE EQUITIES, INC. ALL RIGHTS RESERVED © 2012
ALEXANDRIA REAL ESTATE EQUITIES, INC.
Summary of Dispositions of Properties and Discontinued Operations December 31, 2011
(Tabular dollar amounts in thousands) (Unaudited)
Summary of dispositions
In August 2011, we sold a parcel of land located in San Diego, California, for approximately $17.3 million at a gain of $46,000. The buyer is expected to construct a building with approximately 249,000 rentable square feet, representing a sale price of approximately $70 per rentable square foot.
During the three months ended September 30, 2011, 13-15 DeAngelo Drive, a vacant 30,000 rentable square foot property, located in the suburbs of Boston, Massachusetts, met the criteria for classification as “held for sale.” This property was occupied by a credit life science tenant through June 30, 2011. Upon move out, a user of the building presented an offer for the purchase of the building in the three months ended September 30, 2011. As a result, we recognized an impairment charge of approximately $1.0 million in the three months ended September 30, 2011, to adjust the carrying value to the estimated fair value less costs to sell. In October 2011, we sold 13-15 DeAngelo Drive to that user for approximately $2.9 million, representing a sale price of approximately $97 per rentable square foot.
Rentable Sale Month of Property/Market Square Feet Price Sale
Land parcel in San Diego N/A $ 17,300 August 201113-15 DeAngelo Drive, suburbs of Boston, Massachusetts 30,000 $ 2,900 October 2011
(Loss)/income from discontinued operations and net assets of discontinued operations
Year Ended December 31, 2011 2011 2010 2009
Total revenue $ 1,080 $ 2,349 $ 6,479Operating expenses 438 527 1,050 Revenue less operating expenses 642 1,822 5,429 Interest expense 36 133 162 Depreciation expense 500 607 1,262 Income from discontinued operations before gain/loss on sales of real estate 106 1,082 4,005 Non-cash impairment charge (994 ) − − Gain on sales of real estate − 24 2,627 (Loss)/income from discontinued operations, net $ (888 ) $ 1,106 $ 6,632 December 31, 2011 2011 2010 Properties “held for sale,” net $ 15,011 $ 18,773 Other assets 197 247 Total assets $ 15,208 $ 19,020 Secured note payable $ − $ 2,237 Other liabilities 298 467 Total liabilities 298 2,704 Net assets of discontinued operations $ 14,910 $ 16,316
20 ALEXANDRIA REAL ESTATE EQUITIES, INC. ALL RIGHTS RESERVED © 2012
ALEXANDRIA REAL ESTATE EQUITIES, INC.
CORE OPERATING METRICS
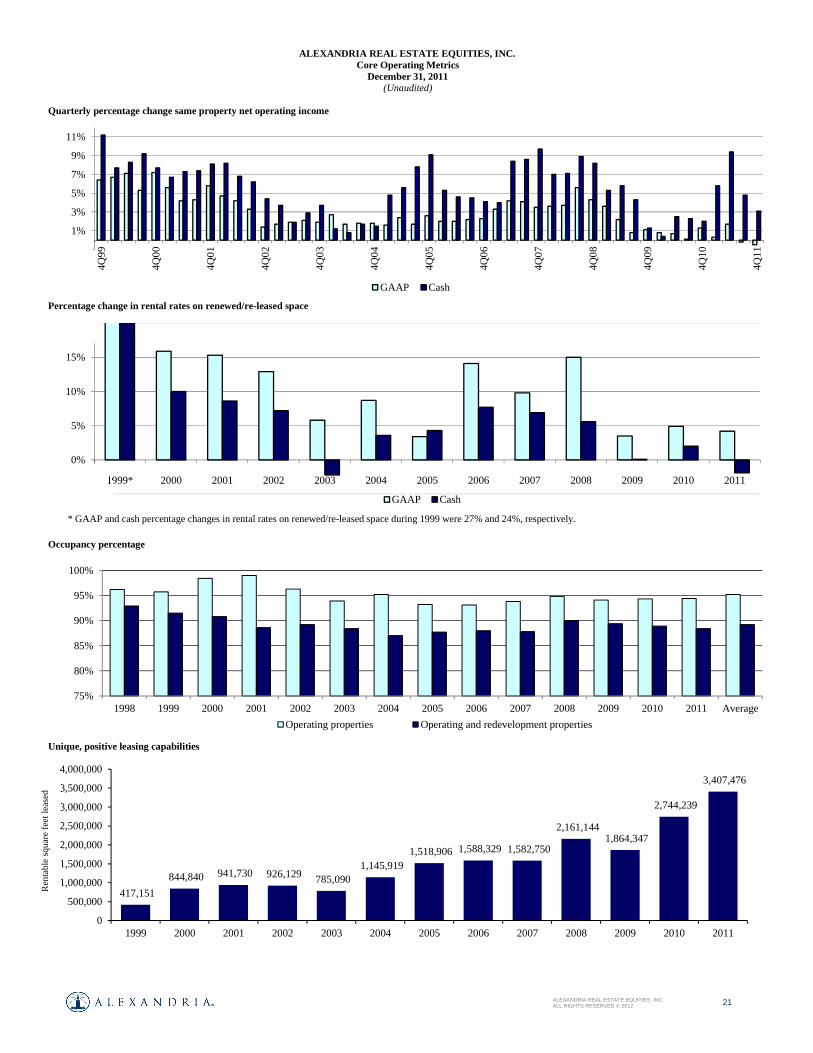
21 ALEXANDRIA REAL ESTATE EQUITIES, INC. ALL RIGHTS RESERVED © 2012
ALEXANDRIA REAL ESTATE EQUITIES, INC.
Core Operating Metrics December 31, 2011
(Unaudited)
Quarterly percentage change same property net operating income
Percentage change in rental rates on renewed/re-leased space
Occupancy percentage
Unique, positive leasing capabilities
-1%
1%
3%
5%
7%
9%
11%
4Q9
9
4Q0
0
4Q0
1
4Q0
2
4Q0
3
4Q0
4
4Q0
5
4Q0
6
4Q0
7
4Q0
8
4Q0
9
4Q1
0
4Q1
1
GAAP Cash
-5%
0%
5%
10%
15%
20%
1999* 2000 2001 2002 2003 2004 2005 2006 2007 2008 2009 2010 2011
GAAP Cash
75%
80%
85%
90%
95%
100%
1998 1999 2000 2001 2002 2003 2004 2005 2006 2007 2008 2009 2010 2011 Average
Operating properties Operating and redevelopment properties
417,151
844,840 941,730 926,129 785,090 1,145,919
1,518,906 1,588,329 1,582,750
2,161,144 1,864,347
2,744,239
3,407,476
0
500,000
1,000,000
1,500,000
2,000,000
2,500,000
3,000,000
3,500,000
4,000,000
1999 2000 2001 2002 2003 2004 2005 2006 2007 2008 2009 2010 2011
Re
nta
ble
squ
are
fe
et
lea
sed
* GAAP and cash percentage changes in rental rates on renewed/re-leased space during 1999 were 27% and 24%, respectively.

22 ALEXANDRIA REAL ESTATE EQUITIES, INC. ALL RIGHTS RESERVED © 2012
ALEXANDRIA REAL ESTATE EQUITIES, INC.
Summary of Same Property Comparisons December 31, 2011
(Dollars in thousands) (Unaudited)
Current period same property performance
The following table presents a comparison of the components of same property and non-same property net operating income for the three months and year ended December
31, 2011, compared to the three months and year ended December 31, 2010, and a reconciliation of net operating income to income from continuing operations, the most directly comparable GAAP financial measure: Three Months Ended December 31, Year Ended December 31, Revenues: 2011 2010 % Change 2011 2010 % Change
Total revenues – Same Properties $ 105,331 $ 103,465 1.8% $ 395,479 $ 390,989 1.1% Total revenues – Non-Same Properties 40,448 28,313 42.9 177,964 94,759 87.8
Total revenues – GAAP basis 145,779 131,778 10.6 573,443 485,748 18.1
Expenses Rental operations – Same Properties 30,680 28,410 8.0 113,748 107,481 5.8
Rental operations – Non-Same Properties 13,279 8,278 60.4 54,879 24,700 122.2 Total rental operations 43,959 36,688 19.8 168,627 132,181 27.6
Net operating income:
Net operating income – Same Properties 74,651 75,055 (0.5) 281,731 283,508 (0.6) Net operating income – Non-Same Properties 27,169 20,035 35.6 123,085 70,059 75.7
Total net operating income – GAAP basis 101,820 95,090 7.1 404,816 353,567 14.5
Other expenses: General and administrative 10,604 8,601 23.3 41,163 34,383 19.7 Interest 14,757 17,158 (14.0) 63,407 69,509 (8.8) Depreciation and amortization 40,885 34,409 18.8 157,526 126,033 25.0 Loss on early extinguishment of debt – 2,372 (100.0) 6,485 45,168 (85.6)
Total other expenses 66,246 62,540 5.9 268,581 275,093 (2.4)
Income from continuing operations $ 35,574 $ 32,550 9.3% $ 136,235 $ 78,474 73.6%
Net operating income – Same Properties – GAAP basis $ 74,651 $ 75,055 (0.5)% $ 281,731 $ 283,508 (0.6)% Straight line rent adjustments (1,594) (4,168) 61.8 1,324 (11,611 ) 111.4 Net operating income – Same Properties – cash basis $ 73,057 $ 70,887 3.1% $ 283,055 $ 271,897 4.1% Same property data
Three Months Ended Year Ended December 31, 2011 December 31, 2010 December 31, 2011 December 31, 2010 Number of properties 135 134 127 129Rentable square feet 10,097,201 9,875,434 9,489,070 9,426,729Occupancy at end of current period 93.9% 93.8% 93.7% 94.6% Occupancy at end of same period prior year 93.9% 93.8% 94.5% 95.1%
The following table reconciles same properties to total properties for the year ended December 31, 2011: Number of
Properties Number of Properties
Number of Properties
Redevelopment – active Redevelopment – deliveries since January 1, 2010 Properties acquired since January 1, 2010 10300 Campus Point Drive 1 15010 Broschart Road 1 14920 Broschart Road 1 11119 North Torrey Pines Road 1 215 First Street 1 285 Bear Hill Road 1 1551 Eastlake Avenue 1 3 Preston Court 1 3985 Sorrento Valley Boulevard 1 20 Walkup Drive 1 3535/3565 General Atomics Court 2 409/499 Illinois Avenue 2 3530/3550 John Hopkins Court 2 5 Research Place 1 5200 Illumina Way 1 400 Technology Square 1 500 Arsenal Street 1 5871 Oberlin Drive 1 6101 Quadrangle Drive 1 555 Heritage Drive 1 7330 Carroll Road 1 620 Professional Drive 1 9393 Towne Center Drive 1 950 Wind River Lane 1 6275 Nancy Ridge Drive 1 9 9 9800 Medical Center Drive 3 13 Development – active Development – deliveries since January 1, 2010 225 Binney Street 1 1500 Owens Street 1 400/450 East Jamie Court 2
199 E. Blaine Street 1 Total properties excluded from same
properties 41
409/499 Illinois Street − (1) 249 E. Grand Ave 1 Properties held for sale 3 4755 Nexus Center Drive 1 450 East 29th Street 1 219 Terry Avenue 1 (2) 5200 Illumina Way − (1) 455 Mission Bay Boulevard 1 Miscellaneous – Toronto 1 Canada − (1) 7 Triangle Drive 1 Same properties 127 4 6 Total properties as of December 31, 2011 173 (1) Property count is included in operating portfolio as of December 31, 2011. (2) Represents a value-added property reclassified from land to operating property during the three months ended December 31, 2011.
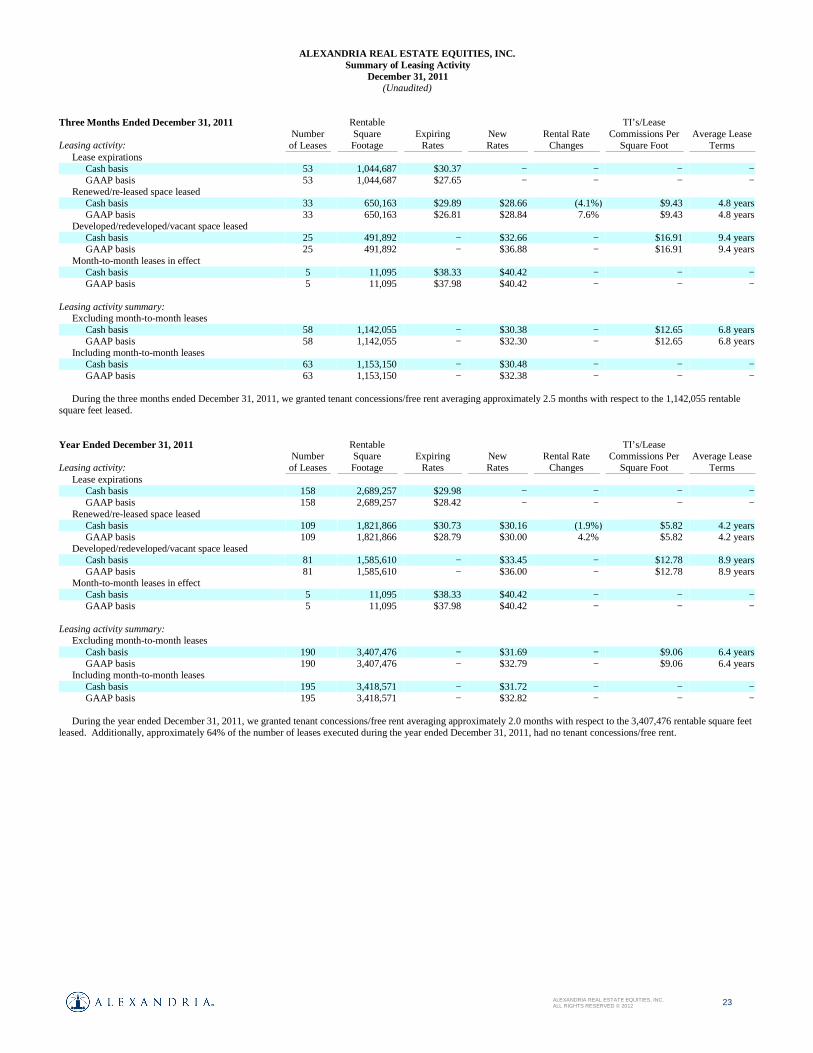
23 ALEXANDRIA REAL ESTATE EQUITIES, INC. ALL RIGHTS RESERVED © 2012
ALEXANDRIA REAL ESTATE EQUITIES, INC.
Summary of Leasing Activity December 31, 2011
(Unaudited)
Three Months Ended December 31, 2011 Rentable TI’s/Lease Number Square Expiring New Rental Rate Commissions Per Average Lease Leasing activity: of Leases Footage Rates Rates Changes Square Foot Terms
Lease expirations Cash basis 53 1,044,687 $30.37 − − − − GAAP basis 53 1,044,687 $27.65 − − − −
Renewed/re-leased space leased Cash basis 33 650,163 $29.89 $28.66 (4.1% ) $9.43 4.8 years GAAP basis 33 650,163 $26.81 $28.84 7.6% $9.43 4.8 years
Developed/redeveloped/vacant space leased Cash basis 25 491,892 − $32.66 − $16.91 9.4 years GAAP basis 25 491,892 − $36.88 − $16.91 9.4 years
Month-to-month leases in effect Cash basis 5 11,095 $38.33 $40.42 − − − GAAP basis 5 11,095 $37.98 $40.42 − − −
Leasing activity summary:
Excluding month-to-month leases Cash basis 58 1,142,055 − $30.38 − $12.65 6.8 years GAAP basis 58 1,142,055 − $32.30 − $12.65 6.8 years
Including month-to-month leases Cash basis 63 1,153,150 − $30.48 − − − GAAP basis 63 1,153,150 − $32.38 − − −
During the three months ended December 31, 2011, we granted tenant concessions/free rent averaging approximately 2.5 months with respect to the 1,142,055 rentable square feet leased.
Year Ended December 31, 2011 Rentable TI’s/Lease Number Square Expiring New Rental Rate Commissions Per Average Lease Leasing activity: of Leases Footage Rates Rates Changes Square Foot Terms
Lease expirations Cash basis 158 2,689,257 $29.98 − − − − GAAP basis 158 2,689,257 $28.42 − − − −
Renewed/re-leased space leased Cash basis 109 1,821,866 $30.73 $30.16 (1.9% ) $5.82 4.2 years GAAP basis 109 1,821,866 $28.79 $30.00 4.2% $5.82 4.2 years
Developed/redeveloped/vacant space leased Cash basis 81 1,585,610 − $33.45 − $12.78 8.9 years GAAP basis 81 1,585,610 − $36.00 − $12.78 8.9 years
Month-to-month leases in effect Cash basis 5 11,095 $38.33 $40.42 − − − GAAP basis 5 11,095 $37.98 $40.42 − − −
Leasing activity summary: Excluding month-to-month leases
Cash basis 190 3,407,476 − $31.69 − $9.06 6.4 years GAAP basis 190 3,407,476 − $32.79 − $9.06 6.4 years
Including month-to-month leases Cash basis 195 3,418,571 − $31.72 − − − GAAP basis 195 3,418,571 − $32.82 − − −
During the year ended December 31, 2011, we granted tenant concessions/free rent averaging approximately 2.0 months with respect to the 3,407,476 rentable square feet leased. Additionally, approximately 64% of the number of leases executed during the year ended December 31, 2011, had no tenant concessions/free rent.

24 ALEXANDRIA REAL ESTATE EQUITIES, INC. ALL RIGHTS RESERVED © 2012
ALEXANDRIA REAL ESTATE EQUITIES, INC.
Summary of Leasing Activity December 31, 2011
(Unaudited)
Year Ended December 31, 2011 December 31, 2010 December 31, 2009 December 31, 2008 December 31, 2007 Cash GAAP Cash GAAP Cash GAAP Cash GAAP Cash GAAP Lease expirations
Rentable square footage 2,689,257 2,689,257 2,416,291 2,416,291 1,842,597 1,842,597 1,664,944 1,664,944 1,626,033 1,626,033 Expiring rates $29.98 $28.42 $27.18 $28.54 $30.61 $30.70 $26.88 $25.52 $25.98 $26.97
Renewed/re-leased space Leased rentable square footage 1,821,866 1,821,866 1,777,966 1,777,966 1,188,184 1,188,184 1,254,285 1,254,285 895,894 895,894 New rates $30.16 $30.00 $29.41 $32.04 $28.11 $27.72 $28.60 $29.34 $31.41 $31.48 Expiring rates $30.73 $28.79 $28.84 $30.54 $28.07 $26.78 $27.08 $25.51 $29.38 $28.66 Rental rate changes (1.9%) 4.2% 2.0% 4.9% 0.1% 3.5% 5.6% 15.0% 6.9% 9.8% Average lease terms 4.2 years 4.2 years 8.1 years 8.1 years 3.3 years 3.3 years 4.3 years 4.3 years 4.0 years 4.0 years
Developed/redeveloped/ vacant space leased
Rentable square footage 1,585,610 1,585,610 966,273 966,273 676,163 676,163 906,859 906,859 686,856 686,856 New rates $33.45 $36.00 $36.33 $39.89 $33.57 $36.00 $35.04 $37.64 $31.59 $33.68 Average lease terms 8.9 years 8.9 years 9.7 years 9.7 years 6.6 years 6.6 years 7.2 years 7.2 years 6.5 years 6.5 years
Totals Rentable square footage 3,407,476 3,407,476 2,744,239 2,744,239 1,864,347 1,864,347 2,161,144 2,161,144 1,582,750 1,582,750 New rates $31.69 $32.79 $31.84 $34.80 $30.09 $30.73 $31.30 $32.82 $31.49 $32.44
TI’s/lease commissions per square foot $9.06 $9.06 $5.70 $5.70 $5.49 $5.49 $7.23 $7.23 $6.95 $6.95 Average lease terms 6.4 years 6.4 years 8.7 years 8.7 years 4.5 years 4.5 years 5.5 years 5.5 years 5.1 years 5.1 years

25 ALEXANDRIA REAL ESTATE EQUITIES, INC. ALL RIGHTS RESERVED © 2012
ALEXANDRIA REAL ESTATE EQUITIES, INC.
Summary of Lease Expirations December 31, 2011
(Unaudited)
Year of Lease Expiration
Number of
Leases Expiring
Rentable Square Footage (“RSF”) of
Expiring Leases
Percentage of Aggregate Total RSF
Annualized Base Rent of Expiring Leases
(per RSF)
2012 89 (1) 1,289,154 (1) 9.5% $27.13 2013 84 1,338,019 9.8 29.27 2014 77 1,305,724 9.6 29.73 2015 57 1,222,622 9.0 32.79 2016 47 1,370,504 10.1 31.21 2017 30 1,069,380 7.9 32.88 2018 21 1,160,033 8.5 36.24 2019 11 499,498 3.7 35.50 2020 15 731,631 5.4 40.39 2021 18 611,863 4.5 38.42
Annualized Base 2012 RSF of Expiring Leases Rent of Negotiating/ Targeted for Remaining Expiring Leases
Markets Leased Anticipating Redevelopment Expiring Leases Total (per RSF) Market Rent (2) California – San Diego 62,047 5,193 76,791 61,253 205,284 $26.22 $27.00 - $39.00 California – San Francisco 35,847 13,980 32,074 119,207 201,108 23.49 $30.00 - $42.00 Greater Boston 70,736 45,217 − 165,418 281,371 40.85 $35.00 - $55.00 NYC − − − − − − $65.00 - $80.00 New Jersey/Suburban Philadelphia − − − 7,239 7,239 13.24 $12.00 - $15.00 North Carolina – Research Triangle Park 8,940 12,196 − 33,252 54,388 13.81 $10.00 - $30.00 Suburban Washington, D.C. 108,604 8,793 − 268,932 386,329 21.17 $18.00 - $28.00 Washington – Seattle 2,468 45,780 65,936 39,251 153,435 28.31 $20.00 - $48.00 International − − − − – – $16.00 - $26.00 Total 288,642 131,159 174,801 694,552 1,289,154 (1) $27.13 Percentage of expiring leases 22% 10% 14% 54% 100%
Annualized Base 2013 RSF of Expiring Leases Rent of Negotiating/ Targeted for Remaining Expiring Leases
Markets Leased Anticipating Redevelopment Expiring Leases Total (per RSF) Market Rent (2) California – San Diego 9,849 8,683 14,030 139,708 172,270 $21.33 $27.00 - $39.00 California – San Francisco − 49,108 − 244,270 293,378 27.15 $30.00 - $42.00 Greater Boston − 102,594 − 374,814 477,408 34.81 $35.00 - $55.00 NYC − − − − − − $65.00 - $80.00 New Jersey/Suburban Philadelphia − − − − − − $12.00 - $15.00 North Carolina – Research Triangle Park − 8,795 − 56,893 65,688 22.31 $10.00 - $30.00 Suburban Washington, D.C. − 118,470 − 188,596 307,066 28.72 $18.00 - $28.00 Washington – Seattle − − − 15,373 15,373 28.18 $20.00 - $48.00 International − − − 6,836 6,836 27.14 $16.00 - $26.00 Total 9,849 287,650 14,030 1,026,490 1,338,019 $29.27 Percentage of expiring leases 1% 21% 1% 77% 100% (1) Excludes five month-to-month leases for approximately 11,000 rentable square feet. (2) Based upon rental rates achieved in recently executed leases.

26 ALEXANDRIA REAL ESTATE EQUITIES, INC. ALL RIGHTS RESERVED © 2012
ALEXANDRIA REAL ESTATE EQUITIES, INC.
Summary of Properties and Summary of Occupancy Percentages December 31, 2011
(Unaudited)
Summary of properties
Summary of occupancy percentages Operating Properties Operating and Redevelopment Properties
Markets December 31, 2011 September 30, 2011 June 30, 2011 December 31, 2011 September 30, 2011 June 30, 2011 California − San Diego 96.4% 94.4% 93.9% 80.3% 77.7% 77.0% California – San Francisco 96.7 95.9 94.5 96.7 95.9 94.5 Greater Boston 93.9 94.2 91.3 85.0 89.3 86.1 NYC/New Jersey/Suburban
Philadelphia 87.9 87.7 88.2 87.9 87.7 88.2
North Carolina – Research
Triangle Park 94.3 95.7 96.6 92.3 92.3 92.7
Suburban Washington, D.C. 96.2 96.0 96.5 92.2 91.6 92.0 Washington – Seattle 96.7 97.1 99.1 90.6 97.1 99.1 Other non-cluster markets 62.2 62.2 56.4 62.2 62.2 56.4 Domestic markets 95.0 94.6 93.9 88.4 89.2 88.3 International 91.8 91.8 90.2 91.8 91.8 90.2 Total 94.9% 94.6% 93.8% 88.5% 89.3% 88.3%
Rentable Square Feet Number of Properties
Annualized Base Rent Markets Operating Redevelopment Development Total
California − San Diego 2,038,575 407,474 168,685 2,614,734 35 $ 65,628 16% California − San Francisco 2,269,578 − 319,766 2,589,344 24 83,542 20 Greater Boston 3,124,818 329,438 303,143 3,757,399 39 117,080 29 NYC/New Jersey/Suburban Philadelphia 748,216 − − 748,216 9 33,186 8 North Carolina − Research Triangle Park 822,919 18,060 − 840,979 13 17,787 4 Suburban Washington, D.C. 2,447,674 105,706 − 2,553,380 32 54,074 13 Washington − Seattle 887,824 59,179 − 947,003 11 33,527 8 Other non-cluster markets 61,002 − − 61,002 2 763 − Domestic markets 12,400,606 919,857 791,594 14,112,057 165 405,587 98 International 1,069,651 − 26,426 1,096,077 5 8,503 2 Subtotal 13,470,257 919,857 818,020 15,208,134 170 $ 414,090 100% Discontinued 97,740 − − 97,740 3 Total 13,567,997 919,857 818,020 15,305,874 173

27 ALEXANDRIA REAL ESTATE EQUITIES, INC. ALL RIGHTS RESERVED © 2012
ALEXANDRIA REAL ESTATE EQUITIES, INC.
Property Listing December 31, 2011
(Dollars in thousands) (Unaudited)
Submarket
Rentable Square Feet Occupancy Percentage
Address Operating Redevelopment Development Total Number of Properties
Annualized Base Rent Operating
Operating and Redevelopment
California – San Diego 10931/10933 North Torrey Pines Road (1)
Torrey Pines 96,641 − − 96,641 1 $ 2,969 99.5% 99.5%
10975 North Torrey Pines Road Torrey Pines 44,733 − − 44,733 1 1,638 100.0 100.0 11119 North Torrey Pines Road Torrey Pines − 72,245 − 72,245 1 − N/A − 3010 Science Park Road Torrey Pines 74,557 − − 74,557 1 3,215 100.0 100.0 3115/3215 Merryfield Row Torrey Pines 158,645 − − 158,645 2 7,098 100.0 100.0 3530/3550 John Hopkins Court & 3535/3565 General Atomics Court
Torrey Pines 117,058 98,320 − 215,378 4 2,997 91.7 49.8
10300 Campus Point Drive University Town Center 260,197 189,562 − 449,759 1 9,591 100.0 57.9 4755/4757/4767 Nexus Center Drive (2)
University Town Center 132,330 − 45,255 177,585 3 4,914 100.0 100.0
5200 Illumina Way University Town Center 346,581 − 123,430 470,011 1 13,260 100.0 100.0 9363/9373/9393 Towne Center Drive University Town Center 111,513 − − 111,513 3 3,337 100.0 100.0 9880 Campus Point Drive University Town Center 71,510 − − 71,510 1 2,774 100.0 100.0 5810-5820 Nancy Ridge Drive Sorrento Mesa 87,298 − − 87,298 1 1,715 100.0 100.0 5871 Oberlin Drive Sorrento Mesa 33,817 − − 33,817 1 878 100.0 100.0 6138-6150 Nancy Ridge Drive Sorrento Mesa 56,698 − − 56,698 1 1,586 100.0 100.0 6146/6166 Nancy Ridge Drive Sorrento Mesa 51,273 − − 51,273 2 1,008 87.4 87.4 6175/6225/6275 Nancy Ridge Drive Sorrento Mesa 60,232 47,347 − 107,579 3 419 47.2 26.4 7330 Carroll Road Sorrento Mesa 66,244 − − 66,244 1 2,141 89.4 89.4 10505 Roselle Street & 3770 Tansy Street
Sorrento Valley 33,013 − − 33,013 2 1,001 100.0 100.0
11025/11035/11045 Roselle Street Sorrento Valley 65,910 − − 65,910 3 1,035 72.4 72.4 3985 Sorrento Valley Boulevard Sorrento Valley 60,545 − − 60,545 1 1,557 100.0 100.0 13112 Evening Creek Drive I-15 Corridor 109,780 − − 109,780 1 2,495 100.0 100.0 California – San Diego 2,038,575 407,474 168,685 2,614,734 35 $ 65,628 96.4% 80.3%
California – San Francisco 1500 Owens Street Mission Bay 158,267 − − 158,267 1 $ 6,721 93.8% 93.8% 1700 Owens Street Mission Bay 157,340 − − 157,340 1 6,962 97.5 97.5 455 Mission Bay Boulevard Mission Bay 210,000 − − 210,000 1 7,850 92.4 92.4 409/499 Illinois Street Mission Bay 234,249 − 219,007 453,256 2 14,318 100.0 100.0 249 E. Grand Avenue South San Francisco 129,501 − − 129,501 1 5,084 100.0 100.0 341/343 Oyster Point Blvd South San Francisco 107,960 − − 107,960 2 1,961 100.0 100.0 400/450 East Jamie Court South San Francisco 62,548 − 100,759 163,307 2 1,743 100.0 100.0 500 Forbes Boulevard South San Francisco 155,685 − − 155,685 1 5,540 100.0 100.0 600/630/650 Gateway Boulevard South San Francisco 150,960 − − 150,960 3 3,798 91.0 91.0 681 Gateway Boulevard South San Francisco 126,971 − − 126,971 1 6,161 100.0 100.0 7000 Shoreline Court South San Francisco 136,393 − − 136,393 1 4,084 100.0 100.0 901/951 Gateway Boulevard South San Francisco 170,244 − − 170,244 2 5,355 88.3 88.3 2425 Garcia Ave & 2400/2450 Bayshore Pky
Peninsula 98,964 − − 98,964 1 3,224 96.4 96.4
2625/2627/2631 Hanover Street (3) Peninsula 32,074 − − 32,074 1 1,335 100.0 100.0 3165 Porter Drive Peninsula 91,644 − − 91,644 1 3,929 100.0 100.0 3350 W. Bayshore Road Peninsula 60,000 − − 60,000 1 1,531 100.0 100.0 75 & 125 Shoreway Road Peninsula 82,815 − − 82,815 1 1,864 92.3 92.3 849/863 Mitten Road & 866 Malcolm Road Peninsula 103,963 − − 103,963 1 2,082
99.3 99.3
California – San Francisco 2,269,578 − 319,766 2,589,344 24 $ 83,542 96.7% 96.7% (1) Includes 9,741 and 14,030 rentable square feet targeted for redevelopment in 2012 and 2013, respectively. (2) Includes 67,050 rentable square feet targeted for redevelopment in 2012. (3) Includes 32,074 rentable square feet targeted for redevelopment in 2012.
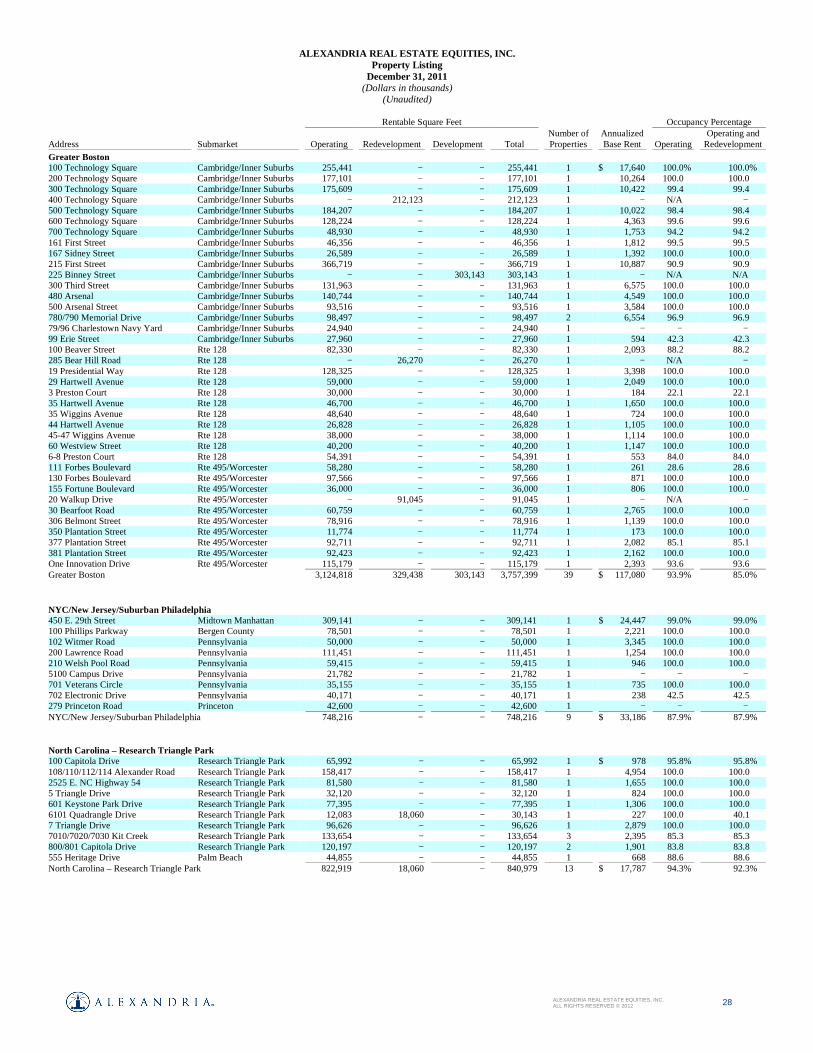
28 ALEXANDRIA REAL ESTATE EQUITIES, INC. ALL RIGHTS RESERVED © 2012
ALEXANDRIA REAL ESTATE EQUITIES, INC.
Property Listing December 31, 2011
(Dollars in thousands) (Unaudited)
Address Submarket
Rentable Square Feet Occupancy Percentage
Operating Redevelopment Development Total Number of Properties
Annualized Base Rent Operating
Operating and Redevelopment
Greater Boston 100 Technology Square Cambridge/Inner Suburbs 255,441 − − 255,441 1 $ 17,640 100.0% 100.0% 200 Technology Square Cambridge/Inner Suburbs 177,101 − − 177,101 1 10,264 100.0 100.0 300 Technology Square Cambridge/Inner Suburbs 175,609 − − 175,609 1 10,422 99.4 99.4 400 Technology Square Cambridge/Inner Suburbs − 212,123 − 212,123 1 − N/A − 500 Technology Square Cambridge/Inner Suburbs 184,207 − − 184,207 1 10,022 98.4 98.4 600 Technology Square Cambridge/Inner Suburbs 128,224 − − 128,224 1 4,363 99.6 99.6 700 Technology Square Cambridge/Inner Suburbs 48,930 − − 48,930 1 1,753 94.2 94.2 161 First Street Cambridge/Inner Suburbs 46,356 − − 46,356 1 1,812 99.5 99.5 167 Sidney Street Cambridge/Inner Suburbs 26,589 − − 26,589 1 1,392 100.0 100.0 215 First Street Cambridge/Inner Suburbs 366,719 − − 366,719 1 10,887 90.9 90.9 225 Binney Street Cambridge/Inner Suburbs − − 303,143 303,143 1 − N/A N/A 300 Third Street Cambridge/Inner Suburbs 131,963 − − 131,963 1 6,575 100.0 100.0 480 Arsenal Cambridge/Inner Suburbs 140,744 − − 140,744 1 4,549 100.0 100.0 500 Arsenal Street Cambridge/Inner Suburbs 93,516 − − 93,516 1 3,584 100.0 100.0 780/790 Memorial Drive Cambridge/Inner Suburbs 98,497 − − 98,497 2 6,554 96.9 96.9 79/96 Charlestown Navy Yard Cambridge/Inner Suburbs 24,940 − − 24,940 1 − − − 99 Erie Street Cambridge/Inner Suburbs 27,960 − − 27,960 1 594 42.3 42.3 100 Beaver Street Rte 128 82,330 − − 82,330 1 2,093 88.2 88.2 285 Bear Hill Road Rte 128 − 26,270 − 26,270 1 − N/A − 19 Presidential Way Rte 128 128,325 − − 128,325 1 3,398 100.0 100.0 29 Hartwell Avenue Rte 128 59,000 − − 59,000 1 2,049 100.0 100.0 3 Preston Court Rte 128 30,000 − − 30,000 1 184 22.1 22.1 35 Hartwell Avenue Rte 128 46,700 − − 46,700 1 1,650 100.0 100.0 35 Wiggins Avenue Rte 128 48,640 − − 48,640 1 724 100.0 100.0 44 Hartwell Avenue Rte 128 26,828 − − 26,828 1 1,105 100.0 100.0 45-47 Wiggins Avenue Rte 128 38,000 − − 38,000 1 1,114 100.0 100.0 60 Westview Street Rte 128 40,200 − − 40,200 1 1,147 100.0 100.0 6-8 Preston Court Rte 128 54,391 − − 54,391 1 553 84.0 84.0 111 Forbes Boulevard Rte 495/Worcester 58,280 − − 58,280 1 261 28.6 28.6 130 Forbes Boulevard Rte 495/Worcester 97,566 − − 97,566 1 871 100.0 100.0 155 Fortune Boulevard Rte 495/Worcester 36,000 − − 36,000 1 806 100.0 100.0 20 Walkup Drive Rte 495/Worcester − 91,045 − 91,045 1 − N/A − 30 Bearfoot Road Rte 495/Worcester 60,759 − − 60,759 1 2,765 100.0 100.0 306 Belmont Street Rte 495/Worcester 78,916 − − 78,916 1 1,139 100.0 100.0 350 Plantation Street Rte 495/Worcester 11,774 − − 11,774 1 173 100.0 100.0 377 Plantation Street Rte 495/Worcester 92,711 − − 92,711 1 2,082 85.1 85.1 381 Plantation Street Rte 495/Worcester 92,423 − − 92,423 1 2,162 100.0 100.0 One Innovation Drive Rte 495/Worcester 115,179 − − 115,179 1 2,393 93.6 93.6 Greater Boston 3,124,818 329,438 303,143 3,757,399 39 $ 117,080 93.9% 85.0%
NYC/New Jersey/Suburban Philadelphia 450 E. 29th Street Midtown Manhattan 309,141 − − 309,141 1 $ 24,447 99.0% 99.0% 100 Phillips Parkway Bergen County 78,501 − − 78,501 1 2,221 100.0 100.0 102 Witmer Road Pennsylvania 50,000 − − 50,000 1 3,345 100.0 100.0 200 Lawrence Road Pennsylvania 111,451 − − 111,451 1 1,254 100.0 100.0 210 Welsh Pool Road Pennsylvania 59,415 − − 59,415 1 946 100.0 100.0 5100 Campus Drive Pennsylvania 21,782 − − 21,782 1 − − − 701 Veterans Circle Pennsylvania 35,155 − − 35,155 1 735 100.0 100.0 702 Electronic Drive Pennsylvania 40,171 − − 40,171 1 238 42.5 42.5 279 Princeton Road Princeton 42,600 − − 42,600 1 − − − NYC/New Jersey/Suburban Philadelphia 748,216 − − 748,216 9 $ 33,186 87.9% 87.9% North Carolina – Research Triangle Park 100 Capitola Drive Research Triangle Park 65,992 − − 65,992 1 $ 978 95.8% 95.8% 108/110/112/114 Alexander Road Research Triangle Park 158,417 − − 158,417 1 4,954 100.0 100.0 2525 E. NC Highway 54 Research Triangle Park 81,580 − − 81,580 1 1,655 100.0 100.0 5 Triangle Drive Research Triangle Park 32,120 − − 32,120 1 824 100.0 100.0 601 Keystone Park Drive Research Triangle Park 77,395 − − 77,395 1 1,306 100.0 100.0 6101 Quadrangle Drive Research Triangle Park 12,083 18,060 − 30,143 1 227 100.0 40.1 7 Triangle Drive Research Triangle Park 96,626 − − 96,626 1 2,879 100.0 100.0 7010/7020/7030 Kit Creek Research Triangle Park 133,654 − − 133,654 3 2,395 85.3 85.3 800/801 Capitola Drive Research Triangle Park 120,197 − − 120,197 2 1,901 83.8 83.8 555 Heritage Drive Palm Beach 44,855 − − 44,855 1 668 88.6 88.6 North Carolina – Research Triangle Park 822,919 18,060 − 840,979 13 $ 17,787 94.3% 92.3%

29 ALEXANDRIA REAL ESTATE EQUITIES, INC. ALL RIGHTS RESERVED © 2012
ALEXANDRIA REAL ESTATE EQUITIES, INC.
Property Listing December 31, 2011
(Dollars in thousands) (Unaudited)
Rentable Square Feet Occupancy Percentage
Address Submarket Operating Redevelopment Development Total Number of Properties
Annualized Base Rent Operating
Operating and Redevelopment
Suburban Washington, D.C. 12301 Parklawn Drive Rockville 49,185 − − 49,185 1 $ 1,024 100.0% 100.0% 1330 Piccard Drive Rockville 131,415 − − 131,415 1 3,209 91.9 91.9 1405/1413 Research Boulevard Rockville 176,669 − − 176,669 2 5,047 100.0 100.0 1500/1550 East Gude Drive Rockville 90,489 − − 90,489 2 1,937 100.0 100.0 14920 Broschart Road Rockville 48,500 − − 48,500 1 961 100.0 100.0 15010 Broschart Road Rockville 38,203 − − 38,203 1 663 81.7 81.7 5 Research Court Rockville 54,906 − − 54,906 1 1,564 100.0 100.0 5 Research Place Rockville 63,852 − − 63,852 1 2,341 100.0 100.0 9800 Medical Center Drive Rockville 201,896 79,579 − 281,475 4 6,768 97.2 69.7 9920 Medical Center Drive Rockville 58,733 − − 58,733 1 455 100.0 100.0 1201 Clopper Road Gaithersburg 143,585 − − 143,585 1 3,480 100.0 100.0 1300 Quince Orchard Road Gaithersburg 54,874 − − 54,874 1 812 100.0 100.0 16020 Industrial Drive Gaithersburg 83,541 − − 83,541 1 1,410 100.0 100.0 19/20/22 Firstfield Road Gaithersburg 132,639 − − 132,639 3 2,900 100.0 100.0 25/35/45 West Watkins Mill Road Gaithersburg 138,938 − − 138,938 1 3,619 100.0 100.0 401 Professional Drive Gaithersburg 63,154 − − 63,154 1 1,046 89.5 89.5 620 Professional Drive Gaithersburg − 26,127 − 26,127 1 − N/A − 708 Quince Orchard Road Gaithersburg 49,624 − − 49,624 1 1,138 99.3 99.3 9 W. Watkins Mill Road Gaithersburg 92,449 − − 92,449 1 2,598 100.0 100.0 910 Clopper Road Gaithersburg 180,650 − − 180,650 1 3,147 85.6 85.6 930/940 Clopper Road Gaithersburg 104,302 − − 104,302 2 1,654 93.4 93.4 950 Wind River Lane Gaithersburg 50,000 − − 50,000 1 1,082 100.0 100.0 8000/9000/10000 Virginia Manor Road
Beltsville 191,884 − − 191,884 1 2,878 84.1 84.1
14225 Newbrook Drive Northern Virginia 248,186 − − 248,186 1 4,341 100.0 100.0 Suburban Washington, D.C. 2,447,674 105,706 − 2,553,380 32 $ 54,074 96.2% 92.2%
Washington – Seattle 1201/1208 Eastlake Avenue Lake Union 203,369 − − 203,369 2 $ 8,747 100.0% 100.0% 1551 Eastlake Avenue Lake Union 58,304 59,179 − 117,483 1 1,541 100.0 49.6 1600 Fairview Avenue Lake Union 27,991 − − 27,991 1 1,294 100.0 100.0 1616 Eastlake Avenue (1) Lake Union 165,493 − − 165,493 1 5,225 94.7 94.7 199 E. Blaine Street Lake Union 115,084 − − 115,084 1 6,140 100.0 100.0 219 Terry Avenue Lake Union 30,845 − − 30,845 1 1,410 93.4 93.4 1124 Columbia Street First Hill 203,817 − − 203,817 1 6,592 96.3 96.3 3000/3018 Western Avenue Elliott Bay 47,746 − − 47,746 1 1,795 100.0 100.0 410 W. Harrison/410 Elliott Avenue West Elliott Bay 35,175 − − 35,175 2 783 67.4 67.4 Washington – Seattle 887,824 59,179 − 947,003 11 $ 33,527 96.7% 90.6% Other non-cluster market properties 61,002 − − 61,002 2 $ 763 62.2% 62.2% Domestic Properties 12,400,606 919,857 791,594 14,112,057 165 $ 405,587 95.0% 88.4% International Canada 46,032 − − 46,032 1 $ 1,889 100.0% 100.0% Canada 66,000 − − 66,000 1 1,225 100.0 100.0 Canada 106,364 − 26,426 132,790 1 2,181 78.0 78.0 Canada 68,000 − − 68,000 1 3,208 100.0 100.0 Canada (2) 783,255 − − 783,255 1 N/A N/A N/A International 1,069,651 − 26,426 1,096,077 5 $ 8,503 91.8% 91.8% Subtotal 13,470,257 919,857 818,020 15,208,134 170 $ 414,090 94.9% 88.5% Properties “held for sale” 97,740 − − 97,740 3 Total 13,567,997 919,857 818,020 15,305,874 173 (1) In 2012, we expect to convert 65,936 rentable square feet of office space through redevelopment into life science laboratory space. (2) Represents land and improvements subject to a ground lease with a tenant.
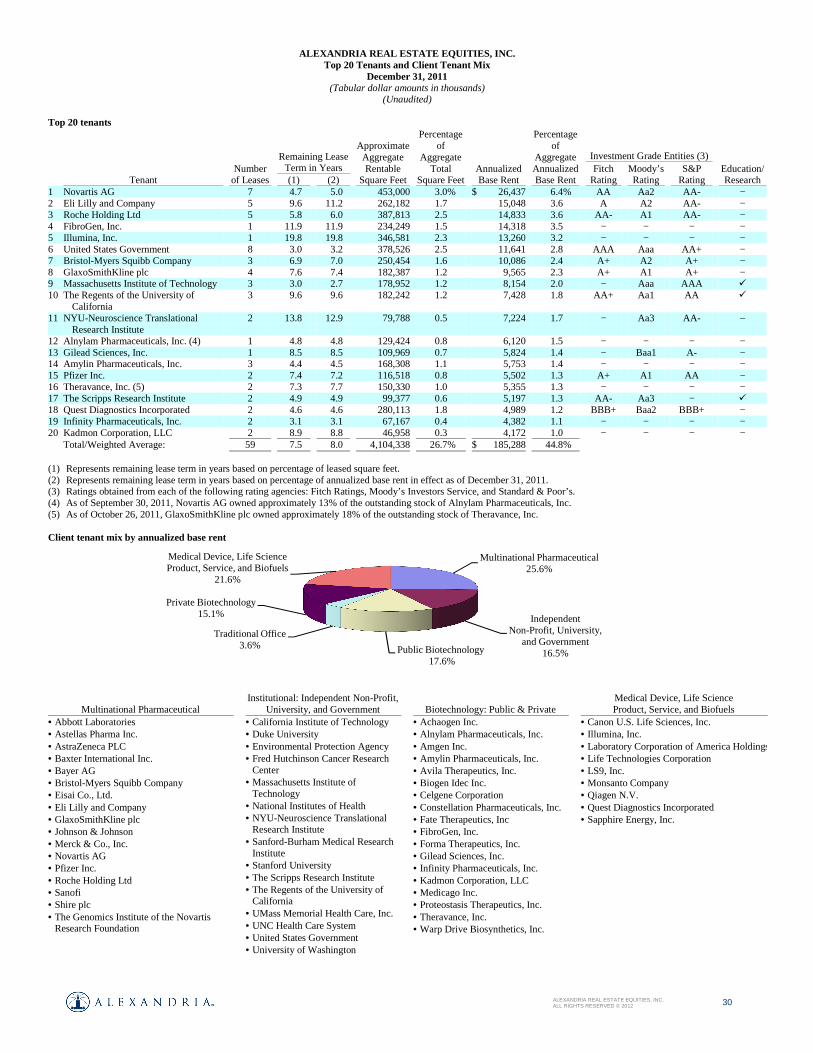
30 ALEXANDRIA REAL ESTATE EQUITIES, INC. ALL RIGHTS RESERVED © 2012
ALEXANDRIA REAL ESTATE EQUITIES, INC.
Top 20 Tenants and Client Tenant Mix December 31, 2011
(Tabular dollar amounts in thousands) (Unaudited)
Top 20 tenants
Tenant
Number of Leases
Remaining Lease Term in Years
Approximate Aggregate Rentable
Square Feet
Percentage of
Aggregate Total
Square Feet
Annualized Base Rent
Percentage of
Aggregate Annualized Base Rent
Investment Grade Entities (3)
Education/ Research
Fitch Rating
Moody’s Rating
S&P Rating
(1) (2)
1 Novartis AG 7 4.7 5.0 453,000 3.0% $ 26,437 6.4% AA Aa2 AA- − 2 Eli Lilly and Company 5 9.6 11.2 262,182 1.7 15,048 3.6 A A2 AA- − 3 Roche Holding Ltd 5 5.8 6.0 387,813 2.5 14,833 3.6 AA- A1 AA- − 4 FibroGen, Inc. 1 11.9 11.9 234,249 1.5 14,318 3.5 − − − − 5 Illumina, Inc. 1 19.8 19.8 346,581 2.3 13,260 3.2 − − − − 6 United States Government 8 3.0 3.2 378,526 2.5 11,641 2.8 AAA Aaa AA+ − 7 Bristol-Myers Squibb Company 3 6.9 7.0 250,454 1.6 10,086 2.4 A+ A2 A+ − 8 GlaxoSmithKline plc 4 7.6 7.4 182,387 1.2 9,565 2.3 A+ A1 A+ − 9 Massachusetts Institute of Technology 3 3.0 2.7 178,952 1.2 8,154 2.0 − Aaa AAA � 10 The Regents of the University of
California 3 9.6 9.6 182,242 1.2 7,428 1.8 AA+ Aa1 AA �
11 NYU-Neuroscience Translational Research Institute
2 13.8 12.9 79,788 0.5 7,224 1.7 − Aa3 AA- −
12 Alnylam Pharmaceuticals, Inc. (4) 1 4.8 4.8 129,424 0.8 6,120 1.5 − − − − 13 Gilead Sciences, Inc. 1 8.5 8.5 109,969 0.7 5,824 1.4 − Baa1 A- − 14 Amylin Pharmaceuticals, Inc. 3 4.4 4.5 168,308 1.1 5,753 1.4 − − − − 15 Pfizer Inc. 2 7.4 7.2 116,518 0.8 5,502 1.3 A+ A1 AA − 16 Theravance, Inc. (5) 2 7.3 7.7 150,330 1.0 5,355 1.3 − − − − 17 The Scripps Research Institute 2 4.9 4.9 99,377 0.6 5,197 1.3 AA- Aa3 − � 18 Quest Diagnostics Incorporated 2 4.6 4.6 280,113 1.8 4,989 1.2 BBB+ Baa2 BBB+ − 19 Infinity Pharmaceuticals, Inc. 2 3.1 3.1 67,167 0.4 4,382 1.1 − − − − 20 Kadmon Corporation, LLC 2 8.9 8.8 46,958 0.3 4,172 1.0 − − − − Total/Weighted Average: 59 7.5 8.0 4,104,338 26.7% $ 185,288 44.8% (1) Represents remaining lease term in years based on percentage of leased square feet. (2) Represents remaining lease term in years based on percentage of annualized base rent in effect as of December 31, 2011. (3) Ratings obtained from each of the following rating agencies: Fitch Ratings, Moody’s Investors Service, and Standard & Poor’s. (4) As of September 30, 2011, Novartis AG owned approximately 13% of the outstanding stock of Alnylam Pharmaceuticals, Inc. (5) As of October 26, 2011, GlaxoSmithKline plc owned approximately 18% of the outstanding stock of Theravance, Inc.
Client tenant mix by annualized base rent
Multinational Pharmaceutical Institutional: Independent Non-Profit,
University, and Government Biotechnology: Public & Private Medical Device, Life Science Product, Service, and Biofuels
• Abbott Laboratories • Astellas Pharma Inc. • AstraZeneca PLC • Baxter International Inc. • Bayer AG • Bristol-Myers Squibb Company • Eisai Co., Ltd. • Eli Lilly and Company • GlaxoSmithKline plc • Johnson & Johnson • Merck & Co., Inc. • Novartis AG • Pfizer Inc. • Roche Holding Ltd • Sanofi • Shire plc • The Genomics Institute of the Novartis
Research Foundation
• California Institute of Technology • Duke University • Environmental Protection Agency • Fred Hutchinson Cancer Research
Center • Massachusetts Institute of
Technology • National Institutes of Health • NYU-Neuroscience Translational
Research Institute • Sanford-Burham Medical Research
Institute • Stanford University • The Scripps Research Institute • The Regents of the University of
California • UMass Memorial Health Care, Inc. • UNC Health Care System • United States Government • University of Washington
• Achaogen Inc. • Alnylam Pharmaceuticals, Inc. • Amgen Inc. • Amylin Pharmaceuticals, Inc. • Avila Therapeutics, Inc. • Biogen Idec Inc. • Celgene Corporation • Constellation Pharmaceuticals, Inc. • Fate Therapeutics, Inc • FibroGen, Inc. • Forma Therapeutics, Inc. • Gilead Sciences, Inc. • Infinity Pharmaceuticals, Inc. • Kadmon Corporation, LLC • Medicago Inc. • Proteostasis Therapeutics, Inc. • Theravance, Inc. • Warp Drive Biosynthetics, Inc.
• Canon U.S. Life Sciences, Inc. • Illumina, Inc. • Laboratory Corporation of America Holdings• Life Technologies Corporation • LS9, Inc. • Monsanto Company • Qiagen N.V. • Quest Diagnostics Incorporated • Sapphire Energy, Inc.
Multinational Pharmaceutical25.6%
Independent Non-Profit, University,
and Government 16.5%Public Biotechnology
17.6%
Traditional Office 3.6%
Private Biotechnology 15.1%
Medical Device, Life Science Product, Service, and Biofuels
21.6%

30 ALEXANDRIA REAL ESTATE EQUITIES, INC. ALL RIGHTS RESERVED © 2012
ALEXANDRIA REAL ESTATE EQUITIES, INC.
VALUE ADDED OPPORTUNITIES AND EXTERNAL GROWTH

31 ALEXANDRIA REAL ESTATE EQUITIES, INC. ALL RIGHTS RESERVED © 2012
ALEXANDRIA REAL ESTATE EQUITIES, INC.
UCSF Research Campus – 2.5 million SF
UCSF Hospital Campus – 1.5 million SF
Current Alexandria Buildings – 979,000 SF
Future Alexandria Buildings – 290,000 SF
Alexandria Parking
Value-Added Projects December 31, 2011
ALEXANDRIA CENTER TM FOR LIFE SCIENCE – NEW YORK CITY
The Alexandria CenterTM for Life Science – New York City (“ACNYC”) will consist of three buildings aggregating approximately 1.1 million rentable square feet. The east tower consists of 309,141 rentable square feet and is approximately 99% occupied as of December 31, 2011. The ACNYC campus also includes 407,000 developable square feet, site of the future west tower, as well as a parcel supporting the future ground-up development of approximately 385,000 rentable square feet on the north end of the campus.
ALEXANDRIA CENTER TM FOR SCIENCE AND TECHNOLOGY – MISSION BAY
ALEXANDRIA CENTER TM AT KENDALL SQUARE
The Alexandria CenterTM for Science and Technology – Mission Bay will consist of up to seven high-quality facilities aggregating approximately 1.3 million rentable square feet. We currently have five buildings aggregating approximately 760,000 rentable square feet leased to FibroGen, Inc., Merck & Co., Inc., Pfizer Inc., Bayer AG, and UCSF as well as other top-tier life science entities, 219,000 rentable square feet undergoing development, and future potential buildings aggregating approximately 290,000 rentable square feet.
Buildings in the white outline represent renderings of five future ground-up life science laboratory developments aggregating 1.9 million rentable square feet. We continue to advance various important preconstruction activities for this development site, including Building Information Modeling (3-D virtual modeling), design development, construction drawings (required for each of the five new buildings), sustainability and energy optimization review, budgeting, planning for future site and infrastructure work, and other activities prior to commencement of vertical construction of aboveground shell and core improvements. Our objective is to advance preconstruction activities in order to reduce the time to deliver a new ground-up development to a prospective tenant.
MIT CAMPUS
TECHNOLOGY SQUARE
KENDALL SQUARE
PRE-LEASED

32 ALEXANDRIA REAL ESTATE EQUITIES, INC. ALL RIGHTS RESERVED © 2012
ALEXANDRIA REAL ESTATE EQUITIES, INC.
Summary of Real Estate and Development and Redevelopment December 31, 2011
(Tabular dollar amounts in thousands, except per square foot amounts) (Unaudited)
Summary of real estate December 31, 2011 September 30, 2011
Book Value Square Footage Cost per
Square Foot Book Value Square Footage Cost per
Square Foot Rental properties $ 5,112,759 13,567,997 $ 377 $ 5,000,700 13,590,125 $ 368 Less: accumulated depreciation (742,535 ) (710,580 ) Rental properties, net 4,370,224 4,290,120 Construction in progress (“CIP”)/current value-added projects: Active redevelopment 281,555 919,857 306 300,398 747,248 402 Active development 198,644 818,020 243 190,427 531,486 358 Projects in India and China 106,775 817,000 131 113,136 916,000 124 Generic infrastructure/building improvement projects 92,338 − − − − − 679,312 2,554,877 266 603,961 2,194,734 275 Land/future value-added projects Land held for future development 341,678 10,939,000 31 452,732 11,715,000 39 Land undergoing preconstruction activities (additional CIP) (2) 574,884 2,668,000 215 538,437 2,456,000 219 916,562 13,607,000 67 991,169 14,171,000 70 Investment in unconsolidated real estate entity 42,342 414,000 102 40,042 428,000 94 Real estate, net 6,008,440 30,143,874 $ 200 5,925,292 30,383,859 $ 195 Add: accumulated depreciation 742,535 710,580 Gross investment in real estate (1) $ 6,750,975 30,143,874 $ 6,635,872 30,383,859 (1) In addition to assets included in our gross investment in real estate, we also hold options/rights for parcels supporting approximately 3.0 million developable square feet.
These parcels consist of: (a) a parcel supporting the future ground-up development of approximately 385,000 rentable square feet in Alexandria Center™ for Life Science – New York City related to an option under our ground lease; (b) right to acquire land parcels supporting ground-up development of 636,000 rentable square feet in Edinburgh, Scotland; and (c) an option to increase our land use rights by up to approximately 2.0 million additional developable square feet in China.
(2) We generally will not commence ground-up development of any parcels undergoing preconstruction activities without first securing significant pre-leasing for such space. If vertical aboveground construction is not initiated at completion of preconstruction activities, the land parcel will be classified as land held for future development. The two largest projects included in preconstruction consist of our 1.6 million developable square feet at Alexandria Center™ at Kendall Square in East Cambridge, Massachusetts and our 407,000 developable square foot site for the second tower at Alexandria Center™ for Life Science – New York City.
Development and redevelopment CIP Investment Leased/ RSF RSF December 31, 2011 Cost to Complete Total at Completion Stabilized Yield Description Negotiating In CIP In Service In Service CIP 2012 Thereafter Amount % Cash GAAP Development projects 69% 717,261 − $ − $ 171,592 $ 117,047 36% $ 102,773 $ 391,412 36% 7.1% 8.2% Urban/central business district
redevelopment projects 66 559,184 147,880 58,088 148,369 144,482 44 34,621 385,560 35 7.8 8.3
Subtotal 68 1,276,445 147,880 58,088 319,961 261,529 80 137,394 776,972 71 7.5% 8.2% Development – 400/450 East
Jamie Court 36 100,759 62,548 51,112 40,721 13,076 4 3,581 108,490 10 4.2% 4.3%
Other – 400/450 East Jamie Court (1)
13,669 (13,669 )
Suburban and other
redevelopment projects 50 360,673
12,083 3,526
156,593
51,772 16
3,461 215,352 19
Other – Suburban and other redevelopment projects (1) 23,407 (23,407 )
Total development and redevelopment projects
62% 1,737,877 222,511
149,802 480,199 326,377
100% 144,436 1,100,814 100%
Projects in India and China 817,000 106,775 41,350 TBD 148,125 Generic infrastructure/building
improvement projects
92,338 50,376 TBD 142,714 Subtotal 2,554,877 222,511 149,802 679,312 418,103 144,436 1,391,653 Preconstruction 2,668,000 574,884 46,657 TBD 621,541 Future projected construction 87,905 TBD 87,905 Total 5,222,877 222,511 $ 149,802 $ 1,254,196 $ 552,665 $ 144,436 $ 2,101,099 (1) See footnote 1 on page 33.
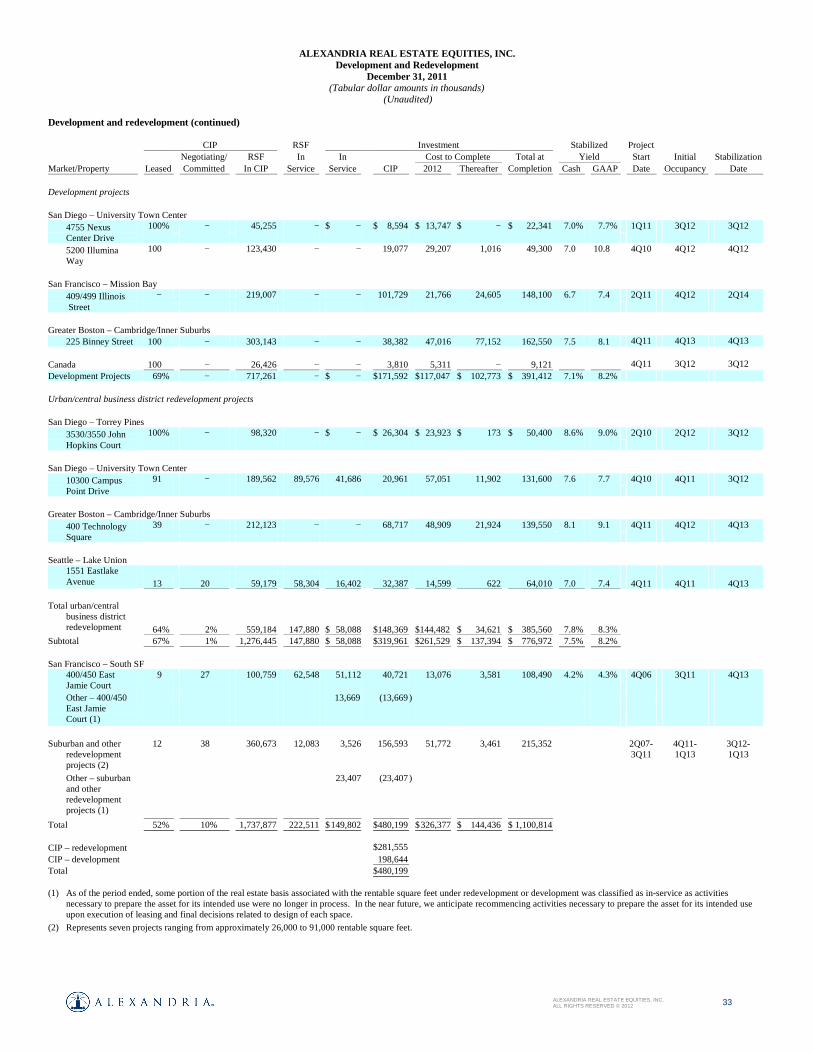
33 ALEXANDRIA REAL ESTATE EQUITIES, INC. ALL RIGHTS RESERVED © 2012
ALEXANDRIA REAL ESTATE EQUITIES, INC.
Development and Redevelopment December 31, 2011
(Tabular dollar amounts in thousands) (Unaudited)
Development and redevelopment (continued) CIP RSF Investment Stabilized Project Negotiating/ RSF In In Cost to Complete Total at Yield Start Initial Stabilization Market/Property Leased Committed In CIP Service Service CIP 2012 Thereafter Completion Cash GAAP Date Occupancy Date Development projects San Diego – University Town Center
4755 Nexus Center Drive
100%
− 45,255 − $ − $ 8,594 $ 13,747 $ − $ 22,341 7.0% 7.7%
1Q11 3Q12 3Q12
5200 Illumina Way
100
− 123,430 − − 19,077 29,207 1,016 49,300 7.0 10.8
4Q10 4Q12 4Q12
San Francisco – Mission Bay
409/499 Illinois Street
−
− 219,007 − − 101,729 21,766 24,605 148,100 6.7 7.4
2Q11 4Q12 2Q14
Greater Boston – Cambridge/Inner Suburbs
225 Binney Street 100 − 303,143 − − 38,382 47,016 77,152 162,550 7.5 8.1 4Q11 4Q13 4Q13 Canada 100 − 26,426 − − 3,810 5,311 − 9,121
7.5
.1 4Q11 3Q12 3Q12
Development Projects 69% − 717,261 − $ − $171,592 $117,047 $ 102,773 $ 391,412 7.1% 8.2% Urban/central business district redevelopment projects San Diego – Torrey Pines
3530/3550 John Hopkins Court
100% − 98,320 − $ − $ 26,304 $ 23,923 $ 173 $ 50,400
8.6% 9.0% 2Q10 2Q12 3Q12
San Diego – University Town Center
10300 Campus Point Drive
91 − 189,562 89,576 41,686 20,961 57,051 11,902 131,600
7.6 7.7 4Q10 4Q11 3Q12
Greater Boston – Cambridge/Inner Suburbs
400 Technology Square
39 − 212,123 − − 68,717 48,909 21,924 139,550
8.1 9.1 4Q11 4Q12 4Q13
Seattle – Lake Union
1551 Eastlake Avenue Avenue
13
20 59,179
58,304
16,402
32,387
14,599
622
64,010 7.0 7.4 4Q11 4Q11 4Q13
Total urban/central
business district redevelopment projects
64% 2% 559,184 147,880 $ 58,088 $148,369 $144,482 $ 34,621 $ 385,560 7.8% 8.3% Subtotal 67% 1% 1,276,445 147,880 $ 58,088 $319,961 $261,529 $ 137,394 $ 776,972 7.5% 8.2% San Francisco – South SF
400/450 East Jamie Court
9 27 100,759 62,548 51,112 40,721 13,076 3,581 108,490 4.2% 4.3% 4Q06 3Q11 4Q13
Other – 400/450 East Jamie Court (1)
13,669 (13,669 )
Suburban and other
redevelopment projects (2)
12 38 360,673 12,083 3,526 156,593 51,772 3,461 215,352 2Q07- 3Q11
4Q11- 1Q13
3Q12- 1Q13
Other – suburban and other redevelopment projects (1)
23,407 (23,407 )
Total 52% 10% 1,737,877 222,511 $ 149,802 $480,199 $ 326,377 $ 144,436 $ 1,100,814 CIP – redevelopment $281,555 CIP – development 198,644 Total $480,199 (1) As of the period ended, some portion of the real estate basis associated with the rentable square feet under redevelopment or development was classified as in-service as activities
necessary to prepare the asset for its intended use were no longer in process. In the near future, we anticipate recommencing activities necessary to prepare the asset for its intended use upon execution of leasing and final decisions related to design of each space.
(2) Represents seven projects ranging from approximately 26,000 to 91,000 rentable square feet.
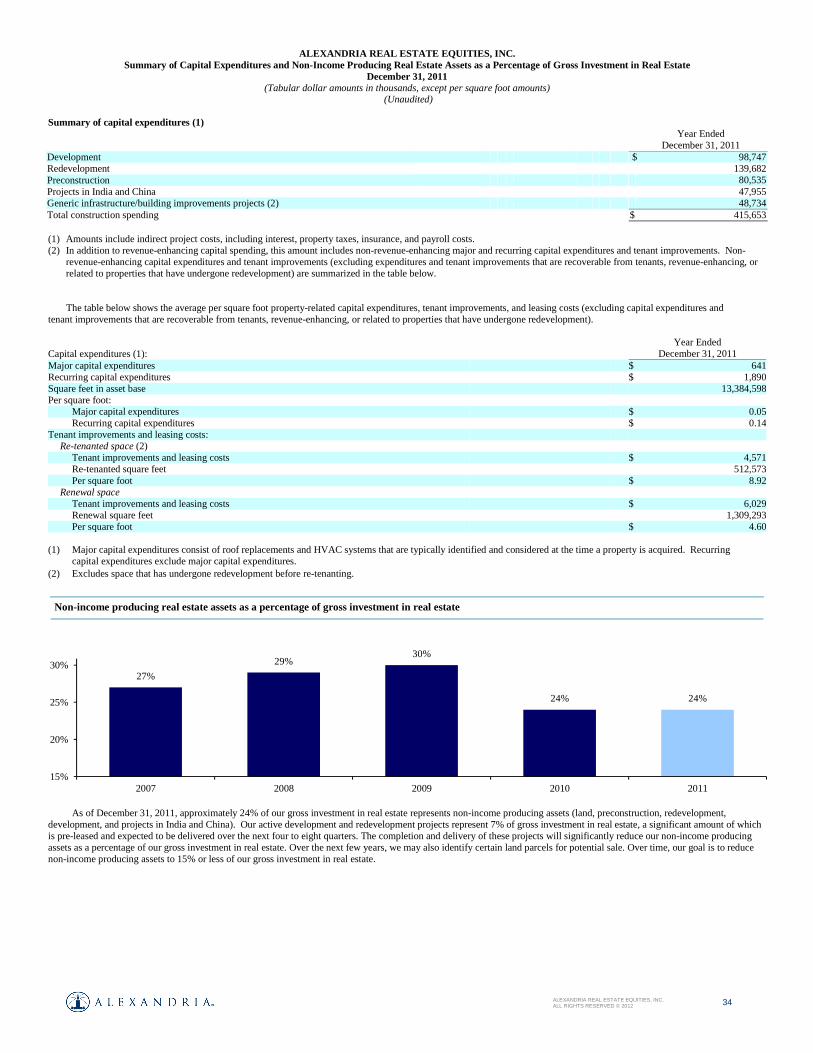
34 ALEXANDRIA REAL ESTATE EQUITIES, INC. ALL RIGHTS RESERVED © 2012
ALEXANDRIA REAL ESTATE EQUITIES, INC.
Summary of Capital Expenditures and Non-Income Producing Real Estate Assets as a Percentage of Gross Investment in Real Estate December 31, 2011
(Tabular dollar amounts in thousands, except per square foot amounts) (Unaudited)
Summary of capital expenditures (1)
Year Ended December 31, 2011
Development $ 98,747 Redevelopment 139,682 Preconstruction 80,535 Projects in India and China 47,955 Generic infrastructure/building improvements projects (2) 48,734 Total construction spending $ 415,653
(1) Amounts include indirect project costs, including interest, property taxes, insurance, and payroll costs. (2) In addition to revenue-enhancing capital spending, this amount includes non-revenue-enhancing major and recurring capital expenditures and tenant improvements. Non-
revenue-enhancing capital expenditures and tenant improvements (excluding expenditures and tenant improvements that are recoverable from tenants, revenue-enhancing, or related to properties that have undergone redevelopment) are summarized in the table below.
The table below shows the average per square foot property-related capital expenditures, tenant improvements, and leasing costs (excluding capital expenditures and tenant improvements that are recoverable from tenants, revenue-enhancing, or related to properties that have undergone redevelopment).
Year Ended Capital expenditures (1): December 31, 2011 Major capital expenditures $ 641Recurring capital expenditures $ 1,890Square feet in asset base 13,384,598Per square foot:
Major capital expenditures $ 0.05Recurring capital expenditures $ 0.14
Tenant improvements and leasing costs: Re-tenanted space (2)
Tenant improvements and leasing costs $ 4,571Re-tenanted square feet 512,573Per square foot $ 8.92
Renewal space Tenant improvements and leasing costs $ 6,029Renewal square feet 1,309,293Per square foot $ 4.60
(1) Major capital expenditures consist of roof replacements and HVAC systems that are typically identified and considered at the time a property is acquired. Recurring
capital expenditures exclude major capital expenditures. (2) Excludes space that has undergone redevelopment before re-tenanting.
As of December 31, 2011, approximately 24% of our gross investment in real estate represents non-income producing assets (land, preconstruction, redevelopment, development, and projects in India and China). Our active development and redevelopment projects represent 7% of gross investment in real estate, a significant amount of which is pre-leased and expected to be delivered over the next four to eight quarters. The completion and delivery of these projects will significantly reduce our non-income producing assets as a percentage of our gross investment in real estate. Over the next few years, we may also identify certain land parcels for potential sale. Over time, our goal is to reduce non-income producing assets to 15% or less of our gross investment in real estate.
27%
29%30%
24% 24%
15%
20%
25%
30%
35%
2007 2008 2009 2010 2011
Non-income producing real estate assets as a percentage of gross investment in real estate

35 ALEXANDRIA REAL ESTATE EQUITIES, INC. ALL RIGHTS RESERVED © 2012
ALEXANDRIA REAL ESTATE EQUITIES, INC.
Future Value-Added Projects December 31, 2011
(Unaudited)
The following table summarizes the components of our future value-added square footage as of December 31, 2011:
Markets
Land Undergoing Preconstruction Activities
(additional CIP)
Land Held for Future
Development Total Land (1)
Investment in Unconsolidated Real
Estate Entity Future Redevelopment (2) California − San Diego 271,000 522,000 793,000 – 87,000 California − San Francisco/Mission Bay − 290,000 290,000 − − California − San Francisco/So. San
Francisco 171,000 1,024,000 1,195,000 – 40,000
Greater Boston 1,581,000 225,000 1,806,000 414,000 125,000 New York City 407,000 − 407,000 − − Suburban Washington, D.C. – 1,024,000 1,024,000 – 416,000 Washington − Seattle 160,000 995,000 1,155,000 – 80,000 International 78,000 6,184,000 6,262,000 − − Other – 675,000 675,000 – 237,000 Total 2,668,000 10,939,000 13,607,000 414,000 985,000 (1) In addition to assets included in our gross investment in real estate, we also hold options/rights for parcels supporting approximately 3.0 million developable square feet.
These parcels consist of: (a) a parcel supporting the future ground-up development of approximately 385,000 rentable square feet in Alexandria Center™ for Life Science – New York City related to an option under our ground lease; (b) right to acquire land parcels supporting ground-up development of 636,000 rentable square feet in Edinburgh, Scotland; and (c) an option to increase our land use rights by up to approximately 2.0 million additional developable square feet in China.
(2) Our asset base also includes non-laboratory space (office, warehouse, and industrial space) identified for future conversion into life science laboratory space through redevelopment. These spaces are classified in rental properties, net.
35 ALEXANDRIA REAL ESTATE EQUITIES, INC. ALL RIGHTS RESERVED © 2012
ALEXANDRIA REAL ESTATE EQUITIES, INC. Definitions and Other Information
December 31, 2011
DEFINITIONS AND OTHER INFORMATION
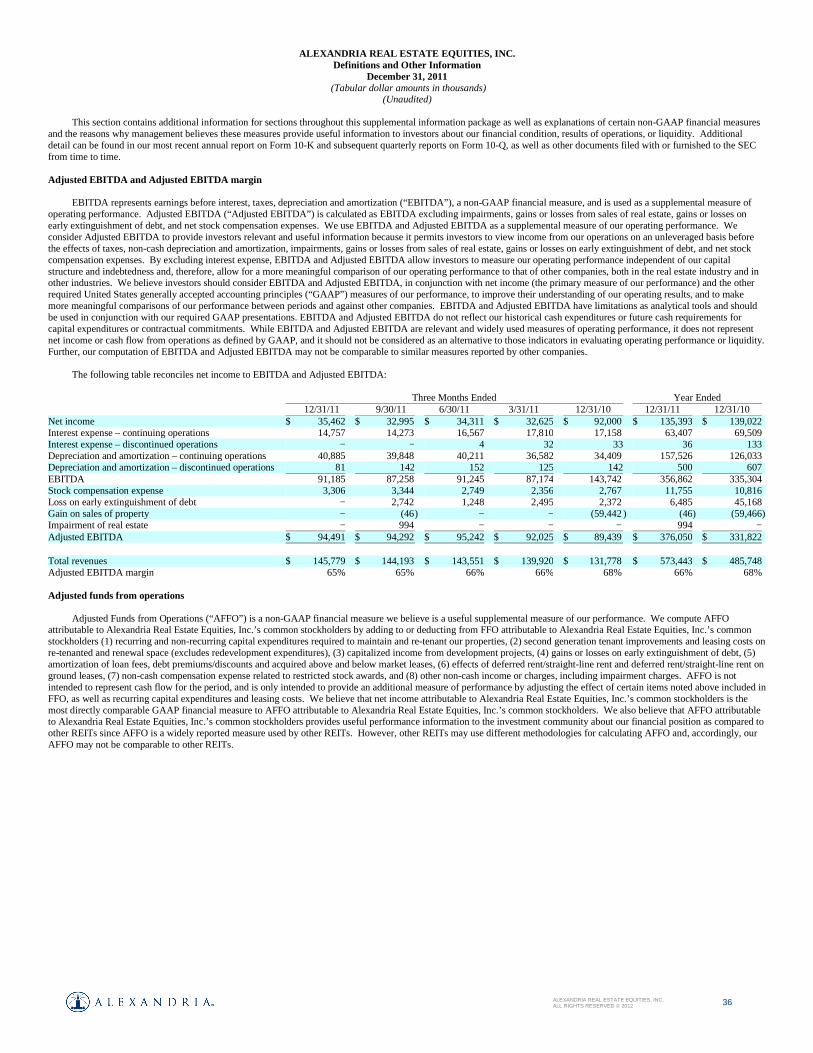
36 ALEXANDRIA REAL ESTATE EQUITIES, INC. ALL RIGHTS RESERVED © 2012
ALEXANDRIA REAL ESTATE EQUITIES, INC. Definitions and Other Information
December 31, 2011
(Tabular dollar amounts in thousands) (Unaudited)
This section contains additional information for sections throughout this supplemental information package as well as explanations of certain non-GAAP financial measures
and the reasons why management believes these measures provide useful information to investors about our financial condition, results of operations, or liquidity. Additional detail can be found in our most recent annual report on Form 10-K and subsequent quarterly reports on Form 10-Q, as well as other documents filed with or furnished to the SEC from time to time. Adjusted EBITDA and Adjusted EBITDA margin
EBITDA represents earnings before interest, taxes, depreciation and amortization (“EBITDA”), a non-GAAP financial measure, and is used as a supplemental measure of operating performance. Adjusted EBITDA (“Adjusted EBITDA”) is calculated as EBITDA excluding impairments, gains or losses from sales of real estate, gains or losses on early extinguishment of debt, and net stock compensation expenses. We use EBITDA and Adjusted EBITDA as a supplemental measure of our operating performance. We consider Adjusted EBITDA to provide investors relevant and useful information because it permits investors to view income from our operations on an unleveraged basis before the effects of taxes, non-cash depreciation and amortization, impairments, gains or losses from sales of real estate, gains or losses on early extinguishment of debt, and net stock compensation expenses. By excluding interest expense, EBITDA and Adjusted EBITDA allow investors to measure our operating performance independent of our capital structure and indebtedness and, therefore, allow for a more meaningful comparison of our operating performance to that of other companies, both in the real estate industry and in other industries. We believe investors should consider EBITDA and Adjusted EBITDA, in conjunction with net income (the primary measure of our performance) and the other required United States generally accepted accounting principles (“GAAP”) measures of our performance, to improve their understanding of our operating results, and to make more meaningful comparisons of our performance between periods and against other companies. EBITDA and Adjusted EBITDA have limitations as analytical tools and should be used in conjunction with our required GAAP presentations. EBITDA and Adjusted EBITDA do not reflect our historical cash expenditures or future cash requirements for capital expenditures or contractual commitments. While EBITDA and Adjusted EBITDA are relevant and widely used measures of operating performance, it does not represent net income or cash flow from operations as defined by GAAP, and it should not be considered as an alternative to those indicators in evaluating operating performance or liquidity. Further, our computation of EBITDA and Adjusted EBITDA may not be comparable to similar measures reported by other companies.
The following table reconciles net income to EBITDA and Adjusted EBITDA: Three Months Ended Year Ended
12/31/11 9/30/11 6/30/11 3/31/11 12/31/10 12/31/11 12/31/10 Net income $ 35,462 $ 32,995 $ 34,311 $ 32,625 $ 92,000 $ 135,393 $ 139,022 Interest expense – continuing operations 14,757 14,273 16,567 17,810 17,158 63,407 69,509 Interest expense – discontinued operations − − 4 32 33 36 133 Depreciation and amortization – continuing operations 40,885 39,848 40,211 36,582 34,409 157,526 126,033 Depreciation and amortization – discontinued operations 81 142 152 125 142 500 607 EBITDA 91,185 87,258 91,245 87,174 143,742 356,862 335,304 Stock compensation expense 3,306 3,344 2,749 2,356 2,767 11,755 10,816 Loss on early extinguishment of debt − 2,742 1,248 2,495 2,372 6,485 45,168 Gain on sales of property − (46 ) − − (59,442 ) (46) (59,466)Impairment of real estate − 994 − − − 994 − Adjusted EBITDA $ 94,491 $ 94,292 $ 95,242 $ 92,025 $ 89,439 $ 376,050 $ 331,822 Total revenues $ 145,779 $ 144,193 $ 143,551 $ 139,920 $ 131,778 $ 573,443 $ 485,748 Adjusted EBITDA margin 65% 65% 66% 66% 68% 66% 68% Adjusted funds from operations
Adjusted Funds from Operations (“AFFO”) is a non-GAAP financial measure we believe is a useful supplemental measure of our performance. We compute AFFO attributable to Alexandria Real Estate Equities, Inc.’s common stockholders by adding to or deducting from FFO attributable to Alexandria Real Estate Equities, Inc.’s common stockholders (1) recurring and non-recurring capital expenditures required to maintain and re-tenant our properties, (2) second generation tenant improvements and leasing costs on re-tenanted and renewal space (excludes redevelopment expenditures), (3) capitalized income from development projects, (4) gains or losses on early extinguishment of debt, (5) amortization of loan fees, debt premiums/discounts and acquired above and below market leases, (6) effects of deferred rent/straight-line rent and deferred rent/straight-line rent on ground leases, (7) non-cash compensation expense related to restricted stock awards, and (8) other non-cash income or charges, including impairment charges. AFFO is not intended to represent cash flow for the period, and is only intended to provide an additional measure of performance by adjusting the effect of certain items noted above included in FFO, as well as recurring capital expenditures and leasing costs. We believe that net income attributable to Alexandria Real Estate Equities, Inc.’s common stockholders is the most directly comparable GAAP financial measure to AFFO attributable to Alexandria Real Estate Equities, Inc.’s common stockholders. We also believe that AFFO attributable to Alexandria Real Estate Equities, Inc.’s common stockholders provides useful performance information to the investment community about our financial position as compared to other REITs since AFFO is a widely reported measure used by other REITs. However, other REITs may use different methodologies for calculating AFFO and, accordingly, our AFFO may not be comparable to other REITs.

37 ALEXANDRIA REAL ESTATE EQUITIES, INC. ALL RIGHTS RESERVED © 2012
ALEXANDRIA REAL ESTATE EQUITIES, INC. Definitions and Other Information
December 31, 2011
(Tabular dollar amounts in thousands, except for per share amounts) (Unaudited)
The following table reconciles FFO to AFFO:
Three Months Ended Year Ended
12/31/11 9/30/11 6/30/11 3/31/11 12/31/10 12/31/11 12/31/10 FFO attributable to Alexandria Real Estate Equities, Inc.’s common
stockholders $ 67,799 $ 64,270 $ 65,914 $ 60,631 $ 58,472 $ 258,614 $ 172,005
Add/(deduct): Major and recurring capital expenditures (1) (675 ) (550 ) (698 ) (608 ) (260 ) (2,531 ) (1,332 ) Tenant improvements and leasing costs (1) (6,083 ) (2,119 ) (1,595 ) (803 ) (2,583 ) (10,600 ) (6,725 ) Amortization of loan fees 2,551 2,144 2,327 2,278 1,999 9,300 7,892 Amortization of debt premiums/discounts 565 750 1,169 1,335 2,032 3,819 9,999 Amortization of acquired above and below market leases (812 ) (940 ) (2,726 ) (4,854 ) (2,364 ) (9,332 ) (7,868 ) Deferred rent/straight-line rent (9,558 ) (7,647 ) (2,885 ) (6,707 ) (9,092 ) (26,797 ) (22,832 ) Stock compensation 3,306 3,344 2,749 2,356 2,767 11,755 10,816 Capitalized income from development projects 537 930 1,078 1,428 1,486 3,973 5,688 Deferred rent/straight-line rent on ground leases 1,221 1,143 1,099 1,241 1,424 4,704 5,337 Loss on early extinguishment of debt − 2,742 1,248 2,495 2,372 6,485 45,168 Impairment of real estate − 994 − − − 994 − Allocation to unvested restricted stock awards 79 (7 ) (14 ) 16 19 74 (424 ) AFFO attributable to Alexandria Real Estate Equities, Inc.’s common
stockholders
$ 58,930 $ 65,054 $ 67,666 $ 58,808 $ 56,272 $ 250,458
$ 217,724
Weighted average shares of common stock outstanding for calculating
AFFO per share attributable to Alexandria Real Estate Equities, Inc.’s common stockholders – basic
61,427,495 61,295,659 58,500,055 54,948,345 54,865,654 59,066,812 48,375,474
Add: Dilutive effect of stock options 3,939 8,310 13,067 19,410 21,709 10,798 29,566 Weighted average shares of common stock outstanding for calculating
AFFO per share attributable to Alexandria Real Estate Equities, Inc.’s common stockholders – diluted
61,431,434 61,303,969 58,513,122 54,967,755 54,887,363 59,077,610 48,405,040
AFFO per share attributable to Alexandria Real Estate Equities, Inc.’s common stockholders Basic $ 0.96 $ 1.06 $ 1.16 $ 1.07 $ 1.03 $ 4.24 $ 4.50 Diluted $ 0.96 $ 1.06 $ 1.16 $ 1.07 $ 1.03 $ 4.24 $ 4.50 (1) See page 34 for further information. Annualized base rent
Annualized base rent means the annualized fixed base rental amount in effect as of December 31, 2011, related to our operating rentable square feet (using rental revenue computed on a straight-line basis in accordance with GAAP).
Capitalized interest
A key component of our business model is our value-added redevelopment and development programs. These programs are focused on providing high-quality generic life science laboratory space to meet the real estate requirements of and are reusable by various life science industry tenants. Upon completion, each value-added project is expected to generate significant revenues and cash flows. Our redevelopment and development projects are generally in locations that are highly desirable to life science entities which we believe results in higher occupancy levels, longer lease terms, and higher rental income and returns. Redevelopment projects consist of the permanent change in use of office, warehouse, and shell space into generic life science laboratory space, including the conversion of single-tenancy space to multi-tenancy space or multi-tenancy space to single-tenancy space. Development projects consist of the ground-up development of generic life science laboratory facilities. We also have certain significant value-added projects undergoing important and substantial preconstruction activities to bring these assets to their intended use. These critical activities add significant value and are required for the construction of buildings. The projects will provide high-quality facilities for the life science industry and will generate significant revenue and cash flows for the Company. In accordance with GAAP, we capitalize project costs clearly related to the construction, redevelopment, and development as a cost of the project. Indirect project costs such as construction administration, legal fees, and office costs that clearly relate to projects under construction, redevelopment, and development are also capitalized as a cost of the project. We capitalize project costs only during periods in which activities necessary to prepare an asset for its intended use are in progress. We also capitalize interest cost as a cost of the project only during the period for which activities necessary to prepare an asset for its intended use are ongoing, provided that expenditures for the asset have been made and interest cost is being incurred. Additionally, should activities necessary to prepare an asset for its intended use cease, interest, taxes, insurance, and certain other direct project costs related to these assets would be expensed as incurred. Cash interest
Cash interest is equal to interest expense calculated in accordance with GAAP, plus capitalized interest, less amortization of loan fees, and amortization of debt premiums/discounts.

38 ALEXANDRIA REAL ESTATE EQUITIES, INC. ALL RIGHTS RESERVED © 2012
ALEXANDRIA REAL ESTATE EQUITIES, INC. Definitions and Other Information
December 31, 2011
(Unaudited) Construction in progress (“CIP”)/current value-added projects
Active redevelopment/active development projects
A key component of our business model is our value-added redevelopment and development programs. These programs are focused on providing high-quality, generic, and reusable life science laboratory space to meet the real estate requirements of a wide range of clients in the life science industry. Upon completion, each value-added project is expected to generate significant revenues and cash flows. Our redevelopment and development projects are generally in locations that are highly desirable to life science entities, which we believe results in higher occupancy levels, longer lease terms, and higher rental income and returns. Redevelopment projects consist of the permanent change in use of office, warehouse, and shell space into generic life science laboratory space, including the conversion of single-tenancy space to multi-tenancy space or vice versa. Development projects consist of the ground-up development of generic and reusable life science laboratory facilities. We generally will not commence new development projects for aboveground vertical construction of new life science laboratory space without first securing significant pre-leasing for such space.
Projects in India and China
Projects in India and China primarily represent development opportunities and projects focused primarily on life science laboratory space for our current client tenants and other life science relationship entities. These projects focus on real estate investments with targeted returns on investment greater than returns expected in the United States. Generic infrastructure/building improvement projects
Generic infrastructure/building improvement projects include revenue-enhancing capital spending, non-revenue-enhancing major and recurring capital expenditures, and
tenant improvements. These amounts include payments for property-related capital expenditures and tenant improvements that are recoverable from our tenants. Dividend payout ratio
Dividend payout ratio (common stock) is the ratio of the absolute dollar amount of dividends on our common stock (shares of common stock outstanding on the respective record date multiplied by the related dividend per share) to FFO attributable to Alexandria Real Estate Equities, Inc.’s common stockholders on a diluted basis. The dividend payout ratio excludes loss on early extinguishment of debt. Dividend yield
Dividend yield for the quarter represents the annualized quarter dividend divided by the closing common stock price at the end of the quarter. Earnings per share
We use income from continuing operations attributable to Alexandria Real Estate Equities, Inc.’s common stockholders as the “control number” in determining whether potential common shares, including potential common shares issuable upon conversion of our 8.00% unsecured convertible notes, are dilutive or antidilutive to earnings per share. Pursuant to the presentation and disclosure literature on gains/losses on sales or disposals by REITs and earnings per share required by the SEC and the Financial Accounting Standards Board, gains or losses on sales or disposals by a REIT that do not qualify as discontinued operations are classified below income from discontinued operations in the income statement and included in the numerator for the computation of earnings per share for income from continuing operations. The land parcels we sold during the three months ended December 31, 2010, and three months ended September 30, 2011, did not meet the criteria for discontinued operations since these parcels did not have any significant operations prior to disposition. Accordingly, for the three months and year ended December 31, 2010, and the year ended December 31, 2011, we classified the $59.4 million and $46,000, respectively, of gain on sales of land parcels below income from discontinued operations, net in the consolidated income statements, and included the gain in income from continuing operations attributable to Alexandria Real Estate Equities, Inc.’s common stockholders, the “control number,” or numerator for the computation of earnings per share.
We account for unvested restricted stock awards which contain nonforfeitable rights to dividends as participating securities and include these securities in the computation of earnings per share using the two-class method. Under the two-class method, we allocate net income after preferred stock dividends and amounts attributable to noncontrolling interests to (1) common stockholders and (2) unvested restricted stock awards based on their respective participation rights to dividends declared (or accumulated) and undistributed earnings. Diluted earnings per share is computed using the weighted average shares of common stock outstanding determined for the basic earnings per share computation plus the effect of any dilutive securities, including the dilutive effect of stock options using the treasury stock method.
We applied the if-converted method of accounting for our 8.00% unsecured senior convertible notes (“8.00% Unsecured Convertible Notes”). In applying the if-converted method of accounting, conversion is assumed for purposes of calculating diluted earnings per share if the effect would be dilutive to earnings per share. If the assumed conversion pursuant to the if-converted method is dilutive, diluted earnings per share would be calculated by adding back interest charges applicable to our 8.00% Unsecured Convertible Notes to the numerator and our 8.00% Unsecured Convertible Notes would be assumed to have been converted at the beginning of the period presented (or from the date of issuance, if occurring on a date later than the date that the period begins) and the resulting incremental shares associated with the assumed conversion would be included in the denominator. Furthermore, we assume that our 8.00% Unsecured Convertible Notes are converted for the period prior to any retirement or actual conversion if the effect of such assumed retirement or conversion would be dilutive, and any shares of common stock issued upon actual conversion are included in the denominator for the period after the date of retirement or conversion. For all periods except the three months ended December 31, 2010, potential common shares issuable upon conversion of our 8.00% unsecured convertible notes were antidilutive to income from continuing operations per share and as such, were excluded from the computation of diluted earnings per share.

39 ALEXANDRIA REAL ESTATE EQUITIES, INC. ALL RIGHTS RESERVED © 2012
ALEXANDRIA REAL ESTATE EQUITIES, INC. Definitions and Other Information
December 31, 2011
(Tabular dollar amounts in thousands, except for per share amounts) (Unaudited)
The table below is a reconciliation of the numerators and denominators of the basic and diluted earnings per share computations for income from continuing operations:
EBITDA See Adjusted EBITDA and Adjusted EBITDA margin Fixed charge coverage ratio The fixed charge coverage ratio is primarily used as a supplemental measure of the Company’s ability to satisfy fixed financing obligations. We calculate the fixed charge coverage ratio as our ability to satisfy current cash interest expense and preferred dividends from adjusted EBITDA. The following table outlines our calculation of our fixed charge coverage ratios: Three Months Ended
December 31, 2011 September 30, 2011 June 30, 2011 March 31, 2011 December 31, 2010 Adjusted EBITDA $ 94,491 $ 94,292 $ 95,242 $ 92,025 $ 89,439 Interest expense – continuing operations 14,757 14,273 16,567 17,810 17,158 Interest expense – discontinued operations − − 4 32 33 Add: capitalized interest 16,151 16,666 15,046 13,193 14,629 Less: amortized loan fees (2,551) (2,144) (2,327) (2,278 ) (1,999) Less: amortization of debt premium/discounts (565) (750) (1,169) (1,335 ) (2,032) Cash interest 27,792 28,045 28,121 27,422 27,789 Preferred dividends 7,090 7,089 7,089 7,089 7,089 Fixed charges $ 34,882 $ 35,134 $ 35,210 $ 34,511 $ 34,878 Fixed charge coverage ratio – quarter annualized 2.7x 2.7x 2.7x 2.7x 2.6x Fixed charge coverage ratio – trailing 12 months 2.7x 2.7x 2.6x 2.4x 2.2x
Three Months Ended
December 31, Year Ended
December 31, Earnings per share − basic 2011 2010 2011 2010 Income from continuing operations $ 35,574 $ 32,550 $ 136,235 $ 78,474 Gain on sale of land parcels − 59,442 46 59,442 Net income attributable to noncontrolling interests (1,142) (944) (3,975 ) (3,729 ) Dividends on preferred stock (7,090) (7,089) (28,357 ) (28,357 ) Net income attributable to unvested restricted stock awards (270) (726) (1,088 ) (995 ) Income from continuing operations attributable to Alexandria Real Estate Equities, Inc.’s common
stockholders − basic 27,072 83,233 102,861 104,835
(Loss) income from discontinued operations (112) 8 (888) 1,106 Net income attributable to Alexandria Real Estate Equities, Inc.’s common stockholders $ 26,960 $ 83,241 $ 101,973 $ 105,941 Weighted average shares of common stock outstanding − basic 61,427,495 54,865,654 59,066,812 48,375,474 Earnings per share attributable to Alexandria Real Estate Equities, Inc.’s common stockholders –
basic: Continuing operations $ 0.44 $ 1.52 $ 1.75 $ 2.17
Discontinued operations, net − − (0.02) 0.02 Earnings per share – basic $ 0.44 $ 1.52 $ 1.73 $ 2.19
Earnings per share − diluted Income from continuing operations $ 35,574 $ 32,550 $ 136,235 $ 78,474 Gain on sale of land parcels − 59,442 46 59,442 Net income attributable to noncontrolling interests (1,142) (944) (3,975) (3,729 ) Dividends on preferred stock (7,090) (7,089) (28,357) (28,357 ) Net income attributable to unvested restricted stock awards (270) (726) (1,088) (995 ) Effect of assumed conversion and dilutive securities: Assumed conversion of 8.00% Unsecured Convertible Notes − 2 − − Amounts attributable to unvested restricted stock awards − − − − Income from continuing operations attributable to Alexandria Real Estate Equities, Inc.’s common
stockholders − diluted 27,072 83,235 102,861 104,835
(Loss) income from discontinued operations (112) 8 (888) 1,106 Net income attributable to Alexandria Real Estate Equities, Inc.’s common stockholders $ 26,960 $ 83,243 $ 101,973 $ 105,941 Weighted average shares of common stock outstanding − basic 61,427,495 54,865,654 59,066,812 48,375,474
Assumed conversion of 8.00% Unsecured Convertible Notes – 6,047 – – Dilutive effect of stock options 3,939 21,709 10,798 29,566
Weighted average shares of common stock outstanding – diluted 61,431,434 54,893,410 59,077,610 48,405,040 Earnings per share attributable to Alexandria Real Estate Equities, Inc.’s common stockholders –
diluted: Continuing operations $ 0.44 $ 1.52 $ 1.75 $ 2.17 Discontinued operations, net − − (0.02 ) 0.02 Earnings per share – diluted $ 0.44 $ 1.52 $ 1.73 $ 2.19

40 ALEXANDRIA REAL ESTATE EQUITIES, INC. ALL RIGHTS RESERVED © 2012
ALEXANDRIA REAL ESTATE EQUITIES, INC. Definitions and Other Information
December 31, 2011
Funds from operations
GAAP basis accounting for real estate assets utilizes historical cost accounting and assumes real estate values diminish over time. In an effort to overcome the difference between real estate values and historical cost accounting for real estate assets, the Board of Governors of NAREIT established the measurement tool of Funds from Operations (“FFO”). Since its introduction, FFO has become a widely used non-GAAP financial measure among real estate investment trusts (“REITs”). We believe that FFO is helpful to investors as an additional measure of the performance of an equity REIT. We compute FFO in accordance with standards established by the Board of Governors of NAREIT in its April 2002 White Paper (the “White Paper”) and related implementation guidance, which may differ from the methodology for calculating FFO utilized by other equity REITs, and, accordingly, may not be comparable to such other REITs. The White Paper defines FFO as net income (computed in accordance with GAAP), excluding gains from sales, plus real estate related depreciation and amortization, and after adjustments for unconsolidated partnerships and joint ventures. Impairment write-downs of depreciable real estate are excluded from the calculation of FFO. FFO should not be considered as an alternative to net income (determined in accordance with GAAP) as an indication of financial performance, or to cash flows from operating activities (determined in accordance with GAAP) as a measure of our liquidity, nor is it indicative of funds available to fund our cash needs, including our ability to make distributions. Future value-added projects
Land held for future development
All preconstruction efforts have been advanced to appropriate stages and no further preconstruction activities are ongoing and therefore, interest, property taxes, and other costs related to these assets are expensed as incurred. We generally will not commence new development projects for aboveground vertical construction of new life science laboratory space without first securing significant pre-leasing for such space. Land undergoing preconstruction activities (additional CIP)
Preconstruction activities include Building Information Modeling (3-D virtual modeling), design development and construction drawings, sustainability and energy optimization review, budgeting, planning for future site and infrastructure work, and other activities prior to commencement of vertical construction of aboveground shell and core improvements. Our objective with preconstruction is to reduce the time it takes to deliver projects to prospective tenants. Project costs are capitalized as a cost of the project during periods when activities necessary to prepare an asset for its intended use are in progress. We generally will not commence ground-up development of any parcels undergoing preconstruction activities without first securing significant pre-leasing for such space. If vertical aboveground construction is not initiated at completion of preconstruction activities, the land parcel will be classified as land held for future development. The two largest projects included in preconstruction consist of our 1.6 million developable square feet at Alexandria Center™ at Kendall Square in East Cambridge, Massachusetts and our 407,000 developable square foot site for the second tower at Alexandria Center™ for Life Science – New York City. Investment in unconsolidated real estate entity
Our investment in unconsolidated real estate entity represents our equity investment in a real estate entity that owns a land parcel supporting the ground-up development of approximately 414,000 rentable square feet in the Longwood Medical Area of Boston. Future redevelopment
Our asset base also includes non-laboratory space (office, warehouse, and industrial space) identified for future conversion into life science laboratory space through redevelopment aggregating approximately 1.0 million rentable square feet. These spaces are currently classified in rental properties, net. FFO per share
FFO per share (diluted) is computed using the weighted average shares of common stock outstanding determined for the basic FFO per share computation plus the effect of any dilutive securities, including the dilutive effect of stock options using the treasury stock method. Additionally, we applied the if-converted method for our 8.00% Unsecured Convertible Notes for FFO per share separately from the if-converted analysis for earnings per share. In applying the if-converted method, conversion is assumed for purposes of calculating FFO per share (diluted) if the effect would be dilutive to FFO per share. If the assumed conversion pursuant to the if-converted method is dilutive, FFO per share (diluted) would be calculated by adding back interest charges applicable to our 8.00% Unsecured Convertible Notes to the numerator and our 8.00% Unsecured Convertible Notes would be assumed to have been converted at the beginning of the period presented (or from the date of issuance, if occurring on a date later than the date that the period begins) and the resulting incremental shares associated with the assumed conversion would be included in the denominator. Furthermore, we assume that our 8.00% Unsecured Convertible Notes are converted for the period prior to any retirement or actual conversion if the effect of such assumed retirement or conversion would be dilutive, and any shares of common stock issued upon actual retirement or conversion are included in the denominator for the period after the date of retirement or conversion. For purposes of calculating FFO per share (diluted), the if-converted method was dilutive to FFO per share (diluted) for all periods presented. Gross assets
Gross assets are equal to total assets plus accumulated depreciation, less cash, cash equivalents, and restricted cash. Interest coverage ratio
Interest coverage ratio is the ratio of Adjusted EBITDA to cash interest. Net debt
Net debt is equal to the sum of secured notes payable, unsecured line of credit, unsecured bank term loans, and unsecured convertible notes, less cash, cash equivalents, and restricted cash.
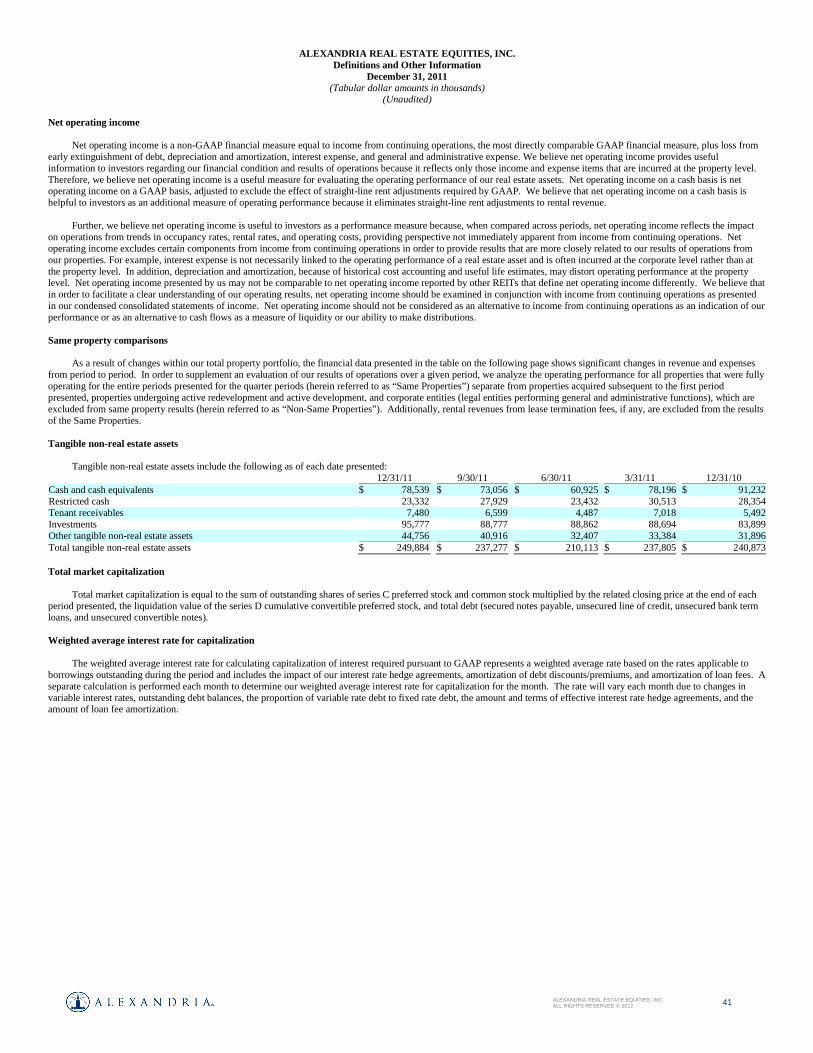
41 ALEXANDRIA REAL ESTATE EQUITIES, INC. ALL RIGHTS RESERVED © 2012
ALEXANDRIA REAL ESTATE EQUITIES, INC. Definitions and Other Information
December 31, 2011
(Tabular dollar amounts in thousands) (Unaudited)
Net operating income
Net operating income is a non-GAAP financial measure equal to income from continuing operations, the most directly comparable GAAP financial measure, plus loss from early extinguishment of debt, depreciation and amortization, interest expense, and general and administrative expense. We believe net operating income provides useful information to investors regarding our financial condition and results of operations because it reflects only those income and expense items that are incurred at the property level. Therefore, we believe net operating income is a useful measure for evaluating the operating performance of our real estate assets. Net operating income on a cash basis is net operating income on a GAAP basis, adjusted to exclude the effect of straight-line rent adjustments required by GAAP. We believe that net operating income on a cash basis is helpful to investors as an additional measure of operating performance because it eliminates straight-line rent adjustments to rental revenue.
Further, we believe net operating income is useful to investors as a performance measure because, when compared across periods, net operating income reflects the impact
on operations from trends in occupancy rates, rental rates, and operating costs, providing perspective not immediately apparent from income from continuing operations. Net operating income excludes certain components from income from continuing operations in order to provide results that are more closely related to our results of operations from our properties. For example, interest expense is not necessarily linked to the operating performance of a real estate asset and is often incurred at the corporate level rather than at the property level. In addition, depreciation and amortization, because of historical cost accounting and useful life estimates, may distort operating performance at the property level. Net operating income presented by us may not be comparable to net operating income reported by other REITs that define net operating income differently. We believe that in order to facilitate a clear understanding of our operating results, net operating income should be examined in conjunction with income from continuing operations as presented in our condensed consolidated statements of income. Net operating income should not be considered as an alternative to income from continuing operations as an indication of our performance or as an alternative to cash flows as a measure of liquidity or our ability to make distributions. Same property comparisons
As a result of changes within our total property portfolio, the financial data presented in the table on the following page shows significant changes in revenue and expenses from period to period. In order to supplement an evaluation of our results of operations over a given period, we analyze the operating performance for all properties that were fully operating for the entire periods presented for the quarter periods (herein referred to as “Same Properties”) separate from properties acquired subsequent to the first period presented, properties undergoing active redevelopment and active development, and corporate entities (legal entities performing general and administrative functions), which are excluded from same property results (herein referred to as “Non-Same Properties”). Additionally, rental revenues from lease termination fees, if any, are excluded from the results of the Same Properties. Tangible non-real estate assets
Tangible non-real estate assets include the following as of each date presented: 12/31/11 9/30/11 6/30/11 3/31/11 12/31/10
Cash and cash equivalents $ 78,539 $ 73,056 $ 60,925 $ 78,196 $ 91,232Restricted cash 23,332 27,929 23,432 30,513 28,354Tenant receivables 7,480 6,599 4,487 7,018 5,492Investments 95,777 88,777 88,862 88,694 83,899Other tangible non-real estate assets 44,756 40,916 32,407 33,384 31,896Total tangible non-real estate assets $ 249,884 $ 237,277 $ 210,113 $ 237,805 $ 240,873 Total market capitalization
Total market capitalization is equal to the sum of outstanding shares of series C preferred stock and common stock multiplied by the related closing price at the end of each period presented, the liquidation value of the series D cumulative convertible preferred stock, and total debt (secured notes payable, unsecured line of credit, unsecured bank term loans, and unsecured convertible notes). Weighted average interest rate for capitalization
The weighted average interest rate for calculating capitalization of interest required pursuant to GAAP represents a weighted average rate based on the rates applicable to borrowings outstanding during the period and includes the impact of our interest rate hedge agreements, amortization of debt discounts/premiums, and amortization of loan fees. A separate calculation is performed each month to determine our weighted average interest rate for capitalization for the month. The rate will vary each month due to changes in variable interest rates, outstanding debt balances, the proportion of variable rate debt to fixed rate debt, the amount and terms of effective interest rate hedge agreements, and the amount of loan fee amortization.