Supervisor Executive Compensation in Lucas Meijs
159
The Effect of the Level of Executive Compensation in Nonprofits on Trust and Intention to Donate How to avert the negative effects from high executive salaries in nonprofits Student Sabrina Bos 360634sb Master Program MSc International Management / CEMS Supervisor Lucas Meijs Co-reader Abe de Jong Date of completion 17-01-2013 Date of defence 01-02-2013
Transcript of Supervisor Executive Compensation in Lucas Meijs

The Effect of the Level of
Executive Compensation in
Nonprofits on Trust and
Intention to Donate
How to avert the negative effects from
high executive salaries in nonprofits
Student
Sabrina Bos
360634sb
Master Program
MSc International Management /
CEMS
Supervisor
Lucas Meijs
Co-reader
Abe de Jong
Date of completion
17-01-2013
Date of defence
01-02-2013

2
Acknowledgements
I would like to thank several people for contributing in their own way to the timely completion of
my thesis and my graduation.
My supervisor Lucas Meijs and co-reader Abe de Jong for their support, input, feedback and
flexibility that made it possible to complete my thesis within this timeframe.
My father Alexander Bos for greatly supporting this project by inviting his professional network to
participate in my study and the insightful comments (and spelling check!). I wouldn’t have been
able to reach so many people without his help.
My mother José Wittkampf for her support and the unlimited supply of cups of hot tea and always
a place to stay whenever I’m in town.
My CEMS friends for their extremely helpful insights, their company, coffee breaks,
encouragement and digital thesis support group. Everybody who joined the trips to Madrid and
Budapest and who provided me with the necessary positive energy to keep this thesis going. All
the other CEMS people for providing me with an inspiring, ambitious and greatly supportive
environment.
Last but not least, thanks to all my friends and family who filled out my questionnaire, shared my
questionnaire with their friends and to whom I could always turn for support, kind words and
advice concerning my future career and life in general.
Preface
The copyright of the Master thesis rests with the author. The author is responsible for its contents.
RSM is only responsible for the educational coaching and cannot be held liable for the content.

3
Abstract
Due to increased scrutiny on nonprofit governance, several nonprofits have faced critiques and
scandals concerning high executive salaries in recent years. This research aimed to (1) establish
empirically the negative relationship between the level of executive salaries in nonprofits and the
intention to donate from donors, (2) investigate whether this relationship can be explained by a
decrease in trust, (3) find factors that can mitigate the negative effect of high executive salaries and
(4) advise nonprofits how to avert negative effects from a high executive salary. Through a
questionnaire based on a fictional nonprofit, self-report measures were administered to a sample of
435 Dutch respondents. Making use of a statistical mediation analysis it was found that the level of
the executive salary in a nonprofit is significantly negatively related to a donor’s intention to
donate to that nonprofit and that a large part of this negative relationship is explained by trust. It
appears that when a nonprofit pays its director a high salary, donors lose trust and therefore their
intention to donate. Although the majority of respondents indicated that nonprofit directors should
earn less than their for-profit counterparts and that the level of the executive salary in a nonprofit is
important in the decision to donate, most respondents would not actively look for the level of
salary in the search to which organization to donate. Therefore, the finding that high salaries could
be (partly) justified through the communication of a strong performance and a low administrative
ratio is very important. It appeared that if a strong performance and a low administrative ratio are
communicated under a high executive salary scenario, the negative effect of the high executive
salary is mitigated. This indicates that a high executive salary does not need to cause a scandal per
se and that it is of utmost importance to consider how, about what and when to communicate to
donors in order to justify high executive salaries. For nonprofits to avoid future salary scandals, it
is important to understand that donors could accept higher salaries if the nonprofit is performing
well and spends the majority of their income on the cause and this is communicated properly and
in a timely manner.

4
Table of content
1. Introduction 9
2. Literature review 13
2.1 Trust in nonprofits 13
2.2 Intention to donate 15
2.3 Executive compensation in nonprofits 17
2.3.1 Arguments for higher salaries 19
2.3.2 Arguments for lower salaries 20
2.3.3 Pay for performance in nonprofits 21
2.3.4 Donor’s view on salaries in nonprofits 22
2.4 Alterable attributes to build trust and the intention to donate 24
2.4.1 The performance of a nonprofit 25
2.4.2 The administrative ratio of the nonprofit 26
2.4.3 The reputation of a nonprofits’ board 27
3. Hypothesis building 30
4. Method 32
4.1 Procedure 32
4.2 Measures 33
4.2.1 Independent variable – level of executive salary in a nonprofit 34
4.2.2 Dependent variable - intention to donate 34
4.2.3 Mediator – trust 35
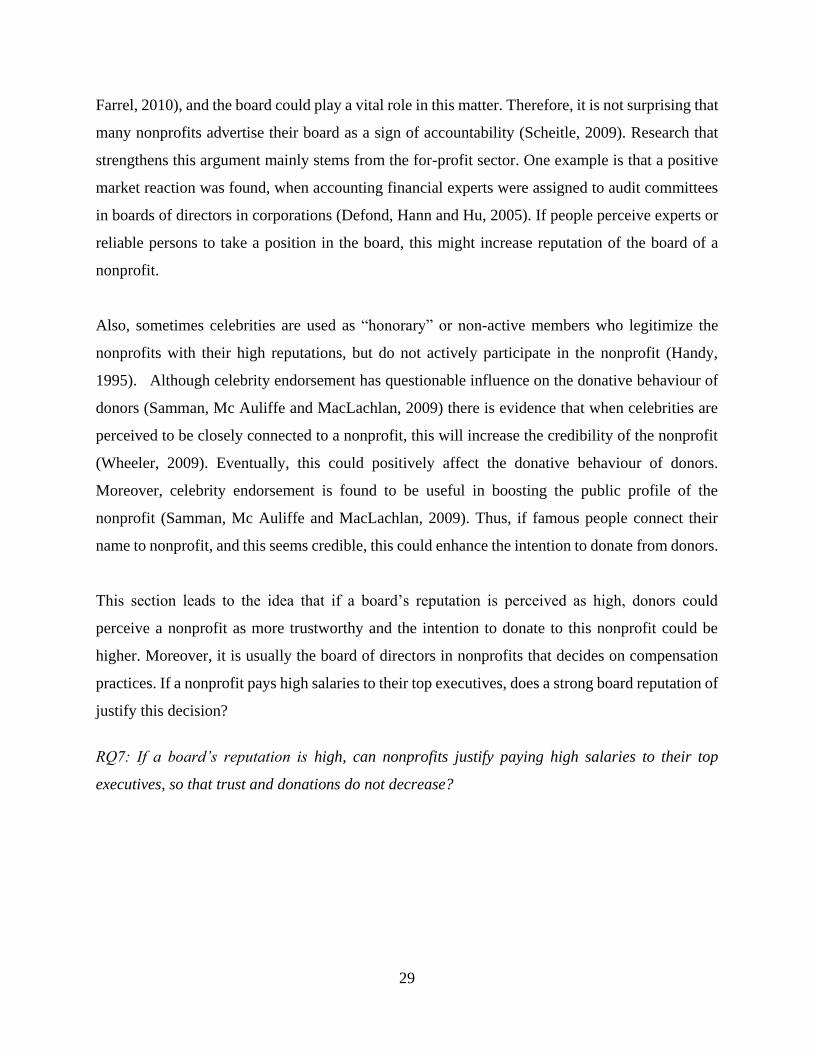
4.2.4 Performance 37
4.2.5 Administrative ratio 37
4.2.6 Reputation of the board 37
4.2.7 Control variables 38
4.3 Questionnaire 38
4.3.1 Unit of analysis 39
4.3.2 The “trust filter” 40
4.3.3 Notification of the salary 40
4.3.4 Background questions 41
4.4. Data collection and sample 41
5. Empirical results 44
5.1 Introduction to the data 44
5.2 Mediation analysis 46
5.3 The effects of performance, administrative ratio and reputation 47
5.4 Background questions 50
6. Analysis 53
6.1 Correlation analysis 53
6.2 Mediation analysis 54

5
6.3 Performance 55
6.4 Administrative ratio 57
6.5 Reputation of the board 58
6.6 Summary 59
6.7 Background questions 60
7. Discussion 62
8. Risks and limitations 69
9. Future research 72
10. Practical implications 74
11. Conclusion 75
Literature 77

6
List of Appendices
Appendix 1: Available scales for intention to donate and trust 88
Appendix 2: Variables in SPSS 89
Appendix 3: Questionnaire 90
Appendix 4: Blogpost 101
Appendix 5: Statistical output 104
5.1 Background 104
5.1.1 Scale reliability analysis: trust 104
5.1.2 Scale reliability analysis: intention to donate 105
5.1.3 Frequencies and assumptions control variables 106
5.1.4 Assumptions 110
5.1.5 Correlations: pearson correlation and spearman’s rho 111
5.2 Mediation analysis 113
5.2.1 Regression 1: x - y 113
5.2.2 Regression 2: x- m 115
5.2.3 Regression 3: m - y 117
5.2.4 Regression 4:. X - (m) - y 119
5.3 Mediation with control variables 122
5.4 Performance 126
5.4.1 Scale reliability: trust with performance 126
5.4.2 Scale reliability: intention with performance 127
5.4.3 Assumptions 128
5.4.4 Regression: performance - trust 129
5.4.5 Regression: performance - intention 131
5.4.6 One-way Anova 133
5.4.7 Paired sample t-test 134
5.5. Administrative ratio 135
5.5.1 Scale reliability: trust with administrative ratio 135
5.5.2 Scale reliability: intention to donate with administrative ratio 136
5.5.3 Assumptions 137
5.5.4 Regression: administrative ratio - trust 138
5.5.5 Regression: administrative ratio - intention 140
5.5.6 One-way Anova 142
5.5.7 paired sample t-test 143
5.6 Reputation 144
5.6.1 Scale reliability: trust with reputation 144
5.6.2 Scale reliability: intention with reputation 145
5.6.3 Assumptions 146
5.6.4 Regression: reputation - trust 147

7
5.6.5 Regression: reputation - intention 148
5.6.6 One-way Anova 151
5.6.7 Paired sample t-test 152
5.7 Extra questions 153
5.7.1 Descriptives & frequencies 153
5.7.2 Correlations 157
5.7.3 Correlations with control variables 158
5.7.4 Independent sample t-test 159

8
Overview tables and figures
Table 1: Trustworthiness as signals for nonprofits 25
Table 2: Overview research questions and hypotheses 1 to 4 30
Table 3: Overview research questions and hypotheses 5 to 7 31
Table 4: Pre-test to determine what people see as high and low salary 34
Table 5: Causal steps mediation analysis 36
Table 6: Overview of treatment groups 37
Table 7: Sample size of the study among treatment groups 43
Table 8: Mean, Standard Deviation and Correlation from Pearson correlation test 44
Table 9: Summary table of demographics of respondents 45
Table 10: Reliability of scales used in study 45
Table 11: Summary of regression models h1, h2, h3, h4 45
Table 12: Regressions for performance, administrative ratio and reputation 47
Table 13: One-way Anova - performance, administrative ratio and reputation 48
Table 14: Paired sample t-tests - performance, administrative ratio and reputation 49
Table 15: Statistics and assumptions background questions 50
Table 16: Correlation analysis with salary, trust and intention to donate 51
Table 17: Correlation analysis with control variables 51
Table 18: Frequencies background questions in percentages 52
Table 19 : Age * education crosstabulation 53
Table 20 : Age * income level crosstabulation 54
Table 21: Summary of hypotheses 59
Figure 1: Conceptual model 31
9
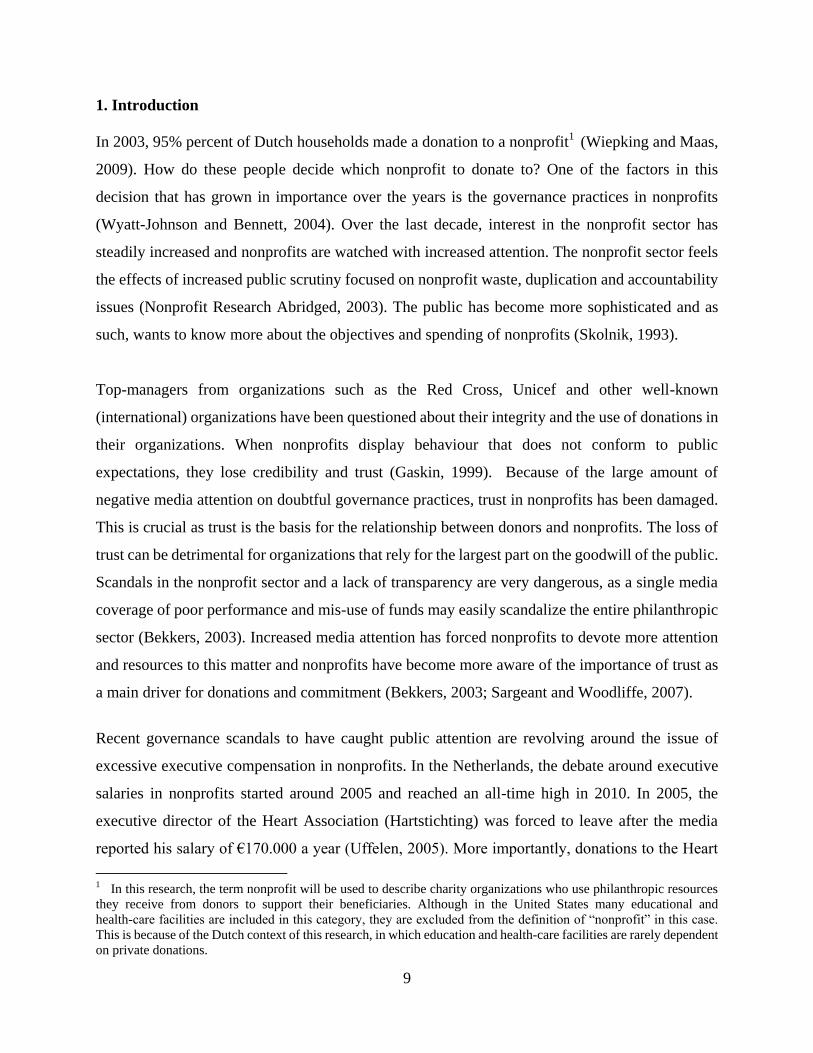
1. Introduction
In 2003, 95% percent of Dutch households made a donation to a nonprofit1 (Wiepking and Maas,
2009). How do these people decide which nonprofit to donate to? One of the factors in this
decision that has grown in importance over the years is the governance practices in nonprofits
(Wyatt-Johnson and Bennett, 2004). Over the last decade, interest in the nonprofit sector has
steadily increased and nonprofits are watched with increased attention. The nonprofit sector feels
the effects of increased public scrutiny focused on nonprofit waste, duplication and accountability
issues (Nonprofit Research Abridged, 2003). The public has become more sophisticated and as
such, wants to know more about the objectives and spending of nonprofits (Skolnik, 1993).
Top-managers from organizations such as the Red Cross, Unicef and other well-known
(international) organizations have been questioned about their integrity and the use of donations in
their organizations. When nonprofits display behaviour that does not conform to public
expectations, they lose credibility and trust (Gaskin, 1999). Because of the large amount of
negative media attention on doubtful governance practices, trust in nonprofits has been damaged.
This is crucial as trust is the basis for the relationship between donors and nonprofits. The loss of
trust can be detrimental for organizations that rely for the largest part on the goodwill of the public.
Scandals in the nonprofit sector and a lack of transparency are very dangerous, as a single media
coverage of poor performance and mis-use of funds may easily scandalize the entire philanthropic
sector (Bekkers, 2003). Increased media attention has forced nonprofits to devote more attention
and resources to this matter and nonprofits have become more aware of the importance of trust as
a main driver for donations and commitment (Bekkers, 2003; Sargeant and Woodliffe, 2007).
Recent governance scandals to have caught public attention are revolving around the issue of
excessive executive compensation in nonprofits. In the Netherlands, the debate around executive
salaries in nonprofits started around 2005 and reached an all-time high in 2010. In 2005, the
executive director of the Heart Association (Hartstichting) was forced to leave after the media
reported his salary of €170.000 a year (Uffelen, 2005). More importantly, donations to the Heart
1 In this research, the term nonprofit will be used to describe charity organizations who use philanthropic resources
they receive from donors to support their beneficiaries. Although in the United States many educational and
health-care facilities are included in this category, they are excluded from the definition of “nonprofit” in this case.
This is because of the Dutch context of this research, in which education and health-care facilities are rarely dependent
on private donations.

10
Association in the Netherlands fell by 8% in the following year after this incident. Similarly, it was
reported in 2010 that the director of SNV Netherlands, a heavily subsidized development
organization, earned over €180.000 a year. This amount was justified by the organization stating
that the director had lost 30%-50% of his income when he made the switch from the ABN Amro
bank to the nonprofit organization and that it is a complex institute with many employees
(Mikkers, 2010). The voluntary nonprofit salary norm at the time was €121.000 and the Dutch
government forced the salary of the CEO down by threatening with subsidy cuts. Similarly, the
Dutch Red Cross was forced to cut the salary of their director when the ministry of foreign affairs
threatened to cut subsidies if they would not comply with the salary norms (Trouw, 2010). The
salience of this topic is underlined by the fact that the CBF (the Central Bureau for Fundraising in
the Netherlands) has received an increased amount of complaints about the salaries of executives
and has decided to publish this data publicly on their website (CBF, 2009; CBF, 2011). Scandals
and subsequent sanctions by the government are not only known in the Netherlands, but also
abroad. For example, the US government has taken steps to better control salaries, and the
Internal Revenue Service (IRS) can impose fines or even withdraw the tax-exempt status of a
nonprofit (Guidestar, 2011) if salaries are perceived to be exorbitant.
Because of the above (and more) incidents surrounding excessive compensation, this issue is now
a top concern in nonprofit governance (Wyatt-Johnson and Bennett, 2004). Although it already
became clear in 1994 that revelations about executive compensation in the nonprofit sector forced
the public and the government to watch the nonprofits with increased scrutiny (Herzlinger, 1994),
it hasn’t been until recently that this topic also has received attention from scholars (Bekkers,
2003; Wyatt-Johnson and Bennet, 2004; Balsam and Harris, 2012). It has been determined that
high executive salaries in nonprofits are a major factor to make people stop giving (Bekkers,
2006) and that media attention surrounding nonprofit executive compensation has led to a
dramatic decrease in private donations for some nonprofits (Balsam and Harris, 2012).
While simply lowering executive salaries to maintain trust and donations seems like a viable
solution, the situation is complex. There are many reasons why especially large, international and
complex nonprofits want to offer their executive salaries that are competitive. However, it seems
that high executive salaries create negative externalities for the nonprofits in terms of decreased
trust and donations because they are perceived as wasteful (Sargeant and Lee, 2004).

11
Due to the largely anecdotal base of evidence on this topic (Balsam and Harris, 2012), the aim of
this research is to empirically establish and explain the negative relationship between high
executive salaries in nonprofits and charitable behaviour from donors.. Thus, the question central
in this research is “why do high executive salaries decrease donations and how can this negative
effect be averted”.
On top of this, this research aims to identify factors that a nonprofit organization can influence in
order to mitigate the negative effect deriving from high executive salaries. It is crucial to note that
any variables over which nonprofits can exert control or that can influence a nonprofits’ operating
capacity are of great importance to investigate (Sargeant, Ford and West, 2006; Hou, Du and Tian,
2009). Therefore, it is important to identify those factors that a nonprofit can actively use to
explain why their directors earn the salaries they do, in order to legitimize this to their donors.
Through a combination of signalling theory on nonprofits (Reinhardt, 2009) attributes of
trustworthiness (Lee and Turban, 2001) and the theory of planned behaviour (Azjen, 1991) this
research proposes a model in which the effect of high executive salaries on intention to donate is
mediated by trust. Moreover, several factors are examined that can possibly offset the negative
effect of high salaries on donations.
The relevance of this study is underscored by the observation that donations decrease with higher
executive salaries. Moreover, due to the attention this matter has received in the media the last
couple of years executive salaries in nonprofits have become a more salient topic and can
dramatically influence a donor’s perception of and the trust in a nonprofit. Not only is trust is a
crucial factor in the donor-nonprofit relationship, but suffering from a loss of trust through the
misuse of donations can cause reduced income and volunteers, which severely limit a nonprofits’
operating capacity. Although several studies have addressed the importance of trust in the
nonprofit context, there are few empirical studies that have focused on the role of trust in the
donor-nonprofit relationship (Sargeant, Ford and West, 2006). This relationship is important,
because in times of increased competition for funding, maintaining the trust and loyalty of your
donors is more important than ever. This idea is supported by the fact that a large percent of the
total amount donated stems from the general public (Hibbert, Horne, 1997).

12
As stated before, although this topic has received increased attention from scholars most evidence
on this topic is rather anecdotal (Balsam and Harris, 2012). Therefore, empirical studies in this
area can provide important theoretical and practical implications. From a theoretical perspective,
this research will contribute to the knowledge about compensation practices in nonprofits and the
trust in nonprofits. Moreover, the results of this research will increase the knowledge base about
donor behaviour and donation decisions and in what ways nonprofits can influence these. Also,
this research will add to the theory of planned behaviour (Azjen, 1991) by taking as independent
variable a factor that a nonprofit can influence instead of factors such as values, attitudes or
demographic variables. From a practical perspective, this research will give nonprofits a deeper
insight in nonprofit compensation practices and how their donors perceive this issue. Additionally,
nonprofits will be more informed about how to handle negative media coverage about high
salaries, as they will be able to communicate relevant factors to their stakeholders to offset the
negative effects.

13
2. Literature review
As first part of this research and as basis for the hypothesis formulation, the following literature
research will shed more light on different topics of importance. Firstly, in section 2.1, trust and its
application in the nonprofit setting will be explored. Then, section 2.2 will explore the motivation
of donors to donate to nonprofit. Next, section 2.3 will cover the existing literature on executive
compensation and the role this can play on the intention to donate from a donor’s perspective. To
conclude, section 2.4 will investigate different factors that can possibly legitimize high executive
salaries in nonprofit.
2.1 Trust in nonprofits
Trust is a construct that has been covered extensively in nonprofit literature (Bekkers, 2003;
Bennet en Barkensjo, 2004; Uslaner and Brown, 2005; Bekkers, 2006; Sargeant, Ford and West,
2006; Evers and Gesthuizen, 2011). But what exactly is trust? Cabral (2005) defines trust in its
most basic form as the situation “when agents expect a particular agent to do something”. Also,
trust is described as a personal and subjective phenomenon that is based on various factors or
evidence such as personal experiences or referrals from others (Josang, Ismail and Boyd, 2007,
p.621). Thus, in the nonprofit setting, trust can refer to the extent of donor belief that a charity will
behave as expected and fulfil its obligations (Sargeant, Ford, and West, 2006). Similarly,
charitable confidence is a generally positive attitude towards fundraising organizations. People
who have confidence in fundraising organizations think that, generally speaking, fundraising
organizations are trustworthy, honest, accountable, effective, have good intentions, and are
deserving of public support (Bekkers, 2006). Bennet and Barkensjo (2004) add to this by
describing trust in a nonprofit-donor context as the assumption that the nonprofit is credible,
reliable, sincere and honest and can be relied upon that it uses the gift wisely and will serve the
interests of its beneficiaries in a good way.
But why is trust such a crucial factor in the donor-nonprofit relationship? Firstly, trust is an
especially important factor under conditions of uncertainty and risk (Lee and Turban, 2001) and
secondly, trust is crucial for the nonprofit sector “to ensure public goodwill and maintain or
increase support in the form of donations of money and time” (Gaskin, 1999, p164).

14
To start with, trust is important because nonprofits face a major transparency issue. First of all, in a
philanthropic setting the donor, who basically purchases the service or product, finds himself in a
poor position to determine whether the product or service is actually performed by the
organization and often does not know the beneficiary (Hansmann, 1980). Hence, in order for
nonprofits to exist, donors need to have trust in them that they do their job. Secondly, in contrast to
for-profit organizations, it is difficult to measure the performance of a nonprofit. Regular
accounting measures are often inappropriate as they do not relate to the mission of an organization
(Sawhill and Williamson, 2001) and nonprofits often aim to solve social problems such as poverty
or the violation of human rights which are extremely hard to solve and thus the quality of their
work is hard to observe (Bekkers, 2006). The lack of transparency inherent to nonprofits increases
the cost of information and inhibits rational decision making when it comes to making donations.
Because it is difficult and costly to gather reliable information, donors rely on their perception of
trustworthiness of an organization in their decision to donate (Bekkers, 2003).
Moreover, trust is crucial because there is a strong positive relationship between trust and
charitable behaviour. Trust has been found to be a significant predictor of volunteering and giving
to nonprofits (Uslaner and Brown, 2005). Moreover, Cheung and Chang (2000) found trust to be
an important predictor of intention to donate to international relief organizations. Trust on the
individual and the national level are both positively related to donating behaviour (Evers and
Gesthuizen, 2011) and those people who believe in the honesty and ethical responsibility of
nonprofits, are more likely to give, give more and are more likely to volunteer than people who do
not have trust in nonprofits (Nonprofit Research Abridged, 2003). Thus, there exists the belief that
if trust in nonprofits is higher, nonprofits would have access to more resources (Bekkers and
Bowman, 2009). People with little or no confidence give 50% less than people with some
confidence. Similarly, people with some or much confidence give 50% more than people with
some confidence (Bekkers, 2006). Next to this, 84% of millenials (aged 20-35) confirm that they
are most likely to donate to a nonprofit when they trust the organization, and the noteworthy
amount of 90% of millenials would stop giving if they don’t trust a nonprofit (Millenial Donors,
2011). Bekkers (2006) supports this and finds that a loss of trust in a nonprofit is often cited as a
reason to stop giving.

15
To conclude, it is important to retain donors by maintaining trust, in order to secure donations as
competition for donors is extremely high (Oster, 1995; Skolnik, 1993) and it is easy for donors to
leave one charity and donate to another. But how do donors choose to donate to a nonprofit? The
intention to donate from donors will be discussed in the next section.
2.2 Intention to donate
The voluntary input of a donor can be defined as gifts in time and money (Meijs, 2010). In terms of
monetary income, private donations are a main source of revenue for nonprofits (Balsam and
Harris, 2012) and donative nonprofits even rely for the largest part of their income on donations
(Hansmann, 1980). However, private donations are known to be very unpredictable and unstable
(Froelich, 1999). It is therefore important to examine how and why donors decide to give to certain
nonprofits. When analyzing why donors decide to give to a specific nonprofit it is important to
realize that nonprofits operate in a highly non-transparent setting. Donors, nonprofits and
beneficiaries are usually far away from each other and the cost of getting reliable information is
relatively high. Therefore, in their decision to which nonprofit to donate, donors try to save time
and effort by looking for signals that the nonprofit sends out (Reinhardt, 2009). This goes in two
steps: first, donors sort themselves by “unalterable attributes” to scale down their search for a
nonprofit. Then, donors turn to “alterable attributes” (or signals) that the nonprofits can influence,
in order to make their choice to which nonprofit to donate.
Unalterable attributes
Factors as age, religion (Reinhardt, 2009), altruism, a donor’s values, the cost of giving (Bekkers
and Wiepking, 2011), moral obligation (Cheung and Chan, 2000), the affinity with the cause
(Sargeant and Woodliffe, 2007), disposable income (Frumkin and Kim, 2001) or attitude, norms
and perceived control as in the theory of planned behaviour (Azjen, 1991; van der Linden, 2011)
can be seen as unalterable attributes as the nonprofit cannot influence these. Donors sort
themselves by these attributes. This has been the focus of most research to date: to explain donor
decisions without taking into account the activities of the nonprofit who receives the donation
(Frumkin and Kim, 2001). Van der Linden (2011) underscores this by stating that most research
has focused on demographic and socio-economic variables to explain charitable behaviour.

16
Alterable attributes
The focus of this is research is on the so-called alterable attributes, or signals. Nonprofits try to
send signals to donors, to convince them to donate to their nonprofit. Hence, these signals are
factors that nonprofits can shape and influence, to convince donors of the need to donate to this
nonprofit. Such signals can be the nonprofits’ mission (Frumkin and Kim, 2001), perceived
professionalism, accountability (Reinhardt, 2009) or efficacy (Bekkers and Wiepking, 2011).
Reinhardt (2009) states that nonprofits can signal their trustworthiness to donors and so
communicate that they are nonprofits that need their donation. Sending the proper signals is
important, as “donors give their money to the most skillful signalers” (Reinhardt, 2009, p. 303).
Due to an increased competition for donors among nonprofits, it can be argued that it will be more
important for organizations to differentiate themselves by alterable attributes. Therefore, this study
focuses on alterable attributes which a nonprofit can use to influence the intention to donate from a
donor. According to the theory of planned behaviour (TBP) intention is seen as a main determinant
of behaviour (Azjen, 1991). This implies that the more a person intends to do something, the more
likely this person is to actually do it. People are expected to do something when the opportunity
arises (Azjen, 1991). However, most research to date has focused on explaining charitable
behaviour based on factors that cannot be influenced such as demographic or socio-economic
features (van der Linden, 2011). The difference this research makes is that it does not take the
personal characteristics of a donor or the theory of planned behaviour variables as a predictor of
charitable behaviour2, but looks at the intention to donate from donors, affected by alterable
attributes that a nonprofit can influence. Thus, this research looks at factors a particular nonprofit
can influence in order to enhance the intention to donate from donors in contrast to psychological
or socio-economic attributes that the nonprofit can hardly exert any influence over. This study
measures the intention to donate and not the actual donating behaviour. Although there exists a
so-called intention-behaviour gap, intention is generally accepted as a valid proxy for actual
behaviour (Hyde and White, 2007; van der Linden, 2011). Also, if intention would be perfect
2 Most older research using the theory of planned behaviour has focused on non-alterable attributes as do more recent
extended TBP models. For example, Smith and McSweeney (2007) focus on attitudes, norms, perceived behavioural
control (which are the TBP variables) and past charitable behaviour. Hyde and White (2007) focus on, next to
attitudes, norms and perceived behavioural control, on self-identity and moral norms in the context of intention to
donate organs. Both studies confirm the applicability of the theory of planned behaviour in a charitable giving context.

17
predictor of behaviour in an empirical sense, it would become a redundant concept (Cheung and
Chan, 2000) as behaviour could be measured directly.
Linking trust and intention to donate, the previous section has provided strong evidence that trust
in a nonprofit is related to charitable behaviour. Therefore, similar to the research of Lobb,
Mazzocchi and Trail (2007), this study posits that trust has a positive relation with intention to
donate. Therefore the first step in this research will be to replicate previous findings on the
relationship between trust and the supportive behaviour of donors. This leads to the following
sub-question:
RQ1: “Does trust in a nonprofit increase the intention to donate?”
However, next to examining reasons why donors decide to give to nonprofits, it is equally or
maybe even more important to analyze why donors stop donating to specific nonprofits. This is
supported by the idea that donors have a high turnover rate and the costs of attracting new donors
are substantial (Bennett and Barkensjo, 2005). If money (as opposed to volunteered time) is
donated to a nonprofit and the donor has the feeling that this money is misused, it can be reclaimed
by the donor (Meijs, 2010). Thus, everything should be done in order to prevent the donor from
reclaiming his money, or to stop donating. Sargeant (2001, p. 179) describes a variety of reasons
why donors stop supporting a nonprofit organization: they cannot afford it any longer, they choose
to support another organization or believe they will receive higher service somewhere else, they
exit the market or develop a change in attitude toward a voluntary organization and thus terminate
their giving. Some of these factors cannot be influenced by the nonprofit, while others can. One
reasons cited increasingly often as a reason to stop giving to a nonprofit are high executive salaries.
2.3 Executive Compensation in nonprofits
Donors can perceive high executive salaries as negative signals in the sense that nonprofits spend
too much money on organizational issues and not on the mission. It appears that the executive
compensation level in nonprofits is a major source of distress for donors these days (Bekkers,
2003; Gaskin 1999; CBF, 2009; Charity Navigator, 2012). There exists a strong paradox: people
want a nonprofit to be managed well, nonprofits need good people for their top-management

18
positions as their organizations are complex and they need to compete in the “war for talent” by
offering competitive salaries. However, at the same time, nonprofits bear the risk that a high salary
could hurt the trust donors have in an organization and ultimately leads to a decrease in donations.
In this section, the background behind this paradox will be explored.
Much of the discussion around salaries in nonprofits revolves around the question of whether
nonprofit employees should earn less, equal or higher wages than their for-profit counterparts. To
begin with, it seems that many people are surprised that nonprofits managers are paid at all as they
assume that nonprofits are solely run by volunteers (Skolnik, 1993; Charity Navigator, 2012)3.
However, most employees and directors in nonprofits do get paid. But how much this actually is
has been a topic of debate for a long time. Oster stated in 1998 that nonprofit jobs pay less for
workers with comparable characteristics and that nonprofit also offer fewer benefits to their
employees.. However, according to Ridder, Piening and Baluch (2012) the literature provides
conflicting evidence regarding the level of compensation within nonprofits relative to the level of
for-profit organizations – top-management salaries are sometimes lower, equal or higher than
similar positions in for-profit corporations.
Obviously, there are significant differences between running a nonprofit and a for-profit business.
As Oster (1998, p219.) puts it nicely: “The American Red Cross is not exactly like running IBM”.
Nonprofits especially differ from for-profit organizations in their governance structure. Most
nonprofit organizations have a governance structure that consists of an unpaid, outside part-time
board and one or more full-time, paid executive officers (Drucker, 1990). O’Regan and Oster
(2005, p. 207) state that board members “should bring to an organization the three W’s: wealth
(donations and fundraising), wisdom (monitoring and oversight), and work (operational duties).
Therefore, it is often the board of the nonprofit that designs the strategy and policies (Hansmann,
1980), determines the mission and purpose of a nonprofit, evaluates the CEO (Miller-Millesen,
2003) and also often decides on the height of executive salaries (Scheitle, 2009). Although
nonprofits are not allowed to distribute their profits to third parties (a phenomenon called the
nondistribution-constraint), they are free to pay any person for the labour they provide (Hansmann,
1980). Whether this is more or less than the market rate is up to the nonprofit itself.
3 That this is not a completely unreasonable assumption proves Scheitle (2009) by stating that approximately twenty
percent of Christian nonprofits in the US do not provide any compensation to their employees (Scheitle, 2009).

19
2.3.1 Arguments for higher salaries
There are several arguments in favour of paying nonprofit managers equal or higher salaries than
managers in for-profit organizations. Handy and Katz (1998) discuss the efficiency wage
hypothesis, which proposes that nonprofits should pay higher salaries because monitoring in
nonprofits is difficult because of information asymmetry. Then, higher salaries will impose a
greater penalty for people who misbehave and get fired, thus people are expected to behave better.
However, the main argument for higher salaries is that in order to run a philanthropic organization
most effectively and attract high calibre managers, a nonprofit must pay at market level or higher.
It is argued that nonprofits need to pay higher salaries in order to attract capable executives.
Nonprofits try to fulfil their missions in response to a large variety of stakeholders and it is
important to have an executive who can answer to donors, clients, government, the general public
and other stakeholders. CEO’s of large nonprofit organizations often run multi-million dollar
operations that aim to change the world and thus need capabilities similar to a for-profit CEO
(Charity Navigator, 2009; Balsam and Harris, 2012). Herzlinger (1994) explains that for example
the compensation of a tenured professor at a college is a fixed expense that an organization has to
incur in order to function. Similarly, compensation of a top-executive can be seen as a fixed
expense that needs to be incurred in order to have someone with the appropriate capabilities run
the organization. Wallis and Dollery (2005) mention the relationship between the quality of the
leadership and the performance of a nonprofit. Higher salaries would ensure a certain degree of
professionalism in the organization. Increased competition for funds and the increased pressure on
nonprofits to find more effective management methods highlight the importance of human
resources for nonprofits. Because of the intangible and hard-to-assess nature of the services
nonprofits provide, it is even more important to have qualified personnel (Oster, 1995).
Prospective employees do not only look for intrinsic but also surely extrinsic rewards when
evaluating job opportunities, so salary and other benefits should be used to attract talent (Reeves,
2010) , also in nonprofits. As Scheitle (2009) puts it, executives who are not compensated
(enough) are basically volunteers, who must have other commitments or jobs in order to earn
money. It does not matter how much “psychological income” a nonprofit employee receives
(Manzo, 2004) , people still need to make a living. In other words, lower salaries do not improve

20
the professionalism of the organization. Especially when organizations grow larger, nonprofits
cannot solely be managed by good intentions, but need professional management (Drucker, 1990;
Oster 1995; Scheitle, 2009). Additionally, Oster (1998) and Chasteen and Lampkin (2012) discuss
that that organizational size appears to be a strong predictor of executive compensation. It seems
logical that the size of an organization should play a role in determining executive compensation,
as it reflects the responsibilities and the quantity of resources controlled by the executive. Hence,
one could expect a large organization to be more complex, and thus needs higher qualified people
to manage it, whom in consequence should be higher paid.
Additionally, Oster (1998) points out the little market mobility of nonprofit executives. This type
of managers usually comes from ranks specific to their organizations and is significantly different
from other professions. Thus, there is not a large supply of qualified nonprofit managers, so
salaries must be competitive in order to attract and retain the best people.
2.3.2 Arguments for lower salaries
There are also several arguments for offering nonprofit employees and manages lower salaries
than they would earn in a similar position in a for-profit organization.
Mainly, it is argued that because people choose to work for a nonprofit organization, they have
intrinsic motivation and do not have to be extrinsically rewarded. Ridder, Piening and Baluch
(2012) discuss that employees in the nonprofit sector have different needs, motivations and reward
preferences. They tend to attach more value to non-monetary rewards and to the organization
fulfilling its mission. It seems that employees in nonprofits are willing to exchange extrinsic for
intrinsic rewards and thus don’t have to be paid as much as their for-profit counterparts. It is
assumed that workers give up salary and benefits in order to take nonprofit jobs with an ideological
character. Preston (1989) calls this phenomenon “labour donations” in the sense that people give
up pay in exchange for working in socially worthwhile organizations. Thus, wages can be seen as
a sorting mechanism for employees in the nonprofit sector. Handy and Katz (1998) confirm this
and suggest that lower wages are used as a self-selection mechanism among managerial employees
and that this will enhance trust in an organization.

21
Additionally, Oster (1995) adds that nonprofits offer more task independence and less-controlled
working environments, indicating that workers in nonprofits are willing to trade salary for working
conditions. To conclude, Wyatt-Johnson and Bennett (2004) observed that the best nonprofit
CEO’s are not very concerned with their personal compensation, but are focused on the challenges
of the nonprofit sector and are motivated by their achievements.
2.3.3 Pay for performance in nonprofits
One way to pay people according to their value for an organization is pay for performance.
However, there is a fierce discussion about the appropriateness and the possibility to have
performance pay in nonprofits. Firstly, performance pay is expensive and difficult to design and
set up. Therefore, incentive-based compensation in nonprofits would be most applicable to people
in the later stages of their career, like executives (Reeves, 2010). Moreover, outputs of nonprofits
are typically not priced in the conventional way, so market-based performance measures are
absent. Baber, Daniel and Roberts (2002) propose that accounting indicators may help nonprofits
monitor their manager’s performance. They do point out however, that many nonprofits pursue
nonfinancial objectives which are hard to assess (Baber, Daniel and Roberts, 2002). Thus, for
nonprofits it is hard to link pay to performance because performance is hard to measure. In
addition, Oster (1998) states that strong reliance on performance pay could be counterproductive
when objective measures of performance are not in place. Nevertheless, Zingheim, Schuster and
Thomsen (2005) argue that it is the boards’ job to have good governance that rewards people based
on clearly established performance measures that reflect organizational outcomes. Also, they posit
that executive compensation has to be reasonable, competitive, consistent with what other
organizations pay for the same role and based on actual performance.
That this is not an easy task is pointed out by Oster (1995), who highlights that there is little use of
incentive contracts in the nonprofit sector. Not only is performance difficult to measure, also the
fact that donors or other stakeholders may see pay for performance or high salaries in nonprofits as
an infringement of the nondistribution clause makes performance for pay difficult. This could in
turn lead to a loss of trust and a damaged reputation for the nonprofit (Oster, 1995).

22
2.3.4 Donor’s view on salaries in nonprofits
The nature of pay makes it impossible to create one formula that answers to what level of
executive compensation is competitive and what is too much (Wyatt-Johnson and Bennett, 2004).
Chasteen and Lampkin (2012) use a measure of “greater than 2 standard deviations from the
mean” to define reasonable compensation but even the Internal Revenue Service in the US (IRS)
does not have a standard definition for “fair” and “reasonable” (Guidestar, 2011; Chasteen and
Lampkin, 2012). To add to the confusion, it is likely that there will remain a discrepancy between
what donors, media, government or other stakeholders may perceive as exorbitant or what they
may consider to be reasonable (Guidestar, 2011).
Based on the above discussion, it is not surprising that stakeholders of nonprofits have different
reactions to salary levels in nonprofits. It seems that the general public is mostly in favour of the
argument to pay nonprofit executives lower salaries, because they decide to work for nonprofits.
Basically, paying high salaries is seen as a violation of the non-distribution constraint (Balsam and
Harris, 2012). Not only do high executive salaries give stakeholders the impression that the
organization is making a profit - exactly what it shouldn’t do - but it also seems that high executive
salaries are seen as opportunism by the nonprofit and that donors perceive the organization to
mis-use their donations (Torres-Moraga, Vásquez-Parraga and Barra, 2010). This is confirmed by
the overwhelming majority (93%) of participants in a research by the Dutch Consumentenbond
stating to be very annoyed with high executives salaries in nonprofits. This was also frequently
cited as a reason to stop giving to a nonprofit (Consumentenbond, 2005).
To date there has been little empirical evidence stating that a high executive salary in a nonprofit
decreases the trust in this nonprofit. However, there is evidence pointing to this direction. Some of
the most striking evidence on this issue comes from McMillan, Money, Money and Downing
(2005) who found non-opportunistic behaviour to be the most important determinant of trust.
Thus, if high salaries are seen as opportunistic behaviour, this might strongly affect the trust in an
organization. Moreover, the CBF states in their annual report that two-third of their respondents
state that executive salaries were a main determinant of trust in a nonprofit, but this data has not
been linked to a possible decrease in the intention to donate from donors (CBF, 2009). Also, the
Nederlands Donateurspanel states that media attention surrounding high executive salaries in 2010

23
could have decreased the general trust in nonprofits (Het Nederlands Donateurspanel, 2010). It
seems that the trust of the public in organizations is easier to destroy than to build (Poppo and
Schepkens, 2010). Additionally, Poppo and Schepkens (2010) discuss that violations involving
integrity (cases as mis-use of donations or fraud) normally have a stronger negative effect on trust
than competence violations. Moreover, Handy and Katz (1998) suggest that nonprofits use lower
wages to create trust in the organization, because only managers who are really committed will
take a lower salary for granted. This discussion leads to the following sub- question:
RQ2: Does a high executive salary in a nonprofit negatively influence trust in a nonprofit?
Next to the idea that high executive salaries can negatively influence trust, there has been
empirical research that found that high executive salaries can have a negative influence on
donations. Parsons (2007) discusses the finding that financial accounting information can impact
an individual’s giving decision. Therefore, it can be that information surrounding an executive’s
salary can influence the intention to donate. The direction of this influence seems to be clear:
Balsam and Harris (2012) and Bekkers (2003) found that higher executive salaries are negatively
related to the level of donations and the commitment to a nonprofit. More specifically, Balsam and
Harris (2012) found that nonprofits that had their executive salary mentioned in the media
experienced 19% less growth in donations by individual donors. This effect was stronger the
higher the amount of salary and for charity organizations as opposed to service oriented nonprofits.
Moreover, most participants in a research in the US recalled scandals in the nonprofit very clearly,
and mentioned that when the reputation of a nonprofit gets damaged, they would most likely stop
giving to this nonprofit (Public Agenda, 2005). This leads to the following sub- question:
RQ3: Does a high executive salary in a nonprofit decrease the intention to donate?
But how do a high executive salary, trust and the intention to donate relate to each other? As stated
before, trust is strongly related to charitable behaviour. Therefore, it is highly likely that high
executive salaries have a negative influence on trust and this causes a lower intention to donate.
This points towards the idea that the relationship between the level of executive salary and the
intention to donate is mediated by the level of trust a donor has in the organization. This leads to
the following sub-question:

24
RQ4: Is the relationship between the level of executive salary and the intention to donate mediated
by trust in the nonprofit?
Through these questions, it can be explored whether high executive salaries in nonprofits play a
significant role in the motivation of donors to donate. If trust appears to be a significant mediator
of the relationship between high executive salaries and intention to donate, nonprofits will be
guided on how to deal with the problem surrounding executive salaries. Assuming trust to be a
major factor influencing a donor’s intention to donate, it should now be discussed what kind of
factors can ensure that high salaries will not damage trust and thus the intention to donate.
2.4 Alterable attributes to build trust and the intention to donate
This section will explore which factors can offset the negative influence of a high executive salary
in nonprofits, such that the intention to donate of donors will not decrease. If there is a relationship
between trust and receiving donations from donors, it is important to look at how nonprofits can
increase trust in their organizations and what they can do to not lose the trust of the public.
Firstly and fundamental to the existence of nonprofits, trust in nonprofits is created by the
nondistribution constraint, which makes it impossible for nonprofits to distribute their profits to
third parties (Hansmann, 1980; Bekkers, 2003). This limits opportunistic behaviour as there are no
resources to be freely distributed among powerful people in an organization. Although Handy and
Katz (1998) state that the mere absence of profit is not a very strong base for trust, the idea of the
nondistribution constraint is widely accepted as fundamental to general social trust in nonprofits.
General trust as an influence on donating behaviour has been a main focus of research so far (Evers
and Gesthuizen, 2011). However, there are several forms of trust. Sargeant and Lee (2004)
distinguish between trust in the whole nonprofit sector, and trust of donors in a particular
organization, also called general and institutional trust respectively (Evers and Gesthuizen, 2011).
General trust is largely beyond the control of individual nonprofits, as it can depend on many
general developments in society. Moreover, this general trust can easily be damaged by the
misbehaviour of some players in the nonprofit sector. As Bekkers (2003) states, there is no specific
incentive for individual nonprofits to conform to rules to increase trust in the whole sector. Thus,

25
the nondistribution constraint creates a minimum level of trust in nonprofits, but does not help
individual organizations to create trust between them and their potential donors.
Nevertheless, it is possible to partly “privatize” the publics' trust (Bekkers, 2003). Sargeant and
Lee (2004) state that factors as ethics, benevolence of the organization, skills, and abilities can
develop trust in a specific organization. Additionally, Lee and Turban (2001) propose that
trustworthiness can be build through three factors: Ability, Benevolence and Integrity. Table one
describes these and proposes signals with which nonprofits can add to their trustworthiness and the
intention to donate from donors. These signals are discussed in the next three sections.
Table 1: Trustworthiness as signals for nonprofits
Trustworthiness Definition Signal in nonprofit
Ability The skills and competencies enabling a party to have
influence within some specific domain
Performance
Benevolence
The extent to which the trusting party believes that the
trusted party wants to do good things rather than just
maximize profit
Administrative ratio
Integrity
The trusting party’s perception that the trusted party
will be hones and adhere to an acceptable set of
principles
Reputation of the
Board
Lee and Turban (2001) Added by author
2.4.1 The performance of a nonprofit
Ability is defined as “the skills and competencies enabling a party to have influence within some
specific domain”. If we link this with the signalling theory, a factor that can signal the ability of a
nonprofit is the performance of the nonprofit. Sargeant, Ford and West (2006) report that trust is
created when a nonprofit is perceived to have had an impact on the cause. Epstein and McFarlan
(2011) propose to measure performance by asking “are we really delivering on our mission, not
just meeting budget and are we getting maximum impact from our expenditures?”. Thus,
performance in nonprofits in this study is about whether nonprofits reach their objectives and act
according to their mission or not. The importance of this factor is underscored by the fact that 70%
of donors between the age of 25-35 report that they trust a nonprofit more when the nonprofit
reports how a financial contribution makes a difference (Millenial Donors, 2011) and thus how the
organization performed towards attaining their goals. Sawhill and Williamson (2001) propose that
26
the measurement of performance exists of the success of nonprofits in mobilizing resources, the
effectiveness of its staff and its progress in fulfilling the nonprofits’ mission.
Concrete and relevant performance measures will signal a businesslike attitude to donors and build
public support (Sawhill and Williamson, 2001) and this should lead to increased donations. Thus,
it is likely that when a nonprofit is perceived to have a good performance that donors have a more
trusting attitude towards the nonprofit and are more likely to donate. Additionally, if donors
perceive a nonprofit to be professional, it might make more sense that the managers of this
nonprofit need to be paid more.
RQ5: If performance is high, can a nonprofit justify paying high salaries to their executives so that
trust and donations do not decrease?
2.4.2 The administrative ratio of the nonprofit
Lee and Turban (2001) define benevolence as the extent to which the trusting party believes that
the trusted party wants to do good rather than just maximize profit. One factor that can add to the
perception of “doing good” by a nonprofit (and which receives much attention from governing
bodies and media) is the administrative ratio of nonprofits. Although this factor is sometimes taken
as part of the performance of a nonprofit (for example in Sargeant, West and Ford, 2006), the
following discussion indicates that the administrative ratio could be a separate and important
factor influencing a donor’s perception of a nonprofit.
Baber, Daniel and Roberts (2002) describe nonprofits as organizations that broker philanthropic
resources from donors to beneficiaries. While the objective is to maximize spending on program
activities, this brokering process consumes a fraction of the income of the organization. This is
called the administrative ratio of a nonprofit, or the percentage of income that a nonprofit spend on
other things than the charitable objectives. Administrative ratios in nonprofits, of which executive
salaries may be a substantial component, seem to be important in donor decision-making. Many
oversight agencies cite the ratio of program expense to revenue or the ratio of program expense to
total expense (Baber, Daniel and Roberts, 2002). For example, one of the main variables in the
Forbes US Largest Charities (Forbes, 2011) is “charitable commitment”. This variable is the

27
percentage of the total income of a nonprofit that is actually used for the purposes of the cause.
Donors are known to withdraw their support to a nonprofit if they perceive that the proportion of
funds that does not go to beneficiaries is too high (Hibbert and Horne, 1997).
Tinkelman & Mankaney (2007) found that donors may use administrative ratios as a factor in
making donation decisions. It is generally assumed that donors view administrative expenses
negatively because they divert from the mission of the nonprofit. It is found that donors reduce
contributions to nonprofits that report higher administrative expense ratios, mainly for nonprofits
that are for a large part dependent on donations (Tinkelman & Mankaney, 2007). Moreover,
several studies report that donation levels increase when more funds are spent on programs instead
of administration (Baber, Daniel and Roberts, 2002). If trust is low and people think their
contributions are ineffective, they are less likely to give (Bekkers, 2006). This is underlined by
Herzlinger (1994) stating the public opinion to be that the bulk of expenses of a nonprofit should
go the mission of the organization. When nonprofits spend money on activities that appear
extravagant to the public, problems may arise (Herzlinger, 1994). Thus, it seems that nonprofits
who report low administrative to total expense ratios and thus seem to be more efficient, will have
more success in attracting donors and funds. In addition, Tonkiss and Passey (1999) argue that
trust from a donor in a nonprofit depends on the extent to which the donor believes that the
organization has used the donation wisely. Thus, a lower administrative ratio seems to able
increase trust and intention to donate. If the administrative ratio is low can the nonprofit justify
paying a high salary to its executives? Can this be a signal towards the efficient management of the
organization such that the manager needs a high salary?
RQ6: If the administrative ratio is low, can a nonprofit justify paying high salaries to their
executives, so that trust and donations do not decrease?
2.4.3 The reputation of a nonprofits’ board
Integrity is the trusting party’s perception that the trusted party will be honest and adhere to an
acceptable set of principles (Lee and Turban, 2001). Because of the non-transparent nature of
nonprofit organizations, donors can be expected to be concerned with a nonprofits’ governance
(Fama and Jensen, 1983). A solution to this “agency problem” is often a third party that is

28
supposed to monitor the nonprofit. Therefore, the responsibility for the governance and integrity of
the organization largely lies with the board of directors.
The board of directors can be seen as an interface stakeholder that represents the nonprofit
organization to the outside world (Puyvelde, Caers, Du Bois and Jegers, 2011). Often the board
plays an active role in fundraising (Drucker, 1990; Miller-Millesen, 2003). It has been found that
nonprofits that have boards with reputational members are more effective in finding sources of
funding (Provan, 1980). However, a large role for the board members lies in the idea that they
bring trust and an enhanced reputation to the organization.
Board members, who often have a strong reputation, can be seen as legitimizers of a nonprofit and
increase the trust the public has in the organization (Handy, 1995). This way, nonprofits can
reduce uncertainty inherent to their environment (Miller-Millesen, 2003). The reason for this is
that many board members have too much to lose by being associated with organizations that are
not trustworthy - if the nonprofit acts dishonest, the board members will also lose their reputation.
Therefore, the best type of board members for nonprofits are trustees who have a lot to lose, like
those who are wealthy and have high reputations (Handy, 1995). Additionally, Poppo and
Schepkens (2010) explain that structural institutional sources in an organization such as the board
of directors are likely to build public trust. When the board is able to transfer trust to the public, the
public will use this legitimizing structure to evaluate the organization.
Nonprofits need a strong reputation as this will increase the trust in the organization and will help
establish and maintain relations with stakeholders (Torres-Moraga, Vásquez-Parraga and Barra,
2010). Hou, Du and Tian (2009) found that a stronger nonprofit brand leads to a stronger
individual giving intention. Thus, assuming that the people on nonprofit boards can contribute to
the image and reputation of a nonprofit, it is likely that a board with a strong reputation has a
positive impact on the intention to donate. Thus, if the board of directors is perceived to reliable
and has a strong reputation, it is likely that donors will trust the organization more to use their gift
wisely and thus will be more likely to donate. This is underlined by the idea that a stakeholder’s
decision to interact with a nonprofit is very likely to be influenced by the reputation of the
organization. Hence, the reputation of a nonprofit is of vital importance for a nonprofit (Kong &
29
Farrel, 2010), and the board could play a vital role in this matter. Therefore, it is not surprising that
many nonprofits advertise their board as a sign of accountability (Scheitle, 2009). Research that
strengthens this argument mainly stems from the for-profit sector. One example is that a positive
market reaction was found, when accounting financial experts were assigned to audit committees
in boards of directors in corporations (Defond, Hann and Hu, 2005). If people perceive experts or
reliable persons to take a position in the board, this might increase reputation of the board of a
nonprofit.
Also, sometimes celebrities are used as “honorary” or non-active members who legitimize the
nonprofits with their high reputations, but do not actively participate in the nonprofit (Handy,
1995). Although celebrity endorsement has questionable influence on the donative behaviour of
donors (Samman, Mc Auliffe and MacLachlan, 2009) there is evidence that when celebrities are
perceived to be closely connected to a nonprofit, this will increase the credibility of the nonprofit
(Wheeler, 2009). Eventually, this could positively affect the donative behaviour of donors.
Moreover, celebrity endorsement is found to be useful in boosting the public profile of the
nonprofit (Samman, Mc Auliffe and MacLachlan, 2009). Thus, if famous people connect their
name to nonprofit, and this seems credible, this could enhance the intention to donate from donors.
This section leads to the idea that if a board’s reputation is perceived as high, donors could
perceive a nonprofit as more trustworthy and the intention to donate to this nonprofit could be
higher. Moreover, it is usually the board of directors in nonprofits that decides on compensation
practices. If a nonprofit pays high salaries to their top executives, does a strong board reputation of
justify this decision?
RQ7: If a board’s reputation is high, can nonprofits justify paying high salaries to their top
executives, so that trust and donations do not decrease?

30
3. Hypothesis building
The main research question aimed to be answered in this study is the following: “why do high
executive salaries decrease donations and how can this negative effect be averted”. The following
tables provide an overview of the research questions presented and the proposed hypotheses. Also,
the conceptual model used in this research will be presented.
Table 2: Overview research questions and hypotheses 1 to 4
Research Question Literature Hypothesis
RQ1: Does trust in a
nonprofit increase the
intention to donate?
People who trust nonprofits, are more
likely to give and give more (Bekkers,
2003; Bekkers & Bowman, 2009;
Millenial Donors, 2011) .
H1: Trust in a nonprofit
organization positively affects
the intention to donate to this
organization.
RQ2: Does a high executive
salary in a nonprofit
negatively influence trust in
a nonprofit?
High salaries can be seen as
infringement of the nondistribution
constraint, and this can lead to a loss of
trust in nonprofits (Ooster, 1998).
H2: High executive salaries in
a nonprofit will negatively
affect trust in a nonprofit.
RQ3: Does a high
executive salary in a
nonprofit decrease the
intention to donate?
Donations fall with high executive
salaries (Harris, 2012). High executive
salaries in nonprofits are a reason to
stop giving Bekkers (2003).
H3: High executive salaries in
a nonprofit will decrease the
intention to donate to a
nonprofit.
RQ4: Is the relationship
between the level of
executive salary and the
intention to donate mediated
by trust in the nonprofit?
H4: The relationship between
executive salaries in a
nonprofit will and the intention
to donate, will be partially
mediated by trust.

31
Table 3: Overview research questions and hypotheses 5 to 7
Research Question Literature Hypothesis
RQ5: If performance is high,
can a nonprofit justify
paying high salaries to their
executives so that trust and
donations do not decrease?
If nonprofits deliver good results on and
had an impact on the cause in the mission,
donors should be more likely to donate.
Sargeant, Ford and West (2006) . If this
effect is strong enough, it could justify
higher salaries.
H5: A high performance
will mitigate the negative
effect of high executive
salaries on trust and
intention to donate.
RQ6: If the administrative
ratio is low, can a nonprofit
justify paying high salaries
to their executives, so that
trust and donations do not
decrease?
If trust is low and people think their
contributions are ineffective, they are less
likely to give (Bekkers, 2006).
It is found that donors reduce contributions
to nonprofits that report higher
administrative expense ratios (Tinkelman
& Mankaney, 2007).
H6: A low administrative
ratio will mitigate the
negative effect of high
executive salaries on trust
and intention to donate.
RQ7: If a boards’ reputation
is high, can nonprofits justify
paying high salaries to their
top executives, so that trust
and donations do not
decrease?
Responsibility for governance and integrity
of nonprofit largely lies with the board. If
the board has a strong reputation, it is likely
that donors will trust the organization more
to use their gift wisely and will be more
likely to donate. (Handy, 1995; Puyvelde,
Caers, Du Bois and Jegers, 2011).
H7: A high reputation of
the board will mitigate the
negative effect of high
executive salaries on trust
and intention to donate.
See figure one below for the above described relationships depicted in a conceptual model.
Figure 1: Conceptual Model
Note: H3 is the path without mediation, H4 is the mediated path

32
4. Method
This research is a causal study: the issue of interest is how one variable produces changes in other
variables. In this case, it is examined whether and how an executive salary in a nonprofit
influences the intention to donate of donors and whether trust plays a significant role in this
relationship. More importantly, it is investigated whether there are factors that can mitigate the
expected negative influence between the level of executive salaries, trust and intention to donate.
This chapter will discuss how these research questions are approached. First, the procedure and the
measures will be discussed and then this chapter will elaborate on the design of the questionnaire,
the sampling method and data collection.
4.1 Procedure
First of all, a literature review was conducted which aimed to explore existing relationships
between the studied variables and to find gaps that would eventually lead to the research question
in this work. Journal articles and other (online) sources were searched for and collected based on
the following search terms: salary scandal nonprofit, executive compensation in nonprofits, trust,
trust in nonprofits, intention to donate, nonprofit performance, nonprofit efficiency, nonprofit
administrative ratio and nonprofit boards. Most of these topics have been widely discussed in the
literature, but were never combined. Much literature used was published in the Nonprofit and
Voluntary Sector Quarterly and the International Journal of Nonprofit and Voluntary Sector
Market, both prominent journals in the nonprofit sector. Some articles on nonprofit efficiency and
performance were found in economic, finance or accounting journals. Examples of scandals
around high executive salaries were sourced from newspapers, magazines, websites or blog-posts.
The second step in this research consisted of evaluating which research method was the best to
answer to the research questions and test the hypotheses. Firstly, there was the trade-off between
qualitative and quantitative research. It soon became clear that quantitative research was the most
appropriate research method, as there was already ample evidence on the separate variables to
form the hypotheses. Moreover, exploratory or qualitative research was deemed infeasible due to
time constraints and availability of data. For example, the idea of a case study was considered, but
rejected due to the expected lack of support from the nonprofits that faced a salary scandal.

33
Then, it was decided that this research should be cross-sectional as opposed to longitudinal. This
means that this research would look at the phenomenon under study at one point in time. Although
this research topic is definitely interesting for longitudinal studies as it would be worthwhile to
measure levels of trust and attitudes toward high executive salaries over time (and would provide
stronger evidence for causal relationships) this type of study would not have been feasible within
the available time-frame.
Cross-sectional studies often make use of the survey strategy in order to describe the incidence of
a phenomenon or how factors are related (Saunders, Lewis and Thornhill, 2009). Thus, as the third
step of this research it was decided to employ a questionnaire method to gather the information
needed. In this case an experimental survey was used to assess the reactions from individuals to
different scenarios. This means that several variables were influenced and the hypotheses were
tested based on the answers the respondents gave.
Before distributing the questionnaire, it was pre-tested. The pre-test was done in two stages. In the
first stage of the pre-test, 4 people within the sample were asked to fill out the questionnaire and
comment on spelling errors, terms used, whether instructions were clear and whether there were
other issues that required clarification. After this first round of improvement, again 4 people within
the sample were asked to assess the questionnaire. This way, the more serious errors were
eliminated in the first round and the respondents in the second stage could focus more on the
content of the questionnaire. Eventually, there were no more comments and the questionnaire was
deemed sufficiently short to not lose a respondent’s attention. Although the questions were
repeated several times, there were no complaints about this issue.
4.2 Measures
The questionnaire had to be build in a way that allowed for measurement of the variables of
interest. Therefore, it was necessary to create scales representing these variables. First of all, the
independent variable of the “director’s salary” (dichotomous: high or low), the dependent variable
“intention to donate” (continuous) and the mediator “trust” (continuous) were constructed.

34
4.2.1 Independent Variable – The level of executive salary in a nonprofit
In this research the independent variable is a nonprofit director’s salary. For simplicity, this
variable has been defined dichotomously as low and high. The definition for low and high salaries
has been determined through a small pre-test. 22 respondents were asked what was the maximum a
nonprofit director should earn. The answering options were established by examining an overview
of the nonprofit executive salaries in the Netherlands in 2010. The highest salary was just under
€200.000 (WereldburgersTv, 2010). So, a range of €25.000 (under the average yearly salary of a
Dutch person) until over €200.000 was established. Table 4 shows the outcome of the pre-test.
95% of the respondents indicated an amount below €200.000 to be the maximum a nonprofit
director should earn. Therefore, €200.000 was established as the high-scenario setting. A salary
between €25.000 and €50.000 seems acceptable for most. This, combined with the knowledge that
the modal salary in the Netherlands is €33.000 (www.gemiddeld-inkomen.nl, 2012), led to the
low-salary scenario of €33.000.
Table 4: Pre-test to determine what people see as high and low salary
Salary in euro Respondents Cumulative %
€25.000 1 5%
€50.000 2 14%
€75.000 5 36%
€100.000 4 55%
€125.000 4 73%
€150.000 4 91%
€175.000 1 95%
€200.000 0 95%
Over €200.000 1 100%
4.2.2 Dependent Variable - Intention to donate
It is important to note that the independent variable was manipulated, so did not need to be
measured by asking respondents questions. However, the dependent variable “intention to donate”
and the mediator “trust” did needed to be measured in response to the high or low salary scenario.
Individual scores on variables were measured through reactions on statements. Respondents were
asked to respond to the statements in terms of their own agreement or disagreement (McIver and
Carmines, 1981) and to respond whether they agreed with a statement by indicating their attitude
on a 7-item Likert scale (1=do not agree at all, 7=completely agree), such that the respondents with
the most favourable responses to the statements would have the highest scores.

35
In order to establish a reliable scale to measure an individual’s intention to donate, previous studies
with similar variables were examined. Intentions in general and also intention to donate are a much
researched variable mainly in the theory of planned behaviour (Azjen, 1991). Hence, there were
several suitable scales found in the literature (See Appendix 1 - Ranganathan and Henley, 2007;
Smith and McSweeney, 2007; Hou, Du and Tian, 2009; Merchant, Ford and Sargeant, 2010).
From the existing scales, several items deemed suitable for the current research were taken and
adapted to the setting. Eventually, the following five statements were used in the questionnaire:
I am still likely to donate to Food for Schools.
I would still definitely donate to Food for Schools.
I would still recommend others to donate to Food for Schools.
I still intend to donate to Food for Schools.
I would still like to donate to Food for Schools.
The statements were evaluated to determine whether they are sufficiently related to each other and
whether they were trying to measure the same construct (McIver and Carmines, 1981). This was
done by an examination of reliability through measuring Cronbach’s Alpha, which is generally
accepted as the most popular method of examining reliability (Hinton, Brownlow, McMurray and
Cozens, 2004). The alpha measures the inter-item correlation and a high correlation indicates the
statements are measuring the same thing; usually an alpha above 0,7 is accepted as reliable
(Hinton, Brownlow, McMurray and Cozens, 2004). The construct “Intention to donate” in the
current study had a Cronbach alpha of α = 0,97 and can thus be considered as very reliable. This
value could not be improved by deleting one of the statements.
4.2.3 Mediator – Trust
This study is based on a mediation model. A mediator is a variable that is expected to change as a
result of a treatment (Rose, Holmbeck, Coakley and Franks, 2004). Mediators explain how and
why certain effects occur and are best examined in the case of a strong relation between the
independent and dependent variable (Baron and Kenny, 1986). If a randomly assigned treatment or
intervention is associated with change in the mediator, which is in turn associated with the
dependent variable, there is significant support for the hypothesis that the mediator is a causal
mechanism (Rose, Holmbeck, Coakley and Franks, 2004). In this study, it is hypothesized that
trust partly explains the relationship between the salary level and the intention to donate. In order

36
to test this it was decided to follow a causal steps mediation method as for example described by
Baron and Kenny (1986) and Rose, Holmbeck, Coakley and Franks (2004) as in table 5.
Table 5: Causal steps Mediation analysis | Source: Baron & Kenny (1986), Rose et al. (2004)
Regression Description Independent
Variable
Dependent
Variable
1 Show that the initial variable is
correlated with the outcome X: Salary Y: Intention to donate
2 Show that the initial variable is
correlated with the mediator. X: Salary M: Trust
3 Show that the mediator affects the
outcome variable. M: Trust Y: Intention to donate
4 Show that M mediates the X-Y
relationship
X: Salary
M: Trust
Y: Intention to donate
Similar to “Intention to donate”, “Trust” is a construct that has been attempted to measure in many
previous studies in the for-profit context as in the nonprofit context. Again several useful scales
were found in previous literature and shown in Appendix 1 (Sargeant, Ford and West, 2006;
Sargeant and Woodliffe, 2007; Torres-Moraga, Vásquez-Parraga and Barra, 2010). Scales used:
I would still trust Food for Schools to always act in the best interest of the cause.
I would still trust Food for Schools to conduct their operations ethically.
I would still trust Food for Schools to use donated funds appropriately.
I would still trust Food for Schools to not seek advantages by deceiving its donors.
I still completely rely on the integrity of Food for Schools.
Again, the reliability of this construct was assessed by examining Cronbach’s alpha. Similar to
intention to donate, the construct of trust has a very high Cronbach Alpha (α = 0,94) and can be
considered to be a valid measurement for the trust people have in the nonprofit.
In order to assess the second set of hypotheses (H5-H7), several new variables were introduced.
The “performance”, “administrative ratio” and the “reputation of the board” (dichotomous: high or
low) of the fictional nonprofit organization were introduced to see if the trust or intention to donate
from the respondents would change after a positive or negative scenario of these variables. Table 6
displays which group of respondents received which salary scenario and which treatments For the
exact scenarios, please see Appendix 3 where the whole questionnaire is displayed.
37
Table 6: Overview of treatment groups
Group Salary Positive sign Negative sign
1 High High Performance High Administrative Ratio
2 High Low Administrative Ratio Low Reputation
3 High High Reputation Low Performance
4 Low - -
4.2.4 Performance
In the literature review it was discussed that performance in nonprofits in this research can be
defined as whether nonprofits reach their objectives while performing according to their mission.
Therefore, in the high/low performance scenarios, it was mentioned how the organization had
performed over the last years in terms of growth of reaching their objectives. The high
performance scenario posited that “Food for Schools” had a strong performance and the low
performance scenario described a weak performance compared to other charities.
4.2.5 Administrative ratio
The administrative ratio has been defined as the percentage of income that a nonprofit spends on
other things than the charitable objectives (section 2.4.2). Firstly, it was explained to the
respondents what an administrative ratio is and examples of administrative costs were given. Then
it was stated whether the nonprofit had achieved a high or low administrative ratio. In order to
clarify whether this was a high or low result, it was stated whether this was a good or bad result in
comparison to other nonprofits.
4.2.6 Reputation of the Board
The reputation of the board was expected to increase trust and intention to donate because of
increased credibility as result of a strong reputation. The high reputation scenario was described as
a board with celebrities, professors of renowned universities and highly ranked business people.
The low reputation scenario did not have any of these.

38
4.2.7 Control variables
There are several control variables being considered that have often been linked to donor
behaviour in the nonprofit context: gender, age, education and income. Bekkers and Wiepking
(2011) and Wiepking and Bekkers (2012) have published two papers that aimed to discuss the
main predictors of charitable giving. Out of their review, four predictors have been selected that
are deemed likely to influence an individual’s opinion on high executive salaries in nonprofits.
Gender In this research, respondents were asked to indicate their gender (male or female).
In general, it is expected that women are more likely to give to nonprofits, but that men
give more (Wiepking and Bekkers, 2012). Hence, a difference was expected between
male and female respondents.
Age Most studies have found a positive relation between age and giving behaviour. It is
therefore expected that older age groups show higher trust and intention to donate. The
following answering options were given:
Education Most studies that included education as a variable found a positive correlation
between the level of education and giving behaviour (Bekkers and Wiepking, 2011). Thus,
it is expected that respondents who indicate a higher level of education will show a higher
level of trust and intention to donate. Respondents were asked to indicate their education
level that they had obtained, or were working towards. The answer options were given
based on the Dutch education system.
Income Wiepking and Bekkers (2012) found overwhelming evidence for a positive
relationship between income or wealth and the amount donated to nonprofits. Therefore, it
is expected that higher income categories show a higher intention to donate.
See appendix 2 for an overview of the different variables as used in the data analysis (SPSS) with
their description.
4.3 Questionnaire
The complete questionnaire can be found in appendix 3. However, there are several parts of the
questionnaire that require some extra elaboration: the use of a fictional organization, the “trust
filter”, the way the salary scenario was announced and the background questions at the end of the
questionnaire.
39
4.3.1 Unit of analysis
The questionnaire in this study was based on the fictional charity named “Food for Schools”, an
organization consisting of about 25.000 volunteers and 300 paid staff members. The choice for a
fictional charity originated from the idea that a large part of the population would be familiar with
existing charity organizations. Especially after the media attention surrounding high executive
salaries in nonprofit organizations, some organizations are more “top of mind” when it comes to
this matter. To avoid bias and to make sure all respondents started with an equal level of
knowledge and opinion on the organization in the research, a fictional organization was created.
Within the nonprofit sector, there is a large variety of nonprofit organizations (Oster, 1995). It was
therefore important to define what type of nonprofit would be included in this study. It was
decided to use a donative nonprofit or charity and specifically a large, international relief (aid)
charity. This is in line with the news coverage over the last couple of years that mainly mentioned
organizations as the Red Cross, Unicef and other health and relief organizations that operate
worldwide. There are several additional reasons for this choosing this type of nonprofit.
First of all, it is important to focus on larger nonprofit organizations. There is a relationship
between the size of an organization and executive salaries (Kostiuk, 1990; Oster 1998). Hence, the
focus should be on large organizations as these are the ones that are able to pay salaries that might
appear shocking to the public. Secondly, it is important to focus on the donative nonprofits, as
these receive a large part of their income in the form of grants or donations (Hansmann, 1980) and
thus are most susceptible to changes in donor behaviour. Donors to donative nonprofits are more
sensitive to high executive salaries than donors to commercial (service- oriented) nonprofits
(Balsam and Harris, 2012) and experience more serious negative consequences from high
executive salaries. Therefore, this research is most important for these types of nonprofits. Lastly,
Bekkers (2006) allows for more specificity and states that international relief organizations and
health charities are the most reliant on donor confidence. Because the organization performs
operations abroad, donors are not able to see for themselves how the charity works and where the
money goes, so the charity needs a higher level of confidence than national or local organizations
(Bekkers, 2006). Thus, because trust is especially important for this kind of organizations, it is
important to investigate the effects of high executive compensation on these organizations.

40
4.3.2 The “trust filter”
A filter question was introduced at the beginning of the questionnaire. Preceding this question, all
participants got general information about the fictional organization “Food for Schools”. Filtering
respondents on high or low trust was done by posing a question that is often used to measure
“general trust”. The original question is: “In general, would you say that most people can be
trusted, or that you can’t be too careful in dealing with people?”. The question asked in this
questionnaire was formulated as “In general, would you say that this organization (Food for
Schools) can be trusted, or that you can’t be too careful in dealing with this organization?”. The
two answer options were: “This organization can be trusted” or “You can’t be too careful in
dealing with this organization”. Respondents picking the first option were redirected to the
remainder of the questionnaire. Respondents that answered this question with “You can’t be too
careful in dealing with this organization” were redirected to the end of the questionnaire. People
who did not have a high level of trust before starting the questionnaire, were excluded from
completing the questionnaire because in order to measure the expected decrease in trust and
intention to donate as result of high salaries, one should start the questionnaire with at least an
average level of trust. People who already have a negative perception of nonprofits, are not likely
to lose more trust or intention to donate as a result of a high executive salary. This also explains
why the term “still” was added to the questions: after indicating to be trusting of Food for Schools
respondents would receive the high or low salary scenario. After the scenario, it was asked whether
the respondents “still” had trust or an intention to donate. The expectation was to observe a drop in
intention to donate and in trust in the high salary context.
4.3.3 Notification of the salary
One of the most important issues in the questionnaire were the low and high scenarios the
respondents would receive. In a US study by Balsam and Harris (2012), high executive salaries in
nonprofits did not probe a negative effect when solely mentioned in the Form 990 by the IRS
(Internal Revenue Service). There was however, a strong effect when mentioned by the media.
Because this was the only study on the topic, it was decided to simply indicate the level of the
salary and did not get an indication whether they found it in the media or in for example an annual
report.
41
4.3.4 Background questions
To a call from Balsam and Harris (2012) for research whether donors evaluate executive
compensation directly of whether this goes through the media, several general questions about
attitude towards executive compensation were included in the questionnaire to serve as
background information and as a trigger for future research. For example, respondents were asked
if they think that a nonprofit director’s salary is important is important in the decision to donate
and whether they would actively look for information regarding this matter.
4.4. Data collection and sample
Blumberg, Cooper and Schindler (2011) explain that the idea behind sampling is that asking your
whole target population to participate in your research, is often too expensive, takes too long and
decreases the quality of the results. Therefore, it makes sense to take a sample of the target
population and have this specific group to participate. The sample for this research was taken from
the Dutch population of 18 years and older. It was decided that the sample will only consist of
Dutch participants for several reasons. Firstly, a fairly large proportion of the literature used in this
research has been written based on research in the Netherlands or by Dutch researchers. Also,
several scandals surrounding executive salaries have taken place in the Netherlands and in the
literature it became clear that the Dutch are known to have strong opinions about high salaries in
nonprofits and often overestimate costs involved with running a nonprofit (Bekkers, 2003). Lastly,
choosing to only include the Dutch population improved the feasibility of this study concerning
finding participants and will eliminate the need for questionnaires in different languages.
The sampling took place through a mix of convenience sampling and self-selection sampling
(Saunders, Lewis and Thornhill, 2009). Any Dutch person who was willing and able to participate
and was easy to obtain was allowed in the sample. To be considered valid, this research needed a
large amount of participants. With the Dutch population as target population and a confidence
interval of 95% a sample size of 385 was deemed appropriate (Raosoft, 2012). Attempting to
gather this amount of participants, respondents were invited to participate in the questionnaire
through several online channels. First of all, the social and professional network of the author
provided a responsive base for participants. It is expected that the majority of respondents
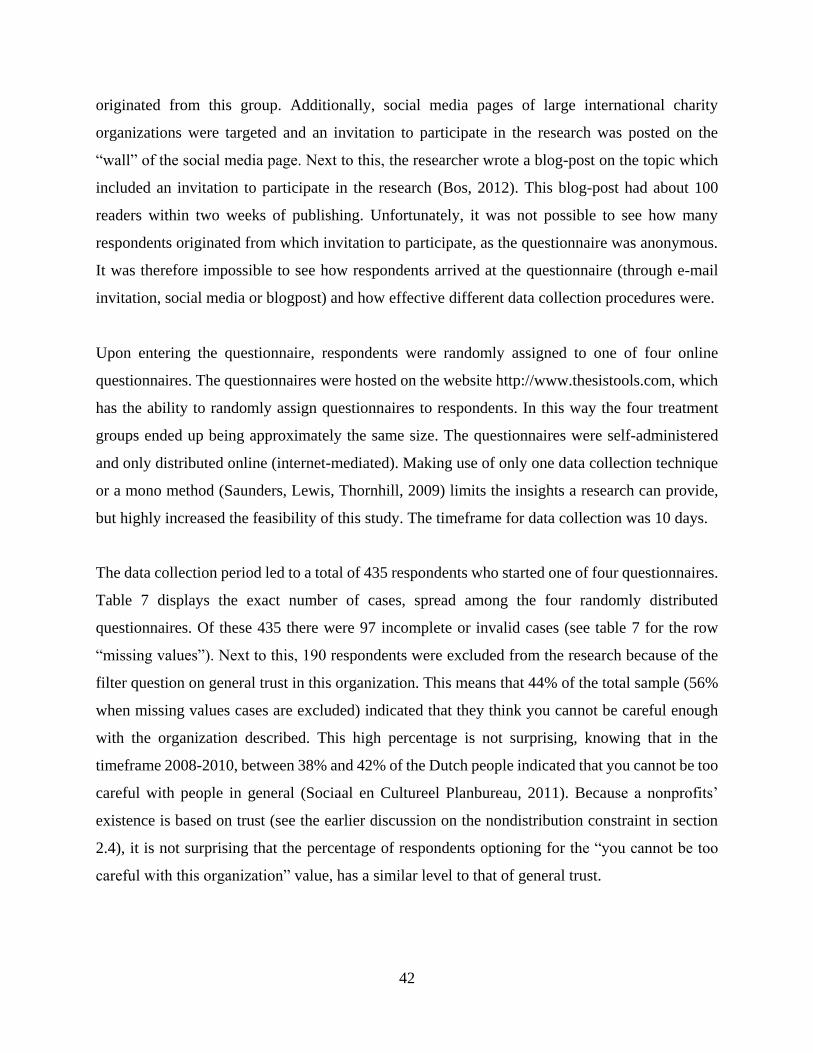
42
originated from this group. Additionally, social media pages of large international charity
organizations were targeted and an invitation to participate in the research was posted on the
“wall” of the social media page. Next to this, the researcher wrote a blog-post on the topic which
included an invitation to participate in the research (Bos, 2012). This blog-post had about 100
readers within two weeks of publishing. Unfortunately, it was not possible to see how many
respondents originated from which invitation to participate, as the questionnaire was anonymous.
It was therefore impossible to see how respondents arrived at the questionnaire (through e-mail
invitation, social media or blogpost) and how effective different data collection procedures were.
Upon entering the questionnaire, respondents were randomly assigned to one of four online
questionnaires. The questionnaires were hosted on the website http://www.thesistools.com, which
has the ability to randomly assign questionnaires to respondents. In this way the four treatment
groups ended up being approximately the same size. The questionnaires were self-administered
and only distributed online (internet-mediated). Making use of only one data collection technique
or a mono method (Saunders, Lewis, Thornhill, 2009) limits the insights a research can provide,
but highly increased the feasibility of this study. The timeframe for data collection was 10 days.
The data collection period led to a total of 435 respondents who started one of four questionnaires.
Table 7 displays the exact number of cases, spread among the four randomly distributed
questionnaires. Of these 435 there were 97 incomplete or invalid cases (see table 7 for the row
“missing values”). Next to this, 190 respondents were excluded from the research because of the
filter question on general trust in this organization. This means that 44% of the total sample (56%
when missing values cases are excluded) indicated that they think you cannot be careful enough
with the organization described. This high percentage is not surprising, knowing that in the
timeframe 2008-2010, between 38% and 42% of the Dutch people indicated that you cannot be too
careful with people in general (Sociaal en Cultureel Planbureau, 2011). Because a nonprofits’
existence is based on trust (see the earlier discussion on the nondistribution constraint in section
2.4), it is not surprising that the percentage of respondents optioning for the “you cannot be too
careful with this organization” value, has a similar level to that of general trust.

43
Table 7: Sample size of the study among treatment groups
Group 1 Group 2 Group 3 Group 4 Total
All cases Gone after trust filter Missing values Final sample
104 98 125 108 435 42 39 53 56 190
28 26 30 13 97
34 33 42 39 148
The next step was to examine whether the sample was normally distributed. Skewness (measures
the distribution of the data) and kurtosis (measures peakedness of data) are both measures used to
screen data for normal distribution and both should fall in the range from +2 and -2 if the data are
normally distributed (Lewis-Beck, Bryman and Liao, 2004). None of the categories have an
abnormal distribution and can be used for analysis without many problems (see Appendix 5.1.3).

44
5. Empirical results
5.1 Introduction to the data
To get a first overview of the relations within this dataset, a Pearson correlation analysis was run4
as shown in table 8 (see appendix 3.1.5 for full report) and the set of respondents was analyzed (see
table 9). Table 8 displays the mean, standard deviation and significant correlations printed in bold
with the asterisk indicating the strength of the relationship. For example, trust and intention to
donate have means of 4,45 and 4,05 respectively on a scale of 1-7. Concerning the correlations, for
example, trust and salary display a strong negative relationship with a correlation of r = -,461,
significant at the 99% confidence interval. Similarly, it can be observed that income and age have
a strong positive correlation r = ,657 also at the 99% confidence interval.
Table 8: Mean, Standard Deviation and Correlation results from Pearson Correla tion test
Mean SD Salary Trust Intention Gender Age Education Income
Salary
Trust 4,45 1,350 -,461**
Intention 4,05 1,401 -,541**
,918**
Gender 1,44 ,498 -,181* -,034 -,020
Age 1,99 ,832 ,088 -,033 -,004 -,234**
Education 4,48 ,797 ,074 ,081 ,069 ,009 -,326**
Income 2,67 1,536 ,121 -,080 -,060 -,320**
,657**
-,047
**. Correlation is significant at the 0.01 level (2-tailed).
*. Correlation is significant at the 0.05 level (2-tailed).
Table 9 displays the different demographic variables grouped as in the questionnaire. The count
and percentage columns display the absolute and relative numbers per group, respectively. Also, it
was important to analyze the scales used on their reliability. Table 10 shows the different scales
used, their initial Cronbach alpha and whether they could be improved by deleting any items or
not.
4 The Pearson correlation test relies on several assumptions of which one is violated in this study: the data must be
collected from continuous distributions (interval or ratio) (Hinton, Browlow, McMurray and Cozens, 2004). The
control variables in this study are categorical and/or ordinal. Therefore, also the Spearman’s rho correlation analysis
was performed. However, the tests did not show major differences: the same correlations came out significant and the
values were very similar. Because several values from the Pearson correlation will later appear in the regression
results, only these are reported here.

45
Table 9: Summary table of demographics of respondents
Variable and coding Count Percentage
Gender
1: Male 81 54,7%
2: Female 64 43,2%
Missing 3 2,0%
Total
Age
148 100,0%
1: 18-24 46 31,1%
2: 25-44 61 41,2%
3: 45-64 35 23,6%
4: 65+ 5 2,4%
Missing 1 0,7%
Total
Education
148 100,0%
1. Primary School 0 0%
2: High School 6 4,1%
3: Practical Education / MBO 10 6,8%
4: Uni of applied sciences / HBO 38 25,7%
5: University (BSc, MSc, PhD) 93 62,8%
Missing 1 0,7%
Total
Income
148 100,0%
1: <15.000 45 30,4%
2: 15.000-30.000 33 22,3%
3: 30.000-45.000 27 18,2%
4: 45.000-60.000 15 10,1%
5: 60.000-120.000 22 14,9%
6: 120.000 > 5 3,4%
Missing 1 0,7%
Total 148 100,0%
Table 10: Reliability of scales used in study
Scale Cronbach's α Improve Cronbach’s α by deleting item?
Trust ,944 -
Intention to donate ,965 -
Trust with performance ,955 -
Intention with performance ,980 Item 3: ,983
Trust with admin ratio ,945 -
Intention to donate with admin ratio ,979 Item 3: ,981
Trust with reputation ,969 -
Intention with reputation ,975 -

46
5.2 Mediation analysis
Next, in order to analyze hypotheses 1 to 4, a statistical mediation analysis was performed
consisting of 4 regressions. Regression one to three are simple linear regressions and regression
four is a multiple regression with step one including trust as independent variable and step two
including both salary and trust to predict intention. Additionally a regression analysis (5) was run
to make sure the established effects were not completely or partially caused by one or more of the
control variables. The results can be found below in table 11 and the regression results are
available in Appendix 5.2 and 5.3.
Table 11: Summary of regression models H1, H2, H3, H4
Model β Significance R² Adjusted R² Std. Error Estimate
1 Constant
Salary
-,541
,000
,293 ,288 1,182
2 Constant
Salary
-,461
,000
,213 ,207 1,202
3 Constant
Trust
,918
,000
,843 ,842 ,557
4 Constant
Salary
Trust
-,150
,849
,000
,000
,861
,859
,527
5 Constant
Salary
Trust
Gender
Age
Education
Income
-,161
,842
-,013
,045
,028
-,009
,569
,000
,000
,712
,328
,423
,838
,862 ,856 ,531
1. Predictors: Salary - Dependent Var: Intention
2. Predictors: Salary - Dependent Var: Trust
3. Predictors: Trust - Dependent Var: Intention
4. Predictors: Salary, Trust - Dependent Var: Intention
5. Predictors: Salary, Trust, Age, Gender, Education, Income level - Dependent Var: Intention
In column two the standardized beta coefficient (β) is reported as opposed to the unstandardized B
for several reasons. First of all, this research does not aim to find a particular increase or decrease
in trust or intention with a specific increase or decrease of the salary. Salary was posed as high or

47
low, so the B does not have any practical meaning. Moreover, because this research aims to
compare variables measured differently (salary was posed high or low and not a 7-point Likert
scale as the other variables) the coefficients needed to be standardized in order to interpret the
results. In the third column, the R² is reported, indicating the variance in the dependent variable
which can be explained by the independent variable(s). As the R² always increases adding
variables (irrespective of if the independent variables add to explaining variance in the dependent
variable), the adjusted R² is reported as well to control for this. The last column displays the
standard error, indicating the precision with which the regression coefficient is measured.
5.3 The effects of Performance, Administrative Ratio and Reputation
Three analyses were executed to examine Hypothesis 5,6 and 7. First, simple regressions were run
to analyze possible relationships between performance, administrative ratio and reputation of the
board and trust and intention to donate (see table 12 – same construction as table 11).
Table 12: Regressions for Performance, Administrative Ratio and Reputation
Model β Significance R² Adjusted R² Std. Error Estimate
1 Constant
Performance
,402
,000
,161 ,150 1,144
2 Constant
Performance
,292
,010
,085 ,073 1,354
3 Constant
Admin Ratio
-,500
,000
,250 ,238 1,130
4 Constant
Admin Ratio
-,490
,000
,240 ,228 1,134
5 Constant
Reputation
-,063
,592
,004 -,010 1,193
6 Constant
Reputation
-,107
,362
,011 -,002 1,137
1. Predictors: Performance - Dependent Variable: Trust
2. Predictors: Performance - Dependent Variable: Intention
3. Predictors: Admin Ratio - Dependent Variable: Trust
4. Predictors: Admin Ratio - Dependent Variable: Intention
5. Predictors: Reputation - Dependent Variable: Trust
6. Predictors: Reputation - Dependent Variable: Intention

48
Then, six one-way Anova analyses were run to examine whether there was a significant
difference in trust and intention among the low and high scenario of each variable in order to
examine whether the treatments actually made a difference (see table 13). In other words, do
performance, administrative ratio and the reputation of the board contribute significantly to the
level trust and intention to donate from donors?
The second column in table 13 displays whether trust or intention to donate received the low or
high treatment and the third column displays the amount of respondents in that group. The mean
and standard deviation are displayed and then the F value and its significance. For example,
intention to donate was observed under the low and high performance treatment with 42 and 34
respondents respectively. Intention to donate under low performance has a mean of 3,2619 and
under high performance 4,0824. Whether there exists a significant difference between the low
and high performance treatment can be observed through the significance of the F value.
Table 13: One-way ANOVA - Performance, Administrative Ratio and Reputation
High / low treatment N Mean Std. Dev. F Significance
Trust
Low Performance
High Performance
42
34
3,8810
4,8765
1,14172
1,14734
14,223 ,000
Intention
Low Performance
High Performance
42
34
3,2619
4,0824
1,32774
1,38662
6,896 ,010
Trust
Low Admin Ratio
High Admin Ratio
33
34
4,8848
3,6000
1,14240
1,11844
21,639 ,000
Intention
Low Admin Ratio
High Admin Ratio
33
34
4,2667
2,8118
1,44193
1,1785
20,505 ,000
Trust
Low Reputation
High Reputation
33
42
4,6970
4,5476
1,29433
1,10701
,290 ,592
Intention
Low Reputation
High Reputation
33
42
4,1455
3,8524
1,42414
1,33110
,842 ,362
Finally, 12 paired sample t-tests were run to see whether there was a significant difference between
the initial values of trust and intention to donate, and the values under the treatment condition. For
the results see table 14. The first five columns show the trust and intention to donate means without
treatment and with treatment for the different groups and the mean difference. For example, trust

49
before treatment had a mean of 4,1706 and with the treatment of high performance the mean was
4,8765 (difference = 0,70588) based on a group of 34 respondents. The sixth and seventh column
shows the strength and significance of the correlation between the values of trust and intention
before and after the treatment. For example, a strong correlation means that people scoring high on
trust without treatment, also scored high on trust with treatment. Then, the t-value and significance
of the difference in means is displayed. For example, a significant difference is observed between
trust without treatment and trust under high performance treatment t = -5,003, p < ,001.
Table 14: Paired sample t-tests - Performance, Administrative Ratio and Reputation
Mean Mean
difference
N Cor. Sig. t Sig.
(2-tail)
Pair 1 Trust 4,1706 -,70588 34 ,774 ,000 -5,003 ,000
Trust performance high 4,8765 34
Pair 2 Trust 3,9571 ,07619 42 ,616 ,000 ,480 ,634
Trust performance low 3,8810 42
Pair 3 Intention 3,2176 -,86471 34 ,780 ,000 -5,445 ,000
Intention performance high 4,0824 34
Pair 4 Intention 3,4333 ,17143 42 ,833 ,000 1,446 ,156
Intention performance low 3,2619 42
Pair 5 Trust 4,1394 -,74545 33 ,784 ,000 -5,458
,000
Trust admin low 4,8848 33
Pair 6 Trust 4,1706 ,57059 34 ,665
,000 3,361 ,002
Trust admin high 3,6000 34
Pair 7 Intention 3,3636 -,90303 33 ,693 ,000 -4,842
,000
Intention admin low 4,2667 33
Pair 8 Intention 3,2176 ,40588 34 ,725 ,000 2,417 ,021
Intention admin high 2,8118 34
Pair 9 Trust 4,1394 -,55758 33 ,681
,000 -3,169
,003
Trust reputation low 4,6970 33
Pair
10
Trust 3,9571 -,59048 42 ,852 ,000 -6,022 ,000
Trust reputation high 4,5476 42
Pair
11
Intention 3,3636 -,78182 33 ,608 ,000 -3,748
,001
Intention reputation low 4,1455 33
Pair
12
Intention 3,4333 -,41905 42 ,892 ,000 -4,394 ,000
Intention reputation high 3,8524 42

50
5.4 Background questions
In order to better understand the attitude of people towards salary levels in nonprofit organizations,
several background questions were asked in the questionnaire. .
1. I think information about a director’s salary in a charity organization is important in my
decision to donate.
2. I would actively look for information regarding a director’s salary of a charity organization
if I wanted to donate.
3. I think that directors in charity organizations should earn less than directors in for-profit
organizations.
4. I think that charity organizations should pay their directors a lot, because this will
guarantee proper leadership.
5. I think that directors in a charity organization should accept a lower salary then they could
earn in a for-profit organization, because they choose to work for charity.
Table 15 shows statistics for question one to five (columns). All questions were answered by 148
respondents. For all questions, the mean and standard deviation are displayed, as are several
statistics concerning the normal distribution of the responses. The last two rows indicate the
minimum and maximum values that respondents indicated based on a 1-7 Likert scale. Except for
question 4, all questions contained answers in the range of 1-7.
Table 15: Statistics and assumptions background questions
1 2 3 4 5
N Valid 148 148 148 148 148
Missing 0 0 0 0 0
Mean 5,04 3,44 5,16 2,72 5,06
Std. Deviation 1,538 1,754 1,657 1,385 1,613
Skewness -,842 ,401 -,752 ,632 -,682
Std. Error of Skewness ,199 ,199 ,199 ,199 ,199
Kurtosis ,079 -,899 -,220 -,358 -,240
Std. Error of Kurtosis ,396 ,396 ,396 ,396 ,396
Minimum 1 1 1 1 1
Maximum 7 7 7 6 7

51
Two correlation analyses were performed to identify underlying patterns in the data. Table 16
shows how the background questions correlate with Salary, Trust and Intention to donate. Table 17
shows correlations between the background questions and the control variables gender, age,
education and income. Both tables show significant correlations in bold and with one or two
asterisks for correlations significant at the 95% and 99% confidence interval, respectively.
Table 16: Correlation analysis with salary, trust and intention to donate
Salary Trust Intention 1 2 3 4 5
Salary
Trust -,461**
Intention -,541**
,918**
1 ,136 -,361**
-,353**
2 -,008 -,206* -,207
* ,460
**
3 ,214**
-,208* -,277
** ,361
** ,220
**
4 -,079 ,071 ,095 -,244**
-,105 -,218**
5 ,051 -,115 -,153 ,243**
,253**
,684**
-,263**
**. Correlation is significant at the 0.01 level (2-tailed).
*. Correlation is significant at the 0.05 level (2-tailed).
Table 17: Correlation analysis with control variables
Gender Age Education Income 1 2 3 4 5
Gender
Age -,234**
Education ,009 -,326**
Income -,320**
,657**
-,047
1 -,043 ,171* -,027 ,144
2 -,218**
,128 -,036 ,090 ,460**
3 -,127 -,054 ,113 ,045 ,361**
,220**
4 ,017 -,132 ,036 -,118 -,244**
-,105 -,218**
5 -,149 -,051 ,104 -,014 ,243**
,253**
,684**
-,263**
**. Correlation is significant at the 0.01 level (2-tailed).
*. Correlation is significant at the 0.05 level (2-tailed).
In addition, table 18 presents the frequencies in percentages of the answers given to the different
questions. This allows to analyze opinions of respondents on the topic of executive salaries in

52
nonprofits. Column one displays the Likert scale with answering options 1-7, the other columns
represent question 1-5.
Table 18: Frequencies background questions in percentages
Likert scale 1 2 3 4 5
1 Do not agree at all 3,4 13,5 2,7 20,9 2,7
2 4,1 21,6 8,1 29,1 6,8
3 10,1 23,6 4,1 25,0 8,1
4 12,8 12,2 15,5 11,5 12,2
5 20,9 11,5 21,6 9,5 27,0
6 34,5 12,8 21,6 4,1 20,9
7 Completely agree 14,2 4,7 26,4 22,3
Total 100,0 100,0 100,0 100,0 100,0

53
6. Analysis
This section will analyze the data summarized in the previous section and examine if there is
support for the hypotheses to be found and if there are any other peculiarities in the data.
6.1 Correlation Analysis
The correlation tests showed several significant relationships. The most important and significant
correlations observed were between salary and trust (r = -,461, p < ,01) and salary and intention
(r = -,541, p < ,01). These correlations imply that the higher the salary, the lower the trust and
intention to donate. Moreover, there is an extremely strong and positive relationship between trust
and intention (r = ,918, p < ,01). The negative correlations between gender and age (r = -,234, p
< ,01) and gender and income (r = -,320, p < ,01) indicate that men in this sample were likely to be
older and had a higher income (values in analysis male = 1, female = 2).
There are positive correlations between age and education which implies that in this sample the
younger the respondent the higher her or his education (r = -,326, p < ,01). Also, age and income
are positively related (r = ,657, p < ,01) which leads to the logical conclusion that older
respondents are likely to have higher salaries. To improve understanding of these findings, two
cross tabulations were run. First of all, the cross tabulation of age * education was run (see table
19). This crosstabulation showed a large amount of respondents between 18 and 45 (over 70% of
the sample) together with a high concentration of University degree holders or students working
towards a degree (over 60% of the sample).
Table 19 : Age * Education Crosstabulation
Education
high
school
practical
education
university of
applied sciences
university Total
Age
18-25 2 1 6 37 46
25-44 0 3 16 42 61
45-65 4 5 13 13 35
65 0 1 3 1 5
Total 6 10 38 93 147

54
Next to this, the age * income crosstabulation (table 20) shows that a large part of the respondents
between 18 – 25 have an income under €15.000 a year, and are thus likely to be students. The
category between 25 and 44 is a bit more widespread, but still has a concentration in the lower
income categories.
Table 20 : Age * Income level Crosstabulation
Income level Total
<15 15-30 30-45 45-60 60-120 120>
Age
18-25 32 11 3 0 0 0 46
25-44 12 14 21 8 6 0 61
45-65 1 6 3 6 15 4 35
65 0 2 0 1 1 1 5
Total 45 33 27 15 22 5 147
6.2 Mediation Analysis
In order to test for mediation and thus test hypothesis one to four, four regressions were run.
Perfect mediation occurs when the independent variable (salary) has no effect on the dependent
variable (intention to donate) when the mediator is controlled. In other words, when the path from
the independent variable (salary) to the dependent variable (intention to donate) is reduced to zero
by including the mediator (trust), there is strong evidence for a single (perfect) mediator. However,
if this path is not zero, it is likely there are multiple mediating factors at work. Examining table 10,
it appears that trust is a strong mediator of the relationship between salary and intention to donate.
Regression one (see Appendix 5.2.1) aims to predict intention to donate from the level of salary. It
shows that the level of salary significantly predicts intention to donate, β = -,541, t = -7,779, p <
,001. The salary level explained a significant proportion of variance in intention to donate,
adjusted R² = ,288, (F(1,146) = 60,511, p < ,001). This lends support to hypothesis 3, which stated
that high executive salaries in a nonprofit will decrease the intention to donate to a nonprofit. This
finding is fundamental to this model and supports Balsam and Harris’ (2012) finding that high
executive salaries decrease donations.
Then, regression two (Appendix 5.2.2) aims to predict trust from the level of salary. Hypothesis 2
stated that high executive salaries in a nonprofit will negatively affect trust in a nonprofit and thus

55
predicts a negative correlation. Again, there is support for this hypothesis such that it is not
rejected. Regression two is significant (F(1,146) = 39,397, p < ,001) with β = -,461, t = -6,277 (p <
,001) and an adjusted R² of ,207.
Regression three examined the relationship between trust and intention to donate, answering to
hypothesis 1 which posed that trust in a nonprofit will positively affect the intention to donate to
this organization. The regression is significant (F(1,146) = 783,223, p < ,001) and shows that trust
explains approximately 85% of the variance in intention to donate. Also the beta is very high and
significant (β = ,918, t = 27,986, p < ,001) showing a strong positive correlation between trust and
intention to donate.
This means that the three pre-conditions of the mediational model are met. Then, model 4 attempts
to measure the mediational model in which it is hypothesized (hypothesis 4) that salary negatively
influences trust and that trust negatively influences intention to donate. The mediational model
shows to be significant (F(1,146) = 60,511, p < ,001). The effect from salary to intention β = -,541
(p < ,001) is decreased when trust is entered into the equation to β = -,150 (p < ,001) and the
adjusted R² shows that salary and trust together explain 86% of the variance in intention to donate.
Thus, there is strong evidence that trust partially mediates the relationship between the level of
executive salary in nonprofit and the intention to donate from donors, supporting hypothesis 4.
One extra regression analysis was run: step four plus the control variables. This was done to make
sure the established effects were not completely or partially caused by one or more of the control
variables. This was not the case, as can also be seen in table 10. First of all, the control variables
did not add to the model (little change in adjusted R²). Moreover, none of the variables (gender,
age, education and income level) had significant betas influencing the regression equation. This
result was expected because of the insignificant correlations found earlier in the analysis.
6.3 Performance
Hypothesis 5 proposes that strong performance of a nonprofit can mitigate the negative effect of
high executive salaries on trust and intention to donate. First of all, the scales trust and intention to
donate under performance were examined. Both trust (Cronbach α = ,955) and intention to donate

56
(Cronbach α = ,980) had high reliability scores. Trust could not be improved by deleting any items,
but intention to donate could have been α = ,983 if item 3 would have been deleted. For the purpose
of consistency and because the alpha was still very high, the item was kept in the analysis.
Simple linear regressions were performed to test whether there exists a relation between
performance and trust and intention to donate. The regression yielded a significant relation
between performance and trust (F(1,74)=14,223, p < ,001) with β = ,402 (t = ,402, p < ,001). The
relationship between performance and intention to donate is also positive with a β = ,292 (t =
2,2626, p=,010), though less significant (F(1,74) = 6,896, p =,010). Thus, there is support for the
idea that a high performance increases the level of trust and intention to donate.
Moreover, significant differences for trust (F(1,74) = 14,233, p < ,001) and intention to donate
(F(1,74) = 6,896, p < ,001) under a high and low performance scenario were found trough a
one-way Anova analysis. Thus, both the low and high performance treatment lead to differences in
trust and intention to donate. Furthermore, a paired sample t-test was executed to find that both the
difference between trust and trust under the high performance scenario (Mean diff = -,71, p < ,001)
and the difference between intention and intention under the high performance scenario (Mean diff
= -,86, p < ,001) are significant. This indicates there were significant differences between trust
without the treatment and trust with the high performance treatment.
To conclude, the significant regressions indicate an important role for performance of a nonprofit
on trust and intention to donate to a nonprofit. This is emphasized by the fact that the values for
trust and intention to donate are strongly influenced by whether there is a high or low performance
scenario. However, it seems that only high performance plays a significant role in changing trust
and intention to donate. Trust and intention to donate were significantly higher under the high
salary scenario and high performance treatment, than under just the high salary scenario. When
there was a high salary and a low performance, this did not seem to make matters worse.
For all results regarding the analysis for performance, see appendix 5.4.

57
6.4 Administrative Ratio
Hypothesis 6 proposes that a low administrative ratio of a nonprofit can mitigate the negative
effect of high executive salaries on trust and intention to donate. Again, the scales trust and
intention to donate (this time under administrative ratio) were examined. Both trust (Cronbach α =
,945) and intention to donate (Cronbach α = ,979) had high reliability scores. Trust could not be
improved by deleting any items, but intention to donate could have been α = ,981 if item 3 would
have been deleted. For the purpose of consistency and because the alpha was still very high, it was
decided to keep the item in the analysis.
Then, simple linear regressions were performed to test whether there exists a relation between the
height of the administrative ratio and trust and intention to donate. The regression yielded a
significant negative relation between administrative ratio and trust (F(1,65) = 21,639, p < ,001)
with β = -,500, t = -4,652, p < ,001. The relationship between administrative ratio and intention to
donate is also negative with a β = -,490 (t = 4,528, p < ,001) and significant (F(1,65) = 20,505, p <
,001). There is support that a low administrative ratio increases trust and intention to donate.
Next, through a one-way Anova analysis significant differences were found for trust (F(1,65) =
21,639, p < ,001) under the low (Mean = 4,89, SD = 1,14) and high (Mean = 3,60, SD = 1,12)
administrative ratio scenario. Also, significant differences were found for intention to donate
(F(1,65) = 20,505, p < ,001) under a low (Mean = 4,27, SD = 1,44) and high (Mean = 2,81, SD =
1,17) administrative ratio treatment were found. This means that distinguishing between the low
and the high administrative ratio treatment lead to significant differences in the values for trust and
intention to donate and that respondents under the low administrative ratio have higher values of
trust and intention to donate.
Furthermore, a paired sample t-test was executed to find that both the difference between trust and
trust under the low administrative ratio treatment (Mean diff = -,75, p < ,001) and the difference
between intention and intention under the low administrative ratio scenario (Mean diff = -,90, p <
,001) are significant. This means there were significant differences between the values for trust
and intention to donate without the treatment and trust and intention with the low administrative
ratio treatment. In contrast to performance, there were also significant differences for the negative

58
sign (high administrative ratio) what indicates that a high administrative ratio under a high-salary
scenario can do even more damage to trust and intention than the high-salary scenario by itself.
To conclude, the significant regressions indicate an important role for the administrative ratio of a
nonprofit on trust in a nonprofit and intention to donate to a nonprofit. This is emphasized by the
fact that the values for trust and intention to donate are strongly influenced by whether there is a
high or low administrative scenario. Moreover, both the low and the high administrative ratio
cause significant differences between the values for trust and intention to donate without treatment
and with treatment. For all results regarding the analysis for performance, see appendix 5.5.
6.5 Reputation of the board
Hypothesis 7 proposes that a high reputation of the board of a nonprofit can mitigate the negative
effect of high executive salaries on trust and intention to donate. Similar to the other scales, trust
and (Cronbach α = ,969) and intention to donate (Cronbach α = ,975) had high reliability scores.
Neither trust nor intention to donate could be improved by deleting any items. From the simple
linear regressions it became clear that the reputation of the board did not have a significant
influence on either trust or intention to donate. The reputation did not explain any variance in the
trust (adjusted R² = -,010) and intention to donate (adjusted R² = -,002). With trust having a beta of
β = -,063 (p = ,592) and intention to donate a beta of β = -,107 (p = ,362), reputation is not very
useful in predicting trust and intention to donate.
The insignificant results also show in the one-way Anova analysis which shows an insignificant
difference for trust under the low (Mean = 4,70, SD = 1,29) and the high (Mean = 4,55, SD = 1,11)
reputation treatment. Similarly, intention to donate does not show a significant difference under
the low (Mean = 4,15, SD = 1,42) and the high (Mean = 3,85, SD = 1,33) treatment. This means
that distinguishing between the low and the high reputation of the board scenario does not lead to
significant differences in the values for trust and intention to donate.
Despite these insignificant findings, a paired sample t-test was executed to find that trust and
intention to donate under the high and low reputation treatment were significantly different from
the values for trust and intention to donate not under the treatment. This means there were
significant differences between the values for trust without the treatment and with the low

59
reputation treatment (Mean diff = -,56, p < ,01), and trust without treatment and with the high
reputation treatment (Mean diff = -,59, p < ,000). Similar results are found for intention to donate.
To conclude, the results of the influence of reputation of the board on trust and intention to donate
gives inconclusive results. There are no signs for a strong influence of reputation on trust and
intention to donate as indicated by the insignificant regressions. Moreover, the differences
between trust and intention under the high and low reputation treatment were insignificant.
However, the paired sample t-test yielded significant differences for trust and intention with
treatment and without treatment. To add to the complexity; both the low reputation and high
reputation scenario yielded higher means for trust and intention to donate than these values
without the reputation treatment. For all results for performance, see appendix 5.6.
6.6 Summary
Table 21 provides an overview of the hypotheses and whether there was found support or not.
Table 21: Summary of hypotheses
Hypotheses Supported?5
H1: Trust in a nonprofit organization positively affects the intention to donate
to this organization. Yes β = ,918, p < ,001
H2: High executive salaries in a nonprofit will negatively affect trust in a
nonprofit. Yes β = -,461, p < ,001
H3: High executive salaries in a nonprofit will decrease the intention to donate
to a nonprofit. Yes β = -,541, p < .001.
H4: The relationship between high executive salaries in a nonprofit will and the
intention to donate, will be partially mediated by trust. Yes β = -,150, p < ,001
H5: A high performance will mitigate the negative effect of high executive
salaries on trust and intention to donate. Yes
H6: A low administrative ratio will mitigate the negative effect of high
executive salaries on trust and intention to donate. Yes
H7: A high reputation of the board will mitigate the negative effect of high
executive salaries on trust and intention to donate. Mixed evidence
5 Clearly, this does not mean that the hypotheses are accepted. This can only lead to think that the null hypotheses
would be rejected. For example, if for H1 the H0 would have been “trust in a nonprofit does not affect the intention to
donate to this organization”, based on the evidence found this H0 would have been rejected. In this case, the author
decided to summarize whether supporting evidence was found towards the hypotheses or not. Values are not given for
H5-H7 as these analyses involved multiple tests – giving one value does not make sense.

60
6.7 Background questions
There are several interesting correlations to observe concerning the background questions with
salary, trust and intention to donate. First of all, there is a significant positive correlation (r = ,214,
p < ,01) between salary and question 3 (I think that directors in charity organizations should earn
less than directors in for-profit organizations). This is interesting because the salary level was
controlled i.e. assigned randomly to respondents. An independent sample t-test indicated that
respondents under the low salary scenario answered significantly lower than respondents under the
high condition (t = -2,650, p < ,01).
Secondly, for the majority of the respondents, information about a director’s salary is important in
the decision to donate (Q1; Mean = 5,04, SD = 1,538). Almost 70% of respondents indicated a
value of 5 or higher on the 1 to 7 Likert scale. Although the majority of the respondents indicate
that the information regarding a director’s salary is important in their decision to donate, the
majority of the respondents indicate they would not actively seek for this information when they
would want to donate (Q2 Mean = 3,44, SD = 1,754). However, question 1 is significantly
positively correlated with question 2 (r = ,460, p < ,01), which indicates that people who find
information regarding a director’s salary more important in their decision to donate are more likely
to actively search for this information. Additionally, trust is negatively correlated to question 1 (r =
-,353, p < ,01>), question 2 (r = -,207, p < ,05) and question 3 (r = -,277, p < ,01). This means that
respondents who find a director’s salary more important in their decision to donate, who would
actively look for information regarding the director’s salary and who think that directors in
nonprofits should earn less than directors in for-profit organizations show lower values of trust.
Similar correlations are found for intention to donate with question 1 (r = -,353, p < ,01), 2 (r =
-,207, p < ,05) and 3 (r = -,277, p < ,01).
Also, respondents who think information about a salary to be important (Q1), are more likely to
think that directors in nonprofits should earn less than their for-profit counterparts (Q3; r = ,361, p
< ,01) and agree to a larger extent with the idea that nonprofit directors should accept a lower
salary than they could earn elsewhere because they choose to work for charity (Q5; r = ,234, p <
,01). Moreover, respondents who find information regarding the salary important are more likely

61
to stand negative towards the idea that charity organizations should pay their directors high wages
to ensure good leadership (Q4: r = -,244, p < ,01)
In addition, respondents who would actively look for information (Q2) are more likely to think that
directors in charity organizations should earn less than directors in for-profit organizations (Q3; r =
,220, p < ,01) and should accept lower salaries than they could earn in a for-profit organization
(Q5; r = ,253, p < ,01). Moreover, question 4 stating that charity organizations should pay their
directors a lot is (logically) negatively correlated with question 3 (r = -,218, p < ,01) and question 5
(r = -,263, p < ,01) that state that directors in charities should earn less than they could in for-profit
circumstances.
There are two meaningful findings in the correlation analysis with the control variables. The first
one is the finding that age is positively correlated with question 1 (r = , 171, p < ,05), indicating
that the older the respondent, the more important information about a director’s salary is deemed in
the decision to donate. The second one is that gender is significantly negatively correlated with
question 2 (r = -,127, p < ,01) stating that the respondent would actively look for information
regarding a director’s salary of a charity organization if he or she wanted to donate. This means
that (with male = 1, female = 2) men are more likely to actively search for information regarding a
director’s salary.

62
7. Discussion
The sample of this study can be characterized by several features. Firstly, the social and
professional network of the author show clearly in the sample: most people are between 18 and 45
years old, have obtained or are working towards a university degree and most of them have a lower
income as a result of their student status. Secondly, the fact that the questionnaire was
administered online could explain the low concentration of respondents over 65. Sargeant and Lee
(2004) stated that previous studies have consistently shown that demographic variables such as
income, occupation, age, education and gender are strong predictors of the amounts individuals
will give. Individuals who are female, are older, have enjoyed a higher education and have a higher
income usually show more positive charitable behavior (Bekkers and Wiepking, 2011; Wiepking
and Bekkers, 2012). However, the current analysis shows that none of the control variables had a
significant influence on the trust in the nonprofit organization and the intention to donate to this
organization. This is not in line with existing literature but could be partly explained by the fact
that the distribution of the sample of different gender, age, education and income categories are not
completely evenly distributed. Also, the respondents were able to answer only in categories
instead of continuously. This may have eliminated any effects of these variables. Moreover, the
insignificant findings could be explained by the complex interactions between different variables
(Wiepking and Bekkers, 2012). For example, in the current sample there is no noteworthy
relationship between age and trust and intention to donate while most studies have found a positive
relation between age and giving behavior. This discrepancy could be explained by the idea that it is
expected that the effects of age on charitable behavior are partly due to interactions with income,
marital status and religion (Bekkers and Wiepking, 2011).
The question guiding this study was “why do high executive salaries decrease donations and how
can this negative effect be averted”. This question is answered to in two parts. First, a mediation
analysis was performed and then three specific analyses were performed to examine if the
proposed factors could mitigate the negative effect that was expected in the mediation analysis.
The idea that trust is fundamental to the existence of nonprofits is underscored in this study: trust
explained approximately 85% of the variance in intention to donate and there is a strong positive
relationship to be observed. Thus, the more a donor trusts a nonprofit, the more likely the donor is

63
to donate the nonprofit. This result supports previous findings on the positive correlation between
trust and charitable behaviour. Trust in a nonprofit seems to decrease the perceived risk of a
donation because the donor believes the organization to do well with the money donated.
90% of donors aged 20-35 in the US stated they would stop giving if they don’t trust the
organization (Millenial Donors, 2011). It was discussed that high salaries can be perceived as a
violation of trust and this also shows in the results. The regression analyses showed a strong
significant negative correlation between the level of the executive salary and trust. Similarly, high
executive salaries decreased the intention to donate. There is a direct negative relation between the
salary level and intention to donate and strong evidence that a large part of this relationship can be
explained by the decrease in trust after observing a high executive salary. Thus, it seems that when
a nonprofit pays a high executive salary, donors find their trust in this organization to be violated
and exhibit a lower intention to donate. However, this study does not show full mediation. This
means that trust is not the only factor that explains the negative relation between high executive
salaries and intention to donate. A significant reduction in the relation between the level of salary
and intention to donate indicates a strong mediator, but this is not a necessary and sufficient
condition for the effect to occur (Baron and Kenny, 1986). Thus, there must be other factors at play
that explain why high executive salaries are negatively related to the intention to donate and a
decrease in trust cannot be interpreted as a necessary or sufficient condition for the decrease in
intention to donate.
Following the conclusion that the relation between the level of executive salaries in nonprofits and
intention to donate can be partly explained by trust, several factors were examined that were
proposed to mitigate the negative consequence from a high executive salary by improving the trust
in the nonprofit or the intention to donate. This first factor was performance of the nonprofit.
It was expected that if performance was high, donors would allow a nonprofit to pay a higher
salary because of the good results achieved. First of all, it became clear that a good performance
has a positive influence on the trust in a nonprofit and the intention to donate to a nonprofit. This is
an important finding as despite several suggestions towards how to measure performance (Sawhall
and Williamson, 2001; Sargeant, Ford and West, 2006; Epstein and MacFarlan, 2011), no studies

64
were found that actually linked the performance of a nonprofit to what donors think of the
nonprofit. Next to this, it became clear that trust and intention to donate were higher under the high
performance treatment than under the low performance treatment. Moreover, when respondents
heard about a high executive salary, their trust and intention to donate were higher when they
additionally heard about a high performance than when they did not. This leads to think that
performance is a key communication factor for nonprofits in the case where the organization has to
explain a high executive salary. It should be noted however, that a low performance did not worsen
the trust and intention to donate of a potential donor. It seemed that a high performance did help
the nonprofit to regain trust and intention to donate, but that a low performance did not decrease
trust and intention more after donors knew about a high executive salary. These results indicate
that it only makes sense to communicate a high performance. Communicating a low performance
does not make sense to start with, but the results indicate that it would not hurt a nonprofit even
more when donors know about a low performance while being aware of a high executive salary.
Thus, although performance in terms of achieving goals in line with the mission has to the author’s
knowledge never been identified as a key factor in the donor’s decision making, this study shows
that good results can be communicated to donors in order to increase trust and intention to donate.
The second factor examined was administrative ratio. This appears to be a strong factor
influencing trust and intention to donate. Firstly, it was found that administrative ratio had a strong
negative relation with trust and intention to donate, meaning that the higher the administrative
ratio, the lower the trust and intention to donate and vice versa. This supports the finding of
Tinkelman and Mankaney (2007) that donors view high administrative ratios negatively.
Similarly, it was found that respondents under the low administrative ratio treatment showed
significant higher trust and intention to donate than respondents under the high administrative ratio
treatment and that the values for trust and intention to donate under the low administrative
treatment were significantly higher than without the treatment (i.e. only under the high salary
scenario). This means the lower the administrative ratio, the higher trust and intention to donate
(potential) donors show. The finding that a high executive salary can be justified by a low
administrative ratio can indicate that donors see executive salaries as a relative factor. If a director
earns a lot, but the administrative ratio is low then either the salary is a very minor part of costs, or
the director performs so well that the organization is very efficient.

65
It is important to note that in contrast to performance, the negative treatment for administrative
ratio (high ratio) actually decreased the values for trust and intention from the values without
treatment significantly. Thus, if there is a high salary and a low performance this does not worsen
the trust and intention, but when there is a high salary and a high administrative ratio, donors seem
to reach an all-time low on trust and intention to donate. This emphasizes the importance of the
administrative ratio as a factor that can attract or deter donors and should thus be carefully
monitored and communicated to stakeholders.
The idea that a low administrative ratio can increase trust and intention to donate could play a more
significant role in communications of nonprofits in the future. However, there is a big drawback to
this finding. Similar to for-profit organizations, an incentive to provide information on lower costs
or higher profits can lead to dysfunctional behaviour. There are already widespread concerns about
the quality of the data that nonprofits provide on their fundraising and administrative costs. Now it
seems that donors prefer organizations with low administrative ratios, donors, the general public,
oversight agencies and governments should become more wary about fraud and corruption issues.
In addition to this, and maybe even more important is the idea that if nonprofits decide to decrease
their administrative costs, basic organizational infrastructure such as IT systems or staff training
will suffer (Gregory and Howard, 2009).
The third factor of which the influence on trust and intention to donate was assessed was the
reputation of the board. The logic was that if a nonprofit has a board consisting of highly
reputational members, this could justify a high salary because the credibility of the board members
would be at stake if they would engage in mis-use of funds. The results of this analysis were less
clear. The reputation of the board did not seem to have an influence on trust and intention to donate
and there was no distinction between the values of trust and intention to donate under the low and
high reputation. However, a high reputation did improve the values for trust and intention from the
values for trust and intention to donate under just the high salary scenario, indicating that hearing
that a strong and well-known board is in charge of determining a salary can offset some negative
effects from the high salary. Something extraordinary is that the low reputation also improves the
values for trust and intention from the non-treatment values.

66
It is therefore important to interpret the findings concerning the different factors with caution due
to the way the questionnaire was built. Firstly, the respondents would receive the high salary
scenario, then a positive treatment and then a negative treatment. It might be that the positive
treatment offset the negative feelings generated through the negative treatment. For example,
because the low administrative ratio was such a strong factor, it might be that respondents still had
this in mind when answering the questions under the low reputation treatment (group 2
respondents) and did not attach too much value to the negative sign.
The first striking finding derived from the background questions was the positive correlation
between the salary level and question 3 (I think that directors in charity organizations should earn
less than directors in for-profit organizations). Respondents under the low salary scenario agreed
significantly less with this statement than respondents under the high scenario. This is interesting
because the salary level was controlled i.e. assigned randomly to respondents. This indicates that
respondents under the high salary scenario showed a stronger negative attitude towards the
question whether they thought that directors in charity organizations should earn less than
directors in for-profit organizations. This result could be due to the set-up of the questionnaire, in
which the high salary scenario might have triggered more negative thoughts about a director’s
salary. This can indicate positive and negative things concerning the quality of the questionnaire.
First of all, this finding confirms that the distinction between high and low scenario actually has an
effect on the answers respondents give. In contrast, it looks like the high scenario made the
respondents more aware of the issue at hand and thus the responses might have been biased based
on whether respondents received high or low salary scenarios. One additional interesting thing to
note is that salary is not significantly related to question 5, which is very strongly correlated with
question 3 (r = ,684, p < ,01) and of which the statement is very similar to question 3 in terms of
content. Thus, respondents did not differ significantly on this question respective to which salary
scenario they received.
The second important finding has to do with the information seeking behaviour of respondents.
The majority of the respondents indicate that the information regarding a director’s salary is
important in their decision to donate, but at the same time the majority of the respondents indicated
they would not actively seek for this information when they would want to donate. Although the

67
information regarding the executive salary is relatively easy to find these days (annual report,
website), for many donors it still seems difficult and costly to gather the information. Thus, there is
a gap between the information people want and how much effort they are willing to make to get it.
Hibbert and Horne (1997) explain that extensive problem solving behaviour is uncommon among
donors. This could indicate that most respondents would rely on media reports of extravagant
salaries instead of looking for information regarding the salary themselves as mentioned by
Balsam and Harris (2012). This is a crucial finding because when the time comes that a high salary
gets publicized in the media, it is unlikely that the nonprofit will be profiled favourably. Thus even
if the high salary can be justified (by for example a high performance or low administrative ratio)
by the time it will appear in the media it will most likely be too late for the nonprofit to limit the
damage this does its reputation.
It should be noted there is a strong, positive, significant correlation between question one and two,
indicating that the more important a respondent finds information about a director’s salary in the
decision to donate, the more active he or she would look for information regarding this matter.
However, it seems that the more donors would seek information regarding executive salaries in
nonprofits, the less trust and intention to donate they have. This could point towards the idea that
respondents who perform a more extensive information search on this topic, know more about it
and are thus more wary towards this kind of organizations.
Thus, communicating information regarding this matter should be timely, through a proper
medium, accompanied by the right information and to the right target group. This last point is
important because the question that remains is which part of (potential) donors is actually
concerned about high executive salaries in nonprofits. It seems that when respondents find a
director’s salary important in their decision to donate, they show lower values for trust and
intention to donate in general and are of the opinion that directors in nonprofits should earn less
than when they work for a for-profit organization..But which group of (potential) donors find this
information most important? Are they current donors or is it the general public that rarely donates?
The findings that older people are more concerned with this type of information and that men are
more likely to search emphasizes that importance of targeting communication to the right groups
Should nonprofits engage to engage in extensive communication regarding this matter with the

68
general public or just with their most salient stakeholders? Despite this confusion, there is still the
important finding that high salaries decrease donations (Balsam and Harris, 2012) and thus the
general public is important. It can be that for donative nonprofits this effect is enlarged because
they are dependent on the goodwill of the public instead of subsidies etc.
Finally, one of the main arguments to pay executives in nonprofit a high salary is because large
nonprofits need adequate managers and strong leadership. However, 75% of the respondents
disagree with question 4 stating that that nonprofits should pay their directors high salaries because
this would ensure proper leadership. Moreover, the majority of the sample thinks that directors in
nonprofits should earn less because they decide to work for charity. Thus, it really seems that
nonprofits should give up arguing that directors should earn high salaries because the organization
needs good leadership (although they undeniably have a point) and start emphasizing their
alterable factors such as performance and administrative ratio. It is in this case not about what is
true, but about what donors and the general public deem to be important.

69
8. Risks and limitations
This research aims to initiate research on this salient topic. The findings found in this research are
very interesting and possibly valid, but should be used with caution. The risks and limitations of
this research stem from the way in which this study was conducted, the set-up of the questionnaire
and the scenarios and from general limitations regarding statistical methods.
Firstly, an important limitation and risk at the same time was that there was relatively little
previous research on this specific topic. All variables were extensively discussed in the literature,
but never taken together. This study took upon itself to simultaneously establish the relation
between high executive salaries and a decreased intention to donate, and assessing factors that
could mitigate this relationship. If, despite anecdotal and some empirical evidence, there would
not have been a negative relation between high executive salaries and intention to donate for
whatever reason, the rest of the analysis could not have been performed. Moreover, there was little
evidence for the three proposed factors to mitigate the influence of high top executive salaries is
not exhaustive. In this study, the assessed factors were deducted from a literature review. Having
had exploratory research on this topic would have been helpful. For example focus groups on
which factors could justify a high executive salary or a case study to see how the organization
handled negative news coverage could have shown other factors. Moreover, this questionnaire did
not take into account other “alterable attributes” or efforts from the nonprofit such as advertising of
other fundraising efforts or the “unalterable attributes” from the donors such as moral obligation or
affinity with the cause which would important factors to take into account in a real-life situation.
Secondly, as in any survey based on self-report measures, it is hard to control for respondents who
fill out the questionnaire without actually engaging in it. Moreover, issues such as social
desirability (Cheung and Chang, 2000) might decrease the reliability of the study. Especially in
studies on charitable behaviour, respondents may be motivated to report higher levels of charitable
behaviour to present themselves more favourably.
Thirdly, many potential respondents were excluded from the final analysis because of the filter
question which severely decreased the final sample size used for analysis. The filter question was
very “black or white” and this has cost the research many respondents. It would probably have

70
been more useful to measure trust and intention without any treatment and thus instead filter the
respondents based on answering the whole set of 10 questions and then erase the respondents
below a trust / intention to donate value 3 or 4. This way it could also have been possible to
measure trust, then trust plus the high salary scenario and thirdly trust plus high salary plus a
treatment and it would have really been possible see to what extent the treatments would mitigate
the negative effect of high salaries.
Fourthly, Torres-Moraga, Vásquez-Parraga and Barra (2010) mention that familiarity is a
requirement in the pursuance of trust and that familiarity with charity organizations can be
connected with donor’s trust in the recipient organization. This study made use of a fictional
nonprofit so that people would not have any judgements regarding this organization. However, this
could have had the unintended effect of decreasing trust and intention to donate due to
unfamiliarity with the organization. This could be because of a lack of trust due to a lack of
experience with the organization or lack of the familiarity of the name.
Fifthly, only the intention to donate was examined. As mentioned before, there exists an
intention-behaviour gap of which can be assumed that a certain amount of the respondents that will
actually donate is lower than the amount that indicated they would donate. Again, attempting to
measure the intention and then the real behaviour would have been difficult with a fictional
organization. This could have been done in a laboratory setting with first assessing intention to
donate and then give the participant “real” money to distribute, but it is still likely that this will
show major discrepancies with real life behaviour.
In the sixth place, one should take caution drawing conclusions from cross-sectional models, even
though there is support for the causal model. Cheung and Chang (2000) explain that support for a
causal model does not mean there actually exist causal relationships as hypothesized when the
study has been cross sectional. Bekkers and Wiepking (2011) support this by stating that in order
to establish causality, experiments or longitudinal data and appropriate statistical models are
needed.

71
Finally, nonprofits should take caution interpreting these results because the applicability to
different types of nonprofits and different sizes of nonprofits has not been tested. The problem of
high executive salaries seems to be centred within a small group of organizations, as indicated by
the fact that only 40 individuals at 25 organizations were liable for more than $21 million in excise
taxes from excessive nonprofit executive compensation in the US (Guidestar, 2011). However, the
results of this study are important for all nonprofits as it would seem that fewer and fewer
nonprofits will get away with excessive salaries in the future as public scrutiny and attention on
governance issues in nonprofits is on the rise.

72
9. Future research
There are several directions for future research that flow out of the current study. Firstly, the author
proposes more research on alterable attributes of nonprofits. If nonprofits know better which
points they can actually influence should be emphasized, these could be combined with the
unalterable attributes and this could lead to highly improved fundraising techniques. Moreover, it
would be good to engage in research that explains why most nonprofit employees and managers
think their director is appropriately paid (Scheitle, 2009) and the general public seem to think that
nonprofit directors are overpaid for the work they do. If research is able to identify the factors that
clearly differentiate between these two groups it could be examined whether these factors will
make a difference in the opinion of (potential) donors on high executive salaries.
Secondly, this study indicates that a high performance in terms of achieving goals in the context of
the mission positive influence on trust and intention to donate. Under a high salary scenario, a high
performance has significant influence on trust and intention to donate of the donor, but is a high
performance as a trigger for donors to donate under normal circumstances? It is worth to assess
whether this factor stronger when there is a high salary because it serves to justify this, or is it
worth communicating this under normal circumstances as well? In other words, is performance a
significant alterable attribute that can urge donors to donate to a nonprofit? The same questions
come to mind concerning the administrative ratio, although there has been considerably more
research on this.
Thirdly, in this study respondents were not asked whether they were current donors or not. It
would be interesting to see whether current donors found information regarding executive salaries
in nonprofits more important and thus would more actively look for information, or that potential
donors find this information more important. This would explain more about the salience of this
topic and which groups should be targeted with communication about executive salaries.
Fourthly, to tackle the unfamiliarity issue described in the risks and limitation section the author
proposes to repeat this type research for specific organizations. For example, this research could be
done with existing donors of a specific organization and with potential donors, or a case study of a
salary scandal could be performed to see what happened to donations around that time and how the
perception of the public towards this organization changed.

73
In the fifth place, this conceptual model has proven useful and could be improved and extended in
the future. For example, it could be extended towards a moderated mediation model, which would
suggest not only a mediational process, but also which subsamples demonstrate the mediated
effects. For example, different types of donors (Rose, Holmbeck, Coakley and Franks, 2004) could
be expected to show different characteristics under different moderators. For example, the
difference in trust and intention for the low and high performance group in this study, indicates
that performance could be an important moderator for the relationship between salary level and
trust and salary level and intention to donate.
In the sixth place, some nonprofits have been forced by their government or other governing
institutions to decrease the salary of their director(s). Scheitle (2009) mentions that while a
dissatisfied donor may stop donating, the government has the power to revoke a nonprofits’
status. Scheitle poses this is the ultimate punishment for a nonprofit. It could be interesting to see
which party is a more important stakeholder for the nonprofit, and see whether there are conflicts
of interest. It could be expected that this differs with the type of nonprofit and in terms of how
much a nonprofit is reliant on the government for subsidies or on the public for donations.
Moreover, there is little research to be found regarding the effect of board composition in
nonprofits. There is a fair amount of research executed in the nonprofit sector, but no reasons could
be found for the mixed findings in this study. Additional empirical research should be encouraged
to find whether powerful boards can, next to internal benefits, provide external benefits as
suggested by Handy (1995).
Lastly, an important topic for future research would be “crisis management” for nonprofits. How
should nonprofits handle violations of trust because for example mis-use of funds. Poppo and
Schepkens (2010) raised this interesting issue by asking “what types of strategies can
organizations use to repair public trust following a competence violation and an integrity
violation?”. Now nonprofits are urged to become more business-like, one can expect more
scandals to either occur or to come to light in the future. Nonprofit organizations should know how
to respond to these problems, just like for-profit organizations that prepare for crises.

74
10. Practical implications
This study was not meant to find the ultimate formula for executive compensation in nonprofits
and thus does not serve to educate nonprofit managers or compensation committees on how to set
their compensation policies. However, there are some lessons to be learned from the findings in ths
research.
Firstly, nonprofits and governing agencies should keep adding to the perceived trustworthiness of
their organization. It is again underscored that trust plays a major role in the existence of and the
intention to donate to nonprofits. This study points towards the strategy of providing (potential)
donors with hard numbers about the organizations to add to trust, although this has to be proven in
a context without a high salary situation
Secondly, it is important for nonprofits to consider whether to specifically include information
about a director’s salary in the communication or not. From the research it seemed that when
respondents found themselves in the high salary scenario they had more negative attitudes towards
high executives salaries which leads to think that one should avoid mentioning high salaries at all.
On the other hand it can be argued that if nonprofits want to establish an honest and long-term
relationship with their donors and other stakeholders that honesty and transparency is of crucial
importance. The majority of respondents indicated that information on this matter is important but
that they would not look for it, so there lies a role for nonprofits to provide (potential) donors
timely with the right information, before media or other parties might create a scandal of it.
Lastly, the whole nonprofit sector should understand that the key to avoiding salary scandals that
not only attack the nonprofit in case but the whole sector, seems to be education of and
communication towards the public. There seems to be a large gap between the perception of
people working in the nonprofit sector and the general public concerning the need for high salaries
for executives in this sector. There lies a big role for nonprofit managers to supply their (potential)
donors with relevant information that contribute positively to the idea that the nonprofit uses the
donations wisely. This might be equally important to creating an awareness of need for the cause
or to facilitate easy donating.
75
11. Conclusion
The question to be answered in this study was “why do high executive salaries decrease donations
and how can this negative effect be averted”. The idea of a relationship between the executive
salary level in nonprofits and the intention to donate from donors derived mostly from anecdotal
evidence. Therefore, it was firstly aimed to establish the negative relationship between the
executive salary level in a nonprofit and intention to donate. It appeared that a high executive
salary significantly decreases the intention to donate from donors. Then it became of interest to
explain why this happened. Existing literature had pointed towards the idea that high executive
salaries could hurt trust in a nonprofit and that trust was highly predictive of the intention to
donate. This study empirically established this relationship through a mediational model which
suggests that high executive salaries decrease trust which in turn decreases intention to donate.
However, there are several things a nonprofit can do in order to mitigate this negative relationship
and partly justify why their executive has to earn such a high salary. It appears that when
nonprofits communicate a high performance and a low administrative ratio to their (potential)
donors, donors regain some trust and also intention to donate they lost as a consequence of the high
executive salary. It is not clear what effect the reputation has on trust and intention to donate.
Thus, it seems that nonprofit should keep investing in building trust in order to increase the
intention to donate and then facilitate the donating process such that the intention can be
transformed into actual behaviour. It seems that donors to donative organizations are very
sensitive to mis-steps of a nonprofit such as excessive executive salaries and thus everything
should be done in order to prevent salary scandals from happening, or being prepared for
re-building trust after a salary scandal occurs
In order to avoid future scandals, nonprofits should inform its stakeholders timely on
compensation practices and include relevant information to explain why executives earn the
amounts they do. Most donors do not seem to engage in extensive information seeking on this
topic and will rely on media coverage if not informed otherwise. The argument that nonprofit
directors should earn high salaries because this would attract proper leadership and ensure an
efficient organization seems outdated.

76
Despite the significant findings, the results should be interpreted and implemented with caution.
Encouraging nonprofits to publish low administrative ratios might encourage dysfunctional
behaviour and before starting to communicate performance, nonprofits have to make sure they
measure it accurate. If these factors are meant to justify high salaries, they should be legit or
donor’s confidence will be damaged even further.
To conclude, there lies an important role for the nonprofit sector as a whole to educate its
stakeholders on compensation practices in nonprofits, which may be more different from the
for-profit sector than might be assumed now. It should be noted that there lies a big gap of
knowledge in this field and that this study is only the first step towards understanding how donors
react to governance issues in nonprofit organizations.

77
Literature
Azjen, I., 1991. The Theory of Planned Behavior. Organizational behavior and human decision
processes, Issue 50, pp. 179-211.
Baber, W. R., Daniel, P. L. & Roberts, A. A., 2002. Compensation to Managers of Charitable
Organizations: an Empirical Study of the Role of Accounting Measures of Program Activities. The
Accounting Review, 77(3), pp. 679-693.
Balsam, S. & Harris, E., 2012. The Impact of CEO Compensation on Nonprofit Donations. in
press.
Baron, R. M. & Kenny, D. A., 1986. The Moderator-Mediator Variable Distinction in Social
Psychological Research: Conceptual, Strategic, and Statistical Considerations. Journal of
Personality and social Psychology, 51(6), pp. 1173-1182.
Bekkers, R., 2003. Trust, Accreditation and Philantrophy in the Netherlands. nonprofit and
Voluntary Sector Quarterly, pp. Vol: 32 pp. 596 - 615.
Bekkers, R., 2006. Keeping the Faith: Origins of Confidence in Charitable Organizations and its
Consequences for Philanthropy. Department of Philanthropy, Vrije Universiteit Amsterdam, the
Netherlands, NCVO/VSSN Researching the Voluntary Sector Conference 2006.
Bekkers, R. & Bowman, W., 2009. The Relationship Between Confidence in Charitable
Organizations and Volunteering Revisited. Nonprofit and Voluntary Sector Quarterly, 38(884),
pp. 884-897.
Bekkers, R. & Wiepking, P., 2011. A Literature Review of Empirical Studies of Philanthropy :
Eight Mechanisms That Drive Charitable Giving. Nonprofit and Voluntary Sector Quarterly,
40(5), p. 924–973.

78
Bekkers, R. & Wiepking, P., 2011. Who Gives? A Literature Review of Predictors of Charitable
Giving I – Religion, Education, Age and Socialization. Voluntary Sector Review , 2(3), pp.
337-365.
Bennet, R. & Barkensjo, A., 2004. Causes and consequences of donor percceptions of the quality
of the relationship marketing activities of charitable organisations. Journal of Targeting,
measurement and analsis for Marketing, pp. Vol. 13,2, 122 - 139.
Blumberg, B., Cooper, D. R. & Schindler, P. S., 2011. Business Research Methods.
sl:McGraw-Hill.
Bos, S., 2012. Goede doelen weten zich geen raad met ophef over hoge salarissen. [Online]
Available at:
http://www.wereldburgers.tv/2012/11/14/goede-doelen-weten-zich-geen-raad-met-ophef-over-ho
ge-salarissen/ [Accessed 24 November 2012].
Cabral, L. M. B., 2005. The Economics of Trust and Reputation: A Primer. in press.
CBF, 2009. CBF Jaar rapport. [Online]
Available at: http://www.cbf.nl/OverhetCBF/jaarverslagen.php [Accessed 25 September 2012].
CBF, 2011. CBF jaar rapport. [Online]
Available at: http://www.cbf.nl/OverhetCBF/jaarverslagen.php [Accessed 25 September 2012].
Charity Navigator, 2009. 2009 CEO Compensation Study. [Online]
Available at:
http://www.charitynavigator.org/__asset__/_etc_/CN_CEO_Compensation_Study_2009_Final.p
df [Accessed 25 September 2012].

79
Charity Navigator, 2012. 2012 CEO Compensation Study. [Online]
Available at:
http://www.charitynavigator.org/__asset__/studies/2012_CEO_Compensation_Study.pdf
[Accessed 23 November 2012].
Chasteen, C. S. & Lampkin, L. M., 2012. Improved Transparency for Charity Executive Pay: A
Review of Form 990 Data. [Online]
Available at
http://www.erieri.com/PDF/CharityExecutivePay.pdf [Accessed 9 October 2012].
Cheung, C. K. & Chang, C. M., 2000. Social-cognitive factors of donating money to charity, with
special attention to an international relief organization. Evaluation and Program Planning, Issue
23, pp. 241-253.
Consumentenbond, 2005. Consumentengids, sl: Consumentenbond.
Defond, M. L., Hann, R. N. & Hu, X., 2005. Does the Market Value Financial Expertise on Audit
Committees of Boards of Directors?. Journal of Accounting Research, 43(2), pp. 153-193.
Drucker, P., 1990. Lessons for successful nonprofit governance. Nonprofit management and
Leadership, 1(1), pp. 7-14.
Epstein, M. J. & McFarlan, F. W., 2011. Measuring the Efficiency and Effectiveness of a
nonprofit's performance. Strategic Finance, pp. 27-34.
Evers, A. & Gesthuizen, M., 2011. The impact of generalized and institutional trust on donating to
activist, leisure, and interest organizations: individual and contextual effects. International
Journal of Nonprofit and Voluntary Sector Marketing, Volume 16, p. 381–392.
Fama, E. F. & Jensen, M. C., 1983. Agency Problems and Residual Claims. Journal of Law and
Economics, 26(2), pp. 327-349.
80
Forbes, 2011. 200 Largest US Charities. [Online]
Available at: http://www.forbes.com/lists/2011/14/200-largest-us-charities-11_rank.html
[Accessed 4 April 2012].
Froelich, K. A., 1999. Diversification of Revenue Strategies: Evolving Resource Dependence in
Nonprofit Organizations. Nonprofit and Voluntary Sector Quarterly,, 28(3), pp. 246-268.
Frumkin, P. & Kim, M. T., 2001. Strategic Positioning and the Financing of Nonprofit
Organizations: Is Efficiency Rewarded in the Contributions Marketplace?. Public Administration
Review, 61(3), pp. 266-275.
Gaskin, K., 1999. Blurred vision: Public trust in charities. International Journal of Nonprofit and
Voluntary Sector Marketing, 4(2), pp. 163-178.
Guidestar, 2012. IRS Form 990. [Online]
Available at: http://www.guidestar.org/rxg/help/faqs/form-990/index.aspx#faq1942
[Accessed 8 April 2012].
Handy, F., 1995. Reputation as Collateral: An Economic Analysis of the Role of Trustees of
Nonprofits. Nonprofit and Voluntary Sector Quarterly, 24(4), pp. 293-305.
Handy, F. & Katz, E., 1998. The Wage Differential between Nonprofit Institutions and
Corporations: Getting More by Paying Less?. Journal of comparative economics, Issue 26, p.
246–261.
Hansmann, H., 1980. The Role of Nonprofit Enterprise. The Yale Law Journal, 89(5), pp. 835-902.
Herzlinger, 1994. Effective Oversight: a guide for nonprofit directors. Harvard Business Review,
pp. Jul-Aug 52-60.
Het Nederlandse Donateurspanel, 2010. Onderzoeksrapportage Het Nederlandse
Donateurspanel, sl: sn

81
Hibbert, S. A. & Horne, S., 1997. Donation dilemmas: A consumer behaviour perspective. Journal
of Nonprofit and Voluntary Sector Marketing, 2(3), pp. 261-274.
Hinton, P. R., Brownlow, C., McMurray, I. & Cozens, B., 2004. SPSS Explained. East-Sussex:
Routledge.
Hou, J., Du, L. & Tian, Z., 2009. The effects of nonprofit brand equity on individual giving
intention: mediating by the self-concept of individual donor. International Journal of Nonprofit
and Voluntary Sector Marketing, Issue 14, pp. 215-229.
Hyde, M. K. & White, K. M., 2009. To Be a Donor or Not to Be? Applying an Extended Theory of
Planned Behavior to Predict Posthumous Organ Donation Intentions. Journal of Applied Social
Psychology, 39(4), pp. 880-900.
Josang, A., Ismail, R. & Boyd, C., 2007. A survey of trust and reputation systems for online
service provision. Decision Support Systems, Volume 43, pp. 618-644.
Kong, E. & Farrel, M., 2010. The role of image and reputation as intangible resources in nonprofit
organisations: a relationship management perspective. Hong Kong, China, ICICKM 2010: 7th
International Conference on Intellectual Capital, Knowledge Management and Organisational
Learning.
Kostiuk, P. F., 1990. Firm Size and Executive Compensation. The Journal of Human Resources,
25(1), pp. 90-105.
Lee, M. K. O. & Turban, E., 2001. A Trust Model for Consumer Internet Shopping. International
Journal of Electronic Commerce, 6(1), p. 75–91.
Linden, v. d. S., 2011. Charitable Intent: A Moral or Social Construct? A Revised Theory of
Planned Behavior Model. Current Psychology, Issue 30, pp. 355-374.

82
Lobb, A. E., Mazzocchi, M. & Traill, W. B., 2007. Modelling risk perception and trust in food
safety information within the theory of planned behaviour. Food Quality and Preference, Issue 18,
p. 384–395.
MacMillan, K., Money, K., Money, A. & Downing, S., 2005. Relationship marketing in the
not-for-profit sector: an extension and application of the commitment–trust theory. Journal of
Business Research, Volume 58, pp. 806-818.
Manzo, P., 2004. The Real Salary Scandal: It’s isn’t that some nonprofit CEOs make big bucks.
It’s that most nonprofit employees are paid too little. Stanford Social Innovation Review, pp.
65-67.
McIver, J. P. & Carmines, E. G., 1981. "LIKERT SCALING." Unidimensional Scaling. Thousand
Oaks, CA: SAGE Research Methods.
Meijs, L., 2012. Reinventing Strategic Philantropy: the sustainable organization of voluntary
action for impact. sl, Inaugural Lecture.
Merchant, A., Ford, J. B. & Sargeant, A., 2010. Charitable organizations' storytelling influence on
donors' emotions and intentions. Journal of Business Research, Issue 63, p. 754–762.
Mikkers, R., 2010. Salarissen SNV fors gestegen. [Online]
Available at:
http://www.telegraaf.nl/binnenland/6730775/__Salarissen_SNV_fors_gestegen__.html?
[Accessed 18 August 2012].
Millenial Donors, 2011. Millenial Donors Report 2011. [Online]
Available at: http://millennialdonors.com/wp-content/uploads/2011/05/MD11_Report1411.pdf
[Accessed 11 September 2012].

83
Miller-Millesen, J. L., 2003. Understanding the Behavior of Nonprofit Boards of Directors: A
Theory-Based Approach. Nonprofit and Voluntary Sector Quarterly, 32(4), pp. 521-546.
Nonprofit Research Abridged, 2003. Nonprofit Research Abridged, Center for Nonprofit
Leadership Management, Arizona State University. [Online]
Available at:
http://lodestar.asu.edu/research/past-research-initiatives/nonprofit-research-abridged/
[Accessed 1 September 2012].
O'Regan, K. & Oster, S. M., 2005. Does the Structure and Composition of the Board Matter? The
Case of Nonprofit Organizations. The Journal of Law, Economics, & Organization, 21(1), pp.
205-227.
Oster, S. M., 1995. Strategic Management for Nonprofit Organizations. New York: Oxford
University Press.
Oster, S. M., 1998. Executive compensation in the nonprofit sector. Nonprofit management and
leadership, 8(3), pp. 207-221.
Parsons, L. M., 2007. The Impact of Financial Information and Voluntary Disclosures on
Contributions to Not-For-Profit Organizations. Behavioural research in accounting, Volume 19,
pp. 179-196.
Poppo, L. & Schepker, D. J., 2010. Repairing Public Trust in Organizations. Corporate Reputation
Review, 13(2), p. 124–141.
Preston, A. E., 1989. The nonprofit worker in a for-profit world. Journal of labour economics,
7(4), pp. 438-463.
Provan, K. G., 1980. Board Power and Organizational Effectiveness among Human Service
Agencies. The Academy of Management Journal, 23(2), pp. 221-236.

84
Public Agenda, 2005. The Charitable Impulse. [Online]
Available at: http://www.publicagenda.org/files/pdf/charitable_impulse.pdf
[Accessed 15 October 2012].
Puyvelde van, S., R, C., Du Bois, C. & Jegers, M., 2012. The Governance of Nonprofit
Organizations : Integrating Agency Theory With Stakeholder and Stewardship Theories.
Nonprofit and Voluntary Sector Quarterly, 41(3), p. 431–451.
Ranganathan, S. K. & Henley, W. H., 2008. Determinants of charitable donation intentions: A
structural equation model. International Journal of Nonprofit and Voluntary Sector Marketing,
Volume 13, pp. 1-11.
Raosoft, 2012. Sample size calculator. [Online]
Available at: http://www.raosoft.com/samplesize.html [Accessed 2 October 2012].
Reeves, L., 2010. Rewards at Work - Inspiring Productive Employees Across Career Stages.
[Online] Available at: http://www.encore.org/files/Crossing%20Generations%20Benefits.pdf
[Accessed 20 October 2012].
Reinhardt, G. Y., 2009. Matching Donors and Nonprofits : The Importance of Signaling in
Funding Awards. Journal of Theoretical Politics, 21(3), p. 283–309.
Ridder, H., Piening, E. P. & Baluch, A. M., 2012. The Third Way Reconfigured: How and Why
Nonprofit Organizations are Shifting Their Human Resource Management. Voluntas:
International journal of voluntary and nonprofit organizations, 23(3), pp. 605-635.
Rose, B. M., Holmbeck, G. N., Coakley, R. M. & Franks, E. A., 2004. Mediator and Moderator
Effects in Developmental and Behavioral Pediatric Research. Developmental and Behavioral
Pediatrics, 25(1), pp. 58-76.

85
Samman, E., Mc Auliffe, E. & MaclLachlan, M., 2009. The role of celebrity in endorsing poverty
recution through international aid. International Journal of Nonprofit and Voluntary Sector
Marketing, Volume 14, pp. 137-148.
Sargeant, A., 2001. Relationship Fundraising - How to keep donors loyal. Nonprofit management
and leadership, 12(2), pp. 177-192.
Sargeant, A., Ford, J. B. & West, D. C., 2006. Perceptual determinants of nonprofit giving
behavior. Journal of Business Research, Volume 59, pp. 155-165.
Sargeant, A. & Lee, S., 2004. Trust and Relationship Commitment in the United Kingdom
Voluntary Sector: Determinants o. Psychology & Marketing, 21(8), pp. 613-635.
Sargeant, A. & Woodliffe, L., 2007. Building Donor Loyalty: The Antecedents and Role of
Commitment in the Context of Charity Giving. Journal of Nonprofit & Public Sector Marketing,
18(2), pp. 47-68.
Saunders, M. N. K., Lewis, P. & Thornhill, A., 2009. Research Methods for Business Students.
fifth edition red. sl:Pearson Education.
Sawhill, J. & Williamson, D., 2001. Measuring what matters in nonprofits. McKinsey Quarterly,
Issue 2, pp. 98-107.
Scheitle, C. P., 2009. Leadership Compensation in Christian Nonprofits. Sociology of Religion,
70(4), pp. 384-408.
Skolnik, R., 1993. Rebuilding Trust: Nonprofits to boost reputation. The Public Relations Journal,
49(9), p. 29.

86
Smith, J. R. & McSweeney, A., 2007. Charitable Giving: The Effectiveness of a Revised Theory
of Planned Behaviour Model in Predicting Donating Intentions and Behaviour. Journal of
Community & Applied Social Psychology, Issue 17, pp. 363-386.
Sociaal en Cultureel Planbureau, 2011. Stemming onbestemd, Den Haag: sn
Ting, H., 2009. Do Reputational Capital Boards Enhance Corporate Reputation. International
Research Journal of Finance and Economics, Issue 23, pp. 89-103.
Tinkelman, D. & Mankaney, K., 2007. When is Administrative Efficiency Associated With
Charitable Donations?. Nonprofit and Voluntary Sector Quarterly, 36(1), pp. 41-64.
Tonkiss, F. & Passey, A., 1999. Trust, Confidence and Voluntary Organisations: Between Values
and Institutions. Sociology, 33(2), pp. 257-274.
Torres-Moraga, E., Vasquez-Parraga, A. Z. & Barra, C., 2010. Antecedents of donor trust in an
emerging charity sector: the role of reputation, familiarity, opportunism and communication.
Transylvanian Review of Administrative Sciences, Issue 29, pp. 159-177.
Trouw, 2010. Salaris directeur rode kruis onder dwang naar beneden. [Online]
Available at:
http://www.trouw.nl/tr/nl/4324/Nieuws/article/detail/1105313/2010/07/05/Salaris-directeur-Rode
-Kruis-onder-dwang-naar-beneden.dhtml [Accessed 26 July 2012].
Uffelen, X. v., 2005. Hartstichting haalt 8 procent minder op. [Online]
Available at:
http://www.volkskrant.nl/vk/nl/2686/Binnenland/article/detail/661690/2005/08/16/Hartstichting-
haalt-8-procent-minder-op.dhtml [Accessed 24 October 2012].
Uslaner, E. M. & Brown, M., 2005. Inequality, Trust, and Civic Engagement. American Politics
Research, 33(6), pp. 868-894.

87
Wallis, J. & Dollery, B., 2005. Leadership and Economic Theories of Nonprofit Organizations.
Review of Policy Research, 22(4), pp. 483-499.
WereldburgersTV, 2010. Salarissen goede doelen onderzocht. [Online]
Available at: http://www.wereldburgers.tv/2010/03/16/salarissen-goede-doelen-onderzocht/
[Accessed 20 September 2012].
Wheeler, R. T., 2009. Nonprofit Advertising: Impact of Celebrity Connection, Involvement and
Gender on Source Credibility and Intention to Volunteer. Journal of Nonprofit & Public Sector
Marketing Time or Donate Money, Volume 21, pp. 80-107.
Wiepking, P. & Bekkers, R., 2012. Who Gives? A Literature Review of Predictors of Charitable
Giving II – Gender, Family Composition and Income. Voluntary Sector Review, 3(2), pp. 217-246.
Wiepking, P. & Maas, I., 2009. Resources That Make You Generous: Effects of Social and Human
Resources on Charitable Giving. Social Forces, 87(4), pp. 1973-1995.
Wyatt-Johnson, C. & Bennett, C. J., 2004. Calibratng Executive Compensation. Trustee, 57(3), pp.
12-20.
Zingheim, P. K., Schuster, J. R. & Thomsen, D. A., 2005. Executive Compensation: Rewarding
Excellence and Ensuring Governance. Nonprofit World, 23(5), pp. 14-17.

88
Appendix 1: Available scales for intention to donate and trust
Construct: Intention to donate
Scales found in available literature Source & Cronbach Alpha α
Likely to donate (to the nonprofit "X“)
Will donate (to the nonprofit "X“) next time
Will definitely donate (to the nonprofit "X“)
Will recommend others to donate (to the nonprofit "X“)
Ranganathan & Henley (2007)
Cronbach α: 0,89
Hou, Du, Tianm( 2009)
Cronbach α: 0,89
I am likely to donate to the charity in question in the future
I will donate the next time
I will definitely donate to the charity in question in the future
Merchant, Ford & Sargeant
(2010)
Cronbach α: 0,88
I will donate money to charities in the next 4 weeks
I would like to donate money to charities in the next 4 weeks
I do not intend to donate money to charities in the next 4 weeks
I intend to donate money to charities in the next 4 weeks
How likely do you think it is that you will donate money to
charities in the next 4 weeks
Smith & McSweeney (2007)
Cronbach α: 0,85
Construct: Trust
Scales found in available literature Source & Cronbach
Alpha α
I completely rely on the integrity of this charity organization.
• This organization would never seek advantages by deceiving its donors.
• This organization is trustworthy
Torres-Moraga,
Vásquez-Parraga &
Barra (2010)
Cronbach α: 0,84
• I trust X to always act in the best interests of the cause
• I trust X to conduct its operations ethically
• I trust X to use donated funds appropriately
Sargeant &
Woodliffe (2007)
Cronbach α: 0,89
• I would trust this nonprofit to always act in the best interest of the cause
• I would trust this nonprofit to conduct their operations ethically
• I would trust this nonprofit to use donated funds appropriately
• I would trust this nonprofit not to exploit their donors
• I would trust this nonprofit to use appropriate fundraising techniques
Sargeant, Ford,
West (2006)
Cronbach α: 0,942

89
Appendix 2: Variables in SPSS

90
Appendix 3: Questionnaire
Introduction
Beste deelnemer,
Bedankt dat u de tijd neemt om deze vragenlijst in te vullen! Deze vragenlijst is een belangrijk
onderdeel van mijn afstudeeronderzoek aan de Rotterdam School of Management (Erasmus
Universiteit). Uw hulp zal mij heel erg helpen om mijn master scriptie met een goed resultaat af te
sluiten.
De vragenlijst zal niet meer dan enkele minuten van uw tijd in beslag nemen. Leest u alstublieft
alle informatie zorgvuldig door, en neem de informatie mee in het beantwoorden van de vragen. Er
zijn geen foute antwoorden – het gaat echt om uw mening.
Ik ben benieuwd naar wat het Nederlands publiek vindt van directie salarissen in
liefdadigheidsinstellingen en hoe deze organisaties deze kwestie aan moet en pakken. In deze
vragenlijst zal gebruik worden gemaakt van een fictieve (niet bestaande) organisatie. Het invullen
van deze vragenlijst is geheel anoniem.
Schroomt u ook niet om deze vragenlijst door vrienden of familieleden in te laten vullen. Hoe meer
deelnemers, des te hoger is de kans dat de uitkomst en van dit onderzoek representatief zijn voor de
Nederlandse bevolking.
Als u vragen heeft of geïnteresseerd bent in de uit komst van mijn onderzoek, neem dan gerust
contact met mij op door te bellen naar (+31) 0648265191 of door een email te sturen naar
Met vriendelijke groet,
Sabrina Bos
Student CEMS Master in International Management
Rotterdam School of Management
Erasmus Universiteit Rotterdam

91
Dear participant,
Thank you for taking the time to complete this questionnaire! This questionnaire is an important
part of my research in order to graduate from the Rotterdam School of Management (Erasmus
University). Your help will support me to complete my master thesis with a good result.
Filling out the questionnaire will not take more than several minutes of your time. Please read all
information carefully, and use the information to answer the questions. There are no wrong
answers – it’s all about your opinion.
I am investigating what the Dutch public thinks of executive salaries in nonprofit / charity
organizations and how organizations should manage this issue. The organization used in this
questionnaire is fictional. Completing this questionnaire is completely anonymous.
Don’t hesitate to ask friends and family to complete this questionnaire as well. The more
participants, the higher the chance that the results of this research are a good reflection of the
opinion of the Dutch population.
If you have any questions or are interested in the outcomes of my research, don’t hesitate to
contact me by phone +31648265191 or via email [email protected].
Kind regards,
Sabrina Bos
Student CEMS Master in International Management
Rotterdam School of Management
Erasmus Universiteit Rotterdam

92
Background
Stel je voor, je bent iemand die regelmatig aan het goede doel geeft. Elk jaar zet je een bepaald
bedrag opzij om te doneren. Dit jaar heb je over de volgende organisatie gelezen en je denkt erover
om aan deze organisatie te doneren.
Food for Schools is een grote, internationale liefdadigheidsinstelling. De missie van de organisatie
is om zoveel mogelijk schoolkinderen een dagelijkse maaltijd te geven. Het hoofdkwartier is in
Nederland, maar Food for Schools heeft vestigingen in vele westerse landen en voert zijn missie
uit in Afrika, Zuid-Amerika en Azië. Food for Schools is vooral afhankelijk van donaties van
particulieren voor het uitvoeren van de missie. De organisatie bestaat uit ongeveer 25.000
(Nederlandse en buitenlandse) vrijwilligers, en ongeveer 300 betaalde medewerkers.
Imagine, you are somebody who regularly gives to charity. Every year you put aside a certain
amount to donate. This year you have read about the following organization, and you are
considering giving to this organization.
Food for Schools is a large, international charity organization. The mission of this organization is
to provide as many school kids with a daily meal as possible. The headquarters of the organization
are located in the Netherlands, but Food for Schools has offices in many western countries, and
operates mainly in Africa, South-America and Asia. Food for Schools is depending on private
donations for a large part of their income. The organization consists of 25.000 (Dutch and
foreign) volunteers, and approximately 300 paid employees.

93
1: Vindt je dat over het algemeen deze organisatie wel te vertrouwen is of vindt je dat men
niet voorzichtig genoeg kan zijn in de omgang met deze organisatie?
Wel te vertrouwen —> verder met vragen
Je kan niet voorzichtig genoeg zijn —> einde vragenlijst
In general, would you say that this organization can be trusted, or that you can’t be too careful in
dealing with this organization?
This organization can be trusted continue questionnaire
Can t be too careful in dealing with this organization end of questionnaire
End of questionnaire:
Helaas hoort u niet bij de doelgroep van dit onderzoek, dus u hoeft verder geen vragen meer te
beantwoorden. Bedankt voor uw medewerking!
Unfortunately you do not belong to the target Group of this research, so you do not have to answer
any more questions. Thank you for your cooperation!
High / Low salary scenario
Questionnaire 1,2,3: High salary
De directeur van Food for Schools heeft een fulltime baan en werkt 38 uur per week. Hij bestuurt
een organisatie van ongeveer 25.000 vrijwilligers, en ongeveer 300 betaalde medewerkers. Het
bruto salaris van de directeur is €200.000 per jaar. Dit is hoger dan gemiddeld voor organisaties
met vergelijkbare missies en aantal werknemers.
The director of Food for Schools has a fulltime job and works 38 hours a week. He manages an
organization of about 25.000 volunteers and about 300 paid employees. The gross salary of the
director is €200.000 per year. This is higher than average for organizations with a comparable
mission and amount of employees.
Questionnaire 4: Low salary
De directeur van Food for Schools heeft een fulltime baan en werkt 38 uur per week. Hij bestuurt
een organisatie van ongeveer 25.000 vrijwilligers, en ongeveer 300 betaalde medewerkers. Het
bruto salaris van de directeur is €33.000 per jaar. Dit is lager dan gemiddeld voor organisaties met
vergelijkbare missies en aantal werknemers.

94
The director of Food for Schools has a fulltime job and works 38 hours a week. He manages an
organization of about 25.000 volunteers and about 300 paid employees. The gross salary of the
director is €33.000 per year. This is lower than average for organizations with a comparable
mission and amount of employees.
2: Gebaseerd op bovenstaande informatie over Food for Schools en het salaris van hun
directeur, beantwoord alstublieft de volgende vragen:
Based on the information stated above about Food for Schools and the salary of their director,
please answer the following questions:
1. Ik vertrouw er nog steeds op dat Food for Schools altijd in het belang van de missie handelt.
I would still trust Food for Schools to always act in the best interest of the cause.
2. Het is nog steeds waarschijnlijk dat ik aan Food for Schools zou doneren.
I am still likely to donate to Food for Schools.
3. Ik vertrouw er nog steeds op dat Food for Schools zijn operaties ethisch uitvoert
I would still trust Food for Schools to conduct their operations ethically
4. Ik zou nog steeds zeker aan Food for Schools doneren.
I would still definitely donate to Food for Schools.
5. Ik vertrouw er nog steeds op dat deze Food for Schools mijn donatie goed gebruikt
I would still trust Food for Schools to use donated funds appropriately
6. Ik zou Food for Schools nog steeds aan anderen aanbevelen.
I would still recommend others to donate to Food for Schools.
7. Ik vertrouw er nog steeds op dat Food for Schools geen zou misbruik maken van zijn donateurs.
I would still trust Food for Schools to not seek advantages by deceiving its donors.
8. Ik ben nog steeds van plan om een donatie te doen aan Food for Schools.
I still intend to donate to Food for Schools.
9 Ik vertrouw nog steeds op de integriteit van Food for Schools.
I still completely rely on the integrity of Food for Schools.
10. Ik zou nog steeds graag aan Food for Schools doneren.
I would still like to donate to Food for Schools.

95
Scenarios all these scenarios are followed by the 10 statements of question 2
Questionnaire 1: High Performance
Een paar dagen later lees je een artikel over de prestaties van goede doelen. Lees de volgende
informatie en gebruik deze voor het beantwoorden van de volgende vragen. Food for Schools is
een organisatie die zichzelf ambitieuze doelen stelt. Deze doelen zijn in de afgelopen 5 jaar vrijwel
allemaal behaald en de organisatie is flink gegroeid wat betreft het aantal kinderen dat zij dagelijks
een maaltijd kan bieden. Food for Schools heeft zich het afgelopen jaar ten doel gesteld om 5%
meer maaltijden uit te delen dan het jaar daarvoor. Uiteindelijk is een groei van 7,5% gerealiseerd.
Deze groei is opvallend goed in vergelijking met andere liefdadigheidsinstellingen: de meeste
realiseren een groei van 2% per jaar. De prestaties die Food for Schools heeft bereikt, zijn
aantoonbaar het gevolg van het beleid dat de directeur van Food for Schools de afgelopen jaren
heeft doorgevoerd.
Several days later you read an article about the performance of good causes. Read the following
information and use it to answer the upcoming questions. Food for Schools is an organization that
sets itself ambitious goals. These goals have basically all been attained over the last 5 years and
the organization has grown significantly if it comes to the amount of children they can provide a
meal with every day. Food for Schools had set last year’s goal to distribute 5% more meals that the
year before. Eventually, they realized a growth of 7,5%. This growth is outstanding compared to
other charities: most of them only realize a growth of 2% per year. The performance of Food for
Schools can be contributed for a large part to the new policies that the director of Food for
Schools has put in place over the last years.
Questionnaire 1: High administrative ratio
In hetzelfde artikel lees je de volgende informatie over de administratieve ratio van Food for
Schools. Food for Schools is een organisatie die probeert zijn administratieve kosten zo laag
mogelijk te houden. Er moet natuurlijk wel geld worden uitgegeven aan zaken als computers,
websites, trainingen, salarissen en huisvesting. In de afgelopen 3 jaar is Food for Schools
uitgekomen op een administratieve ratio van 45%. Dat wil zeggen dat van elke euro die wordt
gedoneerd, er € 0,45 wordt besteedt aan administratieve kosten. De overige 55% gaat naar de
activiteiten die de organisatie uitvoert ten behoeve van de missie. Dit is niet zo’n sterk resultaat.
Veel andere liefdadigheidsinstellingen hebben een administratieve ratio tussen de 15% en 30%.

96
In the same article you read the following information about the administrative ratio of Food for
Schools. Food for Schools is an organization who tries to keep its administrative costs as low as
possible. Of course they have to spend money on computers, websites, training, salaries and real
estate. Over the last 3 years, Food for Schools achieved an administrative ratio of 45%. That
means that of every euro donated, 45 cents is being spent on administrative costs. The other 55%
goes to the activities the organization executes to fulfil their mission. This is not such a good result.
Most other charities have an administrative ratio between 15% and 30%.
Questionnaire 2: Low Administrative Ratio
Een paar dagen later lees je een artikel over de administratieve ratio van goede doelen. Lees de
volgende informatie en gebruik deze voor het beantwoorden van de volgende vragen. Food for
Schools is een organisatie die probeert zijn administratieve kosten zo laag mogelijk te houden. Er
wordt wel geld uitgegeven aan zaken als computers, websites, trainingen, salarissen en
huisvestingskosten, maar deze zijn beperkt. In de afgelopen 3 jaar is Food for Schools uitgekomen
op een administratieve ratio van 10%. Dat wil zeggen, van elke euro die er gedoneerd wordt, gaat
er €0,10 naar administratieve kosten. De overige 90% gaat naar de activiteiten die de organisatie
uitvoert ten behoeve van de missie. Dit is een goed resultaat. Veel andere
liefdadigheidsinstellingen hebben een administratieve ratio tussen de 15% en 30%.
Several days later you read an article about the administrative ratio of good causes. Read the
following information and use it to answer the upcoming questions. Food for Schools is an
organization that tries to keep its administrative ratio to a minimum. Money is being spent on
computers, websites, training, salaries and real estate costs, but this amount is very limited. Over
the last 3 years, Food for Schools has achieved an administrative ratio of 10%. This means that of
every euro donated, 10 cents goes to administrative costs. The other 90% goes to the activities the
organization executes to fulfil their mission. This is a very good result. Most other charities have
an administrative ratio between 15% and 30%.
Questionnaire 2: Low reputation
In het zelfde artikel lees je de volgende informatie over het best uur van Food for Schools. Food for
Schools heeft een bestuur dat een paar keer per jaar bij elkaar komt om het algemeen beleid van de
organisatie te bespreken. Zij zijn onder meer verantwoordelijk voor een professionele en ethisch
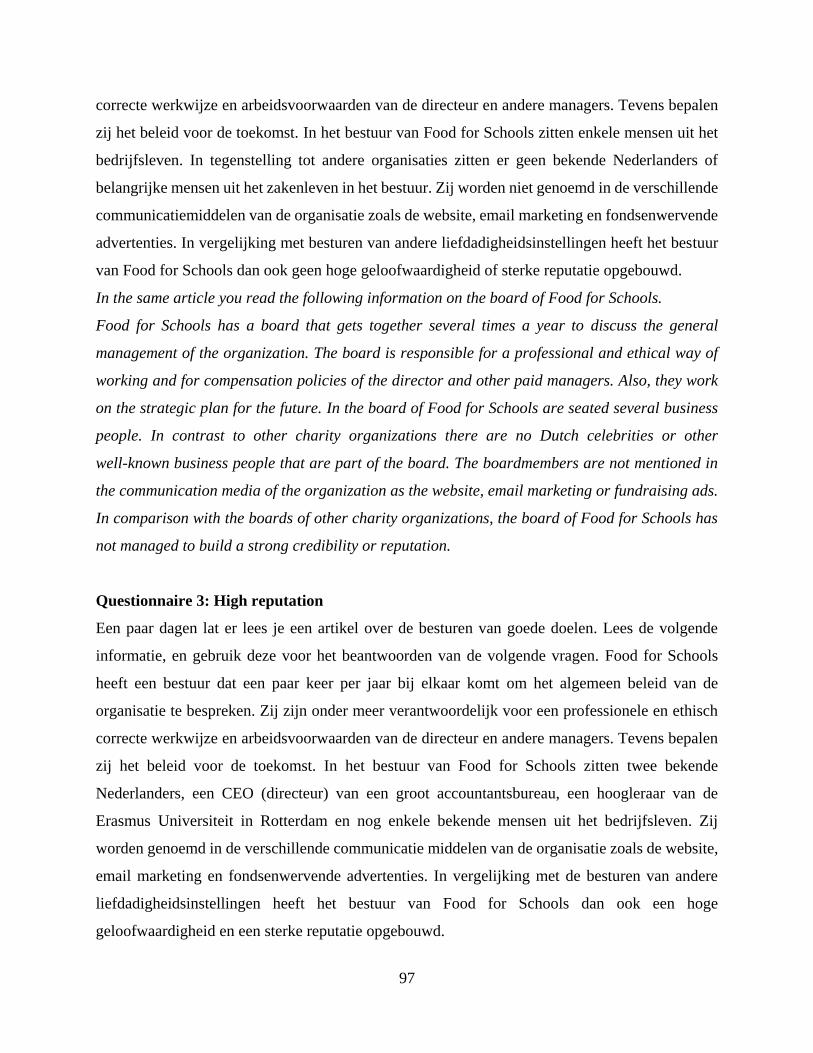
97
correcte werkwijze en arbeidsvoorwaarden van de directeur en andere managers. Tevens bepalen
zij het beleid voor de toekomst. In het bestuur van Food for Schools zitten enkele mensen uit het
bedrijfsleven. In tegenstelling tot andere organisaties zitten er geen bekende Nederlanders of
belangrijke mensen uit het zakenleven in het bestuur. Zij worden niet genoemd in de verschillende
communicatiemiddelen van de organisatie zoals de website, email marketing en fondsenwervende
advertenties. In vergelijking met besturen van andere liefdadigheidsinstellingen heeft het bestuur
van Food for Schools dan ook geen hoge geloofwaardigheid of sterke reputatie opgebouwd.
In the same article you read the following information on the board of Food for Schools.
Food for Schools has a board that gets together several times a year to discuss the general
management of the organization. The board is responsible for a professional and ethical way of
working and for compensation policies of the director and other paid managers. Also, they work
on the strategic plan for the future. In the board of Food for Schools are seated several business
people. In contrast to other charity organizations there are no Dutch celebrities or other
well-known business people that are part of the board. The boardmembers are not mentioned in
the communication media of the organization as the website, email marketing or fundraising ads.
In comparison with the boards of other charity organizations, the board of Food for Schools has
not managed to build a strong credibility or reputation.
Questionnaire 3: High reputation
Een paar dagen lat er lees je een artikel over de besturen van goede doelen. Lees de volgende
informatie, en gebruik deze voor het beantwoorden van de volgende vragen. Food for Schools
heeft een bestuur dat een paar keer per jaar bij elkaar komt om het algemeen beleid van de
organisatie te bespreken. Zij zijn onder meer verantwoordelijk voor een professionele en ethisch
correcte werkwijze en arbeidsvoorwaarden van de directeur en andere managers. Tevens bepalen
zij het beleid voor de toekomst. In het bestuur van Food for Schools zitten twee bekende
Nederlanders, een CEO (directeur) van een groot accountantsbureau, een hoogleraar van de
Erasmus Universiteit in Rotterdam en nog enkele bekende mensen uit het bedrijfsleven. Zij
worden genoemd in de verschillende communicatie middelen van de organisatie zoals de website,
email marketing en fondsenwervende advertenties. In vergelijking met de besturen van andere
liefdadigheidsinstellingen heeft het bestuur van Food for Schools dan ook een hoge
geloofwaardigheid en een sterke reputatie opgebouwd.

98
Several days later you read an article about the boards of good causes. Read the following
information and use it to answer the upcoming questions. Food for Schools has a board that gets
together several times a year to discuss the general management of the organization. The board is
responsible for a professional and ethical way of working and for compensation policies of the
director and other paid managers. Also, they work on the strategic plan for the future. In the board
of Food for Schools are seated two Dutch celebrities, the CEO of a large accounting bureau, a
professor of the Erasmus University in Rotterdam and several other high-profile business people.
All these people are mentioned in the communication and publications of the organization like the
website, email marketing and fundraising ads. Therefore, in comparison with other charities, the
board of Food for Schools has managed to build a strong credibility and reputation.
Questionnaire 3: Low performance
In het zelfde artikel lees je de volgende informatie over de prestaties van Food for Schools:
Food for Schools is een organisatie die zichzelf ambitieuze doelen stelt. Deze doelen zijn in de
afgelopen 5 jaar helaas niet allemaal behaald en de organisatie is dan ook vrijwel niet gegroeid wat
betreft het aantal kinderen dat zij dagelijks een maaltijd kan bieden. Food for Schools heeft zich
het afgelopen jaar ten doel gesteld om 5% meer maaltijden uit te delen dan het jaar daarvoor.
Uiteindelijk is een groei van 1,5% gerealiseerd. Deze groei is niet heel sterk in vergelijking met
andere liefdadigheidsinstellingen: de meeste realiseren een groei van 2% per jaar. Food for
Schools heeft tegenvallende prestaties laten zien ondanks het beleid dat de directeur van Food for
Schools de afgelopen jaren heeft doorgevoerd.
In the same article you read the following information about the performance of Food for Schools.
Food for Schools is an organization that sets itself ambitious goals. These goals have not all been
attained over the last 5 years and the organization has not grown if it comes to the amount of
children they can provide a meal with every day. Food for Schools had set last year’s goal to
distribute 5% more meals that the year before. Eventually, they realized a growth of 1,5%.
This growth is not very strong compared to other charities: most of them realize a growth of 2%
per year. Despite the new policies that the director of Food for Schools has put in place over the
last years, Food for Schools has shown disappointing results.

99
Vraag 5. Beantwoord alstublieft de volgende vragen. Dit zijn algemene vragen over uw
mening over salarissen in liefdadigheidsinstellingen.
1. Ik denk dat de informatie over het salaris van een directeur in een liefdadigheidsinstelling
belangrijk is in mijn beslissing om te doneren.
I think information about a director’s salary in a charity organization is important in my
decision to donate to an organization.
2. Ik zou actief op zoek gaan naar informatie over het salaris van een directeur in een
liefdadigheidsinstelling als ik zou willen doneren.
I would actively look for information regarding a director’s salary of a charity
organization if I wanted to donate.
3. Ik denk dat directeuren in liefdadigheidsinstellingen minder moeten verdienen dan directeuren
in het bedrijfsleven.
I think that directors in charity organizations should earn less than directors in for-profit
organizations.
4. Ik denk dat liefdadigheidsinstellingen hun directeuren veel moeten betalen, omdat dit goed
leiderschap zal garanderen.
I think that charity organizations should pay their directors a lot, because this will
guarantee proper leadership.
5. Ik denk dat directeuren in een liefdadigheidsinstelling een lager salaris moeten accepteren dan
dat ze in het bedrijfsleven zouden kunnen verdienen, omdat ze er zelf
voor kiezen om in een liefdadigheidsinstelling te werken
I think that directors in a charity organization should accept a lower salary then they could
earn in a for-profit organization, because they choose to work for charity.
6. Wat is uw geslacht?
○ Man
○ Vrouw
What is your gender
o Male
o Female

100
7. Wat is uw leeftijd?
○ 18-25
○ 25-44
○ 45-65
○ 65+
What is your age?
○ 18-25
○ 25-44
○ 45-65
○ 65+
8. Wat is uw hoogst behaalde opleiding,
of welke opleiding bent u aan het
afronden?
○ Basisonderwijs
○ Middelbare School
○ MBO
○ HBO
○ Universitaire opleiding (Bachelor,
Master, PhD)
What is your highest attained education, or
which education are you completing at the
moment?
o Primary school
o High School
o Practical Education
o University of Applied Sciences
o University (Bachelor, Master, Phd)
9. Wat is de hoogte van uw jaarlijks
inkomen?
○ Minder dan €15.000
○ Tussen de €15.000 en €29.999
○ Tussen de €30.000 en €44.900
○ Tussen €45.000 en €59.999
○ Tussen de €60.000 en €120.000
○ Meer dan €120.000
What is your yearly income?
○ Less than €15.000
○ Between €15.000 and €29.999
○ Between €30.000 and €44.900
○ Between €45.000 and €59.999
○ Between €60.000 and €120.000
○ More than €120.000
Bedankt voor het afmaken van deze vragenlijst. Als u nog vragen heeft of geïnteresseerd bent in de
uitkomst van mijn onderzoek, neem dan gerust contact met mij op door te bellen naar (+31)
0648265191 of door een email te sturen naar [email protected]
Thank you for completing this questionnaire. If you have any questions or are interested in the
outcome of my research, don’t hesitate to contact me by calling +31648265191 or by email at

101
Appendix 4: Blogpost
Goede doelen weten zich geen raad met ophef over hoge salarissen
14 november 2012, Sabrina Bos
Hoge directie salarissen in goede doelen en not-for-profit organisaties; ook ik heb er een mening
over. En tot voor kort was dat een vrij sterke mening: 6-cijferige salarissen kunnen echt niet in
organisaties die van subsidies en individuele donaties afhankelijk zijn. Na een uitgebreid
onderzoek in de literatuur over management compensatie in not-for-profit organisaties denk ik
daar wat milder over.
Ik heb me geprobeerd te verplaatsten in het management team van een goededoelenorganisatie.
Het lijkt erop dat maatschappelijke organisaties vooral het spoor bijster zijn als het gaat om wat te
doen met de negatieve publiciteit rondom hoge directiesalarissen.
Koude kermis
Er zijn de afgelopen jaren enkele grote goede doelen organisaties van een koude kermis
thuisgekomen nadat het salaris van hun directeur negatief in de media werd gebracht. Het
vertrouwen in deze organisaties is beschadigd en bij een van hen werd zelfs een vermindering in
donaties van 8% waargenomen. Dit is een ernstige kwestie, want in een tijd van een steeds heftiger
wordende concurrentie op de goededoelenmarkt kan geen organisatie zich veroorloven het
vertrouwen van zijn donateurs te verliezen.
Dromen
Er moet wel gezegd worden dat achter de schermen de laatste jaren hard gewerkt is om een beter
systeem in elkaar te zetten dat salarissen van directeuren kan verantwoorden. Maar wat weet de
gemiddelde Nederlander hiervan en wat kan het ons schelen? Veel van de directiesalarissen in de
goededoelensector liggen nog steeds boven de 100.000 euro per jaar – een loonzakje waar de
meeste Nederlanders alleen maar van kunnen dromen!
Het is dus duidelijk dat het Nederlandse publiek en de goede doelen een andere perceptie hebben
met betrekking tot directiesalarissen. Blijkbaar is het nodig om riante salarissen te betalen, maar
het Nederlands publiek begrijpt niet waarom. Er wordt dan ook weinig aandacht besteed om aan

102
(potentiële) donateurs uit te leggen waarom een directeur nou precies een hoog salaris hoort te
verdienen. Oke, er zijn maar weinig organisaties die het salaris van hun directeur niet expliciet op
hun website vermelden en er dan ook duidelijk bijzetten dat het gaat om een grote organisatie en
dat het salaris aan de bestaande normen voldoet. Maar is de kwestie hiermee afgedaan?
Vertrouwen
De grote vraag die rijst, is onder welke omstandigheden een organisatie zich het wel kan
veroorloven om een hoog salaris aan zijn directeur te betalen, zonder dat dit ten koste gaat van het
vertrouwen van de achterban en de inkomsten aan donaties.
Deze vraag zou beantwoord kunnen worden door eens na te denken over de volgende zaken.
Bijvoorbeeld, gaat het Nederlands publiek wel op zoek naar informatie over salarissen over het
goede doel waaraan we wellicht willen geven? Of gaan we alleen op de media of geruchten af?
Welke mensen maken zich nu precies druk over hoge directie salarissen en waarom is dit nou toch
precies? Stopt het Nederlands publiek nu echt met doneren aan goede doelen omdat ze hun
directeur een hoog salaris betalen, of maken we veel stampij maar blijven we toch doneren aan
sommige goede doelen?
Managers
Wat nou als de organisatie het heel goed doet en elk jaar groeit wat betreft zijn sociale impact. Of
wat als het salaris wel hoog ligt, maar alsnog de administratieve kosten (waar salarissen onderdeel
van zijn) van de organisatie erg laag liggen? Misschien is een salaris juist wel een indicatie van een
sterke organisatie en goed leiderschap? Goede doelen worden tegenwoordig toch al uitgedaagd om
te functioneren als efficiënte ondernemingen, mogen directeuren dan ook niet betaald worden als
volwaardige managers? Of is het toch dat als managers ervoor kiezen voor een goede doelen
organisatie te werken, dat ze een lager salaris moeten accepteren?
Communiceren
Dit lijstje met vragen is ver van volledig, maar maakt al heel erg duidelijk dat er nog te weinig
onderzoek gedaan naar is naar deze kwestie. We bevinden ons in 2012; dit is niet meer het moment
voor de beschuldigende vinger naar de dames en heren die deze goede doelen op een dagelijkse

103
basis leiden. Deze tijd is geweest en iedereen is zich ervan bewust dat deze kwestie speelt. Het
belangrijkste op dit moment is dat de goede doelen en andere not-for-profit organisaties leren hoe
en waarover te communiceren met hun donateurs en andere belanghebbenden, zodat wij beter
begrijpen waarom bepaalde keuzes worden gemaakt. Pas dan zullen wij kunnen zien welke
organisaties echt onredelijke salarissen betalen.
Simpel salarissen verlagen is niet de oplossing. Want, wat wij niet moeten willen is dat alle
managers (die nu nog goede tot riante salarissen ontvangen) straks hard weg rennen naar het
bedrijfsleven omdat ze daar wel betaald worden naar hun kunnen. Of dat minder competente
managers die wel een lager salaris willen accepteren straks aan het hoofd komen van grote
organisaties met een belangrijke sociale doelstelling. Wat wij ook niet moeten willen is allemaal
stoppen met doneren. Hier hebben we toch vooral de begunstigden van de organisaties meeIn een
onderzoek van 1Vandaag blijkt dat 96% van de mensen het een slecht idee vindt om te stoppen met
het doneren van bloed uit protest tegen de salarissen van de bestuurders van de bloedbank, omdat
dan de patiënten de dupe worden.
Enquete
Moge het duidelijk zijn dat er nog meer vragen dan antwoorden zijn wat betreft dit onderwerp. Of
een scriptie van een master student dit vraagstuk op gaat lossen? Zeker niet – maar het is wel een
eerste stap en een aanmoediging voor andere onderzoekers om dit onderwerp op te pakken. De
vele reacties op dit onderzoek zijn een duidelijk teken dat het voor vele mensen een belangrijk en
relevant onderwerp is, en dat de acties van een organisatie van grote invloed kunnen zijn op het
gedrag van een (toekomsige) donateur.
Ik ga nog steeds uit het van het goede in de goede doelen en vind het dan ook belangrijk dat deze
organisaties worden ondersteund door onderzoek naar donateursgedrag. Ik wil u dan ook vragen
dit onderzoek te steunen en goede doelen te helpen om meer te begrijpen van de reacties van
donateurs rondom hoge directie salarissen. Het onderzoek bestaat maar uit enkele vragen, zal niet
meer dan een paar minuutjes in beslag nemen en natuurlijk worden de antwoorden anoniem
behandeld.

104
Appendix 5: statistical output
5.1 Background
5.1.1 Scale reliability analysis: Trust
Case Processing Summary
N %
Cases
Valid 148 100,0
Excludeda 0 ,0
Total 148 100,0
a. Listwise deletion based on all
variables in the procedure.
Reliability Statistics
Cronbach's
Alpha
N of Items
,944 5
Item-Total Statistics
Scale Mean if
Item Deleted
Scale
Variance if
Item Deleted
Corrected
Item-Total
Correlation
Cronbach's
Alpha if Item
Deleted
trust1 17,84 28,731 ,841 ,932
trust2 17,51 32,115 ,768 ,944
trust3 17,92 28,769 ,868 ,927
trust4 17,92 29,517 ,862 ,928
trust5 17,80 28,812 ,903 ,920

105
5.1.2 Scale reliability analysis: Intention to donate
Case Processing Summary
N %
Cases
Valid 148 100,0
Excludeda 0 ,0
Total 148 100,0
a. Listwise deletion based on all
variables in the procedure.
Reliability Statistics
Cronbach's
Alpha
N of Items
,965 5
Item-Total Statistics
Scale Mean if
Item Deleted
Scale
Variance if
Item Deleted
Corrected
Item-Total
Correlation
Cronbach's
Alpha if Item
Deleted
intention1 15,26 39,145 ,905 ,956
intention2 15,42 38,939 ,877 ,960
intention3 15,56 40,615 ,852 ,964
intention4 15,41 37,455 ,950 ,948
intention5 15,32 37,908 ,917 ,954

106
5.1.3 Frequencies and assumptions control variables
Statistics
Gender Age Education Income level
N Valid 145 147 147 147
Missing 3 1 1 1
Summary Table
Variable Count Percentage
Gender
Male 81 54,7%
Female 64 43,2%
Missing 3 2,0%
Total 148 100,0%
Age
18-24 46 31,1%
25-44 61 41,2%
45-64 35 23,6%
65+ 5 2,4%
Missing 1 0,7%
Total 148 100,0%
Education
High School 6 4,1%
Practical Education / MBO 10 6,8%
Uni of applied sciences / HBO 38 25,7%
University (BSc, MSc, PhD 93 62,8%
Missing 1 0,7%
Total 148 100,0%
Income
<15.000 45 30,4%
15.000-30.000 33 22,3%
30.000-45.000 27 18,2%
45.000-60.000 15 10,1%
60.000-120.000 22 14,9%
120.000 > 5 3,4%
Missing 1 0,7%
Total 148 100,0%

107
Gender
Frequency Percent Valid Percent Cumulative
Percent
Valid
male 81 54,7 55,9 55,9
female 64 43,2 44,1 100,0
Total 145 98,0 100,0
Missing
0 2 1,4
System 1 ,7
Total 3 2,0
Total 148 100,0
Age
Frequency Percent Valid Percent Cumulative
Percent
Valid
18-25 46 31,1 31,3 31,3
25-44 61 41,2 41,5 72,8
45-65 35 23,6 23,8 96,6
65 5 3,4 3,4 100,0
Total 147 99,3 100,0
Missing System 1 ,7
Total 148 100,0
Education
Frequency Percent Valid Percent Cumulative Percent
Valid
high school 6 4,1 4,1 4,1
practical education/
mbo 10 6,8 6,8 10,9
university of applied
sciences / hbo 38 25,7 25,9 36,7
university (bachelor,
master, PhD) 93 62,8 63,3 100,0
Total 147 99,3 100,0
Missing System 1 ,7
Total 148 100,0

108
Income level
Frequency Percent Valid Percent Cumulative
Percent
Valid
<15 45 30,4 30,6 30,6
15-30 33 22,3 22,4 53,1
30-45 27 18,2 18,4 71,4
45-60 15 10,1 10,2 81,6
60-120 22 14,9 15,0 96,6
120> 5 3,4 3,4 100,0
Total 147 99,3 100,0
Missing System 1 ,7
Total 148 100,0
Age * Education Crosstabulation
Count
Education Total
high school practical
education /
mbo
university of
applied
sciences / hbo
university
(bachelor,
master, PhD)
Age
18-25 2 1 6 37 46
25-44 0 3 16 42 61
45-65 4 5 13 13 35
65 0 1 3 1 5
Total 6 10 38 93 147
Age * Income level Crosstabulation
Count
Income level Total
<15 15-30 30-45 45-60 60-120 120>
Age
18-25 32 11 3 0 0 0 46
25-44 12 14 21 8 6 0 61
45-65 1 6 3 6 15 4 35
65 0 2 0 1 1 1 5
Total 45 33 27 15 22 5 147

109
Statistics
Gender Age Education Income level
N Valid 145 147 147 147
Missing 3 1 1 1
Mean 1,44 1,99 4,48 2,67
Std. Deviation ,498 ,832 ,797 1,536
Skewness ,239 ,375 -1,590 ,542
Std. Error of Skewness ,201 ,200 ,200 ,200
Kurtosis -1,970 -,649 1,984 -,923
Std. Error of Kurtosis ,400 ,397 ,397 ,397
Minimum 1 1 2 1
Maximum 2 4 5 6

110
5.1.4. Assumptions
Statistics
Trust Intention
N Valid 148 148
Missing 0 0
Mean 4,45 4,05
Std. Deviation 1,350 1,401
Skewness -,070 -,008
Std. Error of Skewness ,199 ,199
Kurtosis -,865 -,867
Std. Error of Kurtosis ,396 ,396
Minimum 1 1
Maximum 7 7

111
5.1.5 Correlations: Pearson Correlation and Spearman’s Rho
Pearson Correlation
Salary Trust Intention Gender Age Education Income
level
Salary
Pearson r 1
Sig. (2-tail)
N 148
Trust
Pearson r -,461**
1
Sig. (2-tail) ,000
N 148 148
Intention
Pearson r -,541**
,918**
1
Sig. (2-tail) ,000 ,000
N 148 148 148
Gender
Pearson r -,181* -,034 -,020 1
Sig. (2-tail) ,029 ,681 ,813
N 145 145 145 145
Age
Pearson r ,088 -,033 -,004 -,234**
1
Sig. (2-tail) ,289 ,693 ,959 ,005
N 147 147 147 145 147
Education
Pearson r ,074 ,081 ,069 ,009 -,326**
1
Sig. (2-tail) ,370 ,328 ,408 ,910 ,000
N 147 147 147 145 147 147
Income
level
Pearson r ,121 -,080 -,060 -,320**
,657**
-,047 1
Sig. (2-tail) ,145 ,334 ,468 ,000 ,000 ,575
N 147 147 147 145 147 147 147
**. Correlation is significant at the 0.01 level (2-tailed).
*. Correlation is significant at the 0.05 level (2-tailed).

112
Correlation Spearman's rho
Salary Trust Intention Gender Age Education Income
level
Salary
Correlation 1
Sig. (2-tail) .
N 148
Trust
Correlation -,461**
1
Sig. (2-tail) ,000 .
N 148 148
Intention
Correlation -,539**
,916**
1
Sig. (2-tail) ,000 ,000 .
N 148 148 148
Gender
Correlation -,181* -,039 -,023 1
Sig. (2-tail) ,029 ,645 ,780 .
N 145 145 145 145
Age
Correlation ,092 -,013 ,018 -,237**
1
Sig. (2-tail) ,266 ,874 ,826 ,004 .
N 147 147 147 145 147
Education
Correlation ,066 ,109 ,085 ,014 -,358**
1
Sig. (2-tail) ,428 ,190 ,306 ,866 ,000 .
N 147 147 147 145 147 147
Income
level
Correlation ,116 -,070 -,057 -,303**
,677**
-,109 1
Sig. (2-tail) ,162 ,398 ,490 ,000 ,000 ,188 .
N 147 147 147 145 147 147 147
**. Correlation is significant at the 0.01 level (2-tailed).
*. Correlation is significant at the 0.05 level (2-tailed).

113
5.2 Mediation analysis
5.2.1 Regression 1: X Y
Variables Entered/Removeda
Model Variables
Entered
Variables
Removed
Method
1 Salaryb . Enter
a. Dependent Variable: Intention
b. All requested variables entered.
Model Summaryb
Model R R
Square
Adjusted R
Square
Std. Error of
the Estimate
Change Statistics
R Square
Change
F
Change
df1 df2 Sig. F
Change
1 ,541a ,293 ,288 1,182 ,293 60,511 1 146 ,000
a. Predictors: (Constant), Salary
b. Dependent Variable: Intention
ANOVAa
Model Sum of Squares df Mean Square F Sig.
1
Regression 84,590 1 84,590 60,511 ,000b
Residual 204,097 146 1,398
Total 288,688 147
a. Dependent Variable: Intention
b. Predictors: (Constant), Salary
Coefficientsa
Model Unstandardized
Coefficients
Standardized
Coefficients
t Sig. Collinearity
Statistics
B Std. Error Beta Tolerance VIF
1 (Constant) 5,318 ,189 28,089 ,000
Salary -1,716 ,221 -,541 -7,779 ,000 1,000 1,000
a. Dependent Variable: Intention

114
Collinearity Diagnosticsa
Model Dimension Eigenvalue Condition
Index
Variance Proportions
(Constant) Salary
1 1 1,858 1,000 ,07 ,07
2 ,142 3,620 ,93 ,93
a. Dependent Variable: Intention
Residuals Statisticsa
Minimum Maximum Mean Std. Deviation N
Predicted Value 3,60 5,32 4,05 ,759 148
Residual -3,118 2,598 ,000 1,178 148
Std. Predicted
Value -,596 1,666 ,000 1,000 148
Std. Residual -2,637 2,197 ,000 ,997 148
a. Dependent Variable: Intention

115
5.2.2 Regression 2: X M
Variables Entered/Removeda
Model Variables
Entered
Variables
Removed
Method
1 Salaryb . Enter
a. Dependent Variable: Trust
b. All requested variables entered.
Model Summaryb
Model R R
Square
Adjusted R
Square
Std. Error of
the Estimate
Change Statistics
R Square
Change
F
Change
df1 df2 Sig. F
Change
1 ,461a ,213 ,207 1,202 ,213 39,397 1 146 ,000
a. Predictors: (Constant), Salary
b. Dependent Variable: Trust
ANOVAa
Model Sum of Squares df Mean Square F Sig.
1
Regression 56,965 1 56,965 39,397 ,000b
Residual 211,105 146 1,446
Total 268,070 147
a. Dependent Variable: Trust
b. Predictors: (Constant), Salary
Coefficientsa
Model Unstandardized
Coefficients
Standardized
Coefficients
t Sig. Collinearity
Statistics
B Std. Error Beta Tolerance VIF
1 (Constant) 5,487 ,193 28,498 ,000
Salary -1,408 ,224 -,461 -6,277 ,000 1,000 1,000
a. Dependent Variable: Trust

116
Collinearity Diagnosticsa
Model Dimension Eigenvalue Condition
Index
Variance Proportions
(Constant) Salary
1 1 1,858 1,000 ,07 ,07
2 ,142 3,620 ,93 ,93
a. Dependent Variable: Trust
Residuals Statisticsa
Minimum Maximum Mean Std. Deviation N
Predicted Value 4,08 5,49 4,45 ,623 148
Residual -2,887 2,921 ,000 1,198 148
Std. Predicted Value -,596 1,666 ,000 1,000 148
Std. Residual -2,401 2,429 ,000 ,997 148
a. Dependent Variable: Trust

117
5.2.3 Regression 3: M Y
Variables Entered/Removeda
Model Variables
Entered
Variables
Removed
Method
1 Trustb . Enter
a. Dependent Variable: Intention
b. All requested variables entered.
Model Summaryb
Model R R
Square
Adjusted R
Square
Std. Error
of the
Estimate
Change Statistics
R Square
Change
F
Change
df1 df2 Sig. F
Change
1 ,918a ,843 ,842 ,557 ,843 783,223 1 146 ,000
a. Predictors: (Constant), Trust
b. Dependent Variable: Intention
ANOVAa
Model Sum of Squares df Mean Square F Sig.
1
Regression 243,329 1 243,329 783,223 ,000b
Residual 45,359 146 ,311
Total 288,688 147
a. Dependent Variable: Intention
b. Predictors: (Constant), Trust
Coefficientsa
Model Unstandardized
Coefficients
Standardized
Coefficients
t Sig. Collinearity
Statistics
B Std. Error Beta Tolerance VIF
1 (Constant) -,186 ,158 -1,173 ,243
Trust ,953 ,034 ,918 27,986 ,000 1,000 1,000
a. Dependent Variable: Intention

118
Collinearity Diagnosticsa
Model Dimension Eigenvalue Condition
Index
Variance Proportions
(Constant) Trust
1 1 1,957 1,000 ,02 ,02
2 ,043 6,761 ,98 ,98
a. Dependent Variable: Intention
Casewise Diagnosticsa
Case Number Std. Residual Intention Predicted
Value
Residual
67 -3,464 4 5,53 -1,931
72 -3,379 5 6,48 -1,884
108 -3,874 3 4,96 -2,159
a. Dependent Variable: Intention
Residuals Statisticsa
Minimum Maximum Mean Std. Deviation N
Predicted Value ,96 6,48 4,05 1,287 148
Residual -2,159 1,156 ,000 ,555 148
Std. Predicted
Value -2,407 1,888 ,000 1,000 148
Std. Residual -3,874 2,074 ,000 ,997 148
a. Dependent Variable: Intention

119
5.2.4 Regression 4:. X (M) Y
Variables Entered/Removeda
Model Variables
Entered
Variables
Removed
Method
1 Salaryb . Enter
2 Trustb . Enter
a. Dependent Variable: Intention
b. All requested variables entered.
Model Summaryc
Model R R
Square
Adjusted R
Square
Std. Error
of the
Estimate
Change Statistics
R Square
Change
F
Change
df1 df2 Sig. F
Change
1 ,541a ,293 ,288 1,182 ,293 60,511 1 146 ,000
2 ,928b ,861 ,859 ,527 ,568 590,326 1 145 ,000
a. Predictors: (Constant), Salary
b. Predictors: (Constant), Salary, Trust
c. Dependent Variable: Intention
ANOVAa
Model Sum of
Squares
df Mean Square F Sig.
1
Regression 84,590 1 84,590 60,511 ,000b
Residual 204,097 146 1,398
Total 288,688 147
2
Regression 248,441 2 124,221 447,545 ,000c
Residual 40,246 145 ,278
Total 288,688 147
a. Dependent Variable: Intention
b. Predictors: (Constant), Salary
c. Predictors: (Constant), Salary, Trust

120
Coefficientsa
Model Unstandardized
Coefficients
Standardized
Coefficients
t Sig. Collinearity
Statistics
B Std. Error Beta Tolerance VIF
1 (Constant) 5,318 ,189 28,089 ,000
Salary -1,716 ,221 -,541 -7,779 ,000 1,000 1,000
2
(Constant) ,484 ,216 2,238 ,027
Salary -,475 ,111 -,150 -4,292 ,000 ,787 1,270
Trust ,881 ,036 ,849 24,297 ,000 ,787 1,270
a. Dependent Variable: Intention
Excluded Variablesa
Model Beta In t Sig. Partial
Correlation
Collinearity Statistics
Tolerance VIF Minimum
Tolerance
1 Trust ,849b 24,297 ,000 ,896 ,787 1,270 ,787
a. Dependent Variable: Intention
b. Predictors in the Model: (Constant), Salary low / high
Collinearity Diagnosticsa
Model Dimension Eigenvalue Condition
Index
Variance Proportions
(Constant) Salary low /
high
Trust
1 1 1,858 1,000 ,07 ,07
2 ,142 3,620 ,93 ,93
2
1 2,715 1,000 ,01 ,02 ,01
2 ,261 3,228 ,01 ,51 ,08
3 ,025 10,508 ,99 ,47 ,91
a. Dependent Variable: Intention

121
Casewise Diagnosticsa
Case Number Std. Residual Intention Predicted
Value
Residual
67 -3,216 4 5,29 -1,694
108 -3,731 3 4,77 -1,966
a. Dependent Variable: Intention
Residuals Statisticsa
Minimum Maximum Mean Std. Deviation N
Predicted Value 1,07 6,65 4,05 1,300 148
Residual -1,966 1,220 ,000 ,523 148
Std. Predicted
Value -2,299 1,997 ,000 1,000 148
Std. Residual -3,731 2,316 ,000 ,993 148
a. Dependent Variable: Intention

122
5.3 Mediation with control variables
Variables Entered/Removeda
Model Variables Entered Variables Removed Method
1 Salaryb . Enter
2 Trustb . Enter
3 Age, Gender, Education, Income levelb . Enter
a. Dependent Variable: Intention
b. All requested variables entered.
Model Summaryd
Model R R
Square
Adjusted R
Square
Std. Error
of the
Estimate
Change Statistics
R Square
Change
F
Change
df1 df2 Sig. F
Change
1 ,538a ,289 ,284 1,181 ,289 58,218 1 143 ,000
2 ,927b ,860 ,858 ,527 ,570 577,476 1 142 ,000
3 ,928c ,862 ,856 ,531 ,002 ,456 4 138 ,768
a. Predictors: (Constant), Salary
b. Predictors: (Constant), Salary, Trust
c. Predictors: (Constant), Salary, Trust, Age, Gender, Education, Income level
d. Dependent Variable: Intention
ANOVAa
Model Sum of Squares df Mean Square F Sig.
1
Regression 81,213 1 81,213 58,218 ,000b
Residual 199,481 143 1,395
Total 280,694 144
2
Regression 241,323 2 120,661 435,195 ,000c
Residual 39,371 142 ,277
Total 280,694 144
3
Regression 241,836 6 40,306 143,146 ,000d
Residual 38,857 138 ,282
Total 280,694 144
a. Dependent Variable: Intention
b. Predictors: (Constant), Salary
c. Predictors: (Constant), Salary, Trust
d. Predictors: (Constant), Salary, Trust, Age, Gender, Education, Income level
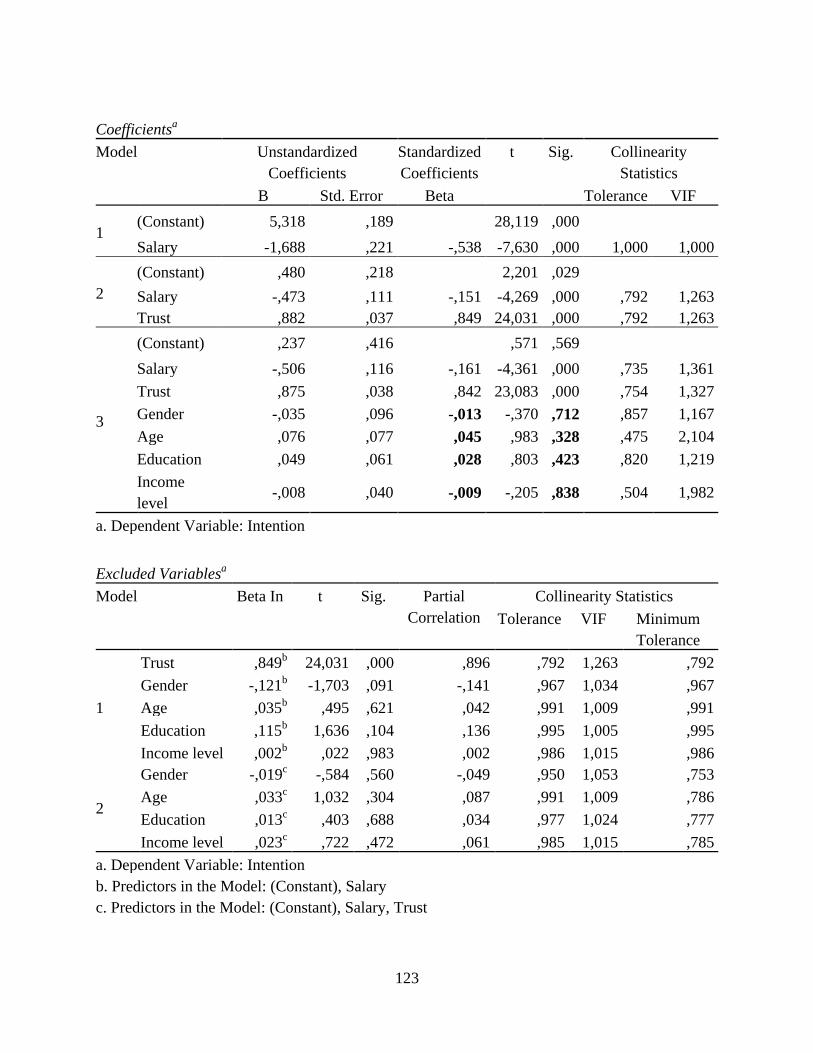
123
Coefficientsa
Model Unstandardized
Coefficients
Standardized
Coefficients
t Sig. Collinearity
Statistics
B Std. Error Beta Tolerance VIF
1 (Constant) 5,318 ,189 28,119 ,000
Salary -1,688 ,221 -,538 -7,630 ,000 1,000 1,000
2
(Constant) ,480 ,218 2,201 ,029
Salary -,473 ,111 -,151 -4,269 ,000 ,792 1,263
Trust ,882 ,037 ,849 24,031 ,000 ,792 1,263
3
(Constant) ,237 ,416 ,571 ,569
Salary -,506 ,116 -,161 -4,361 ,000 ,735 1,361
Trust ,875 ,038 ,842 23,083 ,000 ,754 1,327
Gender -,035 ,096 -,013 -,370 ,712 ,857 1,167
Age ,076 ,077 ,045 ,983 ,328 ,475 2,104
Education ,049 ,061 ,028 ,803 ,423 ,820 1,219
Income
level -,008 ,040 -,009 -,205 ,838 ,504 1,982
a. Dependent Variable: Intention
Excluded Variablesa
Model Beta In t Sig. Partial
Correlation
Collinearity Statistics
Tolerance VIF Minimum
Tolerance
1
Trust ,849b 24,031 ,000 ,896 ,792 1,263 ,792
Gender -,121b -1,703 ,091 -,141 ,967 1,034 ,967
Age ,035b ,495 ,621 ,042 ,991 1,009 ,991
Education ,115b 1,636 ,104 ,136 ,995 1,005 ,995
Income level ,002b ,022 ,983 ,002 ,986 1,015 ,986
2
Gender -,019c -,584 ,560 -,049 ,950 1,053 ,753
Age ,033c 1,032 ,304 ,087 ,991 1,009 ,786
Education ,013c ,403 ,688 ,034 ,977 1,024 ,777
Income level ,023c ,722 ,472 ,061 ,985 1,015 ,785
a. Dependent Variable: Intention
b. Predictors in the Model: (Constant), Salary
c. Predictors in the Model: (Constant), Salary, Trust
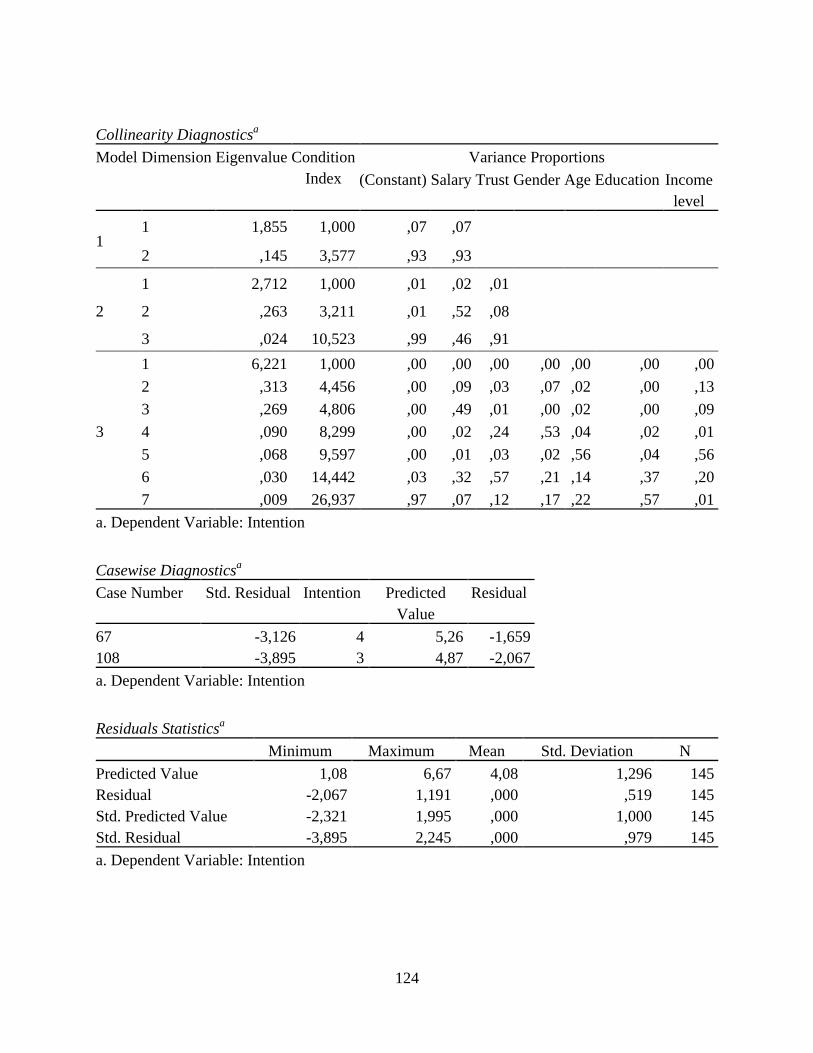
124
Collinearity Diagnosticsa
Model Dimension Eigenvalue Condition
Index
Variance Proportions
(Constant) Salary Trust Gender Age Education Income
level
1 1 1,855 1,000 ,07 ,07
2 ,145 3,577 ,93 ,93
2
1 2,712 1,000 ,01 ,02 ,01
2 ,263 3,211 ,01 ,52 ,08
3 ,024 10,523 ,99 ,46 ,91
3
1 6,221 1,000 ,00 ,00 ,00 ,00 ,00 ,00 ,00
2 ,313 4,456 ,00 ,09 ,03 ,07 ,02 ,00 ,13
3 ,269 4,806 ,00 ,49 ,01 ,00 ,02 ,00 ,09
4 ,090 8,299 ,00 ,02 ,24 ,53 ,04 ,02 ,01
5 ,068 9,597 ,00 ,01 ,03 ,02 ,56 ,04 ,56
6 ,030 14,442 ,03 ,32 ,57 ,21 ,14 ,37 ,20
7 ,009 26,937 ,97 ,07 ,12 ,17 ,22 ,57 ,01
a. Dependent Variable: Intention
Casewise Diagnosticsa
Case Number Std. Residual Intention Predicted
Value
Residual
67 -3,126 4 5,26 -1,659
108 -3,895 3 4,87 -2,067
a. Dependent Variable: Intention
Residuals Statisticsa
Minimum Maximum Mean Std. Deviation N
Predicted Value 1,08 6,67 4,08 1,296 145
Residual -2,067 1,191 ,000 ,519 145
Std. Predicted Value -2,321 1,995 ,000 1,000 145
Std. Residual -3,895 2,245 ,000 ,979 145
a. Dependent Variable: Intention

125

126
5.4 Performance
5.4.1 Scale Reliability: Trust with performance
Case Processing Summary
N %
Cases
Valid 76 100,0
Excludeda 0 ,0
Total 76 100,0
a. Listwise deletion based on all variables in the procedure.
Cronbach's
Alpha
N of Items
,955 5
Item-Total Statistics
Scale Mean if
Item Deleted
Scale
Variance if
Item Deleted
Corrected
Item-Total
Correlation
Squared
Multiple
Correlation
Cronbach's
Alpha if Item
Deleted
trust with
performance 1 17,25 24,510 ,872 ,772 ,944
trust with
performance 2 17,13 26,009 ,831 ,723 ,951
trust with
performance 3 17,39 24,242 ,889 ,837 ,941
trust with
performance 4 17,47 25,293 ,858 ,745 ,947
trust with
performance 5 17,28 24,549 ,921 ,862 ,936

127
5.4.2 Scale Reliability: Intention with performance
Case Processing Summary
N %
Cases
Valid 76 100,0
Excludeda 0 ,0
Total 76 100,0
a. Listwise deletion based on all variables in the procedure.
Reliability Statistics
Cronbach's
Alpha
N of Items
,980 5
Item-Total Statistics
Scale Mean if
Item Deleted
Scale
Variance if
Item Deleted
Corrected
Item-Total
Correlation
Cronbach's
Alpha if Item
Deleted
intention with
performance 1 14,46 31,665 ,944 ,974
intention with
performance 2 14,51 32,466 ,956 ,973
intention with
performance 3 14,53 32,066 ,887 ,983
intention with
performance 4 14,54 31,505 ,957 ,972
intention with
performance 5 14,54 31,372 ,959 ,972

128
5.4.3 Assumptions
Statistics
trustperforman
ce
intentionperfo
rmance
N Valid 76 76
Missing 0 0
Mean 4,3263 3,6289
Std. Deviation 1,24101 1,40654
Skewness -,401 ,114
Std. Error of Skewness ,276 ,276
Kurtosis -,070 -,407
Std. Error of Kurtosis ,545 ,545
Minimum 1,00 1,00
Maximum 7,00 7,00

129
5.4.4 Regression: Performance Trust
Variables Entered/Removeda
Model Variables
Entered
Variables
Removed
Method
1 Performanceb . Enter
a. Dependent Variable: trustperformance
b. All requested variables entered.
Model Summaryb
Model R R Square Adjusted R
Square
Std. Error of
the Estimate
1 ,402a ,161 ,150 1,14423
a. Predictors: (Constant), Performance
b. Dependent Variable: trustperformance
ANOVAa
Model Sum of
Squares
df Mean Square F Sig.
1
Regression 18,621 1 18,621 14,223 ,000b
Residual 96,886 74 1,309
Total 115,507 75
a. Dependent Variable: trustperformance
b. Predictors: (Constant), Performance
Coefficientsa
Model Unstandardized Coefficients Standardized
Coefficients
t Sig.
B Std. Error Beta
1 (Constant) 3,881 ,177 21,981 ,000
Performance ,996 ,264 ,402 3,771 ,000
a. Dependent Variable: trustperformance

130
Residuals Statisticsa
Minimum Maximum Mean Std. Deviation N
Predicted Value 3,8810 4,8765 4,3263 ,49828 76
Residual -2,88095 2,12353 ,00000 1,13658 76
Std. Predicted
Value -,894 1,104 ,000 1,000 76
Std. Residual -2,518 1,856 ,000 ,993 76
a. Dependent Variable: trustperformance

131
5.4.5 Regression: Performance Intention
Variables Entered/Removeda
Model Variables
Entered
Variables
Removed
Method
1 Performanceb . Enter
a. Dependent Variable: intentionperformance
b. All requested variables entered.
Model Summaryb
Model R R Square Adjusted R
Square
Std. Error of
the Estimate
1 ,292a ,085 ,073 1,35431
a. Predictors: (Constant), Performance
b. Dependent Variable: intentionperformance
ANOVAa
Model Sum of
Squares
df Mean Square F Sig.
1
Regression 12,648 1 12,648 6,896 ,010b
Residual 135,728 74 1,834
Total 148,376 75
a. Dependent Variable: intentionperformance
b. Predictors: (Constant), Performance
Coefficientsa
Model Unstandardized Coefficients Standardized
Coefficients
t Sig.
B Std. Error Beta
1 (Constant) 3,262 ,209 15,609 ,000
Performance ,820 ,312 ,292 2,626 ,010
a. Dependent Variable: intentionperformance

132
Residuals Statisticsa
Minimum Maximum Mean Std. Deviation N
Predicted Value 3,2619 4,0824 3,6289 ,41066 76
Residual -2,28235 2,91765 ,00000 1,34526 76
Std. Predicted
Value -,894 1,104 ,000 1,000 76
Std. Residual -1,685 2,154 ,000 ,993 76
a. Dependent Variable: intentionperformance

133
5.4.6 Oneway Anova
Descriptives
N Mean Std.
Deviation
Std.
Error
95% Confidence
Interval for Mean
Minimum Maximum
Lower
Bound
Upper
Bound
Trust
performance
low 42 3,8810 1,14172 ,17617 3,5252 4,2367 1,00 6,00
high 34 4,8765 1,14734 ,19677 4,4761 5,2768 2,00 7,00
Total 76 4,3263 1,24101 ,14235 4,0427 4,6099 1,00 7,00
Intention
performance
low 42 3,2619 1,32774 ,20488 2,8482 3,6757 1,00 6,00
high 34 4,0824 1,38662 ,23780 3,5985 4,5662 1,80 7,00
Total 76 3,6289 1,40654 ,16134 3,3075 3,9504 1,00 7,00
ANOVA
Sum of
Squares
df Mean Square F Sig.
Trust
performance
Between Groups 18,621 1 18,621 14,223 ,000
Within Groups 96,886 74 1,309
Total 115,507 75
Intention
performance
Between Groups 12,648 1 12,648 6,896 ,010
Within Groups 135,728 74 1,834
Total 148,376 75

134
5.4.7 Paired sample T-Test
Paired Samples Statistics
Mean N Std. Deviation Std. Error Mean
Pair 1 trust 4,1706 34 1,27553 ,21875
trustperformancehoog 4,8765 34 1,14734 ,19677
Pair 2 trust 3,9571 42 1,20449 ,18586
trustperformancelaag 3,8810 42 1,14172 ,17617
Pair 3 intention 3,2176 34 1,40334 ,24067
intentionperformancehoog 4,0824 34 1,38662 ,23780
Pair 4 intention 3,4333 42 1,33465 ,20594
intentionperformancelaag 3,2619 42 1,32774 ,20488
Paired Samples Correlations
N Correlation Sig.
Pair 1 trust & trustperformancehoog 34 ,774 ,000
Pair 2 trust & trustperformancelaag 42 ,616 ,000
Pair 3 intention & intentionperformancehoog 34 ,780 ,000
Pair 4 intention & intentionperformancelaag 42 ,833 ,000
Paired Samples Test
Paired Differences t df Sig.
(2-tail) Mean Std. Dev Std.
Error
Mean
95% Confidence
Interval of the
Difference
Lower Upper
Pair 1 trust -
trustperformancehoog -,70588 ,82276 ,14110 -,99296 -,41881 -5,003 33 ,000
Pair 2 trust -
trustperformancelaag ,07619 1,02928 ,15882 -,24456 ,39694 ,480 41 ,634
Pair 3 intention -
intentionperformancehoog -,86471 ,92602 ,15881 -1,18781 -,54160 -5,445 33 ,000
Pair 4 intention -
intentionperformancelaag ,17143 ,76836 ,11856 -,06801 ,41087 1,446 41 ,156

135
5.5. Administrative Ratio
5.5.1 Scale Reliability: Trust with administrative ratio
Case Processing Summary
N %
Cases
Valid 67 100,0
Excludeda 0 ,0
Total 67 100,0
a. Listwise deletion based on all variables in the procedure.
Reliability Statistics
Cronbach's
Alpha
N of Items
,945 5
Item-Total Statistics
Scale Mean if
Item Deleted
Scale Variance if
Item Deleted
Corrected
Item-Total
Correlation
Cronbach's Alpha
if Item Deleted
trust with admin ratio 1 16,81 27,310 ,856 ,931
trust with admin ratio 2 16,67 28,830 ,776 ,945
trust with admin ratio 3 17,18 26,483 ,809 ,941
trust with admin ratio 4 17,06 26,815 ,912 ,921
trust with admin ratio 5 16,94 26,572 ,909 ,922

136
5.5.2 Scale Reliability: Intention to donate with administrative ratio
Case Processing Summary
N %
Cases
Valid 67 100,0
Excludeda 0 ,0
Total 67 100,0
a. Listwise deletion based on all
variables in the procedure.
Reliability Statistics
Cronbach's
Alpha
N of Items
,979 5
Item-Total Statistics
Scale Mean if
Item Deleted
Scale Variance if
Item Deleted
Corrected
Item-Total
Correlation
Cronbach's
Alpha if Item
Deleted
intention with admin ratio 1 14,03 36,484 ,931 ,974
intention with admin ratio 2 14,18 36,392 ,958 ,970
intention with admin ratio 3 14,12 36,682 ,886 ,981
intention with admin ratio 4 14,15 35,402 ,948 ,972
intention with admin ratio 5 14,09 35,174 ,963 ,969

137
5.5.3 Assumptions
Statistics
trustadminratio intentionadminratio
N Valid 67 67
Missing 0 0
Mean 4,2328 3,5284
Std. Deviation 1,29502 1,49654
Skewness -,027 -,048
Std. Error of Skewness ,293 ,293
Kurtosis -1,086 -1,165
Std. Error of Kurtosis ,578 ,578
Minimum 2,00 1,00
Maximum 6,60 6,00

138
5.5.4 Regression: Administrative ratio trust
Variables Entered/Removeda
Model Variables
Entered
Variables
Removed
Method
1 Admin Ratiob . Enter
a. Dependent Variable: trustadminratio
b. All requested variables entered.
Model Summaryb
Model R R Square Adjusted R
Square
Std. Error of
the Estimate
1 ,500a ,250 ,238 1,13030
a. Predictors: (Constant), Admin Ratio
b. Dependent Variable: trustadminratio
ANOVAa
Model Sum of
Squares
df Mean Square F Sig.
1
Regression 27,645 1 27,645 21,639 ,000b
Residual 83,042 65 1,278
Total 110,688 66
a. Dependent Variable: trustadminratio
b. Predictors: (Constant), Admin Ratio
Coefficientsa
Model Unstandardized Coefficients Standardized
Coefficients
t Sig.
B Std. Error Beta
1 (Constant) 3,600 ,194 18,572 ,000
Admin Ratio -1,285 ,276 -,500 -4,652 ,000
a. Dependent Variable: trustadminratio

139
Residuals Statisticsa
Minimum Maximum Mean Std. Deviation N
Predicted Value 3,6000 4,8848 4,2328 ,64720 67
Residual -2,88485 3,00000 ,00000 1,12170 67
Std. Predicted Value -,978 1,007 ,000 1,000 67
Std. Residual -2,552 2,654 ,000 ,992 67
a. Dependent Variable: trustadminratio

140
5.5.5 Regression: Administrative ratio intention
Variables Entered/Removeda
Model Variables
Entered
Variables
Removed
Method
1 Admin Ratiob . Enter
a. Dependent Variable: intentionadminratio
b. All requested variables entered.
Model Summaryb
Model R R Square Adjusted R
Square
Std. Error of
the Estimate
1 ,490a ,240 ,228 1,31482
a. Predictors: (Constant), Admin Ratio
b. Dependent Variable: intentionadminratio
ANOVAa
Model Sum of
Squares
df Mean Square F Sig.
1
Regression 35,447 1 35,447 20,505 ,000b
Residual 112,369 65 1,729
Total 147,816 66
a. Dependent Variable: intentionadminratio
b. Predictors: (Constant), Admin Ratio
Coefficientsa
Model Unstandardized Coefficients Standardized
Coefficients
t Sig.
B Std. Error Beta
1 (Constant) 2,812 ,225 12,470 ,000
Admin Ratio -1,455 ,321 -,490 4,528 ,000
a. Dependent Variable: intentionadminratio

141
Residuals Statisticsa
Minimum Maximum Mean Std. Deviation N
Predicted Value 2,8118 4,2667 3,5284 ,73286 67
Residual -3,26667 2,38824 ,00000 1,30482 67
Std. Predicted
Value -,978 1,007 ,000 1,000 67
Std. Residual -2,484 1,816 ,000 ,992 67
a. Dependent Variable: intentionadminratio

142
5.5.6 Oneway Anova
Descriptives
N Mean Std.
Deviation
Std.
Error
95%
Confidence
Interval for
Mean
Minimum Maximum
Lower
Bound
Upper
Bound
Trust
adminratio
high 34 3,6000 1,11844 ,19181 3,2098 3,9902 2,00 6,60
low 33 4,8848 1,14240 ,19887 4,4798 5,2899 2,00 6,00
Total 67 4,2328 1,29502 ,15821 3,9170 4,5487 2,00 6,60
Intention
adminratio
high 34 2,8118 1,17854 ,20212 2,4006 3,2230 1,00 5,20
low 33 4,2667 1,44193 ,25101 3,7554 4,7780 1,00 6,00
Total 67 3,5284 1,49654 ,18283 3,1633 3,8934 1,00 6,00
ANOVA
Sum of
Squares
df Mean Square F Sig.
Trust
adminratio
Between Groups 27,645 1 27,645 21,639 ,000
Within Groups 83,042 65 1,278
Total 110,688 66
Intention
adminratio
Between Groups 35,447 1 35,447 20,505 ,000
Within Groups 112,369 65 1,729
Total 147,816 66

143
5.5.7 Paired sample T-Test
Paired Samples Statistics
Mean N Std. Deviation Std. Error Mean
Pair 1 trust 4,1394 33 1,23337 ,21470
trustadminlaag 4,8848 33 1,14240 ,19887
Pair 2 trust 4,1706 34 1,27553 ,21875
trustadminhoog 3,6000 34 1,11844 ,19181
Pair 3 intention 3,3636 33 1,26140 ,21958
intentionadminlaag 4,2667 33 1,44193 ,25101
Pair 4 intention 3,2176 34 1,40334 ,24067
intentionadminhoog 2,8118 34 1,17854 ,20212
Paired Samples Correlations
N Correlation Sig.
Pair 1 trust & trustadminlaag 33 ,784 ,000
Pair 2 trust & trustadminhoog 34 ,665 ,000
Pair 3 intention & intentionadminlaag 33 ,693 ,000
Pair 4 intention & intentionadminhoog 34 ,725 ,000
Paired Samples Test
Paired Differences t df Sig.
(2-tailed) Mean Std.
Deviation
Std.
Error
Mean
95% Confidence
Interval of the
Difference
Lower Upper
Pair 1 trust -
trustadminlaag -,74545 ,78465 ,13659 -1,02368 -,46723 -5,458 32 ,000
Pair 2 trust -
trustadminhoog ,57059 ,98981 ,16975 ,22523 ,91595 3,361 33 ,002
Pair 3 intention -
intentionadminlaag -,90303 1,07136 ,18650 -1,28292 -,52314 -4,842 32 ,000
Pair 4 intention -
intentionadminhoog ,40588 ,97916 ,16792 ,06424 ,74753 2,417 33 ,021

144
5.6 Reputation
5.6.1 Scale Reliability: Trust with reputation
Case Processing Summary
N %
Cases
Valid 75 100,0
Excludeda 0 ,0
Total 75 100,0
a. Listwise deletion based on all variables in the procedure.
Reliability Statistics
Cronbach's
Alpha
N of Items
,969 5
Item-Total Statistics
Scale Mean if
Item Deleted
Scale Variance if
Item Deleted
Corrected
Item-Total
Correlation
Cronbach's Alpha
if Item Deleted
trust with reputation 1 18,36 23,179 ,912 ,961
trust with reputation 2 18,31 22,918 ,918 ,960
trust with reputation 3 18,48 22,848 ,892 ,964
trust with reputation 4 18,61 22,078 ,912 ,961
trust with reputation 5 18,51 22,578 ,919 ,960

145
5.6.2 Scale Reliability: Intention with reputation
Case Processing Summary
N %
Cases
Valid 75 100,0
Excludeda 0 ,0
Total 75 100,0
a. Listwise deletion based on all variables in the procedure.
Reliability Statistics
Cronbach's Alpha N of Items
,975 5
Item-Total Statistics
Scale Mean if
Item Deleted
Scale
Variance if
Item Deleted
Corrected
Item-Total
Correlation
Cronbach's
Alpha if Item
Deleted
intention with
reputation 1 15,81 30,532 ,941 ,967
intention with
reputation 2 15,97 30,486 ,952 ,966
intention with
reputation 3 16,01 30,716 ,892 ,975
intention with
reputation 4 15,87 30,360 ,891 ,975
intention with
reputation 5 15,96 29,255 ,965 ,963

146
5.6.3 Assumptions
Statistics
trustreputation intentionreputation
N Valid 75 75
Missing 0 0
Mean 4,6133 3,9813
Std. Deviation 1,18702 1,37120
Skewness -,678 -,637
Std. Error of Skewness ,277 ,277
Kurtosis ,463 -,260
Std. Error of Kurtosis ,548 ,548
Minimum 1,00 1,00
Maximum 7,00 6,00

147
5.6.4 Regression: Reputation Trust
Variables Entered/Removeda
Model Variables
Entered
Variables
Removed
Method
1 Reputationb . Enter
a. Dependent Variable: trustreputation
b. All requested variables entered.
Model Summaryb
Model R R Square Adjusted R
Square
Std. Error of
the Estimate
1 ,063a ,004 -,010 1,19275
a. Predictors: (Constant), Reputation
b. Dependent Variable: trustreputation
ANOVAa
Model Sum of
Squares
df Mean Square F Sig.
1
Regression ,412 1 ,412 ,290 ,592b
Residual 103,854 73 1,423
Total 104,267 74
a. Dependent Variable: trustreputation
b. Predictors: (Constant), Reputation
Coefficientsa
Model Unstandardized Coefficients Standardized
Coefficients
t Sig.
B Std. Error Beta
1 (Constant) 4,697 ,208 22,622 ,000
Reputation -,149 ,277 -,063 -,538 ,592
a. Dependent Variable: trustreputation

148
Residuals Statisticsa
Minimum Maximum Mean Std. Deviation N
Predicted Value 4,5476 4,6970 4,6133 ,07463 75
Residual -3,54762 2,45238 ,00000 1,18467 75
Std. Predicted
Value -,880 1,121 ,000 1,000 75
Std. Residual -2,974 2,056 ,000 ,993 75
a. Dependent Variable: trustreputation

149
5.6.5 Regression: Reputation Intention
Variables Entered/Removeda
Model Variables
Entered
Variables
Removed
Method
1 Reputationb . Enter
a. Dependent Variable: intentionreputation
b. All requested variables entered.
Model Summaryb
Model R R Square Adjusted R
Square
Std. Error of
the Estimate
1 ,107a ,011 -,002 1,37266
a. Predictors: (Constant), Reputation
b. Dependent Variable: intentionreputation
ANOVAa
Model Sum of
Squares
df Mean Square F Sig.
1
Regression 1,587 1 1,587 ,842 ,362b
Residual 137,547 73 1,884
Total 139,134 74
a. Dependent Variable: intentionreputation
b. Predictors: (Constant), Reputation
Coefficientsa
Model Unstandardized Coefficients Standardized
Coefficients
t Sig.
B Std. Error Beta
1 (Constant) 4,145 ,239 17,349 ,000
Reputation -,293 ,319 -,107 -,918 ,362
a. Dependent Variable: intentionreputation

150
Residuals Statisticsa
Minimum Maximum Mean Std. Deviation N
Predicted Value 3,8524 4,1455 3,9813 ,14646 75
Residual -3,14545 2,14762 ,00000 1,36336 75
Std. Predicted Value -,880 1,121 ,000 1,000 75
Std. Residual -2,292 1,565 ,000 ,993 75
a. Dependent Variable: intentionreputation

151
5.6.6 Oneway Anova
Descriptives
N Mean Std.
Deviation
Std.
Error
95% Confidence
Interval for Mean
Minimum Maximum
Lower
Bound
Upper
Bound
trustreputation
low 33 4,6970 1,29433 ,22531 4,2380 5,1559 2,00 6,60
high 42 4,5476 1,10701 ,17082 4,2026 4,8926 1,00 7,00
Total 75 4,6133 1,18702 ,13706 4,3402 4,8864 1,00 7,00
intentionreputation
low 33 4,1455 1,42414 ,24791 3,6405 4,6504 1,00 6,00
high 42 3,8524 1,33110 ,20539 3,4376 4,2672 1,00 6,00
Total 75 3,9813 1,37120 ,15833 3,6658 4,2968 1,00 6,00
ANOVA
Sum of Squares df Mean Square F Sig.
trustreputation
Between Groups ,412 1 ,412 ,290 ,592
Within Groups 103,854 73 1,423
Total 104,267 74
intentionreputation
Between Groups 1,587 1 1,587 ,842 ,362
Within Groups 137,547 73 1,884
Total 139,134 74

152
5.6.7 Paired sample T-test
Paired Samples Statistics
Mean N Std. Deviation Std. Error Mean
Pair 1 trust 4,1394 33 1,23337 ,21470
trustreputationlaag 4,6970 33 1,29433 ,22531
Pair 2 trust 3,9571 42 1,20449 ,18586
trustreputationhoog 4,5476 42 1,10701 ,17082
Pair 3 intention 3,3636 33 1,26140 ,21958
intentionreputationlaag 4,1455 33 1,42414 ,24791
Pair 4 intention 3,4333 42 1,33465 ,20594
intentionreputationhoog 3,8524 42 1,33110 ,20539
Paired Samples Correlations
N Correlation Sig.
Pair 1 trust & trustreputationlaag 33 ,681 ,000
Pair 2 trust & trustreputationhoog 42 ,852 ,000
Pair 3 intention & intentionreputationlaag 33 ,608 ,000
Pair 4 intention & intentionreputationhoog 42 ,892 ,000
Paired Samples Test
Paired Differences t df Sig.
(2-tailed
)
Mean Std.
Deviation
Std.
Error
Mean
95% Confidence
Interval of the
Difference
Lower Upper
Pair
1
trust -
trustreputationlaag -,55758 1,01089 ,17597 -,91602 -,19913 -3,169 32 ,003
Pair
2
trust -
trustreputationhoog -,59048 ,63546 ,09805 -,78850 -,39245 -6,022 41 ,000
Pair
3
intention -
intentionreputationlaag -,78182 1,19829 ,20860 -1,20671 -,35692 -3,748 32 ,001
Pair
4
intention -
intentionreputationhoog -,41905 ,61812 ,09538 -,61167 -,22643 -4,394 41 ,000

153
5.7 Extra questions
1. I think information about a director’s salary in a charity organization is important in my decision
to donate
2. I would actively look for information regarding a director’s salary of a charity organization if I
wanted to donate.
3. I think that directors in charity organizations should earn less than directors in for-profit
organizations.
4. I think that charity organizations should pay their directors a lot, because this will guarantee
proper leadership.
5.I think that directors in a charity organization should accept a lower salary then they could earn
in a for-profit organization, because they choose to work for charity.
5.7.1 Descriptives & Frequencies
1 2 3 4 5
N Valid 148 148 148 148 148
Missing 0 0 0 0 0
Mean 5,04 3,44 5,16 2,72 5,06
Std. Deviation 1,538 1,754 1,657 1,385 1,613
Skewness -,842 ,401 -,752 ,632 -,682
Std. Error of Skewness ,199 ,199 ,199 ,199 ,199
Kurtosis ,079 -,899 -,220 -,358 -,240
Std. Error of Kurtosis ,396 ,396 ,396 ,396 ,396
Minimum 1 1 1 1 1
Maximum 7 7 7 6 7
Informatie over salaris van directeur belangrijk is in mijn
beslissing om te doneren
Frequency Percent Valid Percent Cumulative
Percent
Valid
1 5 3,4 3,4 3,4
2 6 4,1 4,1 7,4
3 15 10,1 10,1 17,6
4 19 12,8 12,8 30,4
5 31 20,9 20,9 51,4
6 51 34,5 34,5 85,8
7 21 14,2 14,2 100,0
Total 148 100,0 100,0
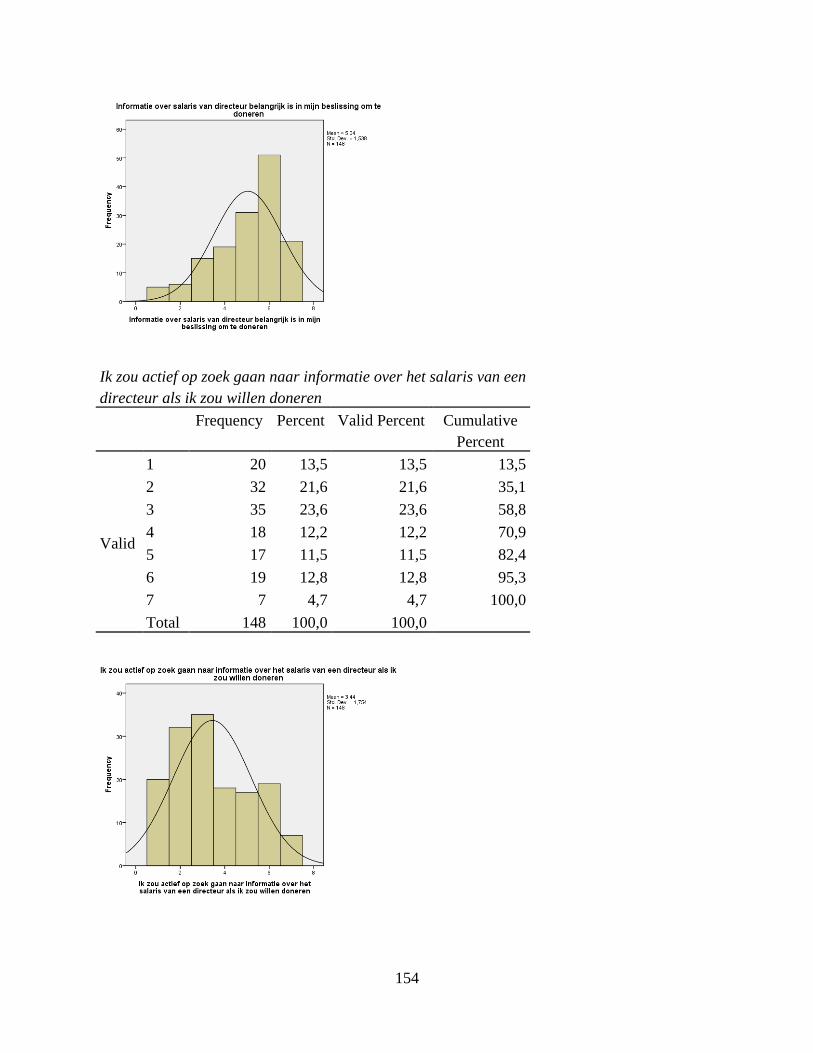
154
Ik zou actief op zoek gaan naar informatie over het salaris van een
directeur als ik zou willen doneren
Frequency Percent Valid Percent Cumulative
Percent
Valid
1 20 13,5 13,5 13,5
2 32 21,6 21,6 35,1
3 35 23,6 23,6 58,8
4 18 12,2 12,2 70,9
5 17 11,5 11,5 82,4
6 19 12,8 12,8 95,3
7 7 4,7 4,7 100,0
Total 148 100,0 100,0

155
Ik denk dat directeuren in liefdadigheidsinstellingen minder
moeten verdienen
Frequency Percent Valid Percent Cumulative
Percent
Valid
1 4 2,7 2,7 2,7
2 12 8,1 8,1 10,8
3 6 4,1 4,1 14,9
4 23 15,5 15,5 30,4
5 32 21,6 21,6 52,0
6 32 21,6 21,6 73,6
7 39 26,4 26,4 100,0
Total 148 100,0 100,0
Directeuren veel betalen, omdat dit goed leiderschap zal
garanderen
Frequency Percent Valid Percent Cumulative
Percent
Valid
1 31 20,9 20,9 20,9
2 43 29,1 29,1 50,0
3 37 25,0 25,0 75,0
4 17 11,5 11,5 86,5
5 14 9,5 9,5 95,9
6 6 4,1 4,1 100,0
Total 148 100,0 100,0

156
Ik denk dat directeuren in een liefdadigheidsinstelling een lager
salaris moeten accepteren
Frequency Percent Valid Percent Cumulative
Percent
Valid
1 4 2,7 2,7 2,7
2 10 6,8 6,8 9,5
3 12 8,1 8,1 17,6
4 18 12,2 12,2 29,7
5 40 27,0 27,0 56,8
6 31 20,9 20,9 77,7
7 33 22,3 22,3 100,0
Total 148 100,0 100,0

157
5.7.2 Correlations
Correlations
Salary Trust Intent 1 2 3 4 5
Salary
Pearson r 1
Sig. (2-tail)
N 148
Trust
Pearson r -,461**
1
Sig. (2-tail) ,000
N 148 148
Intent
Pearson r -,541**
,918**
1
Sig. (2-tail) ,000 ,000
N 148 148 148
1
Pearson r ,136 -,361**
-,353**
1
Sig. (2-tail) ,100 ,000 ,000
N 148 148 148 148
2
Pearson r -,008 -,206* -,207
* ,460
** 1
Sig. (2-tail) ,927 ,012 ,012 ,000
N 148 148 148 148 148
3
Pearson r ,214**
-,208* -,277
** ,361
** ,220
** 1
Sig. (2-tail) ,009 ,011 ,001 ,000 ,007
N 148 148 148 148 148 148
4
Pearson r -,079 ,071 ,095 -,244**
-,105 -,218**
1
Sig. (2-tail) ,343 ,392 ,251 ,003 ,204 ,008
N 148 148 148 148 148 148 148
5
Pearson r ,051 -,115 -,153 ,243**
,253**
,684**
-,263**
1
Sig. (2-tail) ,536 ,164 ,063 ,003 ,002 ,000 ,001
N 148 148 148 148 148 148 148 148
**. Correlation is significant at the 0.01 level (2-tailed).
*. Correlation is significant at the 0.05 level (2-tailed). 1. I think information about a director’s salary in a charity organization is important in my decision to donate
2. I would actively look for information regarding a director’s salary of a charity organization if I wanted to donate.
3. I think that directors in charity organizations should earn less than directors in for-profit organizations.
4. I think that charity organizations should pay their directors a lot, because this will guarantee proper leadership.
5.I think that directors in a charity organization should accept a lower salary then they could earn in a for-profit
organization, because they choose to work for charity.
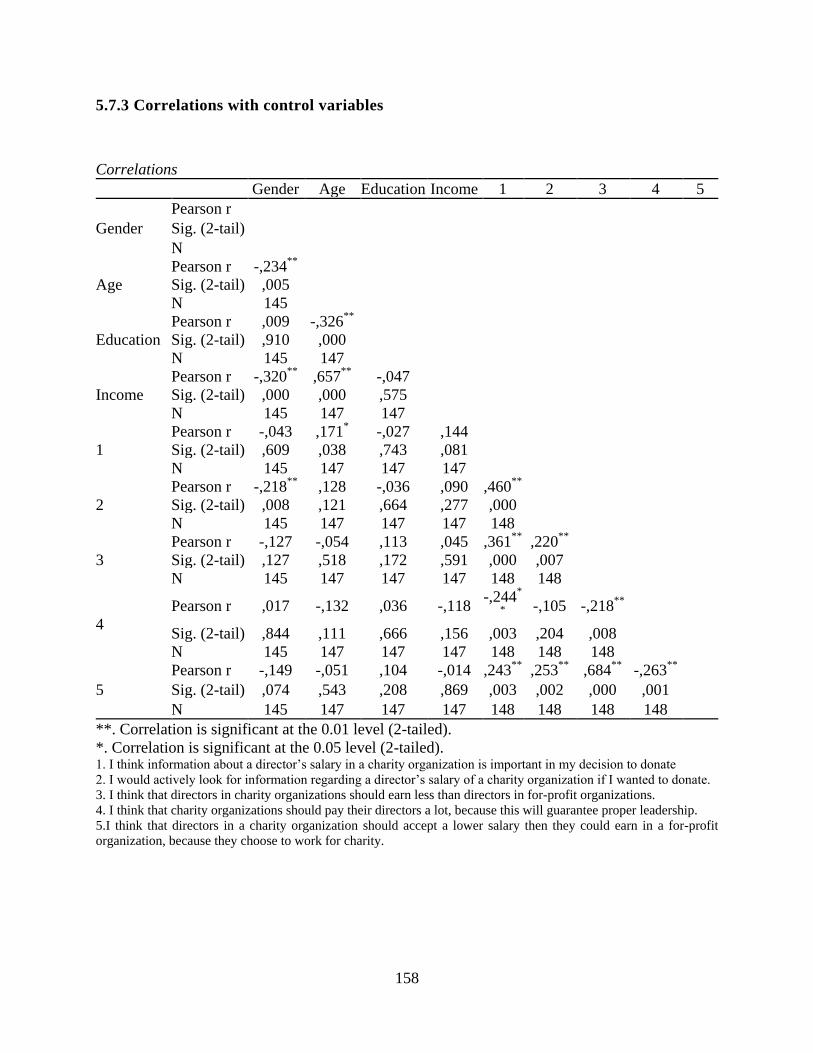
158
5.7.3 Correlations with control variables
Correlations
Gender Age Education Income 1 2 3 4 5
Gender
Pearson r
Sig. (2-tail)
N
Age
Pearson r -,234**
Sig. (2-tail) ,005
N 145
Education
Pearson r ,009 -,326**
Sig. (2-tail) ,910 ,000
N 145 147
Income
Pearson r -,320**
,657**
-,047
Sig. (2-tail) ,000 ,000 ,575
N 145 147 147
1
Pearson r -,043 ,171* -,027 ,144
Sig. (2-tail) ,609 ,038 ,743 ,081
N 145 147 147 147
2
Pearson r -,218**
,128 -,036 ,090 ,460**
Sig. (2-tail) ,008 ,121 ,664 ,277 ,000
N 145 147 147 147 148
3
Pearson r -,127 -,054 ,113 ,045 ,361**
,220**
Sig. (2-tail) ,127 ,518 ,172 ,591 ,000 ,007
N 145 147 147 147 148 148
4
Pearson r ,017 -,132 ,036 -,118 -,244
*
*
-,105 -,218**
Sig. (2-tail) ,844 ,111 ,666 ,156 ,003 ,204 ,008
N 145 147 147 147 148 148 148
5
Pearson r -,149 -,051 ,104 -,014 ,243**
,253**
,684**
-,263**
Sig. (2-tail) ,074 ,543 ,208 ,869 ,003 ,002 ,000 ,001
N 145 147 147 147 148 148 148 148
**. Correlation is significant at the 0.01 level (2-tailed).
*. Correlation is significant at the 0.05 level (2-tailed). 1. I think information about a director’s salary in a charity organization is important in my decision to donate
2. I would actively look for information regarding a director’s salary of a charity organization if I wanted to donate.
3. I think that directors in charity organizations should earn less than directors in for-profit organizations.
4. I think that charity organizations should pay their directors a lot, because this will guarantee proper leadership.
5.I think that directors in a charity organization should accept a lower salary then they could earn in a for-profit
organization, because they choose to work for charity.

159
5.7.4 Independent Sample T-test
Group Statistics
Salary N Mean Std. Deviation Std. Error Mean
Ik denk dat directeuren in
liefdadigheidsinstellingen
minder moeten verdienen
laag 39 4,56 1,789 ,286
hoog 109 5,37 1,561 ,150
Independent Samples Test
Levene's
Test
t-test for Equality of Means
F Sig. t df Sig.
(2-tail)
Mean
Differ
ence
Std. Error
Difference
95%
Confidence
Interval
Lower Upper
Minder
moeten
verdienen
Equal
variances
assumed
1,263 ,263 -2,650 146 ,009 -,803 ,303 -1,402 -,204
Equal
variances
not
assumed
-2,485 59,976 ,016 -,803 ,323 -1,449 -,157