
Supervised assessment: Acid and bases, and …€¢ explanation of simple processes and phenomena...
22
14364 Supervised assessment: Acid and bases, and equilibrium This sample demonstrates on-balance judgments within criteria. It provides information about student achievement where the indicative response matches the qualities of the A standards. Criteria assessed • Knowledge and conceptual understanding • Investigative processes • Evaluating and concluding Assessment instrument The response presented in this sample is in response to assessment items. The task is a supervised assessment on the topic of acids and bases, and equilibrium. Students have had the learning experiences of conducting titrations. Chemistry 2007 Annotated indicative response and judgments within criteria The school considers the objectives of the syllabus when designing the assessment items. The objectives, described as syllabus standards A–E, inform the design of the items and the allocation of marks. The matching of the standards with the items is demonstrated on the instrument-specific criteria and standards on pages 2 and 3, and throughout the indicative response starting on page 4. The item-specific marking scheme shows expected Standard A responses, and the marking scheme on pages 20 and 21 shows the match of marks to standard descriptors.
Transcript of Supervised assessment: Acid and bases, and …€¢ explanation of simple processes and phenomena...
1436
4
Supervised assessment: Acid and bases, and equilibrium This sample demonstrates on-balance judgments within criteria. It provides information about student achievement where the indicative response matches the qualities of the A standards.
Criteria assessed • Knowledge and conceptual understanding
• Investigative processes
• Evaluating and concluding
Assessment instrument The response presented in this sample is in response to assessment items.
The task is a supervised assessment on the topic of acids and bases, and equilibrium.
Students have had the learning experiences of conducting titrations.
Chemistry 2007 Annotated indicative response and judgments within criteria
The school considers the objectives of the syllabus when designing the assessment items. The objectives, described as syllabus standards A–E, inform the design of the items and the allocation of marks. The matching of the standards with the items is demonstrated on the instrument-specific criteria and standards on pages 2 and 3, and throughout the indicative response starting on page 4. The item-specific marking scheme shows expected Standard A responses, and the marking scheme on pages 20 and 21 shows the match of marks to standard descriptors.

Chemistry 2007 Annotated indicative response and judgments using marks within criteria
Queensland Curriculum & Assessment Authority July 2014
Page 2 of 22
Instrument-specific criteria and standards Standard A Standard B Standard C Standard D Standard E
Kno
wle
dge
and
conc
eptu
al u
nder
stan
ding
The student work has the following characteristics:
The student work has the following characteristics:
The student work has the following characteristics:
The student work has the following characteristics:
The student work has the following characteristics:
• reproduction and interpretation of complex and challenging concepts, theories and principles
• reproduction and interpretation of complex or challenging concepts, theories and principles
• reproduction of concepts, theories and principles
• reproduction of simple ideas and concepts
• reproduction of isolated facts
Q4
• comparison and explanation of complex concepts, processes and phenomena
• comparison and explanation of concepts, processes and phenomena
• explanation of simple processes and phenomena
• description of simple processes and phenomena
• recognition of isolated simple phenomena
Q6 Q3
• linking and application of algorithms, concepts, principles, theories and schema to find solutions in complex and challenging situations
• linking and application of algorithms, concepts, principles, theories and schema to find solutions in complex or challenging situations
• application of algorithms, principles, theories and schema to find solutions in simple situations
• application of algorithms, principles, theories and schema
• application of simple given algorithms
Q9 Q2, 8, 9 Q1, 5, 7, 9
Preliminary grade
boundaries 39–24 24–16 16–13 13–9 8–1
Note: Preliminary grade boundaries are determined based on the school’s experience with similar assessment instruments and the relative number of A, B and C marks available (see above). All grade boundaries must be confirmed once they have been applied to student responses and compared to syllabus standards.
Chemistry 2007 Annotated indicative response and judgments using marks within criteria
Queensland Curriculum & Assessment Authority July 2014
Page 3 of 22
Standard A Standard B Standard C Standard D Standard E
Investigative processes
The student work has the following characteristics:
The student work has the following characteristics:
The student work has the following characteristics:
The student work has the following characteristics:
The student work has the following characteristics:
• systematic analysis of secondary data to identify relationships between patterns and trends
• analysis of secondary data to identify patterns and trends
• analysis of secondary data to identify obvious patterns and trends
• identification of obvious patterns
• recording of data
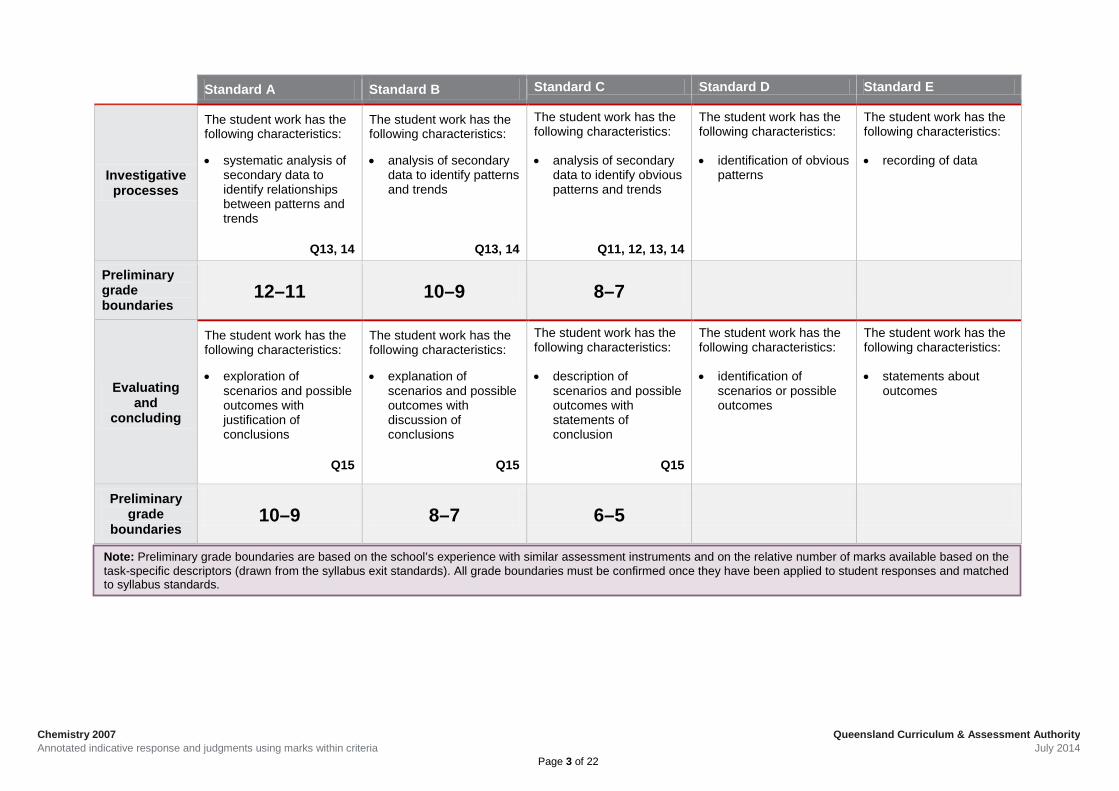
Q13, 14 Q13, 14 Q11, 12, 13, 14
Preliminary grade boundaries
12–11 10–9 8–7
Evaluating and
concluding
The student work has the following characteristics:
The student work has the following characteristics:
The student work has the following characteristics:
The student work has the following characteristics:
The student work has the following characteristics:
• exploration of scenarios and possible outcomes with justification of conclusions
• explanation of scenarios and possible outcomes with discussion of conclusions
• description of scenarios and possible outcomes with statements of conclusion
• identification of scenarios or possible outcomes
• statements about outcomes
Q15 Q15 Q15
Preliminary grade
boundaries 10–9 8–7 6–5
Note: Preliminary grade boundaries are based on the school’s experience with similar assessment instruments and on the relative number of marks available based on the task-specific descriptors (drawn from the syllabus exit standards). All grade boundaries must be confirmed once they have been applied to student responses and matched to syllabus standards.


Chemistry 2007 Annotated indicative response and judgments using marks within criteria
Queensland Curriculum & Assessment Authority July 2014
Page 5 of 22
Indicative response — Using marks Relevant exit standard descriptor
Question 1 (KCU C: 2 marks) Calculate the pH of the following solution [H+] = 1.0 x 10⁻⁶M. State whether it is acidic, basic or neutral. Expected response
[ ][ ]
6101log
log6
3
=×=
=−
+OHpH
The solution is below 7 which is neutral, so it is slightly acidic. Question 2 (KCU B: 3 marks) A solution has a pH of 12.68. Calculate the [H+] and [OH-]. Expected Response
[ ][ ]
[ ][ ][ ][ ]
M
OH
OH
OHH
H
H
pHpH
2
13
14
1413
14
13
68.12
10807.4
0487.010089.2
101
10110089.2
101
10089.2
10
10
68.12
−
−
−−
−−−
−−+
−
−+
−+
×=
=×
×=
×=××
×=
×=
=
=
=
Question 3 (KCU C: 1 mark) Which of the following lists includes all species present in a 1.0 mol L-1 solution of acetic acid CH COOH3 ? (a) CH COOH H O3 2, (b) H O CH COO3 3
+ −, (c) CH COOH CH COO H H O OH3 3 2, , , , − + − (d) CH COOH CH COO H H O3 3 2, , , − +
Marking scheme
application of algorithms and theories to find solutions in simple situations reproduction of a concept application of algorithms and theories to find solutions in a complex situation interpretation of a complex concept
Question 1 KCU: 2 marks C 1 mark for the algorithm and correct solution 1 mark for the statement regarding acidity Question 2 KCU: 2C marks 2B marks 1 mark for the definition of pH 1 mark for the calculation of [H+] 2 marks for the calculation of [OH-] Question 3 KCU: B 1 mark 1 mark for the correct response

Chemistry 2007 Annotated indicative response and judgments using marks within criteria
Queensland Curriculum & Assessment Authority July 2014
Page 6 of 22
Relevant exit standard descriptor
Question 4 (KCU C: 1 mark) Which of the following will determine whether an acid will be strong or weak? (a) its concentration (b) its ability to donate protons (c) its solubility in water (d) its pH Question 5 (KCU C: 4 marks)
Based on the pH values shown in the figure, which of the following statements about the concentration of hydrogen ions is correct?
(a) It is twice as great in milk as it is in lemon juice.
(b) It is 1 000 000 times greater in soap than in wine.
(c) It is three times greater in wine than in bleach solution.
(d) It is 1 000 times greater in distilled water than in soap.
Show reasoning that applies the concept of the pH scale to support your answer: Expected response The pH scale is a logarithmic scale. The hydrogen ion concentration at the positions indicated is: Milk [H+] = 10-6 Lemon juice [H+] = 10-3 The [H+] in lemon juice is 1000 times greater than in milk, so the statement is incorrect.
Soap [H+] = 10-10 Wine [H+] = 10-4 The [H+] in wine is 106 times greater than in soap, so the statement is incorrect.
Bleach solution [H+] = 10-12 Wine [H+] = 10-4 The [H+] in wine is 108 times greater than that in soap, so the statement is incorrect.
Distilled water [H+] = 10-7 Soap [H+] = 10-10 The [H+] in distilled water is 104 times greater than that in soap, so this so the statement in correct.
Marking scheme
reproduction of a concept application of algorithms and theories to find solutions in a simple situation
Question 4 KCU:1 mark C 1 mark for the correct response Question 5 KCU: 4 marks C 1 mark for each calculation and statement

Chemistry 2007 Annotated indicative response and judgments using marks within criteria
Queensland Curriculum & Assessment Authority July 2014
Page 7 of 22
Relevant exit standard descriptor
Question 6 (KCU B 3 marks) Write TWO chemical equations to show that the dihydrogen phosphate ion (H2PO4 -) is amphiprotic. Compare the equations to explain the term amphiprotic. Expected response A substance is amphiprotic if it acts like both an acid and a base. In the following equation a hydrogen ion is being donated, showing that the dihydrogen phosphate ion is acting as an acid.
(aq)_
4)()(42−+− +→ HPOHPOH aqaq
In the following equation a hydrogen ion is being accepted, showing that the dihydrogen phosphate ion is acting as a base.
(aq)43)()(42 POHHPOH aqaq →+ +− Question 7 (KCU C: 3 marks) A titration is carried out in which 0.40 mol L-1 potassium hydroxide (KOH) solution in a burette is titrated against 10.00mL of hydrochloric acid (HCl) solution. The volume of base required to reach the end point was 12.5mL. Write a balanced equation for this reaction then calculate the concentration of the hydrochloric acid solution. Show all working. Expected response
)(2)()()( aqaqaqaq OHKClHClKOH +→+
M
conc
concvolconcvolconc
5.001.0
0125.04.001.00125.04.0
2
2
2211
=
×=
×=××=×
Marking scheme
comparison and explanation of concepts application of algorithms and theories to find solutions in a simple situation
Question 6 KCU: 3 marks B 1 mark for explanation of the term amphiprotic 1 mark for writing each equation and explaining whether the H+ ion id donated or accepted Question 7 KCU: 3 marks C 1 mark for writing the correct chemical equation 1 mark for substitution into the equation 1 mark for the correct response

Chemistry 2007 Annotated indicative response and judgments using marks within criteria
Queensland Curriculum & Assessment Authority July 2014
Page 8 of 22
Relevant exit standard descriptor
Question 8 (KCU A: 4 marks)
Borax or sodium tetraborate decahydrate, Na2B4O7.10H2O, is a base which can easily be obtained in very pure form. (This salt dissociates to form anion, cation and 10H2O) It reacts with strong acids such as hydrochloric to form the extremely weak boric acid.
B4O72-
(aq) + 2 H+(aq) + 5 H2O(l) → 4 H3BO3 (aq)
Borax is frequently used as a primary standard in acid-base titrations.
In one particular experiment 7.738 g of borax was dissolved in water and made accurately to 250mL. 25 mL of this solution required 27.65 mL of a solution of hydrochloric acid for exact neutralization.
Calculate the concentrations of the borax and hydrochloric acid solutions.
Expected response ( ) ( )
LmolConcConc
volConcvolConcLmoles
litresinvolumemolesofnumber
boraxofionConcentrat
moles
boraxofMoles
boraxofweightMolecular
acid
acid
acidacidboraxborax
/18035.002765.0025.019947.0
/19947.025.0
0498.0
0498.017.155
738.717.155
93.11124.43799.15481.10
=×=××=×
=
=
=
=
=
=+=
×+×=
Marking scheme
linking and application of concepts, principles, theories and schema to find solutions in a complex and challenging situation
Question 8 KCU: 4 marks A This is a multi-step (i.e. complex) and unfamiliar (i.e. challenging) situation. 1 mark for the calculation of the molecular weight 1 mark for the calculation of the number of moles of borax 1 mark for the calculation of the concentration of borax 1 mark for the calculation of the concentration of the acid

Chemistry 2007 Annotated indicative response and judgments using marks within criteria
Queensland Curriculum & Assessment Authority July 2014
Page 9 of 22
Question 9 (KCU A: 10 marks) Most swimming pools use 'chlorine' as the sanitizing agent to kill bacteria and viruses. There are a variety of ways of generating the 'chlorine' in pool water. The most widely used method is the addition of hypochlorite compounds. The active chemical produced in each method is HOCl or hypochlorous acid, sometimes written as HClO. Once in the water, an equilibrium is established between the strong oxidant HOCl and the weaker OCl- ion.
1100.3 8)()(3)(2)( EqnxKOClOHOHHOCl aaqaqaqaq
−− =+⇔+ This equilibrium system is pH dependent and the following graph shows how the concentrations of HOCl and OCl- change with the pH.
The level of 'free chlorine' (ie; HOCl + OCl-) present in a pool is most commonly measured using a pool testing kit. This involves adding a special chemical to a water sample and checking if the colour produced shows that the amount of chlorine is in or outside of the accepted range. The amount of free chlorine can be determined more accurately by carrying out a redox titration reaction on a sample of pool water. The titration involves two simultaneous redox reactions as shown below:
322
222
)()(64)(2)(32
)(2)(2)()()()(
EqnIOSIOS
EqnOHIClHIOCl
aqaqaqaq
laqaqaqaqaq
−−−−−
−+−−
+⇒+
++⇒++
Marking scheme
Question 9 KCU 10 marks A This is a multi-step (i.e. complex) and unfamiliar (i.e. challenging) situation. 4 mark C 3 marks B 3 marks A

Chemistry 2007 Annotated indicative response and judgments using marks within criteria
Queensland Curriculum & Assessment Authority July 2014
Page 10 of 22
Relevant exit standard descriptor
A solution of known concentration of thiosulphate ions (S2O32-) is
reacted with a sample of pool water containing OCl- ions and when the reaction is complete the number of moles of OCl- can be calculated. Refer to the information on the previous page in answering the following questions: A Year 12 student invites some of her friends over for a pool party during schoolies week. The pool is regularly maintained by the student’s parents and so the pH level was at 7.5 and the 'free chlorine' at the recommended level of 2ppm (ie; [HOCl] + [OCl-] = 3.84 x 10⁻⁵M) before the students used the pool. After the party was over the student tested the water and found that the pH was 8.5 and the 'free chlorine' level was 0 – 0.5ppm. The student also collected a 100mL sample of the pool water to carry out a titration to check if the chlorine level was as low as indicated by the test kit. A volume of 38mL of 5.0 x 10⁻⁶M thiosulphate solution was found to react with the OCl- ions in the pool water sample. (a) Only OCl- is shown as reacting with thiosulphate ions in equations (1) & (2) for the titration. Explain how titrating for the OCl- ion only, enables the amount of 'free chlorine' to be determined and then show that the concentration of ‘free chlorine’ in the pool water is 9.5 x 10⁻⁶ mol/L. (b) Show that the ratio of [HOCl]: [OCl-] agrees with what is indicated in the graph when the pH is 8.5, and then determine the concentration of both HOCl and OCl- that are present.
Expected response (a) The overall equation that occurs during the titration is
422 )(64)(2)()(32)()( EqnOSOHClOSHOCl aqlaqaqaqaq−−−−−+− ++⇒++
where OCl-(aq) reacts with 2S2O3
2-(aq) in the ratio 1:2.
As the OCl-(aq) is used up in the reaction its concentration decreases in the pool water sample. However, OCl-(aq) is part of the equilibrium system
8)()(3)(2)( 100.3 −− =+⇔+ xKOClOHOHHOCl aaqaqaqaq
Decreasing the concentration of OCl-(aq) causes the system to oppose this change and so the reaction moves to the right producing more OCl-(aq) but decreasing the concentration of HOCl(aq). This continues until all of the HOCl(aq) is changed into OCl-
(aq). Thus the titration enables the determination of the concentration of OCl-(aq), which will be equal to the combined concentrations of OCl-(aq) and HOCl(aq) that were present in the pool water i.e. the ‘free’ chlorine concentration.
Marking scheme
reproduction and interpretation of complex and challenging concepts
1 mark for the combination of equation 2 and 3 into an overall equation 4 and stating the ratio 1 mark for the reference to equation 1 1 mark for the explanation of the free chlorine in the system

Chemistry 2007 Annotated indicative response and judgments using marks within criteria
Queensland Curriculum & Assessment Authority July 2014
Page 11 of 22
Relevant exit standard descriptor
( )
.9:1
11.0100.31016.3][
][][,
][][][,
100.3
1016.310][,5.89:1][:][,5.8)(
105.9100.0105.9][,
100.0100105.9
2109.1
2,
100.9106.8105.9
][105.9][106.8
11.1105.9][
105.9][11.1105.9][][11.0
][11.0][
11.091
][][
105.9][][105.95.8
2
109.138.0100.5
,
100.5][
38.038
,
8
93
3
)()(3)(2)(
8
95.83
6
7
6
6
32
7
66
6
6
6
6
6
6
632
6
632
632
32
toequivalentisThisKOH
OClHOClTherefore
HOClOClOHKTherefore
OClOHOHHOClHOClforK
MOHpHAtOClHOClthatindicatesgraphthepHWhenb
M
OClTherefore
mLmLwaterpoolofVolume
OSmolesofnumberOClmolesofnumberTherefore
M
OClHOClAndM
OCltherefore
OClOClOCl
ngSubstitutiOClHOCltherefore
graphthefromOClHOCl
OClHOClNowMispHationconcentratchlorinefreetheand
OClmolesofnumberOSmolesofNumber
titrationtheforequationtheFrommolesx
VolxConcOSmolesofnumbertherefore
MOSand
LmLOSofVolume
titrationactualtheIn
a
a
aqaqlaq
a
=××
==
=
+⇔+
×=
×===
==
×=
×=
==÷=
×=
=
×=
×−×=
−×=
×=
×=
×=
×=+
×=
==
×=+
×=
×=
×=
×=
=
×=
==
−
−+
−+
−+
−
−−+
−
−
−−
−
−
−−−
−
−−
−−
−
−−
−−
−−−
−
−
−−
−
−−−
−
−
−−
−−−
−−
Marking scheme
linking and application of algorithms and concepts to find solutions in a complex and challenging situation linking and application of concepts, principles, theories and schema to find solutions in a complex and challenging situation
1 mark for the calculation of the free chlorine 1 mark for substituting in equations 1 mark for the calculation of the [OCl-] 1 mark for the calculation of [HOCl] 1 mark for the calculation of the free chlorine 2 marks for the steps in showing that the graph ratio agrees with the calculations
Chemistry 2007 Annotated indicative response and judgments using marks within criteria
Queensland Curriculum & Assessment Authority July 2014
Page 12 of 22
Relevant exit standard descriptor
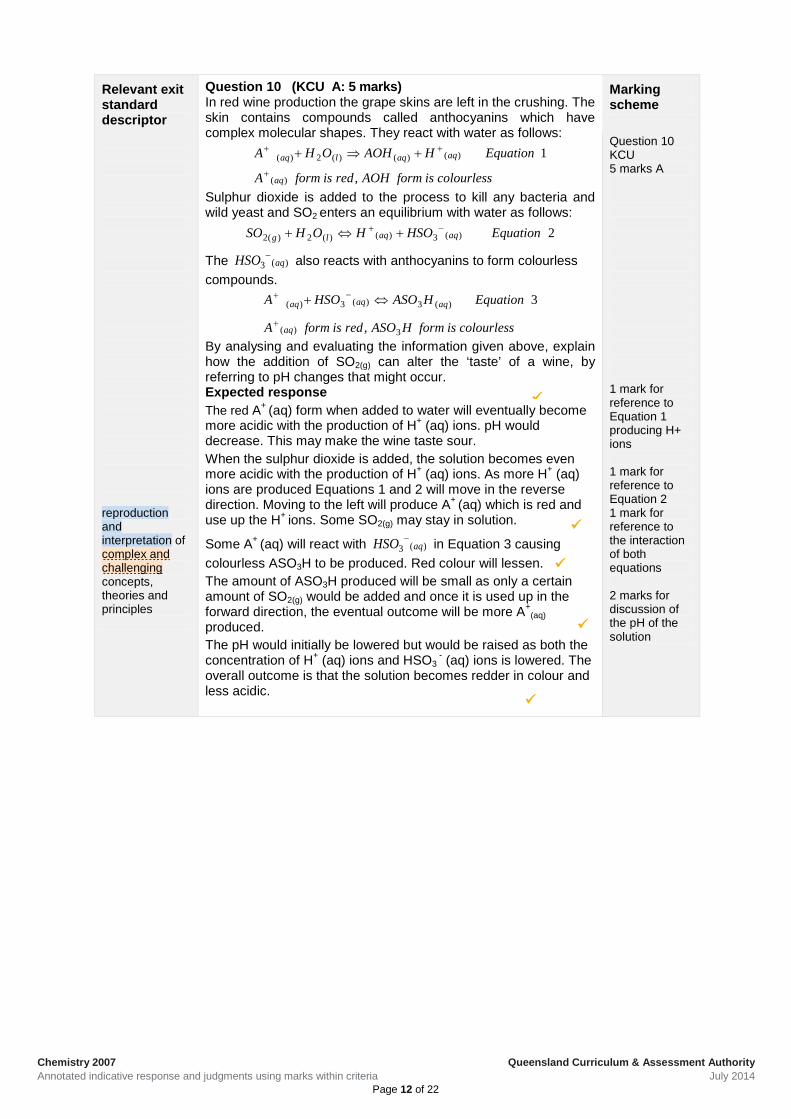
Question 10 (KCU A: 5 marks) In red wine production the grape skins are left in the crushing. The skin contains compounds called anthocyanins which have complex molecular shapes. They react with water as follows:
colourlessisformAOHredisformA
EquationHAOHOHA
aq
aqaqlaq
,
1
)(
)()()(2)(
+
++ +⇒+
Sulphur dioxide is added to the process to kill any bacteria and wild yeast and SO2 enters an equilibrium with water as follows:
2)(3)()(2)(2 EquationHSOHOHSO aqaqlg−+ +⇔+
The )(3 aqHSO − also reacts with anthocyanins to form colourless compounds.
colourlessisformHASOredisformA
EquationHASOHSOA
aq
aqaqaq
3)(
)(3)(3)(
,
3
+
−+ ⇔+
By analysing and evaluating the information given above, explain how the addition of SO2(g) can alter the ‘taste’ of a wine, by referring to pH changes that might occur. Expected response The red A+ (aq) form when added to water will eventually become more acidic with the production of H+ (aq) ions. pH would decrease. This may make the wine taste sour. When the sulphur dioxide is added, the solution becomes even more acidic with the production of H+ (aq) ions. As more H+ (aq) ions are produced Equations 1 and 2 will move in the reverse direction. Moving to the left will produce A+ (aq) which is red and use up the H+ ions. Some SO2(g) may stay in solution.
Some A+ (aq) will react with )(3 aqHSO − in Equation 3 causing colourless ASO3H to be produced. Red colour will lessen.
The amount of ASO3H produced will be small as only a certain amount of SO2(g) would be added and once it is used up in the forward direction, the eventual outcome will be more A+
(aq) produced.
The pH would initially be lowered but would be raised as both the concentration of H+ (aq) ions and HSO3
- (aq) ions is lowered. The overall outcome is that the solution becomes redder in colour and less acidic.
Marking scheme
reproduction and interpretation of complex and challenging concepts, theories and principles
Question 10 KCU 5 marks A 1 mark for reference to Equation 1 producing H+ ions 1 mark for reference to Equation 2 1 mark for reference to the interaction of both equations 2 marks for discussion of the pH of the solution

Chemistry 2007 Annotated indicative response and judgments using marks within criteria
Queensland Curriculum & Assessment Authority July 2014
Page 13 of 22
Relevant exit standard descriptor
The following table shows the colours of some indicators in acidic, alkaline and neutral solutions.
Indicator Colour in
acidic solution
Colour in alkaline solution
Colour in neutral solution
RB red blue purple
VR violet red red
RY red yellow orange
YB yellow blue blue
CR colourless red colourless
CB colourless blue colourless
Question 11 (IP C: 1 mark)
The leaves of certain cabbage plants are purple when boiled in pure water, red when “pickled” in vinegar and blue or green when boiled in water containing baking soda (an alkaline solution). Which one of the following statements could explain the observed effects?
The cabbage leaves contain A. RB B. VR C. RY D. YB Question 12 (IP C: 1 mark)
Equal amounts of an unknown liquid are poured into each of three test tubes. To the first test tube two drops of neutral indicator CR are added and the resulting solution is found to be colourless. To the second test tube two drops of neutral indicator CB are added and the resulting solution is found to be colourless. To the third test tube two drips of neutral indicator YB are added and the resulting solution is found to be blue. Which one to the following conclusions can be justified?
The unknown liquid is A. acidic B. alkaline C. neutral D. water
Marking scheme
analysis of secondary data to identify obvious patterns and trends analysis of secondary data to identify obvious patterns and trends
Question 10 IP C 1 mark 1 mark for the correct response Question 11 IP C 1 mark 1 mark for the correct response Question 12 IP C 1 mark 1 mark for the correct response

Chemistry 2007 Annotated indicative response and judgments using marks within criteria
Queensland Curriculum & Assessment Authority July 2014
Page 14 of 22
Relevant exit standard descriptor
Question 13 (IP A: 5 marks)
The following figure shows the curves for weak acid-strong base titrations for the titration of 50.0mL of 0.1.M HA of varying concentrations with 0.100M NaOH. The pKa values for HA are (a) 1, (b) 3, (c) 5, (d) 7, (e) 9, and (f) 11 respectively.
Systematically analyse the data to identify the relationships and/or trends of the curves and relate this to the pKa values of the acids. Relate acid (f) to another acid in your response.
Expected response
Line (a) has the lowest pH and pKa value of 1 and so is the strongest acid. Similarly, line (f) is the weakest acid as the pH and pKa value of 11 is highest.
All lines show a similar trend. As more NaOH is added the curve trend is upward towards the equivalence point. This occurs at the point where 50mL of NaOH has been added. The length of the curve at the equivalence point differs depending on the strength of the acid. As the acid becomes weaker this part of the line becomes shorter because there is not so much change in pH at this point.
As the acid becomes weaker, the initial part of the curve takes longer to show a change in pH. For example, there is difference in the first part of the curve in going from acid (c) to acid (d). This trend continues as the acids become weaker. As the acids become weaker i.e. in going from (a) to (f) the curve straightens out and the equivalence point is missing when pKa is 11 or the Ka is 10–11. This would not be seen by an indicator.
Marking scheme
systematic analysis of secondary data to identify relationships between patterns and trends
Question 13 IP A 5 marks

Chemistry 2007 Annotated indicative response and judgments using marks within criteria
Queensland Curriculum & Assessment Authority July 2014
Page 15 of 22
Item-specific marking scheme
Standard Marks Description of response
A 5 Systematic analysis of secondary data to identify relationship between patterns, e.g. • The equivalence point occurs at different pHs for the various strength
acids. • The weaker the acid the higher the pH at the equivalence point. • The equivalence point for the acid solution with pKa=11 is not detectable
and would not be seen by an indicator.
B 4 Analysing data to identify pattern, e.g. • The length of the lines varies at the equivalence point i.e. at the point
when 50mL of NaOH is added. • This is related to the strength of the acid.
C 3 Analysing data to identify an obvious pattern, e.g. • Graphs have similar slopes. • Equivalence point occurs when 50 mL of NaOH has been added..
D 2 Identifying obvious patterns, e.g. • Graphs have the same general shape.
E 1 Recording data, e.g. • Records the fact that each line represents acids with different pKa values.
Note: This shows an expected A standard response. Marks will also be awarded for alternative responses using valid analytical approaches. Responses will be marked using the table below. It is assumed that any response will contain information recorded in the table for the standard below it.

Chemistry 2007 Annotated indicative response and judgments using marks within criteria
Queensland Curriculum & Assessment Authority July 2014
Page 16 of 22
Question 14 (IP A: 5 marks)
The following diagrams and information relate to the titration of phosphoric acid and sodium hydroxide.
Figure 1: Relative fractions against pH
Figure 2: Titration of 50mL of 0.1M H3PO4 with 0.1M NaOH
Phosphoric acid, H3PO4(aq), is a polyprotic acid where the dissociation occurs stepwise as shown below.
1)()(42)(43 EquationHPOHPOH aqaqaq+− +⇔
2)()(4)(42 EquationHHPOPOH aqaqaq+−−− +⇔
3)()(4)(4 EquationHPOHPO aqaqaq+−−−− +⇔
Marking scheme Question 14 IP: 5 marks This question involves several items of data and requires a system by the student to analyse
1st equivalence point
2nd equivalence point
3rd equivalence point
Chemistry 2007 Annotated indicative response and judgments using marks within criteria
Queensland Curriculum & Assessment Authority July 2014
Page 17 of 22
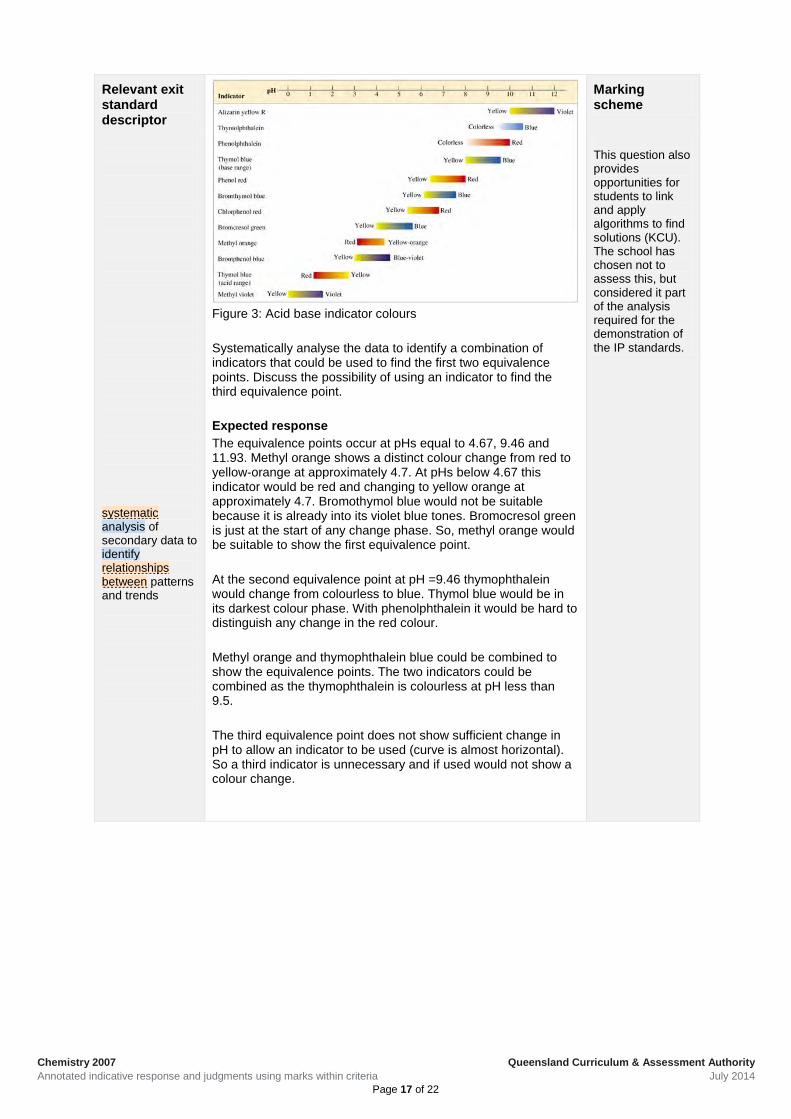
Relevant exit standard descriptor
Figure 3: Acid base indicator colours Systematically analyse the data to identify a combination of indicators that could be used to find the first two equivalence points. Discuss the possibility of using an indicator to find the third equivalence point. Expected response The equivalence points occur at pHs equal to 4.67, 9.46 and 11.93. Methyl orange shows a distinct colour change from red to yellow-orange at approximately 4.7. At pHs below 4.67 this indicator would be red and changing to yellow orange at approximately 4.7. Bromothymol blue would not be suitable because it is already into its violet blue tones. Bromocresol green is just at the start of any change phase. So, methyl orange would be suitable to show the first equivalence point. At the second equivalence point at pH =9.46 thymophthalein would change from colourless to blue. Thymol blue would be in its darkest colour phase. With phenolphthalein it would be hard to distinguish any change in the red colour. Methyl orange and thymophthalein blue could be combined to show the equivalence points. The two indicators could be combined as the thymophthalein is colourless at pH less than 9.5. The third equivalence point does not show sufficient change in pH to allow an indicator to be used (curve is almost horizontal). So a third indicator is unnecessary and if used would not show a colour change.
Marking scheme
systematic analysis of secondary data to identify relationships between patterns and trends
This question also provides opportunities for students to link and apply algorithms to find solutions (KCU). The school has chosen not to assess this, but considered it part of the analysis required for the demonstration of the IP standards.
Chemistry 2007 Annotated indicative response and judgments using marks within criteria
Queensland Curriculum & Assessment Authority July 2014
Page 18 of 22
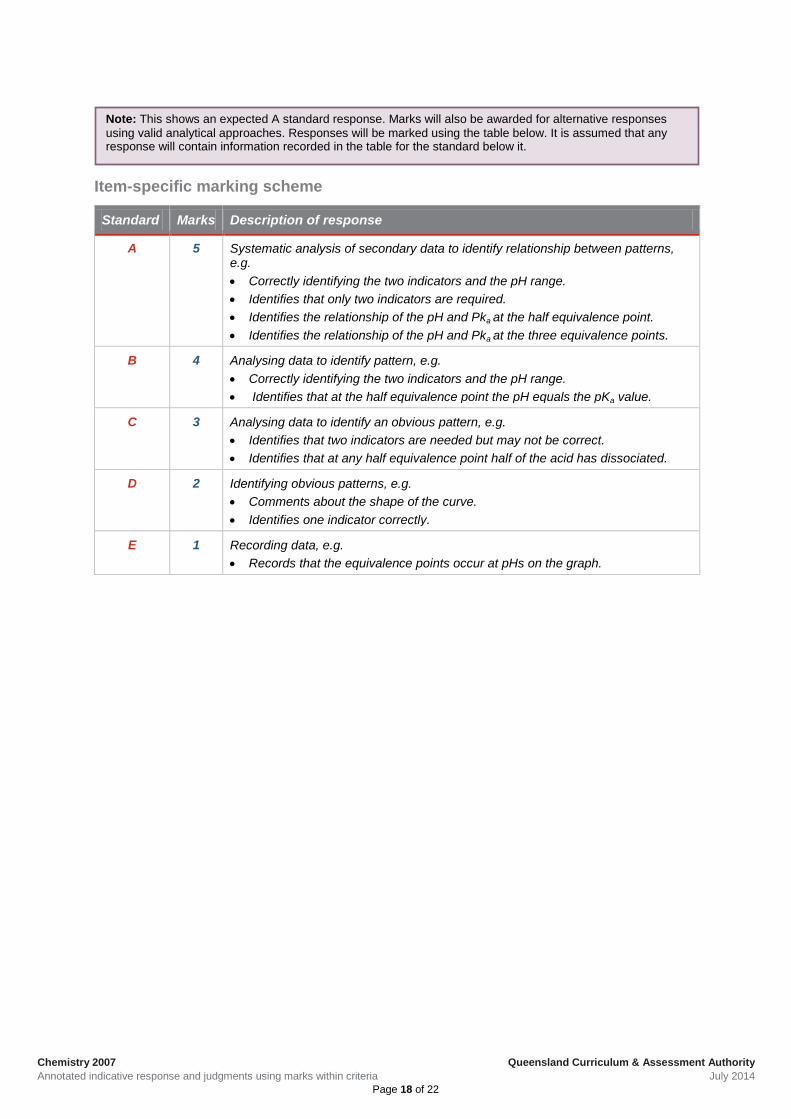
Item-specific marking scheme
Standard Marks Description of response
A 5 Systematic analysis of secondary data to identify relationship between patterns, e.g. • Correctly identifying the two indicators and the pH range. • Identifies that only two indicators are required. • Identifies the relationship of the pH and Pka at the half equivalence point. • Identifies the relationship of the pH and Pka at the three equivalence points.
B 4 Analysing data to identify pattern, e.g. • Correctly identifying the two indicators and the pH range. • Identifies that at the half equivalence point the pH equals the pKa value.
C 3 Analysing data to identify an obvious pattern, e.g. • Identifies that two indicators are needed but may not be correct. • Identifies that at any half equivalence point half of the acid has dissociated.
D 2 Identifying obvious patterns, e.g. • Comments about the shape of the curve. • Identifies one indicator correctly.
E 1 Recording data, e.g. • Records that the equivalence points occur at pHs on the graph.
Note: This shows an expected A standard response. Marks will also be awarded for alternative responses using valid analytical approaches. Responses will be marked using the table below. It is assumed that any response will contain information recorded in the table for the standard below it.

Chemistry 2007 Annotated indicative response and judgments using marks within criteria
Queensland Curriculum & Assessment Authority July 2014
Page 19 of 22
Relevant exit standard descriptor
Question 15 (EC A: 5 marks) The legal limit of tin contamination in canned fruit is 250 ppm (parts per million). A pawpaw canning plant in northern Queensland encountered a sudden, unexpected tin contamination problem. The reaction involving the contamination has been suggested to be:
)(2)()(4)()()(3 34104 laqaqaqsaq OHSnNHHSnNO ++⇒++ ++++− A comprehensive investigation was conducted on different batches of pawpaw of varying acidity. Pawpaws vary in acidity due to the conditions when picked. Nitrate concentrations may vary due to the amount of nitrate in the soil as the plant grows. Nitrate ion concentrations in the investigation were 10ppm and 40ppm. The results are summarised in the graphs below:
Could the contamination problem be rectified by adjusting the pH? Explore different possibilities and justify a recommendation.
Marking scheme
Question 15 EC 5 marks A

Chemistry 2007 Annotated indicative response and judgments using marks within criteria
Queensland Curriculum & Assessment Authority July 2014
Page 20 of 22
Relevant exit standard descriptor
Expected response Nitrates are present in fruit due to the natural uptake by plants of nitrates from the soil. All nitrate compounds are soluble. Nitrates in fertilisers are absorbed by plants and so if a plant has been subjected to excessive fertilisers the concentration in the fruit will be higher than normal. The nitrate ion is a strong oxidising agent and when present in sufficient quantities will cause the corrosion of the tin can. The equation suggests that any nitrate (NO3 -) present combines with the tin Sn(s) to form tin ions Sn2+(aq) in acidic solution i.e. when H+ ions are present. Even after one week of storage the cans at 40ppm nitrate are starting to show an increase in tin contamination. At the lower level of nitrates at 10 ppm, the limit of 250ppm of Sn2+(aq) is not reached for any of the pH readings. At the lower nitrate concentration of 10ppm, the graph shows there is an initial increase in Sn++ ions for pHs of 3.5, 3.8 and 4.2. The pH level remains the same for pH of 4.8. If the nitrate concentration is at 40ppm then the contamination occurs i.e. Sn2+(aq) ions are formed. This means that there are sufficient nitrate ions and hydrogen ions to cause the reaction to move to the right. At the higher level of nitrate at 40 ppm the limit is reached only for pH levels at 3.8 or lower. The equation shows that as the nitrate concentration is raised the reaction is moved to the right producing more Sn2+(aq) ions. As the reaction moves to the right, more H+(aq) ions are used up raising the pH. The pH during the time of testing was not recorded. Once the can is sealed, it is imposible to adjust the pH inside the can. The pH and the nitrate level of the actual fruit needs to be taken into account before canning. Fruit of a very low initial pH e.g.3.8 or lower should not be used or could have sugar added to lessen the acidity. It is unclear whether or not the curves will continue to increase for longer storage periods.It would seem unlikely as the curves seem to be levelling off as the H+ ions are used up. Further investigations could be carried out to see if the pH of the fruit changes over the same or longer storage periods. The pH is that of the fruit when picked.
exploration of scenarios and possible recommendations justification of recommendations
Item-specific marking scheme
Standard Mark Description of response
A 5 Exploration of the scenario and justification of a recommendation • Explores the necessary conditions for the reaction to proceed.
• Explores the two graphs.
B 4 Explanation of the scenario • Explains the differences in the two sets of graphs.
C 3 Description of a scenario and statements made • Describes the differences in the two sets of graphs.
D 2 Identification of a scenario • Compares the two sets of graphs.
E 1 Statements about outcomes • Statements about the graphs.
Note: This shows an expected A standard response. Marks will also be awarded for alternative responses using valid analytical approaches. Responses will be marked using the table below. It is assumed that any response will contain information recorded in the table for the standard below it.
Chemistry 2007 Annotated indicative response and judgments using marks within criteria
Queensland Curriculum & Assessment Authority July 2014
Page 21 of 22
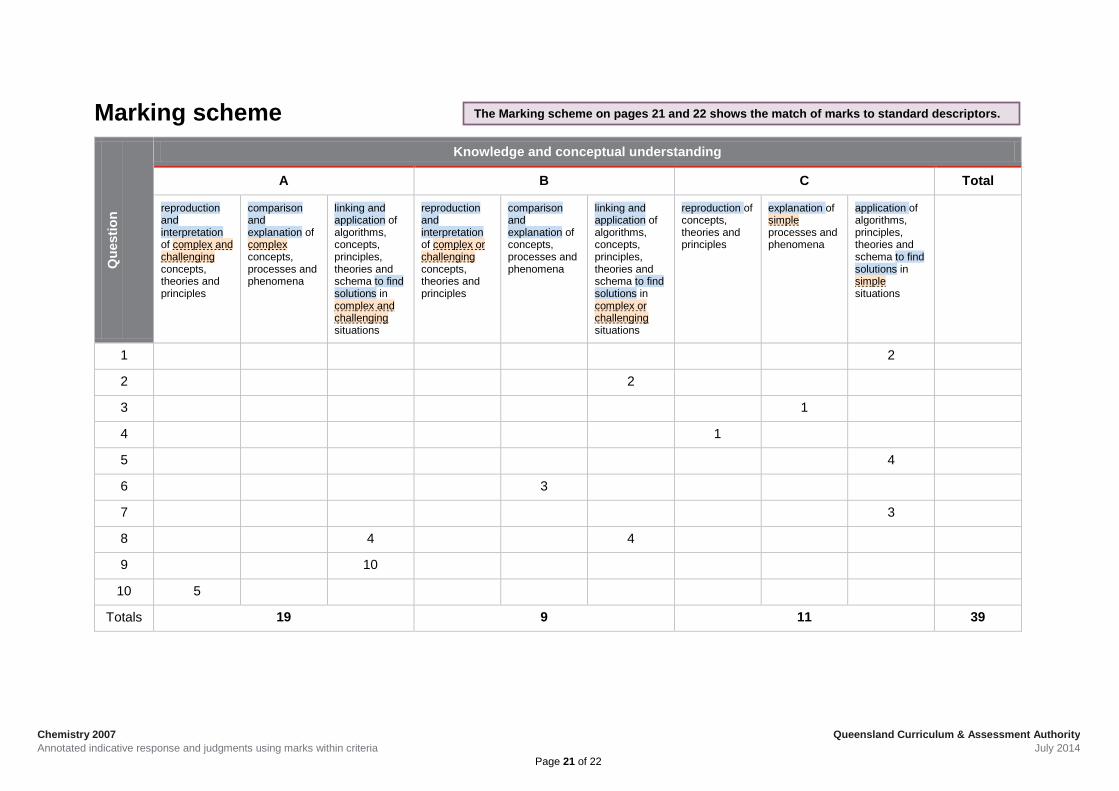
Marking scheme Q
uest
ion
Knowledge and conceptual understanding
A B C Total
reproduction and interpretation of complex and challenging concepts, theories and principles
comparison and explanation of complex concepts, processes and phenomena
linking and application of algorithms, concepts, principles, theories and schema to find solutions in complex and challenging situations
reproduction and interpretation of complex or challenging concepts, theories and principles
comparison and explanation of concepts, processes and phenomena
linking and application of algorithms, concepts, principles, theories and schema to find solutions in complex or challenging situations
reproduction of concepts, theories and principles
explanation of simple processes and phenomena
application of algorithms, principles, theories and schema to find solutions in simple situations
1 2
2 2
3 1
4 1
5 4
6 3
7 3
8 4 4
9 10
10 5
Totals 19 9 11 39
The Marking scheme on pages 21 and 22 shows the match of marks to standard descriptors.

Chemistry 2007 Annotated indicative response and judgments using marks within criteria
Queensland Curriculum & Assessment Authority July 2014
Page 22 of 22
Investigative processes
A B C
Question systematic analysis of secondary data to identify relationships between patterns and
trends
analysis of secondary data to identify patterns and trends analysis of secondary data to identify obvious patterns and trends
11 1
12 1
13 5
14 5
IP totals 10 2 12
Evaluating and concluding
A B C
exploration of scenarios and possible outcomes with justification of conclusions
explanation of scenarios and possible outcomes with discussion of conclusions
description of scenarios and possible outcomes with statements of conclusion
15 5
EC totals 5 5


