Superstorm Sandy: Lessons Learned and the Changing Landscape of the Homeowners and Commercial...
17
Superstorm Sandy: Lessons Learned and the Changing Landscape of the Homeowners and Commercial Insurance Markets The Insurance Council of New Jersey (ICNJ) 36 th Annual Meeting & Conference The Hamilton Manor, Hamilton, New Jersey Friday, October 18, 2013 Jeanne M. Salvatore, SVP, Public Affairs Insurance Information Institute 110 William Street New York, NY 10038 Tel: 212.346.5520 Fax: (212) 732-1916 [email protected]
-
Upload
virginia-reynolds -
Category
Documents
-
view
218 -
download
0
Transcript of Superstorm Sandy: Lessons Learned and the Changing Landscape of the Homeowners and Commercial...
Superstorm Sandy: Lessons Learned and the Changing Landscape of
the Homeowners and Commercial Insurance Markets
The Insurance Council of New Jersey (ICNJ)36th Annual Meeting & Conference
The Hamilton Manor, Hamilton, New JerseyFriday, October 18, 2013
Jeanne M. Salvatore, SVP, Public Affairs Insurance Information Institute 110 William Street New York, NY 10038
Tel: 212.346.5520 Fax: (212) 732-1916 [email protected] www.iii.org

Presentation Outline
1. Economic Overview of Sandy
2. New Jersey-Specific Hurricane Losses
3. Lessons Learned from Sandy
4. Media News Cycle and Current Media Environment
5. Key I.I.I. Consumer Resources
2
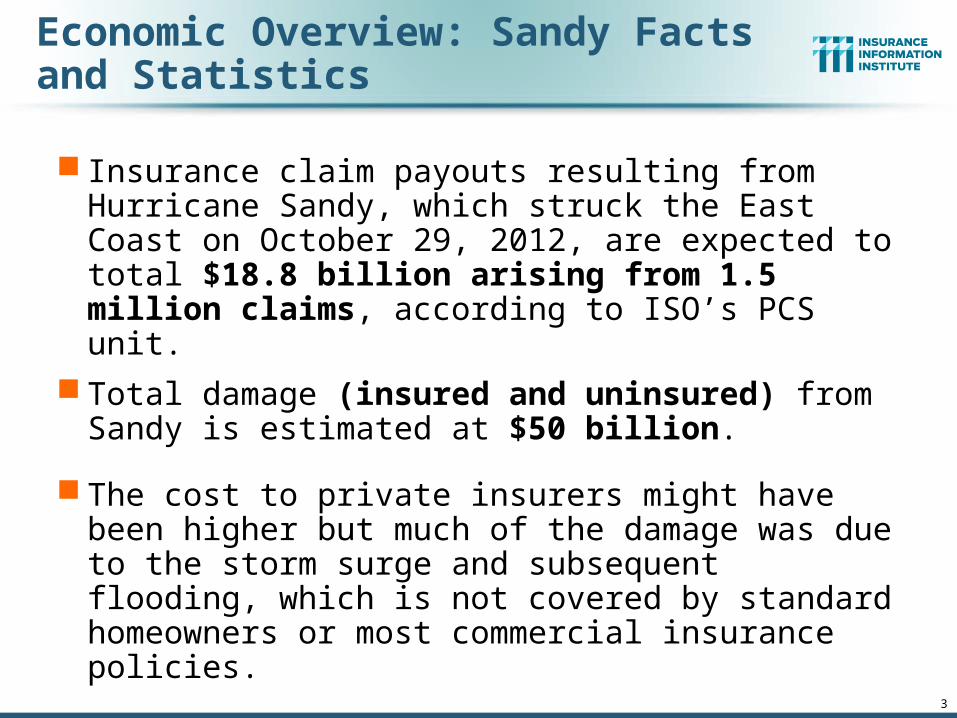
Economic Overview: Sandy Facts and Statistics
Insurance claim payouts resulting from Hurricane Sandy, which struck the East Coast on October 29, 2012, are expected to total $18.8 billion arising from 1.5 million claims, according to ISO’s PCS unit.
Total damage (insured and uninsured) from Sandy is estimated at $50 billion.
The cost to private insurers might have been higher but much of the damage was due to the storm surge and subsequent flooding, which is not covered by standard homeowners or most commercial insurance policies.
3
4
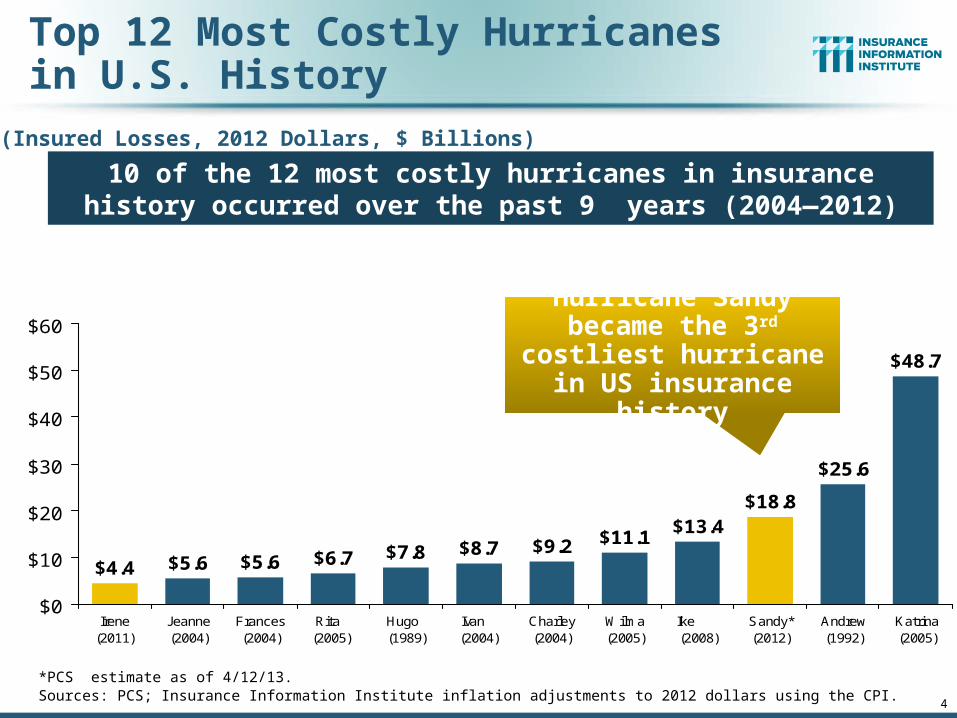
Top 12 Most Costly Hurricanesin U.S. History
(Insured Losses, 2012 Dollars, $ Billions)
*PCS estimate as of 4/12/13.Sources: PCS; Insurance Information Institute inflation adjustments to 2012 dollars using the CPI.
$9.2 $11.1$13.4
$18.8
$25.6
$48.7
$8.7$7.8$6.7$5.6$5.6$4.4
$0
$10
$20
$30
$40
$50
$60
Irene(2011)
Jeanne(2004)
Frances(2004)
Rita (2005)
Hugo (1989)
Ivan (2004)
Charley(2004)
Wilma(2005)
Ike (2008)
Sandy*(2012)
Andrew(1992)
Katrina(2005)
Hurricane Sandy became the 3rd
costliest hurricane in US insurance history
10 of the 12 most costly hurricanes in insurance history occurred over the past 9 years (2004—2012)

Hurricane Sandy: Claim Payments to Policyholders, by State
$9,600
$6,300
$700 $500 $410 $295 $292 $210 $103 $84 $57 $55 $37 $36 $13$58$0
$2,000
$4,000
$6,000
$8,000
$10,000
$12,000
NY NJ PA CT MD VA OH MA RI DE WV NC NH DC ME VT
5
At $9.6B and $6.3B, respectively, NY and NJ suffered, by far, the largest losses
from Hurricane Sandy
TOTAL = $18.75 BILLION($ Thousands)
Sources: Catastrophe loss data is for Catastrophe Serial No. 90 (Oct. 28 – 31, 2012) from PCS as of Jan. 18, 2013; Insurance Information Institute .

Auto, 250,500 ,
16%
Commercial, 202,500 ,
13%
Homeowner, 1,067,000 ,
71%
Hurricane Sandy resulted in an estimated 1.52 million privately insured claims resulting in an
estimated $18.75 insured losses.
Hurricane Katrina produced 1.74
million claims and $48.7B in losses
(in 2012 $)
Hurricane Sandy: Number of Claims by Type*
*PCS claim count estimate s as of 1/18/13. Loss estimate represents PCS total ($18.75B) and upper end of range estimates by risk modelers RMS, Eqecat and AIR. All figures exclude losses paid by the NFIP.Source: PCS; AIR, Eqecat, AIR Worldwide; Insurance Information Institute. 6
Sandy is a high HO frequency, (relatively low)
severity event (avg. severity <50% Katrina)
Total Claims = 1.52 Million*

Auto, $2,729 , 15%
Commercial, $9,024 ,
48%
Homeowner, $6,997 ,
37%
Although Commercial Lines
accounted for only 13% of total
claims, they account for 48%
of all claim dollars paid. In most hurricanes,
Commercial Lines accounts for about 1/3 of
insured losses.
Hurricane Sandy: Insured Loss byClaim Type* ($ Millions)
*PCS insured loss estimates as of 1/18/13. Catastrophe modeler estimates range up to $25 billion. All figures exclude losses paid by the NFIP.Source: PCS; Insurance Information Institute. 7
Total Claim Value = $18.75 Billion*

8
Total Potential Home Value Exposure to Storm Surge Risk in 2013*
($ Billions)
*Insured and uninsured property. Based on estimated property values as of April 2013.Source: Storm Surge Report 2013, CoreLogic.
$65.2$51.0$50.3
$35.0$22.4$20.5
$15.9$10.4$7.2$4.7$3.1$2.7$2.6$0.6
$65.6$72.0$78.0
$118.8$135.0
$386.5
$0 $50 $100 $150 $200 $250 $300 $350 $400 $450
FloridaNew York
New JerseyVirginia
LouisianaS. CarolinaN. Carolina
TexasMassachusetts
ConnecticutMarylandGeorgia
DelawareMississippi
Rhode IslandAlabama
MaineNew H.
PennsylvaniaDC
The Value of Homes Exposed to Storm Surge was $1.147 Trillion in 2013.* Only a fraction of
this is insured, hence the huge demand for federal aid following major coastal flooding
events.
NJ is the 3rd most vulnerable state to
storm surge

New Jersey Hurricane Losses
Private insurance losses in New Jersey from Sandy totaled $6.3 billion, second only to New York’s $9.6 billion, according to ISO.
New Jersey was one of 14 states impacted by Hurricane Irene in August, 2011. Irene caused a total of $4.3 billion in insured property damage, not including flood losses covered under NFIP, according to ISO. The NFIP puts its claims payouts from Irene at $1.3 billion (in all states).
Two of the costliest hurricanes to hit the U.S., based on insured property losses, caused damage in New Jersey: Hurricane Ivan in 2004 and Hurricane Sandy in 2012.
There were 230,708 flood insurance policies in force in New Jersey as of September 30, 2011, unchanged from the previous year.
9

Two of the Top Ten Most Costly Hurricanes Hit NJ – Sandy and Ivan
10
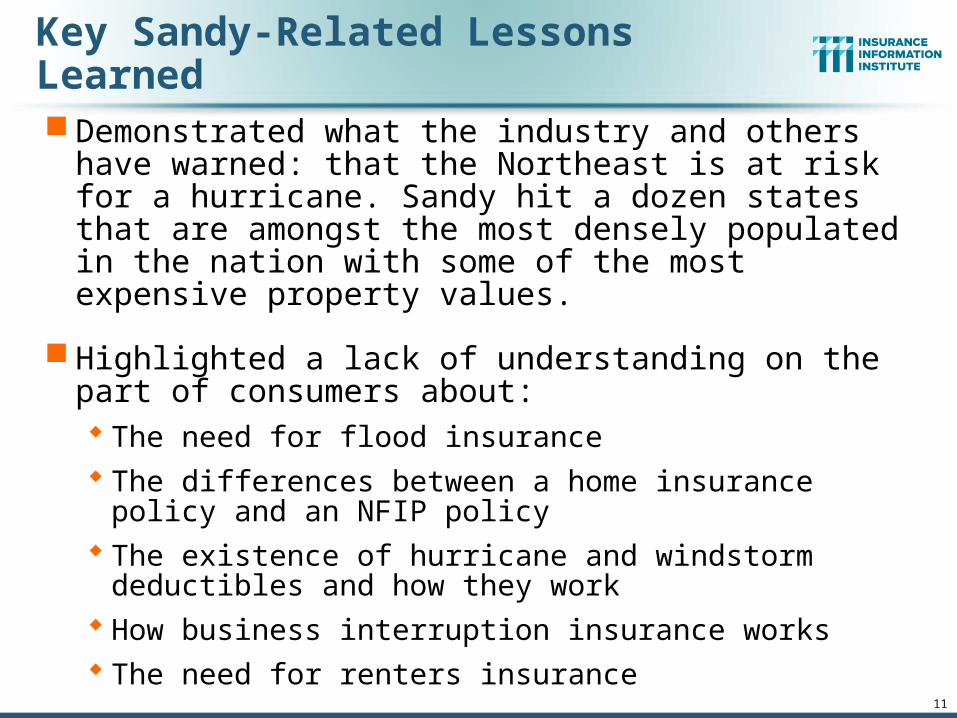
Key Sandy-Related Lessons Learned
Demonstrated what the industry and others have warned: that the Northeast is at risk for a hurricane. Sandy hit a dozen states that are amongst the most densely populated in the nation with some of the most expensive property values.
Highlighted a lack of understanding on the part of consumers about: The need for flood insurance The differences between a home insurance policy and an
NFIP policy The existence of hurricane and windstorm deductibles and
how they work How business interruption insurance works The need for renters insurance
11
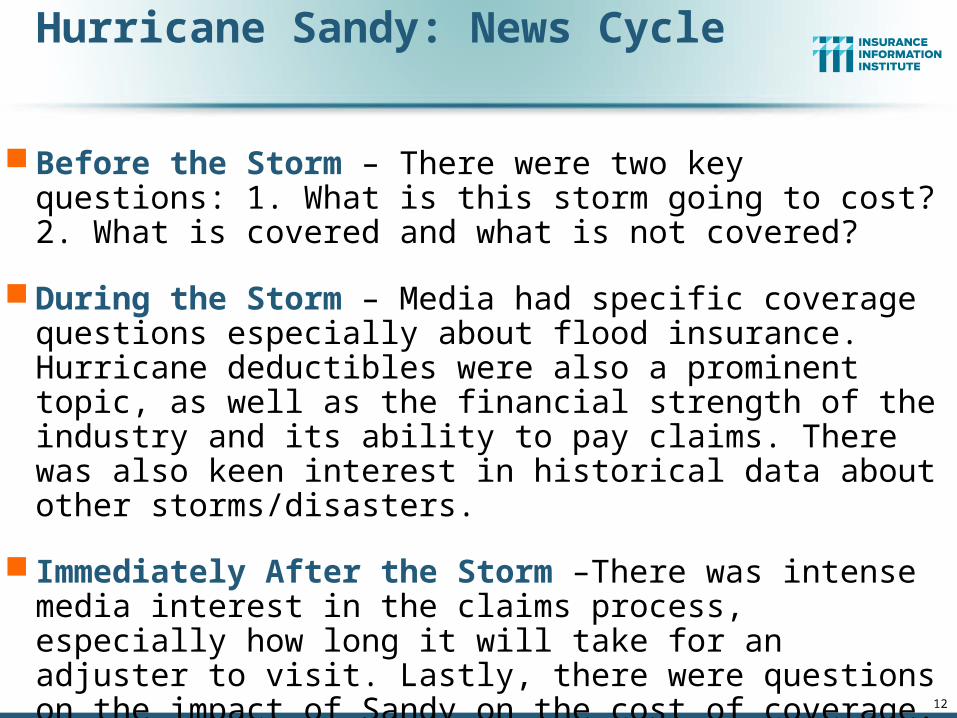
Hurricane Sandy: News Cycle
Before the Storm – There were two key questions: 1. What is this storm going to cost? 2. What is covered and what is not covered?
During the Storm – Media had specific coverage questions especially about flood insurance. Hurricane deductibles were also a prominent topic, as well as the financial strength of the industry and its ability to pay claims. There was also keen interest in historical data about other storms/disasters.
Immediately After the Storm –There was intense media interest in the claims process, especially how long it will take for an adjuster to visit. Lastly, there were questions on the impact of Sandy on the cost of coverage.
12

Current Media Environment
Media interest has died down considerably.
The one year anniversary has created renewed interested in both consumer education about insurance and disaster preparedness.
The negative insurance stories are focused on claim disputes mostly related to flood insurance. Many negative news reports are focused on the human drama and don’t explain the difference between private home and business insurance claims and versus those of the NFIP.
A major focus on the increasing cost of NFIP flood insurance.
Lastly, media is focused on broad public policy issues that the storm has raised. Private insurance is generally not part of this discussion.
13

I.I.I. Toolkit – Sharing and Distribution
14
The I’s on Insurance: Your Homeowners Coverage
15
http://www2.iii.org/video/the-i-on-insurance-your-homeowners-coverage.html

FEMA Videos
Jeanne Salvatore, Reducing Insurance Cost
Jeanne Salvatore, Biggert Waters 2012 Overview for Agents
Jeanne Salvatore, Elevation Ratings
Jeanne Salvatore, Managing Flood Risks
Jeanne Salvatore, Moving Away From Subsidized Rates Part 1
Jeanne Salvatore, Moving Away From Subsidized Rates Part 2
Robert Hartwig, Protecting Your Home with Flood Insurance
Robert Hartwig, Understanding Your Flood Policy

www.iii.org
Thank you for your timeand your attention!
Insurance Information Institute
http://twitter.com/JeanneSalvatore