Superstition, Conspicuous Spending, and Housing Markets…ftp.iza.org/dp9899.pdf · and Housing...
37
Forschungsinstitut zur Zukunft der Arbeit Institute for the Study of Labor DISCUSSION PAPER SERIES Superstition, Conspicuous Spending, and Housing Markets: Evidence from Singapore IZA DP No. 9899 April 2016 Sumit Agarwal Jia He Haoming Liu I.P.L. Png Tien Foo Sing Wei-Kang Wong
Transcript of Superstition, Conspicuous Spending, and Housing Markets…ftp.iza.org/dp9899.pdf · and Housing...

Forschungsinstitut zur Zukunft der ArbeitInstitute for the Study of Labor
DI
SC
US
SI
ON
P
AP
ER
S
ER
IE
S
Superstition, Conspicuous Spending, andHousing Markets: Evidence from Singapore
IZA DP No. 9899
April 2016
Sumit AgarwalJia HeHaoming LiuI.P.L. Png
Tien Foo SingWei-Kang Wong
Superstition, Conspicuous Spending, and Housing Markets:
Evidence from Singapore
Sumit Agarwal National University of Singapore
Jia He
National University of Singapore
Haoming Liu
National University of Singapore and IZA
I.P.L. Png National University of Singapore
Tien Foo Sing
National University of Singapore
Wei-Kang Wong
National University of Singapore
Discussion Paper No. 9899 April 2016
IZA
P.O. Box 7240 53072 Bonn
Germany
Phone: +49-228-3894-0 Fax: +49-228-3894-180
E-mail: [email protected]
Any opinions expressed here are those of the author(s) and not those of IZA. Research published in this series may include views on policy, but the institute itself takes no institutional policy positions. The IZA research network is committed to the IZA Guiding Principles of Research Integrity. The Institute for the Study of Labor (IZA) in Bonn is a local and virtual international research center and a place of communication between science, politics and business. IZA is an independent nonprofit organization supported by Deutsche Post Foundation. The center is associated with the University of Bonn and offers a stimulating research environment through its international network, workshops and conferences, data service, project support, research visits and doctoral program. IZA engages in (i) original and internationally competitive research in all fields of labor economics, (ii) development of policy concepts, and (iii) dissemination of research results and concepts to the interested public. IZA Discussion Papers often represent preliminary work and are circulated to encourage discussion. Citation of such a paper should account for its provisional character. A revised version may be available directly from the author.

IZA Discussion Paper No. 9899 April 2016
ABSTRACT
Superstition, Conspicuous Spending, and Housing Markets:
Evidence from Singapore*
For most people, buying a home is their single largest financial commitment. Previous research shows that Chinese buyers pay less for homes with unlucky addresses and more for homes with lucky addresses. Using Singapore data on housing transactions combined with a plethora of individual buyer characteristics including ethnicity, age, nationality, education, and employment, we study the source of these preferences. We find evidence that buyers are heterogeneous. Consistent with superstition, older people, those who suffered from more traffic accidents, and people buying new apartments have stronger preference for lucky addresses, while people with Western names and senior public-sector employees have weaker preference. Consistent with conspicuous spending, people with Western names, senior public-sector employees, and people buying in luxury districts have weaker preference for lucky addresses. JEL Classification: D1, R3, Z1 Keywords: superstition, conspicuous spending, real estate, prices, behavioral economics Corresponding author: Haoming Liu Department of Economics National University of Singapore 1 Arts Link Singapore 117570 E-mail: [email protected]
* This version supersedes earlier versions entitled, “Can Superstitious Beliefs Affect Market Equilibrium? Personal Beliefs and Beliefs about Others” and “Superstition and Asset Markets: Evidence from Singapore Housing”. The authors thank Gene Amromin, Zahi Ben-David, Souphala Chomsisengphet, David Hirshleifer, Teck-hua Ho, Amit Seru, Wenlan Qian, and participants at the Econometric Society Asian and Australasian Meetings, and seminars at the Nanyang Technological University, and National University of Singapore for comments, Ng Hwee Tou for supervising and Harta Wijaya for building the ethnic classification system, and William Lai and Christopher Ng Gon Chew for providing data, and the NUS Institute of Real Estate Studies for research funding.

3
1. Introduction
For most people, buying a home is their single largest financial commitment. However, it
presents many uncertainties -- notably, the quality of the construction and maintenance,
whether the home will fit the family’s future needs, the development of the neighborhood,
and the evolution of interest rates and housing prices. Research in psychology suggests that
individuals rely on superstition as a way to cope with misfortune and uncertainty, and to
rationalize a complex world (Vyse 1997; Ang et al. 2014; Zhang et al. 2014). Given the large
stakes and many uncertainties, people may well rely on superstitious cues when buying a
home.
Buying a home is also very likely an individual’s largest visible expenditure.
Behavioral economics suggests that individuals engage in conspicuous spending to signal
their future wealth or status (Feltovich et al. 2002; Charles et al. 2009; Heffetz 2011). Where
to live, the scale and design of a home – all are very visible, even conspicuous, and possible
ways to signal wealth or status to potential business partners and spouses (Wei et al. 2012).
Prior research has found evidence of superstition among Chinese in buying homes,
particularly, a preference for homes numbered “8” and dislike of homes numbered “4” (Shum
et al. 2014; Fortin et al. 2014). However, these preferences could be expressions of
conspicuous spending to signal future wealth or status, rather than or in addition to
superstition. A house number has no intrinsic value. So, people might pay more for number
“8” just to show that they can afford it. Just as they pay more to live in a more expensive
neighborhood or build a flashier mansion.
Charles et al. (2009) and Heffetz (2011) emphasize the need to understand
conspicuous spending in housing, yet qualify that such research is challenging due to
confounding factors and measurement issues. Consider, for instance, the decision of where to
live. Are people choosing to live in a tony neighborhood for the better amenities, to benefit
from social externalities, or simply to show off that they can afford it?
We study the effects of superstition and conspicuous spending on housing markets in
the context of Singapore. Singapore is very well suited for researching the issue for several
reasons. First, the country is multi-racial, with a majority of Chinese and a minority of other
ethnicities. With individual data on buyers, we can analyze demand and prices by
nationality, ethnicity, age, education, occupation, and other individual characteristics.
Second, most homes are high-rise, with all floors being similar if not identical, and so, we can
analyze prices and buyer preferences while abstracting from substantial heterogeneity related
to locations. Third, the government strictly regulates the numbering of high-rise buildings
according to a fixed format, which cannot be manipulated by developers.
Specifically, under the competing hypotheses of superstition and conspicuous
spending, we develop predictions for the effects of various demographic and economic
4
factors and uncertainty on buyer preference for lucky addresses. Next, we construct a novel
dataset based on the legal filings of over 54,000 transactions of new high-rise apartments in
the Singapore real estate market between the years 2000 and 2009, matched to data on
ethnicity, dialect group, nationality, age, university education, public-sector employment, and
prior involvement in traffic accidents. Then, we run an empirical contest between the
alternative hypotheses of superstition and conspicuous spending.
We find evidence consistent with both superstition and conspicuous spending,
suggesting that buyers are heterogeneous. The evidence of superstition comprises higher
demand for lucky addresses from older buyers, those who suffered from more traffic
accidents, and buyers of new apartments, which are consistent with older people and those
encountering bad luck and facing more uncertainty being more superstitious. Further
superstition is lower demand from buyers with Western names and senior public-sector
employees, which is consistent with such people being less superstitious. The evidence of
conspicuous spending is lower demand for lucky addresses in luxury districts, consistent with
luxury areas being a substitute way of signaling wealth and status, as well as lower demand
from buyers with Western names and senior public-sector employees, consistent with such
people being more established and having less need to signal.
On balance, we conclude that superstition explains somewhat more of Chinese
buyers’ preference for lucky addresses. Yet, it is important to appreciate that conspicuous
spending plays a role, particularly in accounting for the relative magnitude of the discount for
unlucky addresses as compared with the premium for lucky addresses. In the absence of
conspicuous spending, the theory of loss aversion (Kahneman and Tversky 1979) combined
with superstition predict that the discount for unlucky addresses should be larger than the
premium for lucky ones.
Our findings contribute to research in finance emphasizing behavioral biases among
investors. Prior research has identified how lack of self-control affects savings, reference
pricing affects the sale of homes, loss aversion affects the choice between investment in
equities and bonds and leads investors to sell winners and hold on to losers, over-confidence
precipitates excessive trading, and extrapolation induces investors to over-invest according to
past share performance (DellaVigna 2009).
More particularly, weather affects personal mood, and in turn affects stock returns
(Hirshleifer and Shumway 2003), risk attitudes in capital markets (Kliger and Levy 2003),
and household spending (Agarwal et al. 2012). Solar and lunar eclipses are associated with
lower trading volume and stock returns in U.S. and Asian equity markets, with larger effects
when stock prices were more volatile and the eclipses were more publicized (Lepori 2009).
In China, newly listed firms with lucky listing codes trade at a premium, which dissipates
over three years (Hirshleifer et al. 2012). Consumers are subject to “hot hand” fallacies

5
(Guryan and Kearney 2008; Powdthavee and Riyanto 2015).
Our contribution is to explicate the role of superstition and conspicuous spending in
the market for housing, which is the largest asset for most households. Although our study is
set in Singapore, the findings are suggestive of consumer behavior in other markets. Older,
less Westernized buyers and those who have encountered more bad luck are more prone to
superstitious bias. Buyers employed in prestigious and well-paid occupations do not engage
in conspicuous spending, and high-class locations and lucky addresses are substitute ways to
signal status and wealth.
The rest of the paper is structured as follows. Section 2 explains Chinese numerology
and Section 3 introduces Singapore’s housing market. Sections 4-6 present the empirical
methodology, data, and estimates, while Section 7 concludes.
2. Chinese Numerology
Chinese is a language with a common written script, spoken in different ways by region. In
some Chinese dialects, the number “8” is pronounced like the word “prosperity”, while the
number “4” is pronounced like the word “death”. Consequently, “8” is considered to be
lucky, and “4” to be unlucky. As Hirshleifer et al. (2012) observe, Chinese numerological
symbolism, which derives from Confucian and Taoist beliefs, deviates from scientific notions
of causality in two ways. The similarity in the pronunciation of a number to another word
has causal import. Further, association with the number (and so, indirectly with the word)
will affect the likelihood of experiencing favorable outcomes.
The effect of Chinese numerological superstition has been quite extensively studied.
The government of Hong Kong sells new license numbers by public auction. In auctions
between 1997 and 2009, the prices of license numbers including the lucky “8” were
systematically higher, while prices of license numbers including the unlucky “4” were lower
(Ng et al. 2010).
However, the premium for “8” could also be interpreted as conspicuous spending to
signal future wealth or status. The interpretation as conspicuous spending is consistent with
the premium for “8” falling after 2006, when the government introduced vanity license
numbers, and so, providing another way by which car owners could signal their wealth and
status. Moreover, the prices of license numbers including the digit “5” were systematically
lower, which cannot be interpreted in terms of superstition.
Most research into Chinese numerological superstition has focused on real estate.
Fortin et al. (2014) analyzed the sales of about 117,000 of single-family homes in the Greater
Vancouver area between 2000 and 2005. In neighborhoods with relatively more Chinese
residents and in repeated transactions, the sales prices of houses with street address numbers
6
ending in “4” were 2.2 percent lower and those ending in “8” were 2.5 percent higher than
houses with other addresses. However, these findings might possibly be confounded by
unobservable differences between houses, or explained by conspicuous spending.1
Shum et al. (2014) studied a random sample of high-rise residential sales in Chengdu,
a large city in southwest China, between 2004 and 2006. The prices of apartments on floors
with numbers ending in “8” were 8.7 percent higher when sold as second-hand but not
significantly higher when sold as new. Buyers who had more 8’s in their mobile telephone
number were more likely to buy apartments on the lucky 8th floor. However, more educated
people were not less likely and older people were not more likely to buy 8th floor homes,
which is not consistent with superstition. Indeed, the estimates seem more consistent with
conspicuous spending. A mobile number with more 8’s is very conspicuous.
By contrast with the studies that focused on housing, Hirshleifer et al. (2012)
investigated the effect of superstition on equity markets -- in the context of initial public
offerings in China between 1991 and 2005. On the Shanghai and Shenzhen stock exchanges,
listed companies are identified by a numerical code, which is the equivalent of the U.S.
ticker. For instance, the listing code of the Industrial and Commercial Bank of China is
601398.SS. Consistent with superstition, the proportion of issuers with lucky listing codes
(that included at least one lucky digit and no unlucky digit) was abnormally high and the
proportion of issuers with unlucky listing codes was abnormally low. Moreover, newly listed
shares with lucky listing codes initially traded at a premium to shares with unlucky listing
codes, but the premium dissipated within three years.2
Besides numerological superstition, Chinese people also attach real meaning to the
zodiac calendar, which comprises a 12-year cycle, each named after an animal. The dragon
year is considered to be particularly auspicious and is associated with surges of new births
among Chinese people. In a study of the U.S. population, Johnson and Nye (2011) found that
Asians born in dragon years are more educated than those born in other years, which suggests
that Asian parents invest more in the education of dragon children.
3. Singapore Housing Market
Singapore is an island nation with land area of about 716 square kilometers (projected to
increase to 766 square kilometers by the year 2030). As of June 2012, the population of the
1 Houses numbered “4” were older, while those numbered “8” were newer and had better features.
The difference in age might be related to people buying houses numbered “4”, rebuilding and then,
petitioning to renumber. In neighborhoods with more Chinese, house numbers ending in “0”, “5”, and
“8” were more frequent (Fortin et al. 2014: Figure 3). 2 Apparently, the Chinese vary in their definition of which numbers are lucky. Shum et al. (2014)
defined both “6” and “8” as lucky, while Hirshleifer et al. (2012) considered “6”, “8”, and “9” to be
lucky. The common thread in the previous research is that “8” is lucky and “4” is unlucky.

7
country was 5.31 million, including 3.29 million citizens and 533,000 permanent residents.
The resident population is ethnically diverse, comprising 74 percent Chinese and 26 percent
other races.3
Singapore’s ethnic diversity provides a natural setting in which to investigate the
effect of superstition among Chinese people in their decision to buy a home. The non-
Chinese population provides a ready control group to test whether the effect of lucky and
unlucky numbers on housing demand and prices is due to conspicuous consumption or
superstition.
Singapore’s home ownership rate of over 90 percent is among the world’s highest.
The residential market comprises two segments. About 77 percent of homes were built by
the government’s Housing and Development Board, mostly for direct sale to eligible citizens
at subsidized prices, with a small proportion for rental. Public housing is primarily owner-
occupied. The government closely regulates the sale and resale of public housing and limits
information on individual prices.4
The remaining 23 percent of apartments are in the private housing market. The
private housing market is laissez-faire, except that foreigners are not allowed to buy low-rise
apartments such as single-family homes. Information on sales of private housing, including
the price and physical characteristics of each transaction, is readily available. Accordingly,
like previous studies of superstition in the Singapore housing market, we focus on private
housing, where preferences for lucky and unlucky numbers are more likely to be fully
revealed.
The Singapore government strictly regulates street addresses and the numbering of
high-rise apartments, and so, facilitates study of the effect of superstition on housing prices.
The Inland Revenue Authority of Singapore (IRAS), which is responsible for collecting taxes
on real estate and real estate transactions, has stipulated a specific format for the numbering
of all high-rise buildings. The format comprises a block number, and then an apartment
number comprising a sequence of two digits or characters designating the floor, a hyphen,
and two or three digits or characters designating the location on the floor. For instance,
apartment number 05-08 is the 8th unit on the 5th floor.
The IRAS enforces compliance with the numbering plan. With regard to the
numbering of floors, the IRAS states unequivocally, “‘01’ is normally assigned to the first
level of a building where the main entrance is located, followed by ‘02’ for the second level
3 These and the following statistics of Singapore’s population and housing market are drawn from the
Yearbook of Statistics 2013 and Census of Population 2010, Department of Statistics, Singapore.
4 A unique feature of Singapore’s public housing is an explicit policy to ensure ethnic diversity
(Wong 2013). The Housing and Development Board regulates the resale of apartments by building
and area to prevent the percentage of any particular race from exceeding specified benchmarks.

8
and so on. … Omission of any numbers is not allowed” (IRAS 2013: Paragraph 3B(1)). The
IRAS is equally firm with regard to the numbering of apartments on each floor: “Units are
generally numbered sequentially in a clock-wise direction starting from “01”. An apartment
number will be provided for each distinct unit shown on the floor plan. Omission and
reservation of any numbers are not allowed for a residential development” (IRAS 2013:
Paragraph 3B(3)). In addition, the IRAS assigns a unique 6-digit postal code to every
building.5
4. Empirical Strategy
Previous research into the demand for residential housing among Chinese buyers identified
preferences over the house number (Fortin et al. 2014) as well as the floor number (Shum et
al. 2014). To encompass both aspects, we define the ordinal variable, lucky address number,
as follows:
2 = very lucky if the last digits of both floor and unit numbers is “8”;
1 = lucky if the last digit of either floor or unit number is “8” and neither last digit is
“4”;
0 = neutral if not very lucky, lucky, unlucky, or very unlucky;
-1 = unlucky if the last digit of either floor or unit number is “4” and neither last digit
is “8”;
-2 = very unlucky if the last digits of both floor and unit numbers is “4”.
The above ordinal classification represents Chinese dislike of the number “4” and
preference for the number “8” in a fairly flexible way. It explicitly allows complementarity
in lucky/unlucky addresses, so, for instance, the premium for very lucky addresses need not
be double the premium for lucky addresses. The only ambiguity is whether to classify mixed
addresses like 04-08 and 08-04 in the same category as addresses with neither unlucky nor
lucky numbers such as 03-07. In the main estimates, we classify mixed addresses as neutral,
and in a robustness check, exclude them.
To investigate the effect of superstition and conspicuous spending on the demand for
apartments, we estimate an ordered logit model of the buyer’s choice by address.
Specifically, we suppose that buyer i receives the latent utility,
𝑦𝑖𝑗𝑦𝑞∗ = 𝛼 + 𝑆𝑖𝑗𝛽 + 𝑋𝑗𝛾 + 𝜇𝑦 + 𝜈𝑞 + 𝜂𝑖𝑗𝑦𝑞, (1)
5 By contrast, the authorities in other countries are more flexible. In the United States, many high-
rise hotels lack a 13th floor (USA Today, 2007). The Hong Kong authorities are particularly
accommodating of real estate developers in floor numbering. The sales brochure for the Arch, a
development in West Kowloon, boldly advertised that “[t]here are no 14, 24, 34, 40-49, 53-54, 58, 60-
61, 64 & 74F”. In the absence of units with unlucky numbers, any research would be limited to
investigating the effects of lucky numbers.

9
from buying apartment j in quarter q of year y. The 𝑆𝑖 are buyer i’s demographic, economic,
and other characteristics, 𝑋𝑗 are legal and physical attributes of the apartment including legal
tenure, location, size, and floor level, 𝑦
are transaction year effects to control for changes
over time in the macro-economy and interest rates, that affect all residential real estate
transactions in the same way, 𝑞 are transaction quarter effects to control for potential
seasonality, and 𝜂𝑖 is a random variable with a logistic distribution, while the 𝛼, 𝛽, 𝛾 are
coefficients. The probability that buyer i will buy apartment j is
𝑃(𝑦𝑖𝑦𝑞 = 𝑗) = 𝑃(𝜅𝑗−1 ≤ 𝑦𝑖𝑦𝑞∗ ≤ 𝜅𝑗) = 𝐹(𝑦𝑖𝑡
∗ − 𝜅𝑗) − 𝐹(𝑦𝑖𝑦𝑞∗ − 𝜅𝑗−1), (2)
where κ is the cut-off value and j (= -2, -1, 0, 1, 2) is the address, and F is the logistic
cumulative function where
𝐹(𝑧) =ⅇ𝑧
1−ⅇ𝑧. (3)
We assume that the buyer’s characteristics are exogenous. Yet her decision to buy an
apartment with a particular address could be correlated with legal and physical attributes of
the apartment. If buyers with different characteristics differ in their preference for these legal
and physical attributes, then, without proper control for these attributes, the estimated effects
of the characteristics might be biased. For instance, if Chinese have a stronger preference for
high floor apartments than non-Chinese, then Chinese buyers will be more likely to purchase
apartments on the 8th floor than on the 4th floor even they are not superstitious. Accordingly,
we include controls, 𝑋𝑗, for these attributes.
Our identifying assumption is that, in the absence of superstitious beliefs and
conspicuous spending, buyer demand does not vary with address after controlling for legal
and physical attributes. To justify the assumption, we note that the design of Singapore high-
rise residential buildings is fairly uniform, with the design of each floor being the same. So,
the “04” unit is the same on every floor of the building, and similarly, the “08” unit is the
same on every floor. Further, the government’s strict regulation and clockwise numbering
rule prevent real estate developers from selectively numbering more desirable apartments (for
instance, closer to or further from the elevator) and home-owners from renumbering their
apartments. Accordingly, the controls for legal and physical attributes substantially eliminate
heterogeneity among apartments.
5. Data Our study combines five sources of data. The first is a proprietary dataset of legal filings of
private housing transactions with the Registry of Land Titles between January 1995 and
December 2012. The records include the address of the apartment including the name of the
building, and floor and unit number, attributes of the apartment, and details of the transaction.

10
The apartment attributes are the legal tenure (freehold or leasehold), type of development
(apartment, condominium, or landed), and size in square meters.6 The transaction details are
the date, names and national registration numbers of buyers and sellers, type of sale (new
sale, subsale, or resale -- as explained below), price, and whether the purchase was financed
by a mortgage loan.
A “new sale” is the sale of the apartment by the real estate developer, which may
occur before or after the government issues the “temporary occupation permit”, which allows
the apartment to be inhabited. A “subsale” is the sale of an apartment before the government
issues the temporary occupation permit, by a party who is not the developer. A “resale” is
the sale of an apartment after the issuance of the temporary occupation permit, by a party
who is not the developer.
The second source of data is a system that we built to classify any person by name
into one of four ethnicities – Chinese, Malay, Indian, and others. The classification is based
on the value of a linear combination of the characteristics of the data. We used a proprietary
dataset of personal information to train the ethnic classifier system. When validated against a
data set of 1,327 persons with confirmed ethnicity, the system achieved accuracy of over 99
percent in recognizing Chinese names and 82.7 percent in recognizing non-Chinese names
(over 99 percent of persons classified as Chinese were actually Chinese, and 82.7 percent of
those classified as non-Chinese were actually not Chinese). We used the classification
system to identify the ethnicity (Chinese or non-Chinese) of buyers named in the residential
property transactions. To supplement the race classifier, we also compiled family names of
the major Chinese dialect groups in Singapore – Hokkien, Teochew, and Cantonese -- and
classified Chinese buyers by dialect group.
The third source is a simple classifier that we built to infer a Singaporean’s year of
birth from their national registration number. The government issued national registration
numbers in sequence by year of birth to people born in the year 1955 and after, and so, the
classifier only works only for these people. For people born earlier, the national registration
number was not issued in sequence, so, it is not possible to infer their age from the national
registration number.
The fourth source is graduation lists of Singapore’s two major tertiary institutions –
the National University of Singapore and Nanyang Technological University, and the
Singapore Government Directory, 2007 and 2009 editions. For these sources, we kept only
6 Condominiums are high-rise buildings with exclusive access to amenities such as parking, sports
facilities, and children’s playgrounds. Apartment buildings are high-rise buildings without such
exclusive amenities. Landed properties are single-family homes, and have unique street addresses and
6-digit postal codes. Freehold is an unlimited tenure of ownership, while leasehold is a limited tenure
of ownership, typically 99 years, after which ownership reverts to the government.

11
unique names and then matched by name to buyers in the dataset of private housing
transactions to identify buyers with university education or were employed in the public
sector.
The fifth source is a proprietary dataset of court records of civil actions against
personal defendants involved in traffic accidents between 1998 and 2012. For each case, the
record includes the filing date and the names and national registration numbers of the parties.
We link the court records to residential property transactions through the buyer’s national
registration number.
Note that many purchases of residential properties involve more than one buyer, such
as husband and wife buying jointly. In classifying buyers by race, nationality, dialect group,
education, and employment in the public sector, we classify all buyers involved in the
purchase, and then construct indicator variables that equal 1 if at least one buyer belongs to
the category and 0 otherwise. For instance, an apartment is defined to be bought by Chinese if
at least one buyer is Chinese.
Like Shum et al. (2014), we focus on high-rise residential developments. The plans
of the various floors in high-rise buildings are quite similar, if not identical. Possible
differences from a common floor plan include first floor apartments which might include a
terrace and top floor apartments which might include a terrace or comprise two floors. By
contrast, single-family homes are heterogeneous and may differ in unobservable ways that
correlate with the house number (Fortin et. al. 2014).
Unlike previous studies, we consider only the primary market, i.e., new sales. Apart
from a few transactions with missing data or errors, the data on new sales are quite complete.
Importantly, all new apartments in a building are sold by the same seller, and so, within-
development estimates would not be confounded by unobserved differences. In addition, the
quality of new apartments is uniform within a building. By contrast, studies of the secondary
market are subject to possible selection bias and differences among sellers. Moreover, resale
apartments might differ in ways that we cannot observe, such as renovation and maintenance,
and which might be correlated with unit or floor number.
Referring to Table 1, the distribution of sales by luckiness of address differs between
the primary and secondary markets. Specifically, the Kolmogorov-Smirnov test rejects the
null hypotheses of that the distributions of lucky addresses are the same in the primary and
secondary markets at the 1 percent level. Subsales and resales involve relatively more
unlucky addresses and fewer lucky addresses.7
[Insert Table 1 here]
7 We limit analysis of the secondary market transactions (subsales and resales) to those for which we
have data on the date of legal occupancy, from which we can calculate the age of the building. Age is
surely an important factor in the price of apartments.

12
The Urban Redevelopment Authority, a government agency, publishes limited data on
all private housing transactions in the online database, REALIS. Importantly, REALIS does
not publish the personal information of buyers and sellers. Figure 1 compares the numbers of
new sales of private housing in the REALIS database and our proprietary dataset of legal
filings. Evidently, the legal filing dataset provides good coverage from 2000 onward and up
to 2009. Accordingly, we focus our study on transactions in the period, 2000-09.
Transactions are cyclical, peaking in 2002, and falling sharply in 2003, the year of the SARS
(Severe Acute Respiratory Syndrome) crisis. Transactions recovered gradually to a new peak
in 2007, before falling sharply in 2008, on the advent of the global financial crisis.
[Insert Figure 1 here]
Among the legal filings, we exclude transactions with incomplete or obviously wrong
information, and those with corporate buyers, and limit to new sales of high-rise apartments
in the period 2000-09. The dataset comprises 54,109 new sale transactions. In additional
analyses, we also consider transactions in the secondary market, i.e., subsales and resales.
[Insert Table 2 here]
Table 2 presents summary statistics of the data. The average real price is S$10,601
per square meter (2014 = 100) or about US$581 per square foot (converted at the average
exchange rate of one Singapore dollar to 59 U.S. cents in 2014). The size of the average
apartment is 118.7 square meters or 1277.7 square feet, and so, the average price of an
apartment is US$742,344.
For a first look at the data, Figure 2 plots the estimated coefficients of the floor levels
in a regression of the logarithm of unit price per square meter on indicators of floor number
and last digit of unit number, apartment size, and building fixed effects. The dotted and solid
lines indicate floors with last digit ending in 4 and 8, respectively. Evidently, the price
increases with the floor level with a noticeable dip at 47. The relationship between floor and
price is weaker in buildings with 45 or more floors, of which there are only nine.
[Insert Figure 2 here]
Figure 3 plots the estimated coefficients of the last digit of the unit number in a
regression of the logarithm of price per square meter on indicators of the last digit of the unit
number. Clearly, the prices of units with numbers ending in “4” are lower, while the prices of
units with numbers ending in “8” are higher.
[Insert Figure 3 here]
With regard to nationality and ethnicity, 80.9 percent of the buyers are Singaporeans
(citizens or permanent residents), and just over 91 percent are Chinese. The ethnic classifier
system is accurate in classifying the ethnicity of Singaporeans, but less accurate for
foreigners. Among the foreign buyers, there are Indonesian Chinese with Malay-like names

13
which the ethnic classifier might wrongly classify as non-Chinese.
6. Estimates
6.1. Numerological Preferences
Following up on Figures 2 and 3, we present regression analyses of transaction prices and
buyer choice to show that, in the Singapore housing market, ethnic Chinese buyers prefer
apartments with the digit “8” and dislike apartments with the digit “4”. These estimates
present a baseline to confirm the preferences of Chinese buyers, as shown in previous
research (Ng et al. 2010; Shum et al. 2014; Fortin et al. 2014). However, we stress that these
baseline results do not explain the reason for such preferences, whether due to superstition or
conspicuous spending.
Table 3 presents ordinary least squares (OLS) regressions of the price of housing
(specified as the logarithm of price per square meter). Table 3, columns (a)-(c), report
estimates that control for size, floor, legal tenure (freehold) and development type
(condominium), as well as progressively finer controls for location, beginning with no control
for location, then 2-digit postal district fixed effects, and then 4-digit postal district fixed
effects. Our data comprises transactions in 69 out of a total of 80 2-digit postal districts in
Singapore. These 2-digit postal districts are further divided into 721 4-digit postal districts.
Each 4-digit district consists of between 1 and 37 apartment buildings, with an average of less
than 6. Hence, 4-digit district fixed effects control much more stringently for differences
between neighborhoods than do 2-digit fixed effects.
Regardless of whether we control for postal districts, apartments with very unlucky
addresses are always the cheapest and those with very lucky addresses the most expensive
ones. Controlling for 2-digit postal districts reduces the estimated discount for very unlucky
addresses by 2.6 percentage points from 4 to 1.4 percent and the premium of very lucky
addresses by 1 percentage point from 4 to 3 percent. This is likely due to the variation in the
proportion of apartments with lucky addresses across postal districts.
In Singapore, the maximum height of each building, as stipulated by the government
master plan, varies across districts. Buildings with fewer than eight floors do not have any
very lucky addresses. Hence, in districts with relatively more short buildings, the supply of
very lucky numbers would be lower. If the average housing price also varies across districts,
then failing to control for geographic location biases the estimated impact of lucky addresses
on housing price. Except for the premium for very lucky addresses, the estimated relationship
between lucky number and price hardly changes if we control for 4-digit rather than 2-digit
postal districts, which suggests that controlling for 4-digit postal district resolves most of the
bias due to across district variation in the proportion of apartments with lucky addresses.
Indeed, the coefficients of lucky addresses hardly change if we control more stringently for 6-

14
digit postal codes, which are unique to buildings. To optimize the number of fixed-effects in
the regressions, we decided to control for 4-digit postal districts in all following analyses.
[Insert Table 3 here]
The estimates including postal district fixed effects identify the effects of the buyer’s
ethnicity by variation within districts. But the impacts of lucky addresses on housing prices
are restricted to be the same for both Chinese and non-Chinese. One might argue that non-
Chinese might not want to pay a premium for an address that Chinese consider to be lucky.
Table 3, column (d), relaxes this restriction by adding interactions between ethnicity and
addresses. To make our results comparable across columns, we use Chinese as the reference
group. As a results, the coefficients on lucky addresses have the same economic meanings
across the columns.
Evidently, Chinese buyers pay higher prices for luckier addresses. The regressions
exclude the indicator variable for neutral addresses, which is the benchmark. Referring to
Table 3, column (d), consistent with Chinese numerological preferences, Chinese buyers pay
increasing premia for the lucky addresses, with the premium for the very lucky addresses (the
last digit of floor and unit numbers is “8”) being 2.4 percent, and receive increasing discounts
for unlucky addresses, with the discount for the very unlucky addresses (the last digit of floor
and unit numbers is “4”) being 1.2 percent. Except for the coefficients on the interaction
between non-Chinese and very unlucky addresses, the coefficients on the coefficients for the
other three categories of addresses are all insignificant, suggesting that non-Chinese buyers
are price takers with respect to luckiness of address although they do not have any systematic
numerological preference.8
While non-Chinese buyers might have to pay similar premium or enjoy the similar
discount for lucky or unlucky addresses, they do pay 1.3 to 3.6 percent more in general. This
is likely due to the fact that most non-Chinese buyers are not Singaporean. As foreigners,
they might be at an information disadvantage relative to locals. Excluding all foreign buyers,
the price premium paid by non-Chinese falls to 0.7 percent and the difference is only
marginally significant. For brevity, we report these results in the Supplement.
To check whether the results are stable over time or exist only in the primary market,
Table 3, column (e), extends the sample to the period of 1995-2013, and column (f) examines
8 The insignificance of the interaction terms might seem to be inconsistent with Fortin et al. (2014),
who find that, in the Greater Vancouver area, the discount on unlucky addresses and the premium for
lucky addresses depend on the proportion of Chinese residents in the neighborhood. The difference is
likely due to the Chinese being the majority throughout Singapore, and also being the marginal buyers
and hence determining market prices. When numerological preference are prevalent, non-believers
must take the future resale value of their residential investment into consideration even if they
themselves have no numerological preference. Furthermore, the valuation of Chinese buyers is likely
to appear as a salient opportunity cost to sellers.

15
the relationship in the secondary market (subsales and resales). These estimates confirm that
the findings with respect to Chinese buyers and pricing of unlucky addresses are robust to
including earlier and later transactions as well as in the secondary market.
The pattern of prices for unlucky addresses relates to previous research into reference
dependence in residential housing markets (Genesove and Mayer 2001). To the extent that
people pay less for unlucky addresses, they will ask for lower prices when they subsequently
sell their homes. Indeed, we find similar discounts for unlucky addresses in the secondary
and primary markets.
Referring to Table 3, column (c), relative to a neutral address, the discounts for very
unlucky and unlucky addresses are 1.5 and 0.7 percent, while, the premia for very lucky and
lucky addresses are 2.2 and 0.5 percent. The discounts are similar to or smaller than the
premia. By contrast, the theory of reference dependent preferences and loss aversion
(Kahneman and Tversky 1979) predicts that individuals would be less willing to accept bad
things than pay for good things.
In our context, since the majority of apartments have neutral addresses, these
apartments are likely to be used as the reference when buyers make their purchasing
decisions. The discount for an unlucky address could be viewed as the price that a buyer is
willing to accept for potential bad luck in the future. In contrast, the premium from a lucky
address is the price that a buyer is willing to pay for potential good luck in the future. Due to
risk and/or loss aversion, the discounts for unlucky addresses should be larger than the
premia for lucky addresses if the expected gain from purchasing a lucky address is the same
as the expected loss from buying an unlucky one. Yet, our estimates show otherwise, which
seems inconsistent with the superstitious belief that unlucky addresses bringing bad luck and
lucky addresses bringing good luck.
The alternative explanation of conspicuous consumption seems more plausible. This
theory emphasizes people spending more to signal status and wealth. It is silent on negative
signaling (which is presumably the outcome of buying a home with an unlucky address).
Hence, the empirical pattern of discounts for unlucky addresses being similar to or smaller
than the premia for lucky addresses seems to fit the hypothesis of conspicuous consumption
better than superstition.
Having studied the pricing of luckiness of address, we next investigate buyer’s choice
of apartment by luckiness of address. Table 4 reports ordered logit regressions of choices
ordered categorically from the very unlucky addresses (last digit of floor and unit numbers is
“4”) to the very lucky addresses (last digit of floor and unit numbers is “8”).
[Insert Table 4 here]
Table 4, column (a), presents an estimate for all buyers in new sales including

16
controls for legal and physical attributes and year and quarter of purchase. The coefficient of
Chinese, 0.183 (s.e. 0.033), is positive and significant. This implies that the odds of a
Chinese person buying an apartment with a very lucky address as compared with other
addresses are 𝑒0.183 = 1.201 times, or 20.1 percent higher than a non-Chinese person. Table
4, column (b), includes 2-digit postal district fixed effects to control for differences in
location. The coefficient of Chinese, 0.220 (s.e. 0.032), is positive, significant, and larger
than the estimate without district fixed effects. This suggests that the preference for lucky
addresses is stronger within districts than across districts, perhaps because of differences in
the supply of lucky addresses across districts. One reason for the difference in supply is
geographical differences in height regulation. In areas where buildings are limited to 4 or 6
floors, there are no very lucky addresses. Consequently, the demand for lucky addresses is
compressed, which would likely attenuate the estimated coefficient of Chinese buyer.
Table 4, column (c), includes 4-digit postal district fixed effects, which control more
stringently for differences in area. The coefficient of Chinese buyer, 0.223 (s.e. 0.034), is
quite similar to the estimate with 2-digit district fixed effects, suggesting that the 2-digit fixed
effects already substantially control for differences in neighborhood. Nevertheless, to be
conservative, we prefer the estimate with 4-digit district effects as it controls more stringently
for locational differences.9
Next, Table 4, column (d), reports an estimate that investigates differences in the
preferences over lucky addresses between Singaporean and non-Singaporean Chinese buyers.
The benchmark is the non-Singaporean non-Chinese buyers. The coefficient of Chinese buyer
is positive and significant even at the 1 percent level. However, the coefficient on
Singaporean Chinese buyers is positive but insignificant, suggesting the preference for lucky
addresses is much stronger for Singaporean Chinese than foreign Chinese. Apparently, non-
Singaporean Chinese buyers have somewhat weaker preferences over lucky addresses. This
difference should be interpreted with caution owing to the difficulty of classifying Indonesian
Chinese buyers.
Then, Table 4, column (e), reports an estimate that considers differences in choice
between luxury (2-digit postal districts 1, 9, 10, and 11) and other areas. The coefficient of
Chinese buyers increases to 0.274, which is considerably larger than the preferred estimate.
The coefficient of the interaction between Chinese and luxury areas is -0.135 (p = 0.068).
Apparently, the preference among Chinese buyers for lucky addresses is limited to non-
9 We do not further refine the controls to the building level (6-digit postal district) as the estimation
drops many observations due to perfect prediction, and the large number of dummy variables would
very likely present the problem of incidental parameters in estimating the ordered logit model. The
slight difference between the estimates controlling for 2 vis-à-vis 4-digit postal districts (Table 4,
columns (b) and (c)) suggest that the estimated coefficients are not sensitive to further refinement of
the controls.

17
luxury areas. Buying a home in a luxury area is conspicuous in itself. It is certainly a
credible signal as homes in luxury areas cost more than those in ordinary neighborhoods.
The weaker preference for lucky addresses in luxury areas may be the result of buyers using
the choice of residential neighborhood to substitute for lucky addresses to signal wealth and
status. To this extent, the estimate for luxury areas is consistent with the hypothesis of
conspicuous spending.
Finally, Table 4, columns (f)-(i), reports tests of the robustness of the basic finding
that Chinese buyers prefer lucky addresses. These variously exclude mixed addresses such as
04-08, exclude buildings with fewer than eight floors (which have fewer lucky addresses and
no very lucky addresses), include earlier transactions back to 1995 and later transactions
forward to 2012, and focus on the secondary market. Across all of these variations, the
coefficient of Chinese buyer is positive and significant.
Referring to Table 4, column (g), the coefficient of Chinese buyer in the subsample of
buildings with more than eight floors is larger than the preferred estimate. In buildings with
fewer than eight floors, there are fewer lucky addresses and no very lucky addresses. This
compresses buyers’ choices, which is the dependent variable, and so attenuates the estimated
effect of Chinese buyers. Hence, the estimated effect in buildings with more than eight floors
is larger.
Table 4, column (i), reports an estimate of buyer choice in the secondary market. The
coefficient of Chinese buyer, 0.057 (s.e. 0.025), is positive and significant, but substantially
smaller than the preferred estimate (Table 4, column (c)). The difference could be due to the
different distribution of lucky and unlucky addresses in the secondary market. In the new sale
market, buyers can get their preferred address as long as they pay for it. By contrast, in the
secondary market, buyers must choose among apartments that are offered for sale. Buyer
preference for lucky address may be dominated by preference for location. Hence, even
Chinese buyers with relatively strong preference for lucky addresses might buy apartments
with unlucky addresses to get their preferred location. Similarly, non-Chinese buyers might
pay the market premium for apartments with lucky addresses although they would prefer
apartments without lucky addresses.
Referring to Table 1, the proportion of apartments with an unlucky or very unlucky
address is 19.9 percent in the primary market and 22.4 percent in the secondary market, and
the difference is statistically significant at the 1 percent level. So, it is difficult to avoid these
apartments in the secondary market. By contrast, the proportion of apartments with a lucky or
a very lucky address is 13.5 percent in the primary market and 11.9 percent in the secondary
market, and the difference is statistically significant at the 1 percent level. Hence, it is more
difficult for buyers to purchase an apartment with a lucky address in the secondary market.
18
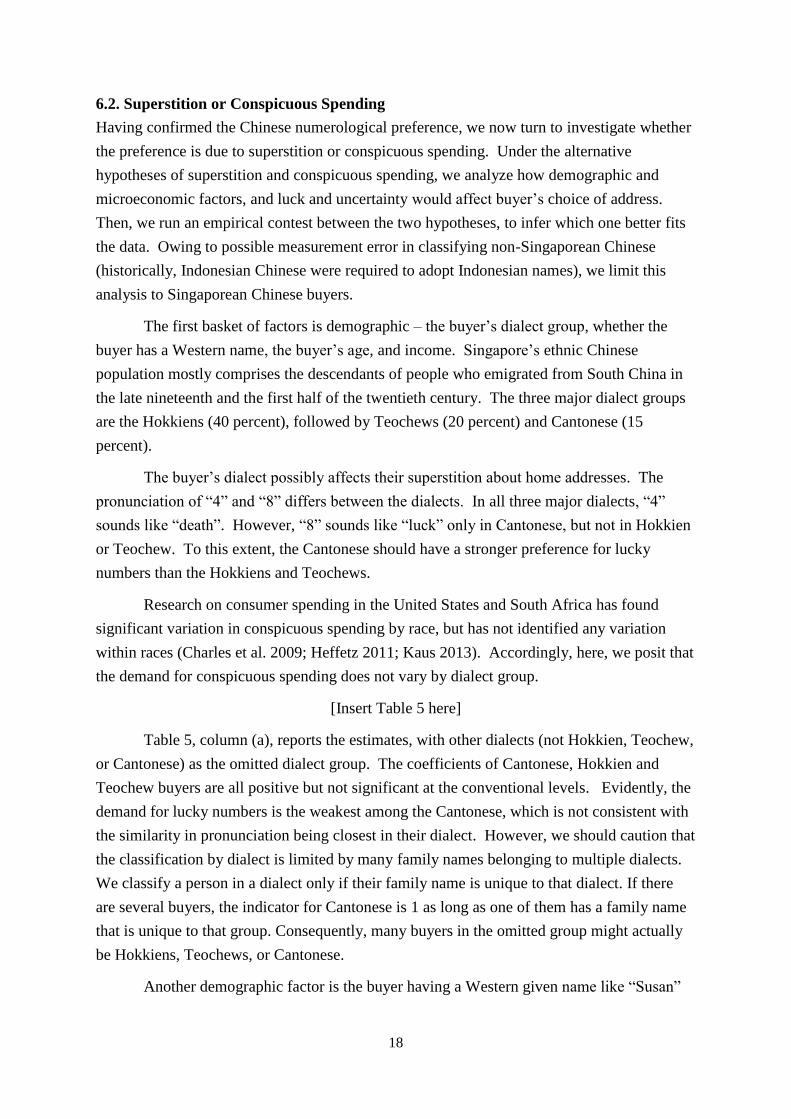
6.2. Superstition or Conspicuous Spending
Having confirmed the Chinese numerological preference, we now turn to investigate whether
the preference is due to superstition or conspicuous spending. Under the alternative
hypotheses of superstition and conspicuous spending, we analyze how demographic and
microeconomic factors, and luck and uncertainty would affect buyer’s choice of address.
Then, we run an empirical contest between the two hypotheses, to infer which one better fits
the data. Owing to possible measurement error in classifying non-Singaporean Chinese
(historically, Indonesian Chinese were required to adopt Indonesian names), we limit this
analysis to Singaporean Chinese buyers.
The first basket of factors is demographic – the buyer’s dialect group, whether the
buyer has a Western name, the buyer’s age, and income. Singapore’s ethnic Chinese
population mostly comprises the descendants of people who emigrated from South China in
the late nineteenth and the first half of the twentieth century. The three major dialect groups
are the Hokkiens (40 percent), followed by Teochews (20 percent) and Cantonese (15
percent).
The buyer’s dialect possibly affects their superstition about home addresses. The
pronunciation of “4” and “8” differs between the dialects. In all three major dialects, “4”
sounds like “death”. However, “8” sounds like “luck” only in Cantonese, but not in Hokkien
or Teochew. To this extent, the Cantonese should have a stronger preference for lucky
numbers than the Hokkiens and Teochews.
Research on consumer spending in the United States and South Africa has found
significant variation in conspicuous spending by race, but has not identified any variation
within races (Charles et al. 2009; Heffetz 2011; Kaus 2013). Accordingly, here, we posit that
the demand for conspicuous spending does not vary by dialect group.
[Insert Table 5 here]
Table 5, column (a), reports the estimates, with other dialects (not Hokkien, Teochew,
or Cantonese) as the omitted dialect group. The coefficients of Cantonese, Hokkien and
Teochew buyers are all positive but not significant at the conventional levels. Evidently, the
demand for lucky numbers is the weakest among the Cantonese, which is not consistent with
the similarity in pronunciation being closest in their dialect. However, we should caution that
the classification by dialect is limited by many family names belonging to multiple dialects.
We classify a person in a dialect only if their family name is unique to that dialect. If there
are several buyers, the indicator for Cantonese is 1 as long as one of them has a family name
that is unique to that group. Consequently, many buyers in the omitted group might actually
be Hokkiens, Teochews, or Cantonese.
Another demographic factor is the buyer having a Western given name like “Susan”

19
or “John”.10 Such a name may indicate more Westernized thinking, and so, less belief in
Chinese numerological superstitions (and, possibly, more belief in Western religion). In the
U.S. population, an individual’s given name is strongly related to their parents’ economic
status (Olivetti and Paserman 2014). In Singapore, a former British colony, English-educated
people earn relatively more and may tend to give Western names to their children. To the
extent that individual’s status has been established by their parents, they would have less
need to signal their status. This reasoning suggests that, in Singapore, people with Western
names might spend less on conspicuous spending.
We emphasize that the names of buyers and sellers recorded in the legal filings of
residential transactions are the names of the persons as officially registered in the national
registration system. The transactions do not include nicknames. As reported in Table 5,
column (b), the coefficient of Western name, -0.049 (s.e. 0.022), is negative and significant,
which suggests that the odds of buying an apartment with a very lucky address as compared
with other addresses is 𝑒−0.049 = 0.952 times, or 4.8 percent smaller for a buyer with a
Western given name than buyers without a Western given name. This result is consistent
with such buyers being more Westernized and less believing of Chinese numerological
superstition, and also consistent with their coming from an established background and
engaging less in conspicuous spending.
Yet another demographic factor is the buyer’s age. Both superstition and the demand
for conspicuous spending vary with age. Johnson and Nye (2011) find that the parents of
children born in the dragon year are older, which suggests that older people are more
superstitious. Separately, older people are more religious (Deaton 2011), which we interpret
as additional, indirect evidence that older people might be more superstitious. With regard to
conspicuous spending, younger people need to establish themselves, and so, their demand for
signaling is relatively higher. By contrast, older people have already established themselves,
and so, their demand for signaling is relatively lower (Charles et al. 2009). Thus, older people
should engage less in conspicuous spending on lucky addresses.
Buyer age is especially important as it is one of only two factors for which the
hypotheses of superstition and conspicuous spending generate contrasting predictions. We
divide buyers into three age brackets according to the mean age of the buyers: 34 and below,
between 35 and 45, and 46 and above, which are the bottom quartile, middle two quartiles,
and top quartiles respectively. Table 5, column (c), reports an estimate with the middle age
group as the omitted category. The coefficient of the mean buyer age being 46 and above,
0.124 (s.e. 0.028), is positive and significant at the 1 percent level, while the coefficient of the
mean buyer age being 34 and below is negative and insignificant.
Evidently, older buyers evince a stronger preference for lucky numbers than middle-
10 We classify given names that can be either Chinese or Western, such as “Lee”, as Chinese.

20
aged and younger buyers. This pattern is consistent with superstition but not conspicuous
spending.
The second basket of factors is microeconomic – education, employment, and wealth.
People with more education should be less superstitious (Mocan and Pogorelova 2014).
However, Johnson and Nye (2011) find some but not conclusive evidence that Asian mothers
giving birth in a dragon year are more educated. By contrast, with regard to conspicuous
spending, university graduates already have their degree as a strong objective indicator of
status, and so, they should benefit less from conspicuous spending.
Among university graduates, those with degrees in science and technology should be
less superstitious than graduates in other disciplines. By contrast, we cannot think of any
difference between graduates in science and technology vis-à-vis other disciplines in their
demand for conspicuous spending.
The classification of university graduates is subject to considerable false negatives
and false positives as it is based on matching the graduation books of Singapore’s two major
universities by name to legal filings of residential transactions. The reasons for false
negatives are that, in matching the two data sources, we limit to unique names in the
graduation lists, and so, omitting people with common names like “Lee Li Lian”, and our
procedure overlooks graduates of foreign universities. The reason for false positives is that a
name that is unique in the graduation list need not be unique in the population.
With these provisos in mind, Table 5, columns (d)-(f), report ordered logit regressions
focusing on buyers with university degrees, buyers with university degrees in science and
technology, and both types of buyers respectively. Subject to the proviso that the effect of
education is not precisely estimated, the effect of university education seems to be
concentrated among graduates with degrees in science and technology. The imprecision of
the estimates may well be due to false negatives or false positives in identifying buyers with
university degrees. With great caution, we interpret the estimates as slight evidence in favor
of superstition.
Another microeconomic factor is the individual’s profession. Using the Singapore
Government directory, we identify senior level public sector employees. The omission of
lower level employees is not serious as they cannot afford private housing. In Singapore,
employment in the public sector is prestigious and well-remunerated. The public sector
selects senior employees through rigorous processes, which possibly screen out individuals
who are superstitious. Certainly, in Singapore, senior public-sector employees have well-
established status and enjoy high incomes, and so, they have no need to engage in
conspicuous spending to signal either status or wealth.
The classification of senior public-sector employees is subject to considerable false
negatives and positives as it is based on matching the Singapore Government directory by
21
name to legal filings of residential transactions. To match the two data sources, we limit to
unique names in the Government directory.
As Table 5, column (g), reports, the coefficient of the buyer being a senior public-
sector employee, -0.139 (s.e. 0.039), is negative and significant, suggesting that the odds of a
senior level public-sector employee purchasing a very lucky address are 𝑒−0.139 = 0.870
times, or 13 percent less than that of other buyers. This result is consistent with public-sector
employees both being less superstitious and engaging less in conspicuous spending.
However, an alternative interpretation of the empirical result is that the Singapore
government penalizes corruption severely, and so, public-sector employees refrain from
conspicuous consumption to avoid attention from the anti-corruption agency.
Yet another microeconomic factor is wealth. Johnson and Nye (2011) find some but
not conclusive evidence that Asian mothers giving birth in a dragon year have higher
incomes, which suggests that wealthier people are more superstitious. Feltovich et al. (2002)
predict unequivocally that people in the highest status do not signal. Accordingly, wealthier
people would not engage in conspicuous spending. Buyer wealth is especially important as it
is one of only two factors for which the hypotheses of superstition and conspicuous spending
generate contrasting predictions.
Lacking direct information on buyer wealth, we proxy buyer wealth in two ways.
One is whether they pay for the purchase in cash or through a mortgage loan. Presumably,
people who can afford to pay for a home in cash are wealthier than other buyers. The other
proxy is choice of residential area. People who buy in more expensive areas are probably
wealthier.
Table 5, column (h), reports an estimate including an indicator of a purchase financed
by a mortgage. The coefficient of mortgage, -0.047 (s.e. 0.030), which is not consistent with
superstition. The negative estimate is consistent with conspicuous spending, but it is
imprecise.
Separately, as Table 4, column (e), reports, the demand for lucky addresses in luxury
districts among Chinese buyers is weaker. The coefficient of the interaction between luxury
districts and Chinese buyer, -0.135 (s.e. 0.074), is negative and marginally significant. This
result is not consistent with wealthier people being more superstitious, but is consistent with
wealthier people engaging less in conspicuous spending. The result can also be interpreted in
another way consistent with the hypothesis of conspicuous spending. Buying in a luxury
district is already a strong signal, relative to which the marginal benefit of a lucky address
might be small and so people who buy homes in luxury areas signal status and wealth by
location rather than lucky address.
To check possible confounds among the demographic and economic factors, Table 5,
column (i), reports an estimate including all of the factors, except university degree, and

22
Table 5, column (j), reports an estimate including all of the factors. Three findings are robust
to the inclusion of other covariates: the negative effect of a Western name, the positive effect
of age, and the negative effect of senior public-sector employment. In particular, the negative
effect of a university science degree is not robust, possibly because university graduates tend
to be younger than average buyers, and so, the university degree partly captures the negative
effect of youth.
The third basket of factors is luck and uncertainty. Research in psychology suggests
that individuals rely on superstition as a way to cope with misfortune and uncertainty (Vyse
1997; Ang et al. 2014; Zhang et al. 2014). This suggests that people who experience negative
shocks or bad luck should more strongly prefer lucky addresses. By contrast, we do not
know of any reason why past bad luck should affect conspicuous spending.
We characterize bad luck by the number of civil legal actions for negligence in traffic
accidents prior to buying the apartment, distinguishing between the number of legal actions
as plaintiff and the number as defendant. The plaintiff, being the victim, is the more unlucky.
The defendant is also unlucky but to a lesser degree, considering that they (were alleged to
have) caused the accident.
Table 6, column (a), reports an estimate including the number of traffic accidents
leading to legal actions involving the buyer as plaintiff (if the purchase involves more than
one buyer, the variable is the simple average of the number of actions involving each of the
buyers). The coefficient, 0.102 (s.e. 0.042), is positive and significant. Table 6, column (b),
reports an estimate including the mean number of traffic accidents leading to legal actions
involving the buyer as defendant. The coefficient is positive, smaller than the coefficient of
the buyer as plaintiff, but not precisely estimated. These results are consistent with people
relying on superstition to cope with bad luck, and particularly the victim of a traffic accident
being unluckier than the injurer.
[Insert Table 6 here]
Another characterization of bad luck or uncertainty is SARS, which we characterize
by the months of March to June, 2003. The coefficient of SARS is positive but not
significant. However, the interpretation of this coefficient is possibly confounded by the
sharp concurrent macro-economic downturn, causing an income effect on the demand for
lucky addresses.
Yet another source of uncertainty is the quality of development. In Singapore, most
new high-rise apartments are sold before construction, and so, the buyer must rely on the plan
and a demonstration mock-up. It was only in July 2015 that the government issued
regulations stipulating that the demonstration apartment or model accurately represent the
actual apartment for sale and that location plans be drawn to scale and truthfully represent the
neighborhood. Buyers of new apartments face more uncertainty about construction and

23
appearance than buyers of resale apartments. If they are superstitious, they should more
strongly prefer lucky addresses and avoid unlucky addresses in the primary market. By
contrast, the hypothesis of conspicuous consumption does not have different implications for
the primary vis-à-vis secondary market.
Referring to Table 4, columns (c) and (i), the coefficient of Chinese buyers is 0.223
(s.e. 0.034) in the primary market (new sales) and 0.057 (0.025) in the secondary market
(subsales and resales). Indeed, Chinese buyers evince stronger preference for lucky addresses
in the primary market than the secondary market, which is consistent with people relying
more on superstition when facing more uncertainty.
7. Concluding Remarks
Applying empirical analysis to a very rich individual-level dataset of purchases of high-rise
apartments in Singapore, we find evidence of both superstition and conspicuous spending,
suggestive of heterogeneity among home buyers. The evidence of superstition is higher
demand for lucky addresses from older buyers, those who suffered from more traffic
accidents, and people buying new as contrasted with second-hand apartments, and lower
demand from buyers with Western names and senior public-sector employees. The evidence
of conspicuous spending is lower demand for lucky addresses in luxury districts and lower
demand from buyers with Western names and senior public-sector employees. On balance,
weighing the evidence for the two hypotheses, we consider that superstition explains a
somewhat larger part of Chinese buyers’ preference for lucky addresses.
However, it is important to appreciate that conspicuous spending is also essential to
understanding the demand for housing. The theory of reference dependent preferences and
loss aversion (Kahneman and Tversky 1979) predicts that a buyer’s willingness to accept an
unlucky address would be less than her willingness to pay for a lucky address. Yet, our
estimates (Table 3, column (c)), show that the discounts for unlucky addresses are not larger
than the premia for lucky addresses, which is not consistent with reference dependent
preferences and loss aversion. Conspicuous spending helps to explain this pattern of relative
prices.
Previous research emphasized the importance of understanding the role of
conspicuous spending in the demand for housing (Charles et al. 2009; Heffetz 2011). Here,
we find evidence of conspicuous spending on two particularly visible aspects of the home –
the address and location. While our study is specific to Singapore, the findings are
suggestive of consumer behavior in other housing markets. It is quite intuitive that home
buyers in other markets would pay more for homes in luxury neighborhoods to signal their
wealth and status. For instance, Los Angeles realtors advertise homes near to Beverly Hills
as “Beverly Hills adjacent”. Conspicuous spending on home location is an interesting

24
direction for future research.
Our findings also tie in with previous research into reference dependence in
residential housing markets (Genesove and Mayer 2001). To the extent that people pay less
for unlucky addresses, they will demand lower prices when they subsequently sell their
homes. Indeed, we find similar discounts for unlucky addresses in the secondary and primary
markets. The interaction between reference dependence and conspicuous spending on home
location is yet another interesting direction for future research.
References
Agarwal, Sumit, Ran Duchin, and Denis Sosyura. “In the mood for a loan: The causal effect
of sentiment on credit origination,” Working paper 2141030, SSRN, 2012.
Ang, Swee Hoon, Wai Kit Lai, and Siew Meng Leong. “The Effects of Superstition on
Choice and Latency,” Psychology and Marketing 31, no. 12 (December 2014): 1074-1083.
Charles, Kerwin Kofi, Erik Hurst, and Nikolai Roussanov. “Conspicuous spending and
Race,” Quarterly Journal of Economics 124, no. 2 (2009): 425-467.
Deaton, Angus, “Aging, Religion, and Health”, Chapter 8, 237-262, in David A. Wise,
Editor, Explorations in the Economics of Aging, 2011.
DellaVigna, Stefano. “Psychology and Economics: Evidence from the Field,” Journal of
Economic Literature 47, no. 2 (2009): 315-372.
Feltovich, Nick, Richmond Harbaugh, and Ted To. “Too cool for school? Signalling and
countersignalling,” RAND Journal of Economics 33, no. 4 (2002): 630-649.
Fortin, Nicole M., Andrew J. Hill, and Jeff Huang. “Superstition in the Housing Market,”
Economic Inquiry 52, no. 3 (2014): 974-993.
Genesove, David, and Christopher Mayer. “Loss Aversion and Seller Behavior: Evidence
from the Housing Market,” Quarterly Journal of Economics 116, no. 4 (2001): 1233-60.
Guryan, Jonathan, and Melissa S. Kearney. “Gambling at Lucky Stores: Empirical Evidence
from State Lottery Sales,” American Economic Review 98, no. 1 (2008): 458-473
Heffetz, Ori. “A test of conspicuous spending: Visibility and income elasticities,” Review of
Economics and Statistics 93, no. 4 (2011): 1101-1117.
Hirshleifer, David A., Ming Jian, and Huai Zhang, “Superstition and Financial Decision
Making”, Working paper, University of California, Irvine, 2012.
Hirshleifer, David, and Tyler Shumway. “Good Day Sunshine: Stock returns and the
Weather,” Journal of Finance 58, no. 3 (June 2003): 1009-1032.
Inland Revenue Authority of Singapore (IRAS), “For real estate and legal professionals:
Application for House Number”, http://www.iras.gov.sg/irashome/page04.aspx?id=3062#3
[Accessed, June 18, 2013].
Johnson, Noel D., and John V.C. Nye. “Does fortune favor dragons?” Journal of Economic
Behavior & Organization 78, no. 1 (2011) 85-97.

25
Kahneman, Daniel, and Amos Tversky. “Prospect Theory: An Analysis of Decision under
Risk,” Econometrica 47, no. 2 (1979): 263-91.
Kaus, Wolfhard. “Conspicuous spending and “race”: Evidence from South Africa,” Journal
of Development Economics 100, No. 1 (2013): 63-73.
Kliger, Doron, and Ori Levy, “Mood-induced variation in risk preferences,” Journal of
Economic Behavior & Organization 52, no. 4 (December 2003): 573-584.
Lepori, Gabriele, “Dark Omens in the Sky: Do Superstitious Beliefs Affect Investment
Decisions?” Working paper 1428792, SSRN, 2009.
Mocan, Naci, and Luiza Pogorelova, “Compulsory schooling laws and formation of beliefs:
Education, religion and superstition”, Working Paper 20557, National Bureau of Economic
Research, 2014.
Ng, Travis, Terence Chong, and Xin Du. “The Value of Superstitions,” Journal of Economic
Psychology 31, no. 3 (June 2010): 293-309.
Olivetti, Claudia, and M. Daniele Paserman. “In the Name of the Son (and the Daughter):
Intergenerational Mobility in the United States, 1850-1940,” American Economic Review
105, no. 8 (August 2014): 2695-2724.
Powdthavee, Nattavudh, and Yohanes E. Riyanto. “Would you pay for transparently useless
advice? A test of boundaries of beliefs in the folly of predictions,” Review of Economics and
Statistics 97, no. 2 (May 2015): 257-272.
Shum, Matthew, Wei Sun, and Guangliang Ye. “Superstition and “lucky” apartments:
Evidence from transaction-level data,” Journal of Comparative Economics 42, no. 1
(February 2014): 109-11.
Singapore Department of Statistics, Census of Population, 2010.
Singapore Department of Statistics, Yearbook of Statistics, 2013.
Vyse, Stuart A., Believing in Magic: The Psychology of Superstition, Oxford, England:
Oxford University Press, 1997.
USA Today, “Some hotels don’t skip the 13th floor anymore”, August 3, 2007.
Wei, Shang-Jin, Xiaobo Zhang, and Yin Liu, “Status competition and housing prices,” NBER
Working paper, 2012.
Wong, Maisy. “Estimating Ethnic Preferences Using Ethnic Housing Quotas in Singapore,”
Review of Economic Studies 80, no. 3 (2013): 1178-1214.
Zhang, Yan, Jane L. Risen, and Christine Hosey. “Reversing One’s Fortune By Pushing
Away Bad Luck,” Journal of Experimental Psychology: General 143, no. 3 (2014):1171-
1184.

26
Table 1. Lucky addresses: Type of sale and buyer ethnicity
VARIABLES (a) (b) (c) (d)
New sales Subsales
All buyers
Chinese Non-Chinese and resales:
All buyers
Very unlucky 0.013 0.013 0.013 0.016
(0.114) (0.114) (0.115) (0.126)
Unlucky 0.186 0.184 0.205 0.208
(0.389) (0.388) (0.404) (0.406)
Neutral 0.666 0.666 0.662 0.657
(0.472) (0.471) (0.473) (0.475)
Lucky 0.129 0.130 0.117 0.114
(0.335) (0.336) (0.321) (0.318)
Very lucky 0.006 0.006 0.003 0.005
(0.077) (0.079) (0.057) (0.069)
Observations 54,098 49,217 4,881 50,347
Notes: The samples comprise apartments sold in the years 2000-09. Each cell reports mean and
standard deviation. The apartment is considered as bought by Chinese buyers as long as one of the
buyers is a Chinese. By the Kolmogorov-Smirnov test, the distribution of addresses in the primary
market (new sales) is significantly different from that in the secondary market (subsales and resales)
at the 1% level, and the share of apartments with lucky or very lucky addresses is significantly higher
in the primary market than the secondary market at the 1% level.

27
Table 2. Summary statistics: New sales
(a) (b) (c) (d)
VARIABLES Unit Mean s.d. Min. Max.
Transactions 54,098
Apartment size Square meters 118.7 44.9 5.00 768.00
Unit price S$ per square meter 10,601 5,255 3,410 68,313
Very unlucky 0.013 0.114 0 1
Unlucky 0.186 0.389 0 1
Neutral 0.666 0.472 0 1
Lucky 0.129 0.335 0 1
Very lucky 0.006 0.077 0 1
99-year leasehold 0.494 0.500 0 1
999-year leasehold 0.044 0.205 0 1
Luxury district (1, 9, 10, 11) 0.224 0.417 0 1
Condominium 0.733 0.442 0 1
Floor number 9.588 8.129 1 68
Ground floor 0.056 0.230 0 1
Top floor 0.080 0.271 0 1
At least one Singaporean buyer indicator 0.809 0.393 0 1
At least one Chinese buyer indicator 0.910 0.287 0 1
At least one Cantonese buyer indicator 0.032 0.177 0 1
At least one Hokkien buyer indicator 0.060 0.237 0 1
At least one Teochew buyer indicator 0.016 0.126 0 1
At least one buyer with english
name
indicator 0.305 0.461 0 1
Mean buyer age >=46 0.244 0.429 0 1
Mean buyer age <=34 0.303 0.460 0 1
At least one buyer is senior
public sector employee
indicator 0.066 0.248 0 1
At least one buyer with univ.
degree
indicator 0.211 0.408 0 1
At least one buyer with science
degree
indicator 0.113 0.317 0 1
With mortgage 0.707 0.455 0 1
Mean number of traffic
accidents as plaintiff
0.038 0.187 0 9
Mean number of traffic
accidents as defendant
0.063 0.264 0 10
Notes: The sample comprises new sales of apartments between the years 2000-09. Transaction prices
are denominated in 2014 Singapore dollars per square meter (at the average exchange rate of one
Singapore dollar to 61 U.S. cents, a price of S$1000 per square meter is equivalent to US$56.75 per
square foot). Very lucky = last digit of both floor and apartment numbers is “8”; lucky = last digit of
either floor or apartment number is “8” and neither last digit is “4”; unlucky = last digit of either floor
or apartment number is “4” and neither last digit is “8”; very unlucky = last digit of both floor and
apartment numbers is “4”; neutral = all other addresses. Data on buyer’s age, working for public
sector, university degree, and numbers of car accidents is only available for Singaporean buyers.

28
Table 3. Lucky addresses: Prices
VARIABLES (a) (b) (c) (d) (e) (f)
New sales Subsales
2000-2009 1995-2012 and resales
Size (log) -0.001 -0.053 -0.111*** -0.111*** -0.124*** -0.130***
(0.041) (0.041) (0.018) (0.018) (0.015) (0.017)
Chinese buyers -0.131*** -0.036*** -0.014*** -0.013*** -0.024***
(0.013) (0.007) (0.003) (0.003) (0.003)
Non-Chinese 0.015***
buyers (0.003)
Very unlucky -0.040*** -0.014** -0.015*** -0.012*** -0.014*** -0.016***
(0.010) (0.005) (0.004) (0.004) (0.004) (0.005)
Unlucky -0.019*** -0.009*** -0.007*** -0.007*** -0.006*** -0.006***
(0.004) (0.003) (0.002) (0.002) (0.002) (0.002)
Lucky 0.012** 0.008*** 0.005** 0.006** 0.007*** 0.005*
(0.005) (0.003) (0.002) (0.002) (0.002) (0.002)
Very lucky 0.040*** 0.030*** 0.022*** 0.024*** 0.020*** 0.020**
(0.015) (0.010) (0.007) (0.008) (0.006) (0.009)
Non-Chinese -0.031**
x very unlucky (0.013)
Non-Chinese -0.001
x unlucky (0.005)
Non-Chinese -0.005
x lucky (0.007)
Non-Chinese -0.054
x very lucky (0.042)
Constant 9.130*** 9.461*** 9.718*** 9.704*** 9.462*** 9.799***
(0.190) (0.198) (0.092) (0.091) (0.091) (0.087)
Lease tenure Yes Yes Yes Yes Yes Yes
Condominium Yes Yes Yes Yes Yes Yes
Building age No No No No No Yes
(quadratic)
Floor controls Yes Yes Yes Yes Yes Yes
Postal district
f.e.
No Yes Yes Yes Yes Yes
Year f.e. Yes Yes Yes Yes Yes Yes
Quarter f.e. Yes Yes Yes Yes Yes Yes
Observations 54,098 54,098 54,098 54,098 69,075 50,347
R-squared 0.553 0.843 0.928 0.928 0.936 0.886 Notes: Dependent variable is the logarithm of price in Singapore dollars per square meter; Floor
controls include a linear trend in floor number, and indicators for first and top floors; Estimates are
robust to controlling for floor number with a quadratic trend; Robust standard errors clustered by
postal district (* p<0.1; ** p<0.05; *** p<0.01). Column (a): New sales to all buyers with controls;
Column (b): New sales to all buyers with controls and 2-digit postal district fixed effects; Column (b):
New sales to all buyers with controls and 4-digit postal district fixed effects; Column (d): New sales
distinguishing Chinese and non-Chinese buyers; Column (e): New sales, including earlier transactions
back to 1995 and forward to 2012; Column (f): Secondary market (subsales and resales) 1995-2012,
including quadratic control for age of building.

29
Table 4. Lucky addresses: Buyer choice
VARIABLES (a) (b) (c) (d) (e) (f) (g) (h) (i)
New sales Subsales
All
buyers
All
buyers
All
buyers
(preferred)
All
buyers
Luxury
areas
Excl
mixed
addresses
Buildings
at least 8
floors
1995-
2012
and
resales
Chinese buyers 0.183*** 0.220*** 0.223*** 0.169*** 0.274*** 0.223*** 0.266*** 0.218*** 0.057**
(0.033) (0.032) (0.034) (0.049) (0.040) (0.034) (0.036) (0.029) (0.025)
Singaporean buyers -0.070
(0.063)
Singaporean x Chinese 0.097
(0.066)
Chinese x luxury -0.135*
(0.074)
Size (log) 0.407*** 0.442*** 0.558*** 0.558*** 0.557*** 0.564*** 0.623*** 0.456*** 0.263***
(0.058) (0.061) (0.076) (0.076) (0.076) (0.077) (0.096) (0.064) (0.067)
Lease tenure Yes Yes Yes Yes Yes Yes Yes Yes Yes
Condominium Yes Yes Yes Yes Yes Yes Yes Yes Yes
Floor control Yes Yes Yes Yes Yes Yes Yes Yes Yes
Postal district f.e. No 2-digit 4-digit 4-digit 4-digit 4-digit 4-digit 4-digit 4-digit
Year f.e. Yes Yes Yes Yes Yes Yes Yes Yes Yes
Quarter f.e. Yes Yes Yes Yes Yes Yes Yes Yes Yes
Building age
(quadratic)
No No No No No No No No Yes
Observations 54,098 54,098 54,098 54,098 54,098 53,132 44,562 69,075 50,347 Notes: Ordered logit model of demand for very lucky, lucky, neutral, unlucky, and very unlucky addresses, estimated by maximum likelihood;
Ordered logit cut-points not reported; Floor controls include a linear trend in floor number, and indicators for first and top floors; Robust standard
errors clustered by postal district except for column (a) (* p<0.1; ** p<0.05; *** p<0.01). Column (a): New sales with controls; Column (b): New
sales with controls and 2-digit postal district fixed effects; Column (c): New sales with controls and 4-digit postal district fixed effects (preferred
estimate); Column (d): New sales, distinguishing between Singapore and non-Singaporean Chinese buyers; Column (e): New sales, luxury areas
(Districts 1, 9, 10, and 11); Column (f): New sales, excluding mixed addresses such as 08-04; Column (g): New sales, buildings with 8 or more
floors; Column (h): New sales, including earlier transactions back to 1995 and forward to 2012; Column (i): Secondary market (subsales and
resales) 1995-2012, including quadratic control for age of building.

30
Table 5. Singaporean Chinese buyers: Demographics and economics
VARIABLES (a)
Dialect
groups
(b)
Western
name
(c)
Age
(d)
University
graduates
(e)
Science
graduates
(f)
Science /
other
(g)
Public-
sector
(h)
Mort-
gage
(j)
Combined
(j)
Combined
Cantonese 0.022 0.020 0.020
(0.056) (0.058) (0.058)
Hokkien 0.059 0.051 0.051
(0.042) (0.042) (0.042)
Teochew 0.086 0.073 0.073
(0.074) (0.076) (0.076)
Western name -0.049** -0.042* -0.040*
(0.022) (0.023) (0.022)
Mean age of 0.124*** 0.110*** 0.113***
buyers >=46 (0.028) (0.029) (0.029)
Mean age of -0.032 -0.025 -0.027
buyers <=34 (0.028) (0.028) (0.028)
University -0.034 0.005 0.033
degree (0.024) (0.036) (0.035)
University -0.069** -0.073 -0.040 -0.067
science degree (0.033) (0.047) (0.035) (0.047)
Public-sector -0.139*** -0.134*** -0.138***
employee (0.039) (0.041) (0.042)
Mortgage -0.047 -0.018 -0.019
(0.030) (0.030) (0.030)
Apartment
characteristics
Yes Yes Yes Yes Yes Yes Yes Yes Yes Yes
4-digit postal
district f.e.
Yes Yes Yes Yes Yes Yes Yes Yes Yes Yes
Year f.e. Yes Yes Yes Yes Yes Yes Yes Yes Yes Yes
Quarter f.e. Yes Yes Yes Yes Yes Yes Yes Yes Yes Yes
Observations 39,789 39,789 37,203 39,789 39,789 39,789 39,789 39,789 37,203 37,203 Notes: Singaporean Chinese buyers; Ordered logit model of demand for very lucky, lucky, neutral, unlucky, and very unlucky addresses, estimated by maximum likelihood; Apartment characteristics include size, floor, legal tenure, and condominium; Ordered logit cut-points not reported; Robust standard errors clustered by postal district (* p<0.1; ** p<0.05; *** p<0.01). Column (a): Including
proportion of buyers by dialect groups; Column (b): Including proportion of buyers with Western given name; Column (c): Including buyers by mean age; Column (d): Including proportion of buyers
who are university graduates; Column (e): Including proportion of buyers who are university graduates in science or technology disciplines; Column (f): Including proportions of buyers who are university graduates and buyers who are science or technology graduates; Column (g): Including proportion of buyers who are employed in the public sector; Column (h): Including indicator of
purchases financed by mortgage loans; Column (i): Including all demographic and economic covariates except university graduate; Column (i): Including all demographic and economic covariates.

31
Table 6. Singaporean Chinese buyers: Misfortune and uncertainty
VARIABLES (a)
Traffic
accidents
plaintiff
(b)
Traffic
accidents
defendant
(c)
SARS
(d)
Combined
Mean number of traffic 0.102** 0.099**
accidents as plaintiff (0.042) (0.043)
Mean number of traffic 0.023 0.012
accidents as defendant (0.038) (0.038)
SARS -0.002 -0.005
(0.133) (0.132)
Apartment characteristics Yes Yes Yes Yes
4-digit postal district f.e. Yes Yes Yes Yes
Year f.e. Yes Yes Yes Yes
Quarter f.e. Yes Yes Yes Yes
Observations 41,568 41,568 41,568 41,568
Notes: Singaporean Chinese buyers; Ordered logit model of demand for very lucky, lucky, neutral,
unlucky, and very unlucky addresses, estimated by maximum likelihood; Apartment characteristics
include size, floor, legal tenure, and condominium; Ordered logit cut-points not reported; Robust standard
errors clustered by 4-digit postal district (* p<0.1; ** p<0.05; *** p<0.01). Column (a): Including mean
number of traffic accidents buyer was involved as plaintiff; Column (b): Including mean number of traffic
accidents buyer was involved as defendant; Column (c): SARS (March to June 2003);
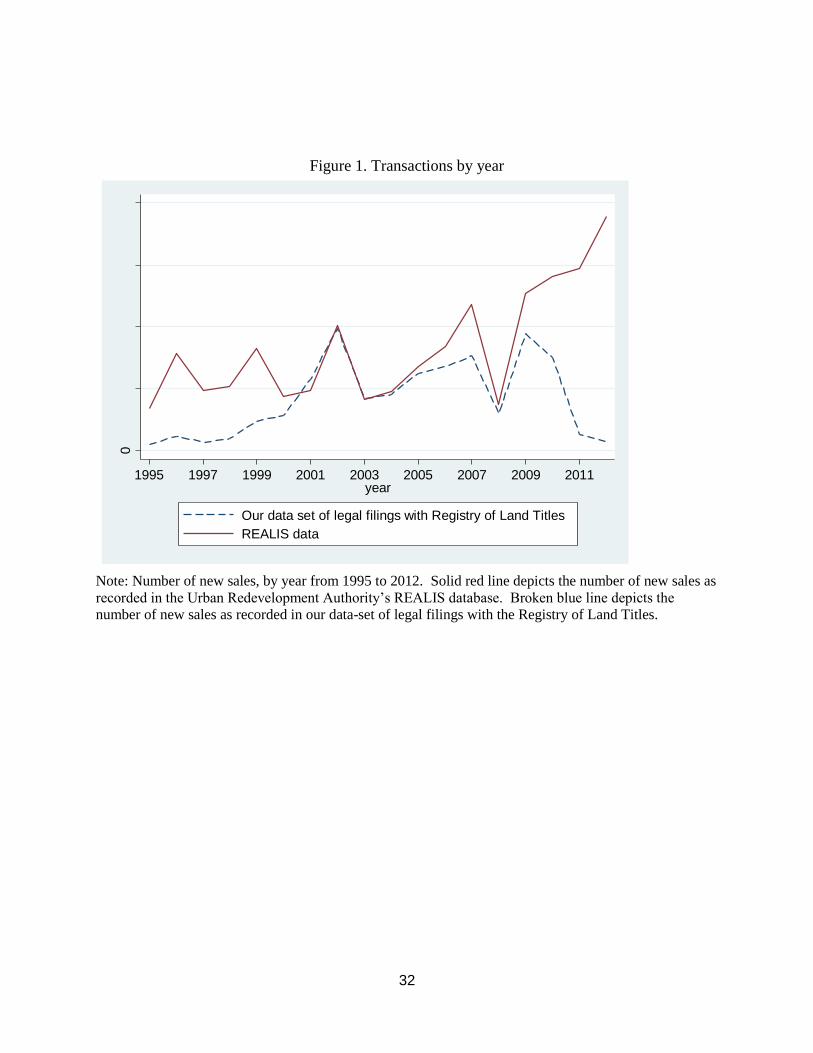
32
Figure 1. Transactions by year
Note: Number of new sales, by year from 1995 to 2012. Solid red line depicts the number of new sales as
recorded in the Urban Redevelopment Authority’s REALIS database. Broken blue line depicts the
number of new sales as recorded in our data-set of legal filings with the Registry of Land Titles.
0
5000
10000
15000
20000
1995 1997 1999 2001 2003 2005 2007 2009 2011year
Our data set of legal filings with Registry of Land Titles
REALIS data

33
Figure 2. Price and floor number
Note: The figure plots the estimated coefficients of the floor levels in a regression of the logarithm of unit
price per square meter on indicators of floor number and last digit of unit number, apartment size, and
building fixed effects.
Figure 3. Price and unit number
Notes: The Figure plots the estimated coefficients of the last digit of the unit number in a regression of the
logarithm of price per square meter on indicators of the last digit of the unit number.

34
Table S1. Lucky addresses: Prices -- Additional estimates
VARIABLES (a)
6-digit postal code
fixed effects
(b)
Singaporean
buyers
Size (log) -0.150*** -0.132***
(0.011) (0.020)
Chinese buyers -0.008***
(0.002)
Non-Chinese buyers 0.007*
(0.004)
Very unlucky -0.014*** -0.011**
(0.003) (0.005)
Unlucky -0.004*** -0.008***
(0.002) (0.002)
Lucky 0.006*** 0.007***
(0.002) (0.002)
Very lucky 0.019*** 0.027***
(0.007) (0.007)
Non-Chinese x very unlucky -0.031*
(0.018)
Non-Chinese x unlucky -0.010
(0.007)
Non-Chinese x lucky -0.004
(0.010)
Non-Chinese x very lucky -0.079
(0.086)
Constant 9.741*** 9.782***
(0.056) (0.098)
Lease tenure Yes Yes
Condominium Yes Yes
Floor controls Yes Yes
Postal district fixed effects 6-digit 4-digit
Year fixed effects Yes Yes
Quarter fixed effects Yes Yes
Observations 54,098 43,784
R-squared 0.969 0.926 Notes: Dependent variable is the logarithm of price in Singapore dollars per square meter; Robust
standard errors clustered by postal districts (* p<0.1; ** p<0.05; *** p<0.01). Floor controls include a
linear trend in floor number, and indicators for first and top floors; Estimates are robust to controlling for
floor number with a quadratic trend.

35
Table S2. Annualized rate of return
(a) (b) (c)
All Trim top Trim top
VARIABLES & bottom 1% & bottom 1%
Very unlucky -0.002 -0.004 -0.002
(0.008) (0.007) (0.005)
Unlucky -0.002 -0.000 0.000
(0.002) (0.002) (0.001)
Lucky 0.001 -0.002 -0.003**
(0.003) (0.002) (0.001)
Very lucky 0.000 -0.007 -0.004
(0.011) (0.005) (0.005)
Constant 0.176*** 0.181*** 0.153***
(0.004) (0.004) (0.014)
Apartment characteristics No No Yes
Year of new sale f.e. Yes Yes Yes
Quarter of new sale f.e. Yes Yes Yes
Year of resale f.e. Yes Yes Yes
Quarter of resale f.e. Yes Yes Yes
Observations 5,284 5,126 5,126
R-squared 0.465 0.476 0.702
Mean of dependent .032 .028 .028 Notes: Sample comprises apartments with both new sale and resale transactions between 2000 and 2009;
Dependent variable is annualized rate of return; Apartment characteristics include size, floor, legal tenure,
condominium, and 4-digit postal code; Robust standard errors clustered by 4-digit postal district (* p<0.1;
** p<0.05; *** p<0.01).

36
Table S3: Uncertainty: Additional estimates
(a) (b)
VARIABLES GDP Consumption
Gross Domestic Product -0.071
forecast uncertainty (0.091)
Private consumption -0.044
forecast uncertainty (0.051)
Apartment characteristics Yes Yes
4-digit postal district fixed effects Yes Yes
Year f.e. Yes Yes
Quarter f.e. Yes Yes
Observations 41,568 41,568
Notes: Singaporean Chinese buyers; Ordered logit model of demand for very lucky, lucky, neutral,
unlucky, and very unlucky addresses, estimated by maximum likelihood; Apartment characteristics
include size, floor, legal tenure, and condominium; Ordered logit cut-points not reported; Robust standard
errors clustered by 4-digit postal district (* p<0.1; ** p<0.05; *** p<0.01). Column (a): Gross Domestic
Product forecast uncertainty is the standard deviation of analysts’ predicted rate of GDP growth; Column
(b): Private consumption forecast uncertainty is the standard deviation of analysts’ predicted rate of
growth of private consumption. Source of forecasts: Monetary Authority of Singapore.