Superrotation in Terrestrial Atmospheres - Climate...
16
Superrotation in Terrestrial Atmospheres ANNE L. LARAIA California Institute of Technology, Pasadena, California TAPIO SCHNEIDER ETH Z€ urich, Zurich, Switzerland, and California Institute of Technology, Pasadena, California (Manuscript received 22 January 2015, in final form 2 July 2015) ABSTRACT Atmospheric superrotation with prograde equatorial winds and an equatorial angular momentum maxi- mum is ubiquitous in planetary atmospheres. It is clear that eddy fluxes of angular momentum toward the equator are necessary to generate it. But under what conditions superrotation arises has remained unclear. This paper presents simulations and a scaling theory that establish conditions under which superrotation occurs in terrestrial atmospheres. Whether superrotation arises depends on the relative importance of factors that favor or disfavor superrotation. Convection preferentially generates Rossby waves near the equator, where the Rossby number is O(1). Since the Rossby waves transport angular momentum toward their source regions, this favors superrotation. Meridional temperature gradients preferentially lead to baroclinic in- stability and wave generation away from the equator. Eddy transport of angular momentum toward the baroclinic source region implies transport out of low latitudes, which disfavors superrotation. Simulations with an idealized GCM show that superrotation tends to arise when the equatorial convective generation of wave activity and its associated eddy angular momentum flux convergence exceed the baroclinic eddy angular momentum flux divergence. Convective and baroclinic wave activity generation is related through scaling arguments to mean-flow properties, such as planetary rotation rates and meridional temperature gradients. The scaling arguments show, for example, that superrotation is favored when the off-equatorial baroclinicity and planetary rotation rates are low, as they are, for example, on Venus. Similarly, superrotation is favored when the convective heating strengthens, which may account for the superrotation seen in extreme global warming simulations. 1. Introduction Atmospheric superrotation refers to a local angular momentum maximum in the fluid interior. Because an- gular momentum must decrease toward the poles for the flow to be inertially stable, atmospheric superrotation usually means equatorial superrotation: that is, a local angular momentum maximum at the equator (Held 1999). Such atmospheric superrotation may be the norm rather than the exception. Venus and Titan have super- rotating atmospheres (Schubert 1983; Gierasch et al. 1997; Kostiuk et al. 2001). Jupiter’s and Saturn’s atmo- spheres also superrotate (Porco et al. 2003; Sánchez- Lavega et al. 2007), but because they do not have a solid surface, they superrotate relative to the rotation of their cores and magnetic fields. For an atmosphere to super- rotate, it needs to have angular momentum fluxes into the region of superrotation (Hide 1969). Inviscid axisym- metric circulations cannot accomplish this upgradient angular momentum transport; eddies must be involved (Held and Hou 1980; Schneider 2006). In general, in sufficiently rapidly rotating atmospheres, eddy angular momentum fluxes converge into the regions in which wave activity is generated, and they diverge where wave activity is dissipated (Held 1975; Andrews and Mcintyre 1976; Edmon et al. 1980). Thus, preferential wave activity generation near the equator is a prerequisite for super- rotation. This must not be overcompensated by wave activity dissipation near the equator, for example, asso- ciated with baroclinic eddies that are generated in mid- latitudes and dissipate preferentially in lower latitudes, as they do on Earth (Saravanan 1993). Corresponding author address: Tapio Schneider, ETH Zürich, Sonneggstr. 5, 8092 Zurich, Switzerland. E-mail: [email protected] NOVEMBER 2015 LARAIA AND SCHNEIDER 4281 DOI: 10.1175/JAS-D-15-0030.1 Ó 2015 American Meteorological Society
-
Upload
nguyendien -
Category
Documents
-
view
216 -
download
0
Transcript of Superrotation in Terrestrial Atmospheres - Climate...

Superrotation in Terrestrial Atmospheres
ANNE L. LARAIA
California Institute of Technology, Pasadena, California
TAPIO SCHNEIDER
ETH Z€urich, Zurich, Switzerland, and California Institute of Technology, Pasadena, California
(Manuscript received 22 January 2015, in final form 2 July 2015)
ABSTRACT
Atmospheric superrotation with prograde equatorial winds and an equatorial angular momentum maxi-
mum is ubiquitous in planetary atmospheres. It is clear that eddy fluxes of angular momentum toward the
equator are necessary to generate it. But under what conditions superrotation arises has remained unclear.
This paper presents simulations and a scaling theory that establish conditions under which superrotation
occurs in terrestrial atmospheres. Whether superrotation arises depends on the relative importance of factors
that favor or disfavor superrotation. Convection preferentially generates Rossby waves near the equator,
where the Rossby number isO(1). Since the Rossby waves transport angular momentum toward their source
regions, this favors superrotation. Meridional temperature gradients preferentially lead to baroclinic in-
stability and wave generation away from the equator. Eddy transport of angular momentum toward the
baroclinic source region implies transport out of low latitudes, which disfavors superrotation. Simulations
with an idealized GCM show that superrotation tends to arise when the equatorial convective generation of
wave activity and its associated eddy angularmomentumflux convergence exceed the baroclinic eddy angular
momentum flux divergence. Convective and baroclinic wave activity generation is related through scaling
arguments to mean-flow properties, such as planetary rotation rates and meridional temperature gradients.
The scaling arguments show, for example, that superrotation is favored when the off-equatorial baroclinicity
and planetary rotation rates are low, as they are, for example, on Venus. Similarly, superrotation is favored
when the convective heating strengthens, which may account for the superrotation seen in extreme global
warming simulations.
1. Introduction
Atmospheric superrotation refers to a local angular
momentum maximum in the fluid interior. Because an-
gular momentum must decrease toward the poles for the
flow to be inertially stable, atmospheric superrotation
usually means equatorial superrotation: that is, a local
angular momentum maximum at the equator (Held
1999). Such atmospheric superrotation may be the norm
rather than the exception. Venus and Titan have super-
rotating atmospheres (Schubert 1983; Gierasch et al.
1997; Kostiuk et al. 2001). Jupiter’s and Saturn’s atmo-
spheres also superrotate (Porco et al. 2003; Sánchez-Lavega et al. 2007), but because they do not have a solid
surface, they superrotate relative to the rotation of their
cores and magnetic fields. For an atmosphere to super-
rotate, it needs to have angularmomentumfluxes into the
region of superrotation (Hide 1969). Inviscid axisym-
metric circulations cannot accomplish this upgradient
angular momentum transport; eddies must be involved
(Held and Hou 1980; Schneider 2006). In general, in
sufficiently rapidly rotating atmospheres, eddy angular
momentum fluxes converge into the regions in which
wave activity is generated, and they diverge where wave
activity is dissipated (Held 1975; Andrews and Mcintyre
1976; Edmon et al. 1980). Thus, preferential wave activity
generation near the equator is a prerequisite for super-
rotation. This must not be overcompensated by wave
activity dissipation near the equator, for example, asso-
ciated with baroclinic eddies that are generated in mid-
latitudes and dissipate preferentially in lower latitudes, as
they do on Earth (Saravanan 1993).
Corresponding author address: Tapio Schneider, ETH Zürich,Sonneggstr. 5, 8092 Zurich, Switzerland.
E-mail: [email protected]
NOVEMBER 2015 LARA IA AND SCHNE IDER 4281
DOI: 10.1175/JAS-D-15-0030.1
� 2015 American Meteorological Society

Various mechanisms are available for preferential
wave activity generation near the equator. A stationary
heat source near the equator, for example, leads to the
generation of stationary Rossby waves, which can dis-
sipate away from the equator and so transport angular
momentum toward the equator. This leads to super-
rotation when the heat source is strong enough (Suarez
and Duffy 1992; Saravanan 1993; Kraucunas and
Hartmann 2005; Arnold et al. 2012). The stationary
wave mechanism is responsible for superrotation in
simulations of tidally locked planets, in which stellar
heating is radially symmetric around an equatorial focal
point (Joshi et al. 1997; Merlis and Schneider 2010;
Pierrehumbert 2011). For a planet without deviations
from axisymmetry in boundary conditions, it is less ob-
vious whywaves should be preferentially generated near
the equator. Wang and Mitchell (2014) and Pinto and
Mitchell (2014) find that a Rossby–Kelvin instability
produces angular momentum flux convergence at the
equator that is responsible for the generation of super-
rotation in statically stable atmospheres. In convecting
atmospheres, the variation of the Rossby number with
latitude provides an alternative mechanism: Near the
equator, where the Rossby number can be O(1), hori-
zontal and temporal temperature variations are small
when the Froude number is small. Therefore, fluctua-
tions in convective heating must be balanced by vertical
motion and hence by horizontal divergence at the level
of the convective outflows in the upper troposphere
(Charney 1963; Sobel et al. 2001). The horizontal di-
vergence then can generate large-scale rotational flow
and therebyRossbywaves, either by vortex stretching or
vorticity advection (Sardeshmukh andHoskins 1988). In
contrast, in higher latitudes, where theRossby number is
small, convective heating fluctuations can, for example,
be balanced by transient temperature fluctuations,
which may relax radiatively without generating large-
scale waves that dissipate in other latitude bands. The
net result is preferential generation of Rossby waves
near the equator by convective heating fluctuations. If
some of these convectively generated Rossby waves
dissipate at higher latitudes—for example, through in-
teraction with the mean-flow shear—they will transport
angular momentum toward the equator and thus can
generate superrotation (Schneider and Liu 2009; Liu
and Schneider 2010).
However, angular momentum flux convergence asso-
ciated with preferential wave activity generation at the
equatormay be counterbalanced or overcompensated by
angular momentum flux divergence associated with dis-
sipation of wave activity that was generated at higher
latitudes (e.g., by baroclinic instability) (Saravanan
1993). This is the case in Earth’s troposphere in the
annual mean, and it may be the case on Uranus and
Neptune, which are subrotating (Liu and Schneider
2010). Only when the baroclinically unstable region is
moved into low latitudes by artificially increasing ra-
diative heating gradients near the equator and reducing
them in higher latitudes can baroclinic instability pro-
mote the onset of superrotation (Williams 2003).
Here, we focus on equatorial superrotation on ter-
restrial planets: that is, planets with solid surfaces with
a distribution of radiative heating rates resembling
Earth’s. We explore a wide parameter regime that en-
compasses subrotating (Earth like) and superrotating
atmospheres. Our goal is to elucidate the mechanisms
that generate and maintain tropospheric superrotation
in convecting atmospheres and quantify the conditions
under which superrotation generally arises.1 We quan-
tify the relative importance of the angular momentum
fluxes associated with equatorial convectively generated
waves and off-equatorial baroclinic eddies. We use
simulations with an idealized GCM to demonstrate that
whether superrotation occurs in terrestrial atmospheres
depends on the competition between the two, and we
use scaling arguments to estimate their relative impor-
tance in terms of mean-flow quantities and external
parameters.
2. Idealized GCM and simulations
The idealized GCM used for the simulations is based
on the dynamical core of the Geophysical Fluid Dy-
namics Laboratory’s Flexible Modeling System. It
performs a time integration of the primitive equations of
motion on a sphere with Earth’s radius, using the spec-
tral transform method in the horizontal and using 30
s levels in the vertical. Here, s5p/ps is a dimensionless
vertical coordinate, where p is the pressure and ps is the
surface pressure; it ranges from 1 at the surface to 0 at
the top of the atmosphere. All simulations were per-
formed at T85 horizontal resolution.
Neither seasonal nor diurnal cycles of insolation are
included in this model, and there is no topography. The
GCM treats the atmosphere as an ideal gas without a
hydrologic cycle. The effects of moisture are generally
ignored, but they are implicit in a convection parame-
terization, which relaxes atmospheric temperatures to
a profile with lapse rate equal to a fraction g# 1 of
the dry adiabatic lapse rate Gd 5 g/cp ’ 9:8Kkm21.
1 Superrotation can also occur in the stratosphere, for example,
during the westerly phase of the quasi-biennial oscillation. The
mechanisms responsible for that are different from those in the
troposphere, which is our focus here.
4282 JOURNAL OF THE ATMOSPHER IC SC IENCES VOLUME 72

Whenever an atmospheric column is less stable than
the specified convective lapse rate gGd, a dry convec-
tion scheme relaxes temperatures to a profile with the
convective lapse rate, while conserving the column-
integrated enthalpy (Schneider andWalker 2006). That
is, the convection scheme assumes that the kinetic en-
ergy of the convection is locally dissipated on the
convective (subgrid) scale so that the enthalpy on the
large (grid) scale is conserved. The rescaling factor
g mimics the effect of latent heat release in moist con-
vection, with smaller g corresponding to more latent
heat release.
A Newtonian relaxation scheme represents radia-
tive forcing by relaxing temperatures toward radiative-
equilibrium temperatures Te. Unlike the usual statically
stable equilibrium temperature fields used in many
idealized dry GCMs, these radiative-equilibrium tem-
peratures are statically unstable in the lower andmiddle
troposphere. The radiative-equilibrium surface tem-
perature in the model is a function of latitude f and is
given by
Tes (f)5
~Tes 1D
hcos2f . (1)
The radiative-equilibrium surface temperature at the
pole is fixed at ~Tes 5 260K in all simulations. Radiative-
equilibrium temperatures in the atmosphere above
the surface are those of a semigray atmosphere with a
water vapor–like absorber. Their meridional gradient
smoothly decays to zero at the top of the atmosphere,
where the radiative-equilibrium temperature is a con-
stant 200K. See Schneider (2004) formore details on the
Newtonian relaxation scheme and Schneider and
Walker (2006) for a more detailed model description.
The only difference between our model and that de-
scribed in Schneider and Walker (2006) is that we rep-
resent subgrid-scale dissipation by an exponential cutoff
filter (Smith et al. 2002), with a damping time scale of
4min on the smallest resolved scale and a cutoff wave-
number of 21 below which subgrid-scale dissipation is
zero. Weaker subgrid-scale damping would have suf-
ficed for many simulations but led to substantial noise in
some superrotating simulations, especially the ones with
weakmeridional temperature gradients andmore stable
convective lapse rates. Thus, we use the stronger
damping for all simulations to be consistent. We also
found the magnitude of the superrotating wind speed to
be quite sensitive to the damping time scale of the
subgrid-scale dissipation.
We performed 60 simulations by varying three model
parameters: the pole–equator temperature contrast in
radiative equilibrium Dh, the planetary rotation rate V,
and the rescaling parameter g in the convective lapse
rate gGd. Table 1 shows the different parameter values
used to create a range of different climate scenarios. We
chose to vary these parameters because, based on pre-
vious work (e.g., Del Genio et al. 1993; Del Genio and
Zhou 1996; Liu and Schneider 2011; Mitchell and Vallis
2010; Potter et al. 2014; Pinto and Mitchell 2014), they
seemed to be pertinent to the generation of super-
rotation. Because rescaling the planetary rotation rate
in a hydrostatic model like ours is dynamically equiva-
lent to rescaling both the planetary radius and diabatic
heating rates (e.g., Kuang et al. 2005; Garner et al. 2007),
we did not consider separate variations of the planetary
radius. However, variations of diabatic time scales
would be interesting to explore systematically in a future
study (cf. Yamamoto and Takahashi 2006; Pinto and
Mitchell 2014).
All simulations were integrated for at least 1500 days,
and the model output is averaged over the last 400 days
of each simulation.
3. Results
a. Circulation variations
Our goal is to determine why some simulations
superrotate and some do not. Figure 1 displays two
superrotating and two subrotating simulations. The left
column shows the eddy angular momentum flux di-
vergence (colors) and zonal wind (black contours), and
the right column shows the mass flux streamfunction,
with solid lines for counterclockwise rotation and dotted
lines for clockwise rotation. The top row shows an Earth-
like reference simulation, with Earth’s rotation rate
V5Ve, a convective lapse rate of G’ 6:9Kkm21
(g5 0:7), and pole–equator radiative-equilibrium tem-
perature contrast of Dh 5 120K. As on Earth, there are
two westerly jets located in the upper troposphere in
midlatitudes, with weak easterlies at the equator and
poles. In the right column, we can see the Hadley circu-
lation in the tropics and the Ferrel cells in midlatitudes.
The simulation in the second row has the same Earth-
like parameter values for convective lapse rate and
pole–equator temperature contrast but a planetary
TABLE 1. Parameters varied in the 60 simulations: planetary
rotation rate V (as a multiple of Earth’s rotation rate Ve), pole–
equator temperature contrast in radiative equilibrium Dh, and re-
scaling parameter g of the convective lapse rate G5 gGd.
Parameter Values
V (2, 1, 221, 222, 223) 3 Ve
Dh 30, 60, 120, 240K
g 0.5, 0.7, 0.9
NOVEMBER 2015 LARA IA AND SCHNE IDER 4283

rotation rate V5Ve/8. The westerly jets are situated
farther poleward, and the surface easterlies at the
equator are very weak. The equatorial upper tropo-
sphere is strongly superrotating, with strong eddy an-
gular momentum flux convergence in the superrotating
region. The Hadley cells have expanded poleward as
well, as is to be expected for lower planetary rotation
rates (Walker and Schneider 2006).
The simulation in the third row is one with Earth’s
parameter values, except for a smaller, more stable
convective lapse rate G’ 4:9Kkm21 (g5 0:5). The
Hadley cells weaken (note the difference in contour
interval among the different simulations) because the
reduced baroclinicity implies reduced eddy angular
momentum flux divergence in the subtropics (Walker
and Schneider 2006; Schneider and Walker 2008).
FIG. 1. (left) Zonal-mean zonal wind (black contours; contour interval: 5m s21) and eddy angularmomentum flux
divergence (colors; 1026 m s22) in the latitude–sigma plane. The thick black line is the zero zonal-wind contour.
(right) Eulerian-mean mass flux streamfunction, with contour intervals given in each panel. Four simulations are
shown, with their parameter values indicated in the left column.
4284 JOURNAL OF THE ATMOSPHER IC SC IENCES VOLUME 72

Additionally, the zonal jets extend farther equatorward
than in the reference simulation in the top row.
The simulation in the bottom row differs from the
simulation above it only in the reduced pole–equator
radiative-equilibrium temperature contrast of Dh 5 30K.
Decreasing the baroclinicity of the atmosphere produces a
superrotating atmospherewith amuchweakermeridional
circulation.
All other parameters held constant, a decrease in the
planetary rotation rate generally leads to an increase in
the average equatorial wind speed (Fig. 2). There are
deviations from this behavior that occur at the lowest
rotation rates, when the midlatitude westerly jets mi-
grate toward the poles, as was already seen in simula-
tions by Del Genio and Zhou (1996).
For faster planetary rotation rates, the equatorial winds
become more westerly with decreasing Dh (cf. third and
fourth rows in Fig. 1). This is in line with the notion that
larger meridional temperature gradients produce stron-
ger baroclinic instability in midlatitudes, leading to off-
equatorial wave generation and angular momentum flux
divergence near the equator. For slower rotation rates,
however, the opposite is true. In these cases, the atmo-
spheres are superrotating at every value of Dh we ex-
plored, and the superrotation becomes more pronounced
for larger Dh (Fig. 2). So, for a subrotating atmosphere,
reducing the meridional temperature gradient can even-
tually lead to superrotation. On the other hand, de-
creasing the meridional temperature gradient when the
atmosphere is strongly superrotating (e.g., for a slowly
rotating planet) can weaken the superrotation.
b. Relation to wave activity sources
Why do some simulations superrotate while others do
not? Quantifying the amount of equatorial eddy angular
momentum flux divergence and convergence owing to
convective and baroclinic sources provides insight. As
stated above, there must be a wave activity source at the
equator that produces eddy angular momentum fluxes
directed into the equatorial region in order to generate and
sustain the angular momentum maximum there. Making
the weak temperature gradient approximation near the
equator, we write the vorticity equation neglecting the
baroclinic term, the twisting–tilting term, and friction:
›za
›t1 v
C� =
hza’2z
a(=
h� v
x)2 (v
x� =
hza)5R .
(2)
Here, za is the absolute vorticity, vx 1 vC 5 v is the
horizontal velocity decomposed into its rotational (C)
and divergent (x) components, and =h denotes the
horizontal components of the del operator. Following
Sardeshmukh and Hoskins (1988) and Schneider and
Liu (2009), we define the Rossby wave source as the
fluctuating part of the right-hand side of this equation,
R0 5R2R, with the overbar denoting a zonal mean and
primes denoting deviations therefrom.
The vorticity equation implies the approximate eddy
enstrophy equation:.
1
2
›z02
›t1 y0Cz
0›yza’R0z0 , (3)
where yC is the rotational component of the meridional
velocity y, and y5 af is the meridional coordinate, with
planetary radius a. Advection of eddy vorticity by the
eddies themselves (the triple correlation term) is ne-
glected. In a statistically steady state and under the as-
sumption that za 6¼ 0, the wave activity balance at the
equator can then be written as (Andrews and Mcintyre
1976; Andrews and McIntyre 1978; Edmon et al. 1980;
Schneider and Liu 2009)
G5R0z0
›yza
5 y0Cz0 52
1
cosfdiv(u0
Cy0C cosf) , (4)
where div is the meridional divergence operator. The
first equality defines G, the generation of wave activity
z02/(2›yza). Where G is positive, wave activity is gener-
ated, and the eddy flux of angular momentum associated
with the rotational flow converges; where G is negative,
wave activity is dissipated, and the eddy flux of angular
momentum associated with the rotational flow diverges.
Because the bulk of the eddy flux of angular momentum
is associated with the rotational (geostrophic) flow,
convergence/divergence of the eddy angularmomentum
flux u0Cy
0C cosf associated with the rotational flow is
FIG. 2. Upper-tropospheric zonal wind at the equator vsV/Ve, with
fixed values of Dh and g. For all three curves, g5 0:7.
NOVEMBER 2015 LARA IA AND SCHNE IDER 4285

essentially synonymous with convergence/divergence of
the overall eddy angular momentum flux u0y0 cosf.We will use
hG1e i5
1
Df
ð158
258
1
Ds
ðst
st1Ds
G1 cosf ds df , (5)
the cosine-weighted average of only the positive valuesG1
ofG in the equatorial upper troposphere, as a measure of
the wave activity generation in the equatorial region and,
hence, as ameasure of equatorially generated eddy angular
momentum flux convergence, 2div(u0y0 cosf)e. Here, the
subscript e represents an average over the equatorial re-
gion between 258 and 158. Angle brackets represent an
average over a fixed depth in the upper troposphere, taken
from the equatorial tropopause (defined using a critical
lapse rate of 2Kkm21) at the level st 5 pt/ps to the level
lying Ds5Dp/ps 5 0:3 below it. There is one subrotating
simulation (V5 2Ve, Dh 5 120K, g5 0:7) with negative
values of hGei in the averaging region such that hG1e i is
zero.We have omitted this simulation from the figures that
follow, because they show the logarithm of hGei, which is
not a real number for this simulation.
Angular momentum divergence due to wave breaking
of midlatitude baroclinic eddies can partially or fully
compensate the angular momentum convergence in the
equatorial region associated with equatorial wave ac-
tivity generation hG1e i. We want to quantify the angular
momentum flux divergence M5 div(u0y0 cosf)x (sub-
script x denotes extratropical quantities) these baro-
clinic eddies generate when they dissipate in the tropics.
We use an upper-tropospheric average of the eddy an-
gular momentum flux divergence in the first ‘‘lobe’’ of
divergence nearest to the equator:
hMdi5 1
Df
ðf1
f2
1
Ds
ðst
st1Ds
Mds df . (6)
After vertically averaging over the fixed depth in the
upper troposphere, we determine the latitudes bounding
the first lobe of divergence for each simulation by
starting at the equator and finding the latitude f1 where
hMi becomes positive, indicating divergence, then con-
tinuing poleward up to the latitude f2 where hMichanges sign to become negative. This average over the
divergence lobe closest to the equator is denoted by
the subscript d. Divergence in this region is produced
when midlatitude baroclinic eddies dissipate there, for
example, through filamentation and rollup in their
critical layers (Stewartson 1977; Randel and Held
1991) or through interaction with the mean-flow shear
(Farrell 1987; Lindzen 1988; Huang and Robinson
1998; O’Gorman and Schneider 2007; Ait-Chaalal and
Schneider 2015). Thus, hMdi provides us with ameasure
of wave activity dissipation associated with baroclinic
waves equatorward of their midlatitude generation re-
gions. However, the measure is imperfect in that some
angular momentum flux divergence associated with
midlatitude eddies in this region may be compensated
by locally generated angular momentum flux conver-
gence, or it may be augmented by divergence associated
with equatorial waves.
Figure 3 displays all 59 simulations as a function of
hG1e i and hMdi. The black line is the one-to-one line.
The different symbols indicate the planetary rotation
rate for each simulation, and the colors of the symbols
indicate the magnitude of the equatorial upper-
tropospheric zonal wind. Positive values (red) indicate
superrotation, and negative values (blue) subrotation.
The simulations that lie to the right of the one-to-one
line (i.e., with hG1e i. hMdi) are generally superrotating,
and those on the left (i.e., with hG1e i, hMdi) are gen-
erally subrotating, with a couple of exceptions. That is,
the ratio of the two parameters hG1e i and hMdi captures
fairly well whether a given atmosphere is superrotating.
It is clear that the planetary rotation rate plays a large
role in controlling hG1e i: the slower rotation rates gen-
erally lie on the right side (superrotation), and the faster
ones lie on the left (subrotation).
There are two strongly superrotating simulations that
lie on the left side of the line and for which the scalings
FIG. 3. All simulations shown as a function of hG1e i and hMdi. In
this and subsequent figures, themarker color shows themean zonal
wind averagedwithin 58 of the equator in the upper troposphere (inthe same way that hG1
e i is averaged). Positive values (red) indicatesuperrotation, and negative values (blue) indicate subrotation. The
different symbols indicate the planetary rotation rates shown in the
legend. The solid black line is the 1:1 line.
4286 JOURNAL OF THE ATMOSPHER IC SC IENCES VOLUME 72

do not work well in the following figures. These simu-
lations both have Dh 5 30K and g5 0:5. They are the
kind of simulations for which we needed to increase
the subgrid-scale damping to decrease the noisiness of
the simulations (section 2). We found that both the
calculation of hG1e i and the equatorial wind speed in
these simulations with such low baroclinicity are very
sensitive to the subgrid-scale damping. For example,
both simulations were more weakly superrotating in the
upper troposphere with weaker damping. That subgrid-
scale damping becomes dynamically important and
leads to numerical sensitivities may explain why these
simulations are inconsistent with the theory.
4. Scaling theory
To understand more completely under which condi-
tions superrotation arises, we develop a scaling theory
for the wave activity generation hG1e i near the equator
and for the off-equatorial eddy angular momentum flux
divergence hMdi.a. Equatorial wave activity generation
To determine how hG1e i scales with mean-flow pa-
rameters, we need scalings for R0, z0, and ›yza. Because
the Rossby wave source isR0 5R2R by definition, with
R5=h � (zavx) according to (2), we can expand
R0 ’=h� (z0v
x1 z
av0x)
’ (vx� =
h)z0 1 z0(=
h� v
x)1 (v0x � =h
)za1 z
a(=
h� v0x) ,
(7)
where we assume that the nonlinear eddy–eddy in-
teraction term z0v0x 2 z0v0x is negligible. A priori, the
terms on the right-hand side of (7) are all of similar
magnitude. We develop a scaling for the last term, the
stretching of mean absolute vorticity by divergence
fluctuations, which has traditionally been a focus of
equatorial wave generation theories. It scales like the
mean absolute vorticity za multiplied by a scaling for the
divergence of the fluctuating horizontal flow =h � v0x. Forthe mean absolute vorticity, we assume za ;beLbe
, and
for its gradient ›yza ;be, where be 5 ›f /›y’ 2V/a is the
derivative of the Coriolis parameter f at the equator, and
Lbeis a length scale of the rotational flow. The latter we
will take to be the equatorial Rossby radius,
Lbe;
�H
eN
e
be
�1/2
, (8)
where He is the equatorial tropopause height and Ne is
the equatorial buoyancy frequency. For the divergence
of the fluctuating horizontal flow, we can derive a scaling
from the continuity equation combined with the ther-
modynamic equation under the weak temperature gra-
dient approximation (Sobel et al. 2001; Schneider and
Liu 2009):
=h� v0x ’2
›
›z
gQ0
u0N2
e
!;
gQ0
u0H
eN2
e
. (9)
This assumes divergence fluctuations are driven primarily
by diabatic (i.e., convective) heating fluctuationsQ0 in theupper troposphere, and the height scale over which the
vertical velocity w; gQ0/(u0N2e ) diverges is proportional
to the tropopause height (e.g., 0:1He).Alternative choices
for this height scale are possible. For example, one might
take it to be constant or use the scale height H5RT/g.
The difference between taking the height scale to be
constant and using a fraction of He is quite small. How-
ever, using H does not fully capture the dependence of
the height scale on the stratification in our simulations.
To relate =h � v0x to mean-flow quantities, we need to
express Q0 on the right-hand side of (9) in terms of a
mean-flow quantity. We take Q0 to scale with the tem-
poral- and zonal-mean convective heating Q, obtained
from the GCM’s convection scheme. This captures the
heating fluctuations well, except for some simulations
with very weak convective heating, where it over-
estimates the diabatic heating fluctuations (Fig. 4). The
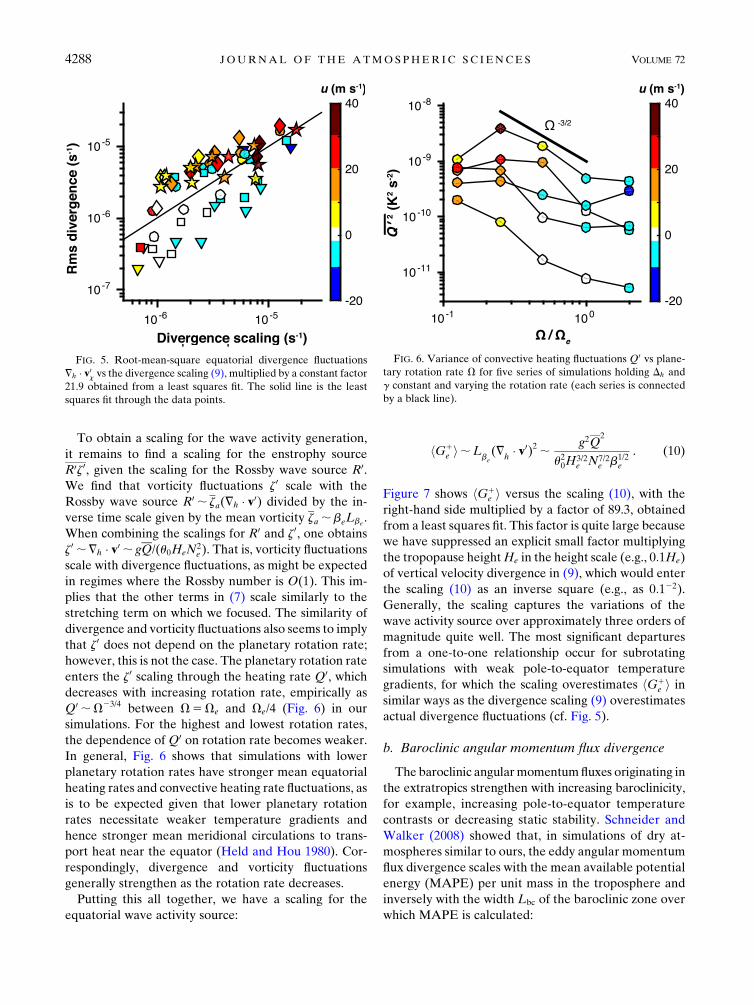
resulting scaling (9) of the rms divergence fluctuations in
the upper troposphere, averaged in the same way and in
the same region as hG1e i and using Q0 ;Q, works well
for most of the simulations, particularly the super-
rotating ones (Fig. 5). It overestimates the divergence
for subrotating simulations with very weak equatorial
divergence fluctuations.
FIG. 4. Convective heating fluctuations vsmean convective heating.
NOVEMBER 2015 LARA IA AND SCHNE IDER 4287
To obtain a scaling for the wave activity generation,
it remains to find a scaling for the enstrophy source
R0z0, given the scaling for the Rossby wave source R0.We find that vorticity fluctuations z0 scale with the
Rossby wave source R0 ; za(=h � v0) divided by the in-
verse time scale given by the mean vorticity za ;beLbe.
When combining the scalings for R0 and z0, one obtains
z0 ;=h � v0 ; gQ/(u0HeN2e ). That is, vorticity fluctuations
scale with divergence fluctuations, as might be expected
in regimes where the Rossby number is O(1). This im-
plies that the other terms in (7) scale similarly to the
stretching term on which we focused. The similarity of
divergence and vorticity fluctuations also seems to imply
that z0 does not depend on the planetary rotation rate;
however, this is not the case. The planetary rotation rate
enters the z0 scaling through the heating rate Q0, whichdecreases with increasing rotation rate, empirically as
Q0 ;V23/4 between V5Ve and Ve/4 (Fig. 6) in our
simulations. For the highest and lowest rotation rates,
the dependence ofQ0 on rotation rate becomes weaker.
In general, Fig. 6 shows that simulations with lower
planetary rotation rates have stronger mean equatorial
heating rates and convective heating rate fluctuations, as
is to be expected given that lower planetary rotation
rates necessitate weaker temperature gradients and
hence stronger mean meridional circulations to trans-
port heat near the equator (Held and Hou 1980). Cor-
respondingly, divergence and vorticity fluctuations
generally strengthen as the rotation rate decreases.
Putting this all together, we have a scaling for the
equatorial wave activity source:
hG1e i;L
be(=
h� v0)2 ; g2Q
2
u20H3/2e N7/2
e b1/2e
. (10)
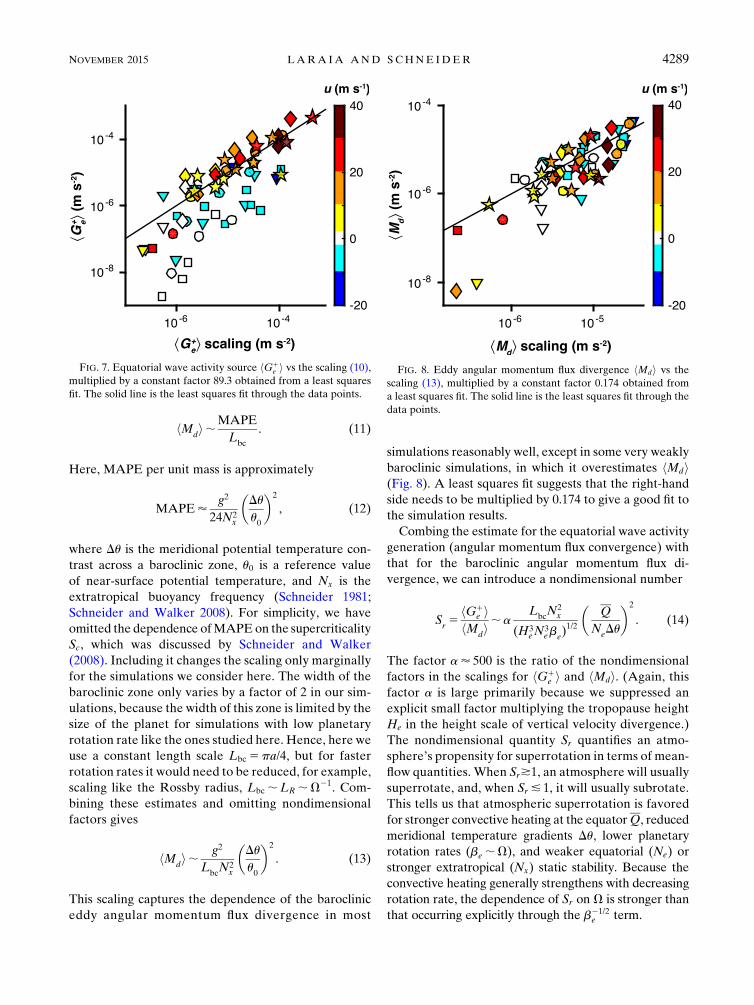
Figure 7 shows hG1e i versus the scaling (10), with the
right-hand side multiplied by a factor of 89.3, obtained
from a least squares fit. This factor is quite large because
we have suppressed an explicit small factor multiplying
the tropopause heightHe in the height scale (e.g., 0:1He)
of vertical velocity divergence in (9), which would enter
the scaling (10) as an inverse square (e.g., as 0:122).
Generally, the scaling captures the variations of the
wave activity source over approximately three orders of
magnitude quite well. The most significant departures
from a one-to-one relationship occur for subrotating
simulations with weak pole-to-equator temperature
gradients, for which the scaling overestimates hG1e i in
similar ways as the divergence scaling (9) overestimates
actual divergence fluctuations (cf. Fig. 5).
b. Baroclinic angular momentum flux divergence
The baroclinic angularmomentumfluxes originating in
the extratropics strengthen with increasing baroclinicity,
for example, increasing pole-to-equator temperature
contrasts or decreasing static stability. Schneider and
Walker (2008) showed that, in simulations of dry at-
mospheres similar to ours, the eddy angular momentum
flux divergence scales with the mean available potential
energy (MAPE) per unit mass in the troposphere and
inversely with the width Lbc of the baroclinic zone over
which MAPE is calculated:
FIG. 5. Root-mean-square equatorial divergence fluctuations
=h � v0x vs the divergence scaling (9), multiplied by a constant factor
21.9 obtained from a least squares fit. The solid line is the least
squares fit through the data points.
FIG. 6. Variance of convective heating fluctuations Q0 vs plane-tary rotation rate V for five series of simulations holding Dh and
g constant and varying the rotation rate (each series is connected
by a black line).
4288 JOURNAL OF THE ATMOSPHER IC SC IENCES VOLUME 72
hMdi;MAPE
Lbc
. (11)
Here, MAPE per unit mass is approximately
MAPE’g2
24N2x
�Du
u0
�2
, (12)
where Du is the meridional potential temperature con-
trast across a baroclinic zone, u0 is a reference value
of near-surface potential temperature, and Nx is the
extratropical buoyancy frequency (Schneider 1981;
Schneider and Walker 2008). For simplicity, we have
omitted the dependence ofMAPEon the supercriticality
Sc, which was discussed by Schneider and Walker
(2008). Including it changes the scaling only marginally
for the simulations we consider here. The width of the
baroclinic zone only varies by a factor of 2 in our sim-
ulations, because the width of this zone is limited by the
size of the planet for simulations with low planetary
rotation rate like the ones studied here. Hence, here we
use a constant length scale Lbc 5pa/4, but for faster
rotation rates it would need to be reduced, for example,
scaling like the Rossby radius, Lbc ;LR ;V21. Com-
bining these estimates and omitting nondimensional
factors gives
hMdi; g2
LbcN2
x
�Du
u0
�2
. (13)
This scaling captures the dependence of the baroclinic
eddy angular momentum flux divergence in most
simulations reasonably well, except in some very weakly
baroclinic simulations, in which it overestimates hMdi(Fig. 8). A least squares fit suggests that the right-hand
side needs to be multiplied by 0.174 to give a good fit to
the simulation results.
Combing the estimate for the equatorial wave activity
generation (angular momentum flux convergence) with
that for the baroclinic angular momentum flux di-
vergence, we can introduce a nondimensional number
Sr5
hG1e i
hMdi;a
LbcN2
x
(H3eN
3ebe
)1/2
�Q
NeDu
�2
. (14)
The factor a’ 500 is the ratio of the nondimensional
factors in the scalings for hG1e i and hMdi. (Again, this
factor a is large primarily because we suppressed an
explicit small factor multiplying the tropopause height
He in the height scale of vertical velocity divergence.)
The nondimensional quantity Sr quantifies an atmo-
sphere’s propensity for superrotation in terms of mean-
flow quantities. When Sr*1, an atmosphere will usually
superrotate, and, when Sr & 1, it will usually subrotate.
This tells us that atmospheric superrotation is favored
for stronger convective heating at the equatorQ, reduced
meridional temperature gradients Du, lower planetary
rotation rates (be ;V), and weaker equatorial (Ne) or
stronger extratropical (Nx) static stability. Because the
convective heating generally strengthens with decreasing
rotation rate, the dependence of Sr on V is stronger than
that occurring explicitly through the b21/2e term.
FIG. 8. Eddy angular momentum flux divergence hMdi vs the
scaling (13), multiplied by a constant factor 0.174 obtained from
a least squares fit. The solid line is the least squares fit through the
data points.
FIG. 7. Equatorial wave activity source hG1e i vs the scaling (10),
multiplied by a constant factor 89.3 obtained from a least squares
fit. The solid line is the least squares fit through the data points.
NOVEMBER 2015 LARA IA AND SCHNE IDER 4289
5. Discussion
a. Mechanisms and origin of parameter dependences
Although idealized, the simulations performed here
have the basic ingredients to produce superrotation in
terrestrial atmospheres. The most important quantities
controlling whether superrotation occurs or not in our
simulations are the planetary rotation rate and the me-
ridional temperature gradient, with, for example, the
static stability in the tropics and extratropics playing
secondary roles.
The dependence of Sr on rotation rate comes pri-
marily from the equatorial wave activity generation
hG1e i. The extratropical hMdi will depend on rotation
rate for faster rotation rates (hMdi;V) because the
width of the baroclinic zone Lbc depends on rota-
tion rate, like the Rossby radius LR ;V21. For the
simulations discussed here, however, the planetary scale
limits this rotation rate dependence. The equatorial
hG1e i;Lbe
(=h � v0)2 decreases with rotation rate for
two primary reasons: The mean-square divergence
(=h � v0x)2 ;Q2depends on rotation rate because the
squared diabatic heating rate does, roughly like ;V23/2
in our simulations. Additionally, the equatorial Rossby
radius depends on rotation rate, Lbe;V21/2.
Thus, for faster rotation rates, the baroclinic eddy
angular momentum flux divergence increases with ro-
tation rate primarily because eddies get smaller and the
angularmomentum fluxes becomemore concentrated in
narrower baroclinic zones. Increases in meridional
temperature contrasts because of reduced efficiency of
poleward energy transport also modify the baroclinic
eddy angular momentum flux divergence (Schneider
and Walker 2008). By contrast, the equatorial wave
activity generation decreases with rotation rate both
because the equatorial Rossby radius decreases and the
convective heating fluctuations and divergence fluctua-
tions weaken. For our simulations, the equatorial wave
activity generation effect dominates and leads to
Sr ;V22: that is, a strongly increasing propensity for
superrotation with decreasing rotation rate. (For faster
rotation rates, this amplifies to Sr ;V23 when, addi-
tionally, the shrinking width of the baroclinic zone is
taken into account.) This may account for the fact that
slowly rotating terrestrial atmospheres (e.g., Venus’s)
tend to exhibit superrotation.
The dependence of Sr on the meridional temperature
contrast Du enters explicitly only through the scaling
for hMdi, which depends on MAPE; (Du)2, yieldingSr ; (Du)22. Thus, when meridional temperature gradi-
ents are weak, there is less angular momentum flux di-
vergence near the equator by midlatitude baroclinic
eddies, and the propensity for superrotation increases. It
is worthwhile noting that, when Du is decreased in our
simulations, the polar temperature remains constant,
and the equatorial and globally averaged temperatures
decrease, decreasing the equatorial tropopause height
He (Thuburn and Craig 2000; Schneider 2004) and
adding to the propensity for superrotation. The merid-
ional temperature contrast and the rotation rate may
also both affect the static stability in the extratropics and
near the equator, which, in themselves, have opposing
effects on Sr ;N2xN
27/2e .
To look at the equatorial wave structures responsible
for the generation of superrotation more closely, Fig. 9
shows the correlation coefficient between equatorial
divergence fluctuations at a reference point and hori-
zontal streamfunction and wind fluctuations at 300hPa
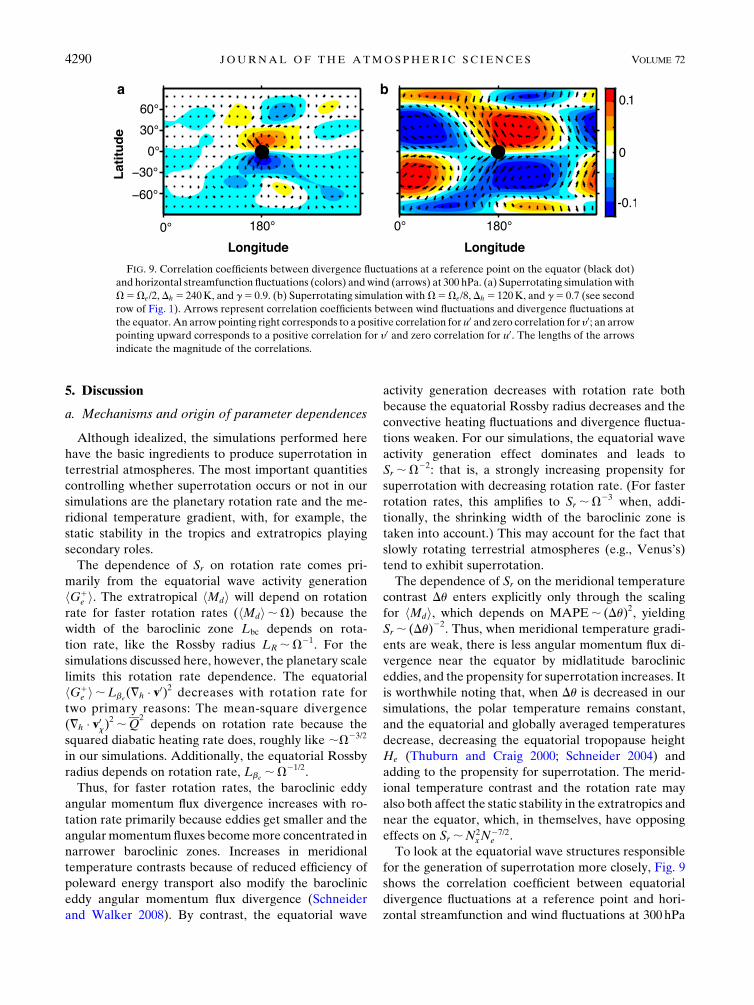
FIG. 9. Correlation coefficients between divergence fluctuations at a reference point on the equator (black dot)
and horizontal streamfunction fluctuations (colors) and wind (arrows) at 300 hPa. (a) Superrotating simulationwith
V5Ve/2, Dh 5 240K, and g5 0:9. (b) Superrotating simulation withV5Ve/8, Dh 5 120K, and g5 0:7 (see second
row of Fig. 1). Arrows represent correlation coefficients between wind fluctuations and divergence fluctuations at
the equator.An arrow pointing right corresponds to a positive correlation for u0 and zero correlation for y0; an arrowpointing upward corresponds to a positive correlation for y0 and zero correlation for u0. The lengths of the arrows
indicate the magnitude of the correlations.
4290 JOURNAL OF THE ATMOSPHER IC SC IENCES VOLUME 72
for two superrotating simulations, one with half Earth’s
rotation rate (V5Ve/2, Dh 5 240K, and g5 0:9), and
one with even slower planetary rotation (V5Ve/8,
Dh 5 120K, and g5 0:7; see second row of Fig. 1). The
reference point is indicated by a black dot at the equator
at 1808 longitude. The correlation coefficients between
divergence fluctuations at the equator and, on the one
hand, horizontal streamfunction fluctuations (colors)
and, on the other hand, wind fluctuations (arrows),
indicate a Rossby (rotational) wave structure for both
cases (Matsuno 1966). The Rossby wave has zonal ve-
locities symmetric about the equator and meridional
velocities antisymmetric about the equator. The equa-
torial Rossby radius, which determines the decay of
meridional velocity correlations away from the equator,
appears to extend over much of a hemisphere for the
slowly rotating simulation (V5Ve/8), but it is more
confined to the equator in the more slowly rotating
simulation (V5Ve/2). Similar equatorial wave features
were seen in the giant-planet simulations of Schneider
and Liu (2009) and Liu and Schneider (2010, 2011).
The correlations between wind fluctuations and di-
vergence fluctuations at the equator (tilt of arrows) in-
dicate angularmomentum transport toward the equator.
They also show that no more than the usual tilt of phase
lines with latitude is needed to generate the angular
momentum transport. It is not necessary to see outright
meridional propagation of wave packets for angular
momentum transport to occur. It suffices to have a me-
ridional group velocity away from the equator, as in-
dicated by the tilt of phase lines, accompanied by
dissipation of waves preferentially in the off-equatorial
wings: for example, by critical-layer rollup or shearing
by the mean flow (e.g., Farrell 1987; Lindzen 1988;
Huang and Robinson 1998; O’Gorman and Schneider
2007; Ait-Chaalal and Schneider 2015). This overall
picture is consistent with our theoretical considerations,
which assign primary importance to equatorial Rossby
waves and their equatorward angular momentum
transport in the generation of superrotation.
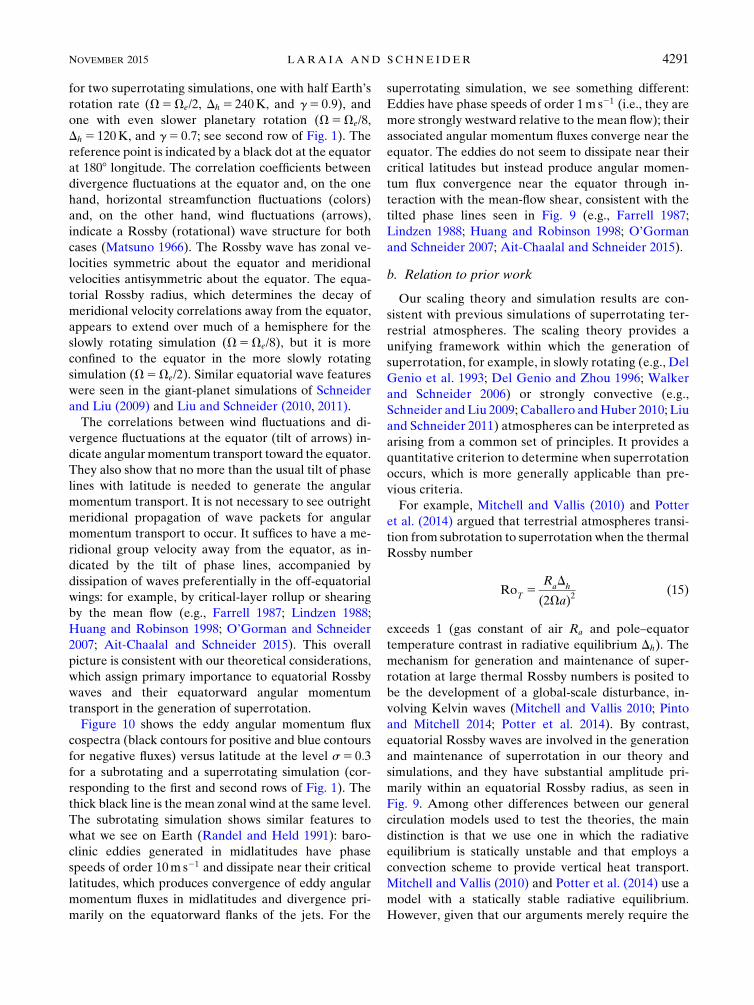
Figure 10 shows the eddy angular momentum flux
cospectra (black contours for positive and blue contours
for negative fluxes) versus latitude at the level s5 0:3
for a subrotating and a superrotating simulation (cor-
responding to the first and second rows of Fig. 1). The
thick black line is the mean zonal wind at the same level.
The subrotating simulation shows similar features to
what we see on Earth (Randel and Held 1991): baro-
clinic eddies generated in midlatitudes have phase
speeds of order 10m s21 and dissipate near their critical
latitudes, which produces convergence of eddy angular
momentum fluxes in midlatitudes and divergence pri-
marily on the equatorward flanks of the jets. For the
superrotating simulation, we see something different:
Eddies have phase speeds of order 1m s21 (i.e., they are
more strongly westward relative to the mean flow); their
associated angular momentum fluxes converge near the
equator. The eddies do not seem to dissipate near their
critical latitudes but instead produce angular momen-
tum flux convergence near the equator through in-
teraction with the mean-flow shear, consistent with the
tilted phase lines seen in Fig. 9 (e.g., Farrell 1987;
Lindzen 1988; Huang and Robinson 1998; O’Gorman
and Schneider 2007; Ait-Chaalal and Schneider 2015).
b. Relation to prior work
Our scaling theory and simulation results are con-
sistent with previous simulations of superrotating ter-
restrial atmospheres. The scaling theory provides a
unifying framework within which the generation of
superrotation, for example, in slowly rotating (e.g., Del
Genio et al. 1993; Del Genio and Zhou 1996; Walker
and Schneider 2006) or strongly convective (e.g.,
Schneider and Liu 2009; Caballero andHuber 2010; Liu
and Schneider 2011) atmospheres can be interpreted as
arising from a common set of principles. It provides a
quantitative criterion to determine when superrotation
occurs, which is more generally applicable than pre-
vious criteria.
For example, Mitchell and Vallis (2010) and Potter
et al. (2014) argued that terrestrial atmospheres transi-
tion from subrotation to superrotation when the thermal
Rossby number
RoT5
RaDh
(2Va)2(15)
exceeds 1 (gas constant of air Ra and pole–equator
temperature contrast in radiative equilibrium Dh). The
mechanism for generation and maintenance of super-
rotation at large thermal Rossby numbers is posited to
be the development of a global-scale disturbance, in-
volving Kelvin waves (Mitchell and Vallis 2010; Pinto
and Mitchell 2014; Potter et al. 2014). By contrast,
equatorial Rossby waves are involved in the generation
and maintenance of superrotation in our theory and
simulations, and they have substantial amplitude pri-
marily within an equatorial Rossby radius, as seen in
Fig. 9. Among other differences between our general
circulation models used to test the theories, the main
distinction is that we use one in which the radiative
equilibrium is statically unstable and that employs a
convection scheme to provide vertical heat transport.
Mitchell and Vallis (2010) and Potter et al. (2014) use a
model with a statically stable radiative equilibrium.
However, given that our arguments merely require the
NOVEMBER 2015 LARA IA AND SCHNE IDER 4291
presence of divergence fluctuations to generate Rossby
waves, irrespective of how the divergence fluctuations
are created, this distinction between the models may not
be essential: even the model with a statically stable ra-
diative equilibrium has preferential tropospheric heat-
ing and a divergent circulation in low latitudes. The
divergent circulation likely fluctuates, with divergence
fluctuations that may scale with the mean diabatic
heating rate and that can generate Rossby waves in es-
sentially the same way we described.
To compare how well RoT captures when super-
rotation occurs, Fig. 11a shows the equatorial wind
speed in the upper troposphere versus RoT for all of our
simulations. The symbols indicate the planetary rotation
rate (as in Fig. 3), and the colors indicate the value of Dh,
with blue representing low values and red representing
high values. Simulations with high RoT do tend to be
superrotating, but there is no clear threshold for super-
rotation. The same holds when we use the same di-
agnostic for superrotation (vertical mean of zonal wind)
as in Mitchell and Vallis (2010) and Potter et al. (2014).
Additionally, there are numerous simulations that have
low RoT yet are superrotating.
Simulations in three series are connected with thick
green lines in Fig. 11a. These simulations have the same
values of g and V, and the dots along each green line
show what happens as Dh alone is varied. For the sim-
ulations that are subrotating, decreasing the pole–
equator temperature contrast (and so decreasing RoT by
definition) can lead to superrotation, as shown by two of
the connected series of simulations in Fig. 11a and as
seen in Fig. 1 (cf. rows 3 and 4). This behavior is in line
with the theory presented in this paper, that decreasing
baroclinicity in midlatitudes while holding other pa-
rameters constant will increase Sr and eventually lead to
superrotation. However, it runs counter to the notion
that the thermal Rossby number alone would generally
predict when superrotation occurs. For strongly super-
rotating simulations, decreasing Dh has the opposite ef-
fect: it weakens the superrotation, as shown by the
connected simulations near the top right of Fig. 11. This
is more in line with the notion that the thermal Rossby
number predicts when superrotation occurs.
The nondimensional number Sr developed here di-
agnoses more generally whether an atmosphere will be
super- or subrotating. It shows a clearer threshold for
superrotation at Sr 5 1, with only the two very weakly
baroclinic simulations discussed in section 3b deviating
from the expected behavior (Fig. 11b). However, Sr does
not provide any information on how strong or weak any
superrotation will be. For example, as mentioned pre-
viously and as shown in Fig. 11, increasing Sr beyond
Sr ; 1 by decreasing Dh actually weakens the super-
rotation. Scaling arguments relating the strength of
superrotating jets to their widths and to the static stability
in the equatorial region were provided and tested in Liu
and Schneider (2010) and Liu and Schneider (2011).
c. Limitations and possible extensions
Our simulations and scaling theory ignored several
factors that are known to affect whether superrotation
occurs. For example, we ignored the seasonal cycle. Yet
FIG. 10. Eddy angular momentum flux cospectra vs latitude at s5 0:3. (a) A subrotating simulation (V5Ve,
Dh 5 120K, and g5 0:7; see first row of Fig. 1). (b) The same superrotating simulation as in Fig. 9b (V5Ve/8,
Dh 5 120K, and g5 0:7; see second row of Fig. 1). Black and blue contours correspond to positive and negative
angular momentum fluxes, respectively, and the thick black line shows the mean zonal wind at the same level.
4292 JOURNAL OF THE ATMOSPHER IC SC IENCES VOLUME 72

the seasonal cycle decelerates the zonal wind in the
equatorial upper troposphere in the annual mean,
because a Hadley circulation whose ascending branch is
displaced off the equator is associated with equatorial
easterlies (e.g., Lindzen and Hou 1988; Lee 1999;
Kraucunas and Hartmann 2005; Mitchell et al. 2014).
This disfavors superrotation for planets with nonzero
obliquities. Additionally, the convective wave activity
generation G in the presence of a seasonal cycle would
be maximal off the equator for part of the year, de-
creasing the numerator of Sr and likewise disfavoring
superrotation. A more general scaling theory should
take into account the seasonal cycle, as well as the ver-
tical advection of angular momentum, which becomes
important seasonally (Shell and Held 2004; Kraucunas
and Hartmann 2005).
We also focused on transient sources of equatorial
Rossby waves, rather than stationary sources, which in
several previous studies have been shown to be able to
generate superrotation if they are strong enough (e.g.,
Suarez and Duffy 1992; Saravanan 1993; Joshi et al.
1997; Kraucunas and Hartmann 2005; Merlis and
Schneider 2010; Arnold et al. 2012; Pierrehumbert
2011). Our scaling theory can be extended to take sta-
tionary equatorial wave activity generation into account
by considering how the stationary divergence pertur-
bation and equatorial wave activity generation scale
with parameters controlling the strength of the station-
ary wave source (e.g., Merlis and Schneider 2011). In
particular, it is to be expected that the importance of
equatorial wave activity generation owing to station-
ary heat sources increases in importance relative to
baroclinic eddy angular momentum flux divergence as
the planetary rotation rate decreases for the same rea-
sons the importance of transient equatorial wave activity
generation increases. Thus, we expect that stationary
heat sources (e.g., stellar heating focused on a substellar
point on tidally locked planets) more easily lead to
equatorial superrotation on slowly rotating planets.
6. Conclusions
Wehave presented simulations and a scaling theory that
establish conditions under which superrotation occurs in
terrestrial atmospheres. By varying the planetary rotation
rate, the pole–equator temperature contrast in radiative
equilibrium, and a scaling parameter for the convective
lapse rate, we generated a wide range of atmospheric
flows, some superrotating and some subrotating.
The theory presented here is based on a simple idea,
going back to Saravanan (1993), about two competing
sources for eddy angularmomentumflux convergence at
the equator. The first is a source at the equator: Rossby
waves generated by convective heating fluctuations. As
these waves dissipate preferentially away from the
equator—whether after propagation of wave packets or
by preferential dissipation in the off-equatorial wings of
the waves (e.g., by shearing through the mean flow)—
they converge angular momentum into the equatorial
region, increasing the propensity for superrotation. The
other source is baroclinic instability in midlatitudes,
which generates Rossby waves in midlatitudes that dis-
sipate farther equatorward, thus extracting momentum
from lower latitudes. This mechanism decreases the
FIG. 11. Equatorial zonal wind in the upper troposphere vs (a) RoT 5RaDh/(2aV)2 and (b) Sr 5 hG1e i/hMdi.
Symbols are as in Fig. 3. Colors represent the value of Dh (blue is 30 K, cyan is 60K, yellow is 120K, and red is
240K). Simulations that lie above the horizontal dashed line (u 5 0m s21) are superrotating. The vertical dashed
lines indicate where RoT 5 1 or Sr 5 1.
NOVEMBER 2015 LARA IA AND SCHNE IDER 4293

propensity for superrotation. Quantifying the magni-
tude of the two mechanisms, introducing their non-
dimensional ratio Sr, and developing a scaling for it in
terms of mean-flow quantities leads to our theory and
sheds light on the conditions under which superrotation
occurs. Our simulation results and scaling theory show
that:
1) Superrotation occurs when the eddy angular mo-
mentum flux convergence associated with equatorial
wave activity generation exceeds eddy angular mo-
mentum flux divergence near the equator produced
by midlatitude baroclinic eddies (i.e., Sr * 1).
2) Superrotation is favored for low planetary rotation
rates and/or strong diabatic heating.
3) Superrotation is favored when midlatitude baro-
clinicity is weak.
Our simulations confirm that superrotation is pre-
ferred for slowly rotating planets like Venus and Titan, a
result that was already obtained by Del Genio et al.
(1993) and Del Genio and Zhou (1996) in a similar set
of simulations. The scaling arguments presented here
help us understand why slowly rotating planets exhibit
superrotation. In our simulations, equatorial convective
heating fluctuations strengthen with decreasing rotation
rate, generating waves that transport momentum up-
gradient toward the equator, leading to superrotation.
Such convective heating fluctuations may play a role
on Venus, in the shallow convective layers observed in
the upper troposphere (Markiewicz et al. 2007). The
equatorial wave activity generation strengthens as the
planetary rotation rate decreases primarily because
the diabatic heating rate strengthens. Thus, similar
arguments may also apply for other mechanisms that
increase the diabatic heating or more generally, di-
vergence fluctuations at the equator. For example,
stationary or nearly stationary heat sources that gen-
erate equatorial Rossby waves have been suggested to
play a role on Venus near the subsolar point (Gierasch
et al. 1997).
Strengthening equatorial convective heating fluctua-
tions may also explain why some Earth climate models
exhibit a transition to superrotation under extreme global
warming (e.g., Caballero and Huber 2010). In this sce-
nario, convective heating at the equator strengthens be-
cause of greenhouse gas forcing, and meridional
temperature gradients decrease because of polar ampli-
fication of the warming. Both factors favor superrotation.
Acknowledgments. Some of the scaling results in this
paper were presented at the 18th Conference on At-
mospheric and Oceanic Fluid Dynamics in 2011. The
research was supported by the U.S. National Science
Foundation through Grant AGS-1049201 and a Grad-
uate Research Fellowship.
REFERENCES
Ait-Chaalal, F., and T. Schneider, 2015: Why eddy momentum
fluxes are concentrated in the upper troposphere. J. Atmos.
Sci., 72, 1585–1604, doi:10.1175/JAS-D-14-0243.1.
Andrews, D. G., and M. E. Mcintyre, 1976: Planetary waves in hori-
zontal and vertical shear: The generalized Eliassen–Palm relation
and the mean zonal acceleration. J. Atmos. Sci., 33, 2031–2048,
doi:10.1175/1520-0469(1976)033,2031:PWIHAV.2.0.CO;2.
——, and ——, 1978: An exact theory of nonlinear waves on a
Lagrangian-mean flow. J. Fluid Mech., 89, 609–646,
doi:10.1017/S0022112078002773.
Arnold, N. P., E. Tziperman, and B. Farrell, 2012: Abrupt transi-
tion to strong superrotation driven by equatorial wave reso-
nance in an idealized GCM. J. Atmos. Sci., 69, 626–640,
doi:10.1175/JAS-D-11-0136.1.
Caballero, R., and M. Huber, 2010: Spontaneous transition to
superrotation in warm climates simulated by CAM3.Geophys.
Res. Lett., 37, L11701, doi:10.1029/2010GL043468.
Charney, J. G., 1963: A note on large-scale motions in the tropics.
J.Atmos. Sci., 20, 607–609, doi:10.1175/1520-0469(1963)020,0607:
ANOLSM.2.0.CO;2.
Del Genio, A. D., andW. Zhou, 1996: Simulations of superrotation
on slowly rotating planets: Sensitivity to rotation and initial
condition. Icarus, 120, 332–343, doi:10.1006/icar.1996.0054.
——, ——, and T. P. Eichler, 1993: Equatorial superrotation in a
slowly rotating GCM: Implications for Titan and Venus. Ica-
rus, 101, 1–17, doi:10.1006/icar.1993.1001.Edmon, H. J., Jr., B. J. Hoskins, and M. E. McIntyre, 1980:
Eliassen–Palm cross sections for the troposphere. J. Atmos.
Sci., 37, 2600–2616, doi:10.1175/1520-0469(1980)037,2600:
EPCSFT.2.0.CO;2.
Farrell, B., 1987: Developing disturbances in shear. J. Atmos.
Sci., 44, 2191–2199, doi:10.1175/1520-0469(1987)044,2191:
DDIS.2.0.CO;2.
Garner, S. T., D. M. W. Frierson, I. M. Held, O. Pauluis, and G. K.
Vallis, 2007: Resolving convection in a global hypohydrostatic
model. J. Atmos. Sci., 64, 2061–2075, doi:10.1175/JAS3929.1.
Gierasch, P., and Coauthors, 1997: The general circulation of the
Venus atmosphere: An assessment. Venus II: Geology, Geo-
physics, Atmosphere, and Solar Wind Environment, S. W.
Bougher, D. M. Hunten, and R. J. Phillips, Eds., The Uni-
versity of Arizona Press, 459–500.
Held, I. M., 1975: Momentum transport by quasi-geostrophic
eddies. J. Atmos. Sci., 32, 1494–1497, doi:10.1175/
1520-0469(1975)032,1494:MTBQGE.2.0.CO;2.
——, 1999: Equatorial superrotation in Earth-like atmospheric
models. [Available online at http://www.gfdl.noaa.gov/
cms-filesystem-action/user_files/ih/lectures/super.pdf.]
——, and A. Y. Hou, 1980: Nonlinear axially symmetric circulations
in a nearly inviscid atmosphere. J. Atmos. Sci., 37, 515–533,
doi:10.1175/1520-0469(1980)037,0515:NASCIA.2.0.CO;2.
Hide, R., 1969: Dynamics of the atmospheres of the major planets
with an appendix on the viscous boundary layer at the rigid
bounding surface of an electrically conducting rotating fluid in
the presence of a magnetic field. J. Atmos. Sci., 26, 841–853,
doi:10.1175/1520-0469(1969)026,0841:DOTAOT.2.0.CO;2.
Huang, H.-P., and W. A. Robinson, 1998: Two-dimensional tur-
bulence and persistent zonal jets in a global barotropic model.
4294 JOURNAL OF THE ATMOSPHER IC SC IENCES VOLUME 72

J.Atmos. Sci., 55, 611–632, doi:10.1175/1520-0469(1998)055,0611:
TDTAPZ.2.0.CO;2.
Joshi, M., R. Haberle, and R. Reynolds, 1997: Simulations of the
atmospheres of synchronously rotating terrestrial planets or-
biting M dwarfs: Conditions for atmospheric collapse and the
implications for habitability. Icarus, 129, 450–465, doi:10.1006/
icar.1997.5793.
Kostiuk, T., K. E. Fast, T. A. Livengood, T. Hewagama, J. J.
Goldstein, F. Espenak, and D. Buhl, 2001: Direct measure-
ment of winds on Titan. Geophys. Res. Lett., 28, 2361–2364,
doi:10.1029/2000GL012617.
Kraucunas, I., and D. L. Hartmann, 2005: Equatorial superrotation
and the factors controlling the zonal-mean zonal winds in the
tropical upper troposphere. J. Atmos. Sci., 62, 371–389,
doi:10.1175/JAS-3365.1.
Kuang, Z., P. N. Blossey, and C. S. Bretherton, 2005: A new ap-
proach for 3D cloud-resolving simulations of large-scale at-
mospheric circulation. Geophys. Res. Lett., 32, L02809,
doi:10.1029/2004GL021024.
Lee, S., 1999: Why are the climatological zonal winds easterly
in the equatorial upper troposphere? J. Atmos. Sci.,
56, 1353–1363, doi:10.1175/1520-0469(1999)056,1353:
WATCZW.2.0.CO;2.
Lindzen, R. S., 1988: Instability of plane parallel shear flow
(toward a mechanistic picture of how it works). Pure Appl.
Geophys., 126, 103–121, doi:10.1007/BF00876917.——, and A. Y. Hou, 1988: Hadley circulations for zonally
averaged heating centered off the equator. J. Atmos. Sci.,
45, 2416–2427, doi:10.1175/1520-0469(1988)045,2416:
HCFZAH.2.0.CO;2.
Liu, J., and T. Schneider, 2010: Mechanisms of jet formation on the
giant planets. J. Atmos. Sci., 67, 3652–3672, doi:10.1175/
2010JAS3492.1.
——, and ——, 2011: Convective generation of equatorial super-
rotation in planetary atmospheres. J. Atmos. Sci., 68, 2742–
2756, doi:10.1175/JAS-D-10-05013.1.
Markiewicz, W. J., and Coauthors, 2007: Morphology and dy-
namics of the upper cloud layer of Venus. Nature, 450, 633–
636, doi:10.1038/nature06320.
Matsuno, T., 1966: Quasi-geostrophic motions in the equatorial
area. J. Meteor. Soc. Japan, 44, 25–42.Merlis, T. M., and T. Schneider, 2010: Atmospheric dynamics of
Earth-like tidally locked aquaplanets. J. Adv. Model. Earth
Sys., 2, 13, doi:10.3894/JAMES.2010.2.13.
——, and ——, 2011: Changes in zonal surface temperature gra-
dients and Walker circulations in a wide range of climates.
J. Climate, 24, 4757–4768, doi:10.1175/2011JCLI4042.1.
Mitchell, J. L., and G. K. Vallis, 2010: The transition to super-
rotation in terrestrial atmospheres. J. Geophys. Res., 115,
E12008, doi:10.1029/2010JE003587.
——, ——, and S. F. Potter, 2014: Effects of the seasonal cycle on
superrotation in planetary atmospheres.Astrophys. J., 787, 23,
doi:10.1088/0004-637X/787/1/23.
O’Gorman, P.A., andT. Schneider, 2007: Recovery of atmospheric
flow statistics in a general circulation model without nonlinear
eddy–eddy interactions. Geophys. Res. Lett., 34, L22801,
doi:10.1029/2007GL031779.
Pierrehumbert, R. T., 2011: A palette of climates for Gliese 581g.
Astrophys. J., 726, L8, doi:10.1088/2041-8205/726/1/L8.
Pinto, J. R. D., and J. L. Mitchell, 2014: Atmospheric super-
rotation in an idealized GCM: Parameter dependence
of the eddy response. Icarus, 238, 93–109, doi:10.1016/
j.icarus.2014.04.036.
Porco, C. C., and Coauthors, 2003: Cassini imaging of Jupiter’s
atmosphere, satellites, and rings. Science, 299, 1541–1547,
doi:10.1126/science.1079462.
Potter, S. F., G. K. Vallis, and J. L. Mitchell, 2014: Spontaneous
superrotation and the role of Kelvin waves in an idealized
dry GCM. J. Atmos. Sci., 71, 596–614, doi:10.1175/
JAS-D-13-0150.1.
Randel, W. J., and I. M. Held, 1991: Phase speed spectra of
transient eddy fluxes and critical layer absorption. J. Atmos.
Sci., 48, 688–697, doi:10.1175/1520-0469(1991)048,0688:
PSSOTE.2.0.CO;2.
Sánchez-Lavega, A., R. Hueso, and S. Pérez-Hoyos, 2007:
The three-dimensional structure of Saturn’s equatorial
jet at cloud level. Icarus, 187, 510–519, doi:10.1016/
j.icarus.2006.10.022.
Saravanan, R., 1993: Equatorial superrotation and maintenance
of the general circulation in two-level models. J. Atmos. Sci.,
50, 1211–1227, doi:10.1175/1520-0469(1993)050,1211:
ESAMOT.2.0.CO;2.
Sardeshmukh, P.D., andB. J.Hoskins, 1988: The generation of global
rotational flow by steady idealized tropical divergence. J. Atmos.
Sci., 45, 1228–1251, doi:10.1175/1520-0469(1988)045,1228:
TGOGRF.2.0.CO;2.
Schneider, E. K., 1981: On the amplitudes reached by
baroclinically unstable disturbances. J. Atmos. Sci.,
38, 2142–2149, doi:10.1175/1520-0469(1981)038,2142:
OTARBB.2.0.CO;2.
Schneider, T., 2004: The tropopause and the thermal stratifi-
cation in the extratropics of a dry atmosphere. J. Atmos.
Sci., 61, 1317–1340, doi:10.1175/1520-0469(2004)061,1317:
TTATTS.2.0.CO;2.
——, 2006: The general circulation of the atmosphere. Annu.
Rev. Earth Planet. Sci., 34, 655–688, doi:10.1146/
annurev.earth.34.031405.125144.
——, and J. Liu, 2009: Formation of jets and equatorial super-
rotation on Jupiter. J. Atmos. Sci., 66, 579–601, doi:10.1175/
2008JAS2798.1.
——, and C. C. Walker, 2006: Self-organization of atmospheric
macroturbulence into critical states of weak nonlinear eddy–
eddy interactions. J. Atmos. Sci., 63, 1569–1586, doi:10.1175/
JAS3699.1.
——, and ——, 2008: Scaling laws and regime transitions of mac-
roturbulence in dry atmospheres. J. Atmos. Sci., 65, 2153–
2173, doi:10.1175/2007JAS2616.1.
Schubert, G., 1983: General circulation and the dynamical state of
the Venus atmosphere. Venus, D. M. Hunten et al., Eds., The
University of Arizona Press, 681–765.
Shell, K. M., and I. M. Held, 2004: Abrupt transition to strong
superrotation in an axisymmetric model of the upper tropo-
sphere. J. Atmos. Sci., 61, 2928–2935, doi:10.1175/JAS-3312.1.
Smith, K., G. Boccaletti, C. Henning, I. Marinov, C. Tam, I. Held,
and G. Vallis, 2002: Turbulent diffusion in the geostrophic
inverse cascade. J. Fluid Mech., 469, 13–48, doi:10.1017/
S0022112002001763.
Sobel, A. H., J. Nilsson, and L. M. Polvani, 2001: The weak tem-
perature gradient approximation and balanced tropical
moisture waves. J. Atmos. Sci., 58, 3650–3665, doi:10.1175/
1520-0469(2001)058,3650:TWTGAA.2.0.CO;2.
Stewartson, K., 1977: The evolution of the critical layer of a
Rossby wave. Geophys. Astrophys. Fluid Dyn., 9, 185–200,
doi:10.1080/03091927708242326.
Suarez, M. J., and D. G. Duffy, 1992: Terrestrial super-
rotation: A bifurcation of the general circulation. J.Atmos.
NOVEMBER 2015 LARA IA AND SCHNE IDER 4295

Sci., 49, 1541–1554, doi:10.1175/1520-0469(1992)049,1541:
TSABOT.2.0.CO;2.
Thuburn, J., and G. C. Craig, 2000: Stratospheric influence on
tropopause height: The radiative constraint. J. Atmos.
Sci., 57, 17–28, doi:10.1175/1520-0469(2000)057,0017:
SIOTHT.2.0.CO;2.
Walker, C. C., and T. Schneider, 2006: Eddy influences on Hadley
circulations: Simulations with an idealized GCM. J. Atmos.
Sci., 63, 3333–3350, doi:10.1175/JAS3821.1.
Wang, P., and J. L. Mitchell, 2014: Planetary ageostrophic in-
stability leads to superrotation. Geophys. Res. Lett., 41, 4118–
4126, doi:10.1002/2014GL060345.
Williams, G. P., 2003: Barotropic instability and equatorial
superrotation. J. Atmos. Sci., 60, 2136–2152, doi:10.1175/
1520-0469(2003)060,2136:BIAES.2.0.CO;2.
Yamamoto,M., andM. Takahashi, 2006: Superrotationmaintained
by meridional circulation and waves in a Venus-like AGCM.
J. Atmos. Sci., 63, 3296–3314, doi:10.1175/JAS3859.1.
4296 JOURNAL OF THE ATMOSPHER IC SC IENCES VOLUME 72