Supercritical Carbon Dioxide Sterilization of Ultra-High ... · Supercritical Carbon Dioxide...
40
Supercritical Carbon Dioxide Sterilization of Ultra-High Molecular Weight Polyethylene HONORS THESIS Presented in partial fulfillment of the requirements for the degree of Bachelor of Science with distinction By: John Carlos Titone * * * * * * * The Ohio State University 2009 Thesis Committee: Professor Jim F. Rathman Professor David L. Tomasko, advisor Approved By: ______________________________ ______________________________ The William G. Lowrie Department of Chemical and Biomolecular Engineering
-
Upload
nguyenkhuong -
Category
Documents
-
view
229 -
download
0
Transcript of Supercritical Carbon Dioxide Sterilization of Ultra-High ... · Supercritical Carbon Dioxide...

Supercritical Carbon Dioxide Sterilization of Ultra-High
Molecular Weight Polyethylene
HONORS THESIS
Presented in partial fulfillment of the requirements for
the degree of Bachelor of Science with distinction
By:
John Carlos Titone
* * * * * * *
The Ohio State University
2009
Thesis Committee:
Professor Jim F. Rathman
Professor David L. Tomasko, advisor
Approved By:
______________________________
______________________________
The William G. Lowrie Department of Chemical and Biomolecular Engineering

Abstract
The aim of this research was to use a benign technique for the sterilization of ultra-high
molecular weight polyethylene (UHMWPE), which is broadly used in artificial joints and
other medical implants. Current sterilizations methods such as gamma irradiation,
ethylene oxide gas, and gas plasma can damage the polymer, thus reducing its service
life, as well as create harmful byproducts. Supercritical carbon dioxide (SC) CO2
sterilization has the potential to greatly reduce both polymer degradation and negative
environmental impacts. The former extends the life of the implant and the latter
decreases waste disposal costs and minimizes risk to sterilization workers. The
feasibility of using SC CO2 modified with additives such as ethanol, water and hydrogen
peroxide was assessed for the sterilization of UHMWPE. The operating conditions and
the amount of modifiers were optimized to achieve a complete inactivation of bacteria
(spores included) and fungi. When equal volumes of all modifiers were added to CO2 at
37ºC and 170 bar so that their total mole fraction was ≥ 4.1E-03, complete inactivation of
all microorganisms was achieved within 2 hours. The physio-chemical properties of the
polymer were tested for untreated, as well as treated samples. An Instron measured the
mechanical strength and elongation of the polymer, and Fourier Transform Infrared
(FTIR) spectroscopy was used to measure the level of oxidation of the polymer to
evaluate polymer chain damage. Both the physical and chemical properties of the
polymer were unchanged after the SC CO2 sterilization technique. This research has
shown that it is possible to sterilize medical grade polymer, under relatively safe
conditions, without affecting its physio-chemical properties.
_____________________________________________________________________ i

Acknowledgements
I would like to thank The Ohio State University and the William G. Lowrie Department
of Chemical and Biomolecular Engineering for the opportunity to undertake an
undergraduate honors thesis and for financial support throughout a portion of the work.
It has been an invaluable experience that has shaped the course of my future career in
chemical engineering.
I would also like to express my sincerest gratitude for Dr. David L. Tomasko, Dr. Fariba
Dehghani, and Jeffrey L. Ellis for their guidance, patience, and unyielding support of my
research. This project would not have been possible without their help. I also wish to
thank Nasim Annabi, Maryam Darestani, and Ms. Elizabeth Debrinsky for training me on
biological contamination methods, proper techniques for microbial analysis, and
providing me with any necessary lab equipment that I needed throughout the duration of
my research.
I would also like to thank: the National Science Foundation and International Research
and Education in Engineering for providing financial support of the project, Merck Pty
Ltd in Australia and Ticona for the donation of the UHMWPE, and the School of
Mechanical Engineering at the University of Sydney and the Department of Welding
Engineering at The Ohio State University for the preparation of UHMWPE sheet and
mechanical testing
_____________________________________________________________________ ii

Table of Contents
Abstract............................................................................................................................... i Acknowledgements ........................................................................................................... ii List of Tables .................................................................................................................... iv List of Figures................................................................................................................... iv 1. Introduction................................................................................................................... 1
1.1 Background ............................................................................................................. 1 1.2 Problem Statement.................................................................................................. 3 1.3 Statement of Objectives .......................................................................................... 4
2. Literature Review ......................................................................................................... 5 2.1 Ultra-High Molecular Weight Polyethylene ......................................................... 5 2.2 Commercial Sterilization Methods for UHMWPE.............................................. 5
2.2.1 Gamma Irradiation.......................................................................................... 5 2.2.2 Ethylene Oxide ................................................................................................. 6 2.2.3 Gas Plasma ....................................................................................................... 7
2.3 Supercritical Carbon Dioxide (CO2) ..................................................................... 7 3. Experimental ............................................................................................................... 10
3.1 Experimental Materials and Equipment ............................................................ 10 3.1.1 Buffered Sodium Chloride Peptone Solution Creation .............................. 11 3.1.2 Tryptone Soya Agar Creation....................................................................... 11 3.1.3 Sabouraud Dextrose Agar Creation............................................................. 12 3.1.4 Contaminated Buffer Solution Creation...................................................... 12
3.2 Ultra-high Molecular Weight Polyethylene........................................................ 13 3.2.1 UHMWPE Sample Creation ......................................................................... 13 3.2.2 UHMWPE Sample Contamination .............................................................. 13
3.3 UHMWPE Sterilization Procedure ..................................................................... 13 3.4 Experimental Runs ............................................................................................... 16 3.5 Microbial Measurement Procedure .................................................................... 16 3.6 Experimental Validation Procedures .................................................................. 18
3.6.1 Agar Plate Validation .................................................................................... 18 3.6.2 Pressure Vessel Validation ............................................................................ 19 3.6.3 Sodium Chloride Peptone Buffer Solution Validation ............................... 19 3.6.4 Kimwipe® Tissue Validation ........................................................................ 19 3.6.5 Autoclaved Distilled Water Validation ........................................................ 19 3.6.6 Contaminated Polymer Sample Validation ................................................. 20
3.7 Validation Testing for the Physio-Chemical Properties of UHMWPE............ 20 3.7.1 Mechanical Strength Testing ........................................................................ 20 3.7.2 Fourier Transform Infrared Spectroscopy (FTIR) Analysis..................... 21
4. Results and Discussion................................................................................................ 22 4.1 Sterilization Results .............................................................................................. 22 4.2 Physio-Chemical Property Results ...................................................................... 25
4.2.1 Mechanical Strength Results ........................................................................ 25 4.2.2 FTIR Results................................................................................................... 26
4.3 Phase Behavior Modeling of CO2 and Modifiers ............................................... 27 5. Conclusions .................................................................................................................. 29
_____________________________________________________________________ iii

6. Future Work................................................................................................................ 30 7. References .................................................................................................................... 31 APPENDICES ................................................................................................................. 33
List of Tables
Table 3.1: Conditions of Experimental Runs.................................................................... 16
Table 4.1: Log Reduction Results for Each Experimental Run........................................ 22
List of Figures
Figure 3.1: Diagram of the Sterilization Apparatus.......................................................... 14 Figure 3.2: Bacterial and Fungal Growth ......................................................................... 18
Figure 4.1: : Bacterial Log Reduction vs. Total Modifier Mole Fraction Data (Tests 2, 9-
15, 19-22) 23
Figure 4.2: : Bacterial Log Reduction vs. 30vol% Hydrogen Peroxide Mole Fraction Data
(Tests 1, 3, 4, 5, 6, 21, 22, 23, 24, 25) ...................................................................... 24 Figure 4.3: FTIR Analysis of Treated and Untreated UHMWPE .................................... 26 Figure 4.4: Pseudo Ternary Modeling of the High Pressure Vessel System. Data points
from Lim et al. .......................................................................................................... 28
_____________________________________________________________________ iv

1. Introduction
1.1 Background
Throughout the Middle Ages and into the 1800’s, diseases were thought to be caused by a
miasma or “bad air”. People felt the spread of diseases could be prevented by merely
avoiding toxic smells or decaying material.1 Surgeons would commonly go from
performing autopsies to delivering a child and then back again without so much as rinsing
their hands. Similarly unhealthy practices continued within the medical profession until
the late 1800’s when the germ theory of disease gained credibility by explaining the
increased cases of illnesses within hospital settings.2 Since then, hygienic practices and
sterilization methods have been used to drastically decrease the spread of disease and
infections.
One of the first of these sanitation practices was the use of carbolic spray for surgical
sterilization in 1867.3 Unfortunately, carbolic spray was caustic to skin and body tissues,
which prevented the use of it in large quantities.4 Throughout the 1880’s and 1890’s
antiseptic surgical dressings and other forms of sterilization such as dry-heat and steam
pressure were introduced to the medical field. The advent of suture sterilization as well
as the aforementioned sterilization procedures quickly dropped the surgical death rate
(due to infection and disease) from 40% to less than 3%., The passage of time and the
increased development in technology led to the first use of ethylene oxide gas as a
hospital sterilant in 1940, radiation sterilization in 1956, gamma radiation sterilization in
1964, and gas plasma sterilization in 1993. The advancements in variety and efficacy of
sterilization processes, along with the development of antibiotics and better surgical
_____________________________________________________________________ 1

procedures, have increased the life expectancy in well developed countries to ~78 years.5
This extended longevity leads to an increased duration of wear and tear on the body that
inevitably leads to partial or total breakdown of overused joints and articulating surfaces.
As time passes and medical knowledge advances, the once main focus of medicine,
“quantity of life” comes second to the ever expanding “quality of life” issue.
The advent of implantable prosthetics has come a long way in alleviating the quality of
life issue by replacing worn out joints; but there is still vast room for improvement.
While the materials used to make implants are becoming increasingly more suitable for in
vivo use, there are still issues in regards to sterilization. Sterilization techniques were
designed specifically for ex vivo materials and surgical instruments that were not intended
to be left in the body. Sterilization techniques must be re-evaluated to insure they work
effectively on implants and do not have any lasting harmful affect on the properties of the
implant or the tissue that surrounds it. Current research has shown that the type of
sterilization can have an effect on the durability and in vivo lifespan of the implant.6 In
order to accommodate the increasing longevity of humans, new sterilization techniques
that do not have harmful effects on implantable devices must be discovered and
evaluated.
_____________________________________________________________________ 2

1.2 Problem Statement
The purpose of this study was to assess the feasibility of using supercritical carbon
dioxide and small amounts of chemical modifiers to reduce bacterial and fungal
contaminations deposited onto ultra-high molecular weight polyethylene to acceptable
FDA standard levels. A 6 log reduction of bacterial spores is required by the FDA in
order to approve any sterilization technique.7 The chemical modifiers used in
conjunction with supercritical carbon dioxide (SC CO2) in this study were ethanol,
distilled water, and hydrogen peroxide. These modifiers are known to play an important
role in the sterilization procedure and as such the volume of each modifier was varied in
order to determine the their relative importance in the sterilization process as well as what
conditions resulted in a 6 log reduction while minimizing the total mole fraction of
modifiers.
It is also important to demonstrate that the SC CO2 sterilization process had no significant
impact on the mechanical strength or oxidation level of the polymer implants fabricated
from UHMWPE. As any sterilization process may have a negative impact on the
sterilization media, it is important to determine the degree of degradation so the
sterilization process can be evaluated for implant applicability.
_____________________________________________________________________ 3

1.3 Statement of Objectives
The three main goals of this research were:
1) To determine optimal conditions that would ensure complete sterilization (6 log
reduction) of all bacteria (including spores) and fungi while minimizing the amount of a
required additives.
2) To determine the effect of the sterilization process on the mechanical strength of
treated ultra-high molecular weight polyethylene.
3) To determine the effect of the sterilization process on the level of oxidation of treated
ultra-high molecular weight polyethylene.
_____________________________________________________________________ 4

2. Literature Review
2.1 Ultra-High Molecular Weight Polyethylene
Approximately 570,000 total hip and knee replacement surgeries are performed every
year that use ultra-high molecular weight polyethylene (UHMWPE) as the key
articulating surface componenent.8 This number is expected to grow to 750,000 total
replacement surgeries by 2030.9 Since 1995, the market for medical implants has grown
from 1.8 billion dollars to 3.5 billion dollars in 2004 and has a current revenue growth
rate of 12%.10,11 The growing need for implants, and subsequently UHMWPE
components, mirrors an increasing desire to better understand how various pre-
implantation polymer treatments affect its desirable high tensile strength, high impact
strength, and corrosion and abrasion resistant properties. The main problem with
UHMWPE implants is the in vivo creation of small UHMWPE particulates due to normal
wear of the implant. Unfortunately, these particles activate an immune response which
leads to chronic inflammation and ultimate failure of the implant. Recent research has
shown that the method of sterilization can have a large affect on the the in vivo longevity
of the implant.
2.2 Commercial Sterilization Methods for UHMWPE
2.2.1 Gamma Irradiation
Gamma irradiation has been used to sterilize UHMWPE components since the 1960’s
and is still largely used in industry today. Typically, the polymer samples are treated
with a radiation dosage of 25 to 40 kGy in order to fully sterilize them. The samples
were then originally stored in an air-permeable package but this was found to be
_____________________________________________________________________ 5

detrimental to the implant. The gamma irradiation sterilization process creates large
quantities of free radicals (from polymer chain scission) throughout the polymer, which
become oxidized when exposed to air.12 This oxidation process increases the
crystallinity and density of polymer and leads to decreased mechanical strength
properties. Most noticeably is the increased embrittlement of the region 1-2 mm below
the articulating surface of the polymer. The irradiation can also cause crosslinking of the
polymer chains which may improve the mechanical properties. Industry standards have
since switched over to using non-permeable packing for storage of the polymer samples.
2.2.2 Ethylene Oxide
Ethylene oxide has been used to sterilize UHMWPE since the 1980’s and while it works
well against bacteria, spores, and viruses, it is highly toxic. Ethylene oxide is a good
candidate for UHMWPE sterilization because the polymer does not chemically react with
ethylene oxide. During sterilization, the temperature, duration, and humidity must be
rigorously controlled but this process does effectively sterilize entire modular
components without affecting the physical, chemical, or mechanical properties of
UHMWPE. Besides the high levels of toxicity, the largest draw back with using ethylene
oxide as a sterilization method is the cycle time. The process begins with an 18 hour
period of preconditioning with 65% relative humidity and is then followed by 100%
ethylene oxide gas exposure at 0.04MPa. The UHMWPE samples then undergo an 18
hour period of forced aeration to remove the ethylene oxide gas that has leeched into the
polymer. The entire process takes 41 hours and results in effective sterilized polymer as
well as a need to dispose of the toxic gas.
_____________________________________________________________________ 6

2.2.3 Gas Plasma
Low-temperature gas plasma has only been around since the early 1990’s but is quickly
becoming a preferred sterilization method due to the low temperature conditions and the
environmentally friendly reagents. The two commercially available methods deactivate
microorganism by ionizing either peracetic acid or hydrogen peroxide to create low
temperature gas plasma. The sterilization process can be accomplished at temperatures
lower than 50ºC and cycle time for this process can range anywhere from 75 minutes to
3-4 hours. Because of the lack of hazardous byproducts and short cycle times, this
method is the most economically desirable approach. The gas plasma sterilization affect
on the chemical and mechanical properties of the UHMWPE is still not well known.
Some research suggests that there plasma sterilization has little affect on the physio-
chemical properties while other work shows that it can induce surface oxidation of the
polymer. 13, , , ,14 15 16 17
2.3 Supercritical Carbon Dioxide (CO2)
Supercritical fluid science deals with fluids above their critical temperature and critical
pressure. After reaching the critical point, the fluid enters a supercritical phase in which
there is no longer a distinction between gas and liquid phases. Supercritical fluids have
solvent properties and densities similar to those normally associated with liquids but have
mass transfer properties and viscosities more commonly associated with gases.18 Carbon
dioxide is often used within the supercritical region because the aforementioned
_____________________________________________________________________ 7

properties can be reached at relatively low critical temperature and pressure values
(31.1ºC and 75 bar).
Supercritical CO2 is also of interest for sterilization because it has been shown to have
anti-microbial effects at high pressures while still being otherwise non-toxic,
inflammable, non-hazardous, generally chemically inert, and cheap.19, ,20 21 22 Although
the mechanism of CO2 sterilization is not well understood it is predominately thought of
as a series of synergistically contributing factors. The increased diffusitivity properties of
supercritical CO2 allow it to cross the cellular membranes of microbes and extract
necessary nutrients. The CO2 also has the potential to react with water within the
microbe and form carbonic acid. The acid lowers the internal pH of the cell and
deactivates pH sensitive cellular components. The rapid entrance and exit of CO2 (rapid
pressurization23 and depressurization24) from the cell could also disturb the cellular
membranes and destroy the ionic gradient necessary for cell survival.
The addition of small amounts of modifiers to supercritical CO2 has been shown to aid in
the inactivation of microbes such as bacteria and fungi.25 Work performed by Hemmer et
al. showed that while supercritical CO2 could inactivate bacterial resistant spores in 25
min. while at 300 atm and 110ºC; complete inactivation could be achieved in 1 hour and
40ºC with the addition of <100 ppm of hydrogen peroxide.26 The work of White et al.
demonstrated similar deactivation results using trifluoroacetic acid and peracetic acid. In
her study, the sterilization of bacteria using peracetic was found to be 100x more
_____________________________________________________________________ 8

effective when pressurized using CO2 rather than air. This demonstrates the specific
synergistic effect of CO2 + modifiers.27
_____________________________________________________________________ 9

3. Experimental
3.1 Experimental Materials and Equipment
The materials and equipment used throughout this experiment are listed below:
1. Ultra-High Molecular Weight Polyethylene Powder (GUR 1050) supplied by
Ticona in Bayport, TX (average MW = 4-6 million)
2. Carbon Dioxide (food grade, 99.9% purity) purchased from BOC
3. Kimwipe® tissue paper
4. Ethanol (99.9%)
5. Hydrogen peroxide (30% in water, Ajax fine chemical pty ltd)
6. Sabouraud-4% Dextrose Agar for microbiology (1.05438.0500) was supplied by
Merck in Darmstadt, Germany
7. Sodium Chloride Peptone Solution (CM0982) supplied by Oxoid in Hampshire,
England
8. Tryptone Soya Agar (CM0131) supplied by Oxoid in Hampshire, England
9. White American Ginseng (Panax quinquefolius) that was donated by The Simply
Ginseng Company in Bungendore, Australia and Natto
10. ISCO High Pressure 500D Series Syringe Pump
11. Sterile Petri Dishes
12. Metal Loop for plating
13. Bio-Rad BR-2000 Vortexer
14. 1mL pipette tips
15. Water bath and heater
16. 10mL pipette
_____________________________________________________________________ 10

17. Gelaire® Biological Safety Hood
18. Techno-Plas 75mL sterile containers
19. Blue Max™ 50mL Polypropylene conical tube
20. Stratos Biofuge Centrifuge
21. Thermoline Refrigerated Incubator
22. Siemens Validator® Plus AF Autoclave
23. Bacto Autoclave Waste Bag
24. 1000μL Transferpette® S pipette
25. 100μL Transferpette® S pipette
26. 1mL calibrated pipette
27. Swagelok stainless steel fittings
28. A Geo. E. & Son compression molder
29. High pressure vessel (40 mL)
3.1.1 Buffered Sodium Chloride Peptone Solution Creation
The Buffered Sodium Chloride Peptone Solution was created by mixing 14.63g of
Buffered Sodium Chloride Peptone powder in 1L of distilled water. The solution was
mixed for five minutes and then autoclaved at 121ºC and 0.115MPa for fifteen minutes.
The solution was stored at room temperature and used when required.
3.1.2 Tryptone Soya Agar Creation
The Tryptone Soya Agar was created by mixing 40g of Tryptone Soya Agar powder in
1L of distilled water. The solution was mixed and boiled until the agar powder was
_____________________________________________________________________ 11
dissolved. The solution was then autoclaved at 121ºC and 0.115MPa for fifteen minutes.
After autoclaving, approximately 15-20mL of the sterilized solution was poured into
sterile Petri dishes. The agar was cooled in a sterile fume hood until it solidified and then
the dishes were capped and stored upside down at refrigerated conditions for a maximum
of two weeks.
3.1.3 Sabouraud Dextrose Agar Creation
The Sabouraud Dextrose Agar was created by mixing 65g of Sabouraud Dextrose Agar
powder in 1L of distilled water. The solution was mixed and boiled until the agar powder
was dissolved. The solution was then autoclaved at 121ºC and 0.115MPa for fifteen
minutes. After autoclaving, approximately 15-20mL of the sterilized solution was poured
into sterile Petri dishes. The agar was cooled in a sterile fume hood until it solidified and
then the dishes were capped and stored upside down at refrigerated conditions for a
maximum of two weeks.
3.1.4 Contaminated Buffer Solution Creation
Forty milliliters of the Buffered Sodium Chloride Peptone Solution was mixed with 4g of
contaminated ginseng powder and vortexed for 1 min. The mixture was centrifuged for
10 min at 18°C and 1000 rpm. The fluid layer was extracted and stored for 3 days in a
37°C incubator. Seven milliliters of the amplified extract was mixed with 50mL of
sterile Buffered Sodium Chloride Peptone solution and stored in a 37°C incubator. This
solution was used to contaminate all polymer samples.
_____________________________________________________________________ 12

3.2 Ultra-high Molecular Weight Polyethylene
3.2.1 UHMWPE Sample Creation
Ultra high molecular weight polyethylene samples were made from powdered UHMWPE
(Ticona GUR 1050). Four hundred milliliters of UHMWPE powder was poured into a
square 25cm by 25cm Teflon® film covered mold in order to create a 4-5mm thick solid
sheet. The bottom platen of a compression molder (Geo. E. & Son) was heated to 200°C
and then the mold was placed between the upper and lower platens for 1.5 hours. The top
platen was then heated to 200°C and 4MPa of pressure was applied to the mold. After
1.5 hours, the heat was turned off and the mold was left over night under pressure. The
mold was then removed and the polymer square was cut into 9.5mm wide by 63.5mm
long rectangles to comply with ASTM D 638 type V tensile bars.
3.2.2 UHMWPE Sample Contamination
The polymer samples were cleaned with a solution of detergent and distilled water,
sterilized with 70% ethanol solution and placed under a sterile laminar flow cabinet (class
1) near an open flame to dry. Prior to each SC CO2 sterilization experiment, 0.5mL of
contaminated buffer solution was pipetted onto the surface of the UHMWPE samples (2
per experiment). The buffer solution was dried in a sterilized laminar flow cabinet near
an open flame and the mass of contaminant was recorded.
3.3 UHMWPE Sterilization Procedure
A schematic diagram of the high pressure apparatus used for the sterilization is shown in
Figure 3.1. The apparatus consists of a high pressure syringe pump (ISCO 500D), a
_____________________________________________________________________ 13

controlled temperature water bath (Thermoline TSB1), and a high pressure vessel
(volume 40 mL).
Figure 3.1: Diagram of the Sterilization Apparatus
The apparatus (pressure vessel and lines) was washed with 100wt% ethanol (EtOH) and
dried overnight in an oven. It was then placed in a sterile fume hood and heated with a
blow dryer to remove any excess EtOH. A Kimwipe® was sterilized using 100wt%
EtOH and air dried within the sterile hood. This Kimwipe® was then placed in the lower
portion of the pressure vessel and the necessary amount of modifiers (water, EtOH, and
hydrogen peroxide (H2O2)) was pipetted onto the Kimwipe®. One contaminated sample
was suspended in the upper portion of the pressure vessel and then the vessel was sealed,
connected to a High Pressure ISCO Pump and submerged in a 37°C water bath. The
vessel was rapidly pressurized to 170 bar CO2 (< 5 min) for 2 hours. (The pressure,
temperature, and amount of time were chosen based on a previous study in which
modified CO2 was found to completely inactivate microorganisms in contaminated
ginseng at these conditions.) The vessel was then disconnected from the system, rapidly
_____________________________________________________________________ 14

depressurized from the bottom (< 1 minute), and moved to the sterile fume hood. The
sample was removed, placed in 10mL of buffer solution, and vortexed until no
contaminated solid particulate remained visible in the solution. The untreated control
polymer sample was also placed in 10mL of buffer solution and vortexed in a similar
manner as the sterilized sample. Two serial 100-fold dilutions were prepared for each
sample by diluting 0.1mL of suspended sample in 9.9mL of autoclaved distilled water
and vortexed. One milliliter from each dilution (the buffer solution in which the samples
were placed and two serial dilutions) was pipetted onto a Tryptone Soya Agar plate and a
Sabouraud Dextrose Agar plate. A metal loop sterilized with 100wt% EtOH and placed
in an open flame was used to swab the fluid sample evenly across the surface of the agar
plates. The agar plates were then covered, labeled, and placed in a 35°C incubator for 24
hours. The Tryptone Soya Agar plates were checked for bacteria and the number of
colonies was recorded. The Sabouraud Dextrose Agar plates were checked for the
presence of fungal growth.
_____________________________________________________________________ 15

3.4 Experimental Runs
The experimental conditions tested are shown in Table 3.1. All experiments were
performed at 170 bar CO2 and 37ºC for two hours. Each condition was tested twice to
ensure accuracy of results.
Table 3.1: Conditions of Experimental Runs
Amount of Modifier Added Run
Ethanol (mL) Water (mL) Hydrogen Peroxide (mL) 1 0 0 0 2 0.1 0.1 0.1 3 0.05 0.05 0.05 4 0.025 0.025 0.025 5 0.01 0.01 0.01 6 0 0 0.1 7 0 0 0.05 8 0 0 0.025 9 0.1 0 0
10 0.1 0 0.1 11 0 0.025 0.025 12 0.025 0 0.025
3.5 Microbial Measurement Procedure
The degree of sterilization of the contaminated polymer sample was expressed as a
reduction of the original amount of microbes found on the contaminated control polymer
sample.
The amount of bacteria was measured by the number of individual colonies that formed
on the surface of the agar plates. The number of colony forming units per gram (CFU/g)
was calculated using Equation 1.
_____________________________________________________________________ 16

CFU number of bacterial colonies 1 Volume of Contaminate Agar Plating Volume dilution factor Mass of Contaminateg
= × × (Eq.
1)28
Where the dilution factor is 5E-2, 5E-4, or 5E-6, agar plating volume is 1mL, volume of
contaminate is 0.5mL, and mass of contaminate is the measured mass of the contaminate
in grams.
The CFU/g value was used in Equation 2 to calculate the total log reduction of its initial
total microbial aerobic count (TAMC) due to sterilization.
0
1
NLog Reduction = N
Log⎛ ⎞⎜⎝ ⎠
⎟ (Eq. 2)29
Where N0 is the number of CFU/g in the untreated contaminated sample and N1 is the
number of CFU/g in the treated contaminated sample.
Due to the nature of fungi (it grows in as one indistinguishable mass across the surface of
the agar plates and thus cannot be quantified) it was recorded as a positive or negative
presence. An example of bacterial and fungal growth and complete inactivation is shown
in Figure 3.2.
_____________________________________________________________________ 17

Figure 3.2: Bacterial and Fungal Growth
Clockwise from top left: fungal growth, bacterial colonies, complete inactivation of bacteria, and complete inactivation of fungi
3.6 Experimental Validation Procedures
Before commencement of the experimentation, all solutions and sterilized items were
tested to insure their sterility. Untreated contaminated polymer samples were also tested
to insure a consistent level of contamination.
3.6.1 Agar Plate Validation
A random sampling of Tryptone Soya Agar and Sabouraud Dextrose Agar plates were
selected from each batch of newly made agar plates and placed in a 35°C incubator for 24
hours. The agar plates were checked for the presence of bacterial and fungal growth,
_____________________________________________________________________ 18

respectively. No microbial growth was detected, indicating the sterile nature of the agar
plates.
3.6.2 Pressure Vessel Validation
The sterilization procedure for the vessel was validated by conducting a blank run. After
the sterilization of the vessel, two runs were performed using uncontaminated UHMWPE
samples as controls. No microorganisms were detected on the samples after plating,
corroborating that the vessel sterilization procedure was valid.
3.6.3 Sodium Chloride Peptone Buffer Solution Validation
The buffer solution was thoroughly mixed and 1mL of solution was pipetted onto three
separate Tryptone agar plates and three separate Sabouraud agar plates. The plates were
then placed in a 35°C incubator for 24 hours. No microbial growth was detected,
corroborating that the buffer solution sterilization procedure was valid.
3.6.4 Kimwipe® Tissue Validation
The sterilized Kimwipe® was vortexed with 10mL of Peptone Buffer solution and 1mL
of solution was pipetted onto three separate Tryptone agar plates and three separate
Sabouraud agar plates. The plates were then placed in a 35°C incubator for 24 hours. No
microbial growth was detected, corroborating that the Kimwipe® sterilization procedure
was valid.
3.6.5 Autoclaved Distilled Water Validation
_____________________________________________________________________ 19

The autoclaved distilled water (121ºC and 0.115MPa for fifteen minutes) was thoroughly
mixed and 1mL of solution was pipetted onto three separate Tryptone agar plates and
three separate Sabouraud agar plates. The plates were then placed in a 35°C incubator for
24 hours. No microbial growth was detected, corroborating that the distilled water
sterilization procedure was valid.
3.6.6 Contaminated Polymer Sample Validation
Two untreated contaminated samples were placed in 10mL of buffer solution and
vortexed until no contaminated solid particulate remained visible in the solution. Two
serial 100-fold dilutions were prepared for by diluting 0.1mL of suspended sample in
9.9mL of autoclaved distilled water and vortexed. One milliliter from each dilution (the
buffer solution in which the samples were placed and two serial dilutions) was pipetted
onto a Tryptone Soya Agar plate and a Sabouraud Dextrose Agar plate. A metal loop
sterilized with 100wt% EtOH and placed in an open flame was used to swab the fluid
sample evenly across the surface of the agar plates. The agar plates were then covered,
labeled, and placed in a 35°C incubator for 24 hours. The plates were analyzed and the
two separate contaminated samples were found to have similar amounts of contamination
for all dilutions.
3.7 Validation Testing for the Physio-Chemical Properties of UHMWPE
3.7.1 Mechanical Strength Testing
Tensile bars were created from untreated and CO2 + modifier treated UHMWPE samples
according to ASTM D 638 type V tensile bar standards. An Instron (4468) with a 10 kN
_____________________________________________________________________ 20

load cell and cross-head speed of 100 mm/min was used to pull the bars until breaking.
The maximum load and elongation length was recorded for each sample. These values
were normalized by dividing by the sample cross-sectional area. In total, the mechanical
properties of 41 tensile bars were tested (12 had not been exposed to CO2 and 29 had
been exposed).
3.7.2 Fourier Transform Infrared Spectroscopy (FTIR) Analysis
Fourier transform infrared (FTIR) spectroscopy analysis was performed using a Varian
660-IR spectrometer in order to investigate the effect of CO2 ± modifiers on the oxidation
of levels of UHMWPE. The FTIR spectra for the untreated polymer sample, pure CO2
treated polymer sample, and CO2 + modifiers treated polymer sample were collected
immediately after depressurization. The oxidation level of UHMWPE can be determined
based upon normalized measurements of the area under the carbonyl peak in the region of
1650-1850 cm-1.
_____________________________________________________________________ 21

4. Results and Discussion
4.1 Sterilization Results
The log reduction results of the experimental runs are located in Table 4.1.
Table 4.1: Log Reduction Results for Each Experimental Run
Test #
EtOH (μL)
H2O (μL)
30 vol% H2O2 (μL)
EtOH (mol fract.)
H2O (mol fract.)
H2O2 (mol fract.)
Bacterial log
reduction
Fungal log
reduction1 0 0 25 0.0E+00 1.3E-03 4.2E-04 2.2 22 100 100 100 2.2E-03 1.2E-02 1.6E-03 6.0 63 0 0 100 0.0E+00 5.1E-03 1.7E-03 6.0 64 0 0 100 0.0E+00 5.1E-03 1.7E-03 6.0 65 0 0 50 0.0E+00 2.6E-03 8.3E-04 6.0 66 0 0 50 0.0E+00 2.6E-03 8.3E-04 6.0 67 100 0 0 2.3E-03 0.0E+00 0.0E+00 1.4 28 100 0 0 2.3E-03 0.0E+00 0.0E+00 2.1 29 100 100 100 2.2E-03 1.2E-02 1.6E-03 6.0 610 25 25 25 5.6E-04 3.1E-03 4.2E-04 6.0 611 25 25 25 5.6E-04 3.1E-03 4.2E-04 6.0 612 50 50 50 1.1E-03 6.2E-03 8.3E-04 6.0 613 50 50 50 1.1E-03 6.2E-03 8.3E-04 6.0 614 10 10 10 2.3E-04 1.2E-03 1.7E-04 3.1 215 10 10 10 2.3E-04 1.2E-03 1.7E-04 1.8 216 0 25 25 0.0E+00 3.1E-03 4.2E-04 6.0 617 0 25 25 0.0E+00 3.1E-03 4.2E-04 6.0 618 25 0 25 5.6E-04 1.3E-03 4.2E-04 6.0 619 100 100 100 2.2E-03 1.2E-02 1.6E-03 6.0 620 100 100 100 2.2E-03 1.2E-02 1.6E-03 6.0 621 0 0 0 0.0E+00 0.0E+00 0.0E+00 2.6 422 0 0 0 0.0E+00 0.0E+00 0.0E+00 1.8 223 0 0 100 0.0E+00 5.1E-03 1.7E-03 6.0 624 0 0 100 0.0E+00 5.1E-03 1.7E-03 6.0 625 0 0 25 0.0E+00 1.3E-03 4.2E-04 2.2 226 50 50 50 1.1E-03 6.2E-03 8.3E-04 6.0 -27 100 100 0 2.2E-03 7.2E-03 0.0E+00 2.2 2.028 100 100 0 2.2E-03 7.2E-03 0.0E+00 2.2 2.0
The mole fractions were determined by using the modified Benedict-Webb-Rubin
equation of state (CO2 density determination), the volume of the high pressure vessel, the
volume and density of the liquid modifiers at ambient conditions, and the respective
_____________________________________________________________________ 22

molecular weights of each species. The ambient condition liquid values of the modifiers
were used because they were under ambient conditions during insertion and then they
were pressurized.
As illustrated by Table 4.1, most of the experimental conditions tested resulted in
complete inactivation. Experimental runs 2, 9-15, 19, and 20 (in which modifiers were
added in equal volume amounts) demonstrate that complete sterilization can be achieved
with a total modifier mole fraction of > 4.1E-03 (Figure 4.1) which represents a total
75μL amount for all three modifiers (1:1:1 volume ratio).
0
1
2
3
4
5
6
0.0E+00 2.0E-03 4.0E-03 6.0E-03 8.0E-03 1.0E-02 1.2E-02 1.4E-02 1.6E-02 1.8E-02
Total Modifier (mol frac)
Bac
teria
l Log
Red
uctio
n
Figure 4.1: : Bacterial Log Reduction vs. Total Modifier Mole Fraction Data (Tests 2, 9-15, 19-22)
The data in Figure 4.2 shows that any mole fraction of 30vol% H2O2 > 3.4E-03 (2.6E-03
water and 8.3E-04 H2O2 mole fractions) results in complete inactivation of
microorganisms while any mole fraction < 1.7E-03 (1.3E-03 water and 4.2E-04 H2O2
mole fractions) only results in a log reduction of 2.
_____________________________________________________________________ 23

0
1
2
3
4
5
6
0.0E+00 1.0E-03 2.0E-03 3.0E-03 4.0E-03 5.0E-03 6.0E-03 7.0E-03 8.0E-03
30 Vol% Hydrogen Peroxide (mol frac)
Bac
teria
l Log
Red
uctio
n
Figure 4.2: : Bacterial Log Reduction vs. 30vol% Hydrogen Peroxide Mole Fraction Data (Tests 1, 3, 4, 5, 6, 21, 22, 23, 24, 25)
The experimental data also shows that ethanol (2.2E-03 mole fraction) or an
ethanol/water mixture (2.3E-03 and 7.2E-03 mole fractions, respectively) have minimal
effect on the log reduction compared with CO2 without modifiers. All three conditions
yielded bacterial log reductions ranging from 1.4 to 2.6 (Tests 7, 8, 21, 22, 27, 28),
whereas an ethanol/30vol% H2O2 mixture (5.6E-04 and 1.7E-03 mole fractions,
respectively) exhibits complete sterilization (Test 18). This suggests that a synergistic
sterilization effect exists due to the combination of ethanol and H2O2.
According to the experimental results, 30 vol% H2O2 has the largest effect on sterilization
while ethanol, and ethanol/water combinations had negligible effects. The lowest total
mole fraction of modifiers that was efficient for complete sterilization was 2.3E-03
(composed of EtOH/30vol% H2O2 in a 25μL:25μL ratio) and the lowest mole fraction of
_____________________________________________________________________ 24

a single modifier required for complete sterilization was 1.7E-03 (25μL of 30vol%
H2O2).
In order to test for the statistically important modifier compositions an analysis of the
variance (ANOVA) test (α=0.05) was run using a full factorial model. The ANOVA test
shows that 30 vol% hydrogen peroxide (p=0.021), a mixture of water with ethanol
(p=0.014), and ethanol with 30 vol% hydrogen peroxide (p=0.006) had the most
significant impacts on the microbial log reduction. With the exception of the water
ethanol mixture, the statistical results obtained corroborate well with the experimental
data.
Other researchers have observed similar sterilization effects from the addition of
modifiers such as water, ethanol, and H2O2 to SC CO2.,, ,30 31 Similar to this work,
Dehghani et al. found that complete sterilization could be achieved at moderate
temperatures and pressures using small mole fractions of H2O2. The work of Zhang et al.
also demonstrated the increased efficacy of sterilization when using H2O2 as a modifier
instead of water or ethanol.
4.2 Physio-Chemical Property Results
4.2.1 Mechanical Strength Results
A T-test (α=0.05) was performed on the two populations of UHMWPE tensile bars
(treated and untreated) and the results demonstrated that the two populations were not
statistically different (p=0.84 for maximum loadcross-sectional area
and p=0.92 for
_____________________________________________________________________ 25
maximum elongationcross-sectional area
). This result demonstrates that the sterilization technique used in
this study had no negative effect on the mechanical strength of the UHMWPE polymer.
4.2.2 FTIR Results
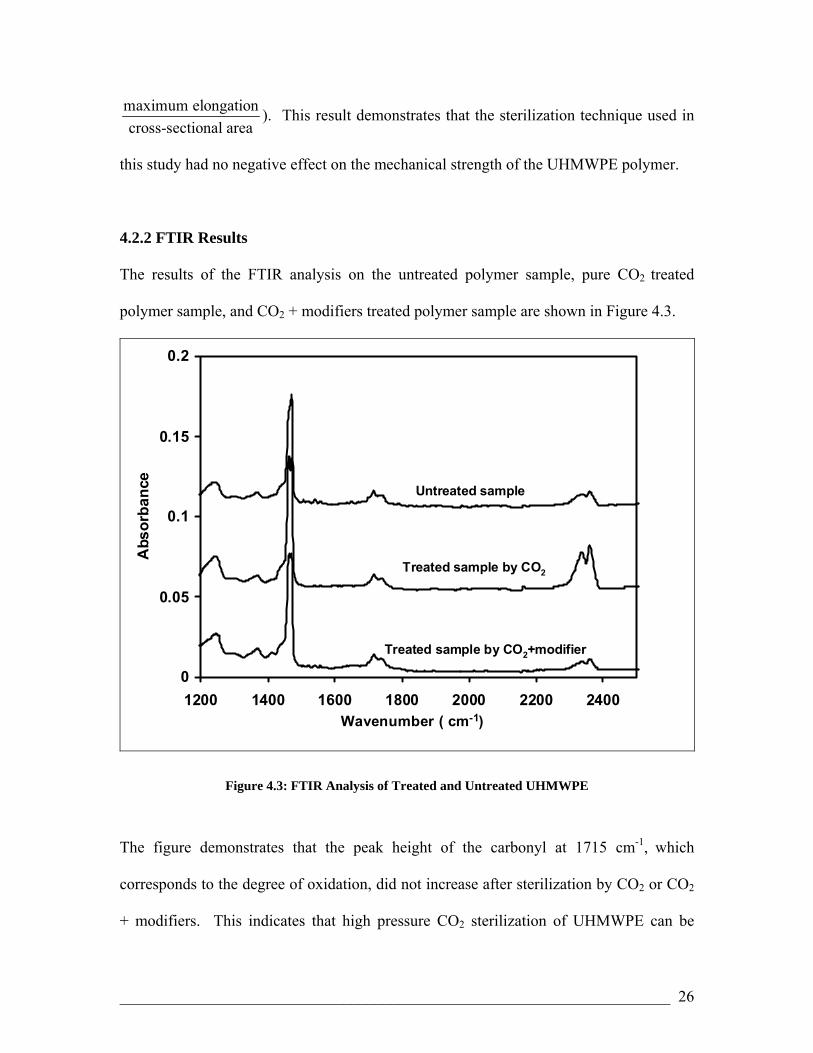
The results of the FTIR analysis on the untreated polymer sample, pure CO2 treated
polymer sample, and CO2 + modifiers treated polymer sample are shown in Figure 4.3.
0
0.05
0.1
0.15
0.2
1200 1400 1600 1800 2000 2200 2400
Abs
orba
nce
Treated sample by CO2
Treated sample by CO2+modifier
Wavenumber ( cm-1)
Untreated sample
0
0.05
0.1
0.15
0.2
1200 1400 1600 1800 2000 2200 2400
Abs
orba
nce
Treated sample by CO2
Treated sample by CO2+modifier
Wavenumber ( cm-1)
Untreated sample
Figure 4.3: FTIR Analysis of Treated and Untreated UHMWPE
The figure demonstrates that the peak height of the carbonyl at 1715 cm-1, which
corresponds to the degree of oxidation, did not increase after sterilization by CO2 or CO2
+ modifiers. This indicates that high pressure CO2 sterilization of UHMWPE can be
_____________________________________________________________________ 26

accomplished without any adverse effect on the chemical integrity of the polymer. Other
methods of sterilization, such as gamma irradiation and gas plasma, have been shown to
produce free radicals on the surface of UHMWPE. These free radicals lead to oxidative
degradation of UHMWPE, which shortens the polymer’s longevity in vivo.,
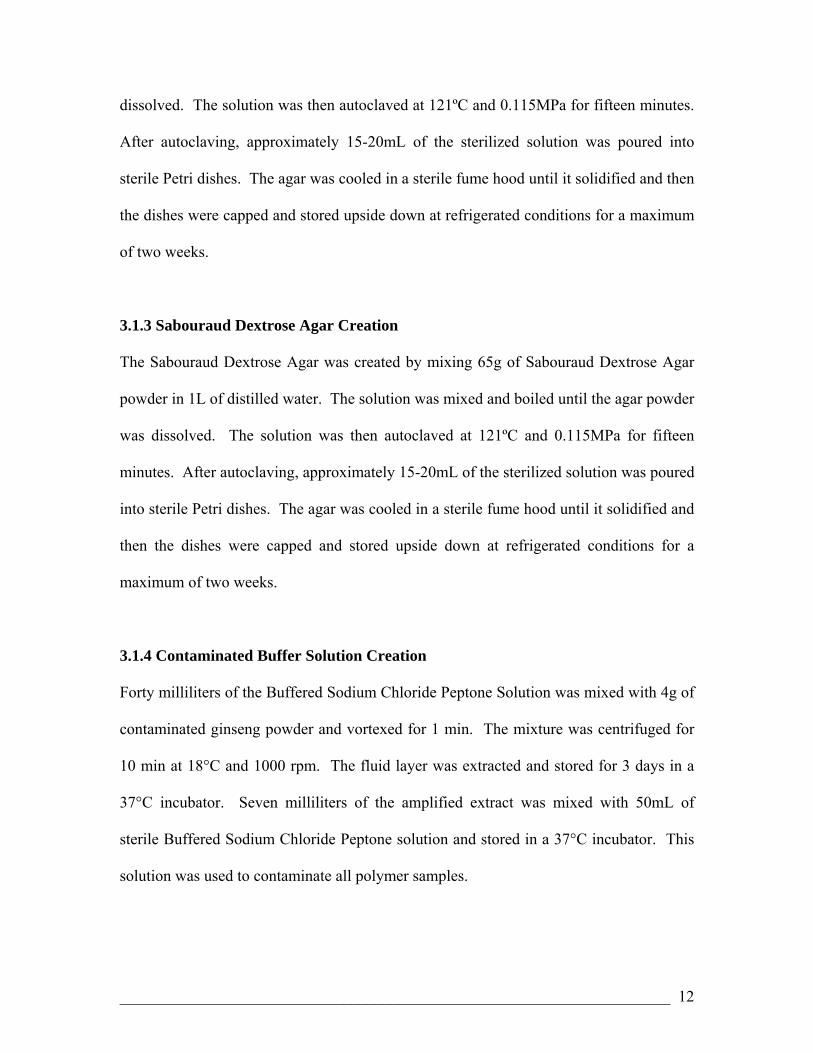
4.3 Phase Behavior Modeling of CO2 and Modifiers
In order to design better experimental procedures and understand the governing factors of
CO2 + modifier based sterilization it is crucial to determine the phase behavior of the
CO2+EtOH+H2O+H2O2 quaternary system. Unfortunately, to the best of my knowledge
no literature data exists for the desired experimental system so it was instead modeled as
a pseudo-ternary system. This was done by assuming the moles of hydrogen peroxide
could be treated as pure water. The phase equilibrium of the CO2 + modifiers was
estimated using the work of Lim et al. in which they studied a CO2+H2O+EtOH ternary
system.32 The phase diagram for the pseudo-ternary system is shown in Figure 4.4.
_____________________________________________________________________ 27

Ethanol0.00
0.02
0.04
0.06
0.08
0.10
0.10
0.08
0.06
0.04
0.02
0.00
1.000.980.960.940.920.90
H2OCO2
Ethanol0.00
0.02
0.04
0.06
0.08
0.10
0.10
0.08
0.06
0.04
0.02
0.00
1.000.980.960.940.920.90
H2OCO2
0.00
0.02
0.04
0.06
0.08
0.10
0.10
0.08
0.06
0.04
0.02
0.00
1.000.980.960.940.920.90
H2OCO2
40°C 142 bar40°C 185 bar60°C 142 bar60°C 185 bar
37°C 170 bar 0.1 mL of each37°C 170 bar 0.05 mL of each37°C 170 bar 0.025 mL of each40°C 142 bar40°C 185 bar60°C 142 bar60°C 185 bar
37°C 170 bar 0.1 mL of each37°C 170 bar 0.05 mL of each37°C 170 bar 0.025 mL of each
Figure 4.4: Pseudo Ternary Modeling of the High Pressure Vessel System. Data points from Lim et al.
The equilibrium curve in Figure 4.4 is the phase boundary that separates the one phase
region (the data points to the right of the curve) and the two phase region (the data points
to the left of the curve). The 37°C and 170 bar operating conditions used in this study
closely matched the literature data and so the equilibrium curve for the quaternary system
was assumed to be the same as the literature data ternary system. According the Figure
4.4, the quaternary data point consisting of CO2 and 0.1mL of all three additives lies
within the two phase region while the CO2 and 0.05mL of all three additives data point
lies just within the one phase region. This suggests that the CO2 phase was saturated for
the former condition and nearly saturated for the latter condition. All other
experimentally tested conditions lie within the one phase region.
_____________________________________________________________________ 28

5. Conclusions
The complete sterilization (indicated by a 6 log reduction) of bacteria (including spores)
and fungi on ultra-high molecular weight polyethylene was accomplished by using
supercritical CO2 and modifiers at 37°C and 170 bar for 2 hours. Of the three modifiers
that were tested, hydrogen peroxide produced the greatest impact on bacterial and fungal
log reduction, while water produced the least impact. The mechanical strength testing
demonstrated that CO2 + modifier based sterilization had no statistically significant
negative effects on the tensile strength or elongation properties of the polymer. The
FTIR studies showed that the sterilization process did not adversely affect the level of
oxidation of the polymer.
The three aims of this study have all been met:
1) Complete sterilization of contaminated UHMWPE was achieved using CO2 +
modifiers.
2) The mechanical properties of the UHMWPE were unchanged after the sterilization
process.
3) The surface of the UHMWPE showed no signs of increased oxidation.
This method of sterilization shows great promise because it uses environmentally friendly
reagents at relatively safe operating conditions to achieve the desired level of
sterilization. The lack of change to the physio-chemical properties of UHMWPE also
makes it an excellent alternative to current sterilization because it has the ability to
improve the longevity of human artificial joint implants.
_____________________________________________________________________ 29

6. Future Work
While the optimum conditions for sterilization of the contaminated UHMWPE samples
were determined, the phase behavior of the quaternary system and the internal
interactions between the CO2 and modifiers are still not well understood. Further work
needs to be done to better understand the internal workings of the system to better model
the sterilization process. This can be done by either using thermodynamic simulation
software to model the system or connecting the vessel to a high pressure gas
chromatography unit to record the phase behavior experimentally.
Work that parallels this study should also be done on UHMWPE and metal composites to
determine if the interface properties are negatively affected by the sterilization procedure.
This would lead well into a one step sterilization of the entire joint replacement implant.
_____________________________________________________________________ 30

7. References
1 University of California, Brief History During the Snow Era (1813-58), Cholera Prevailing Theories. Retrieved May 23, 2009 from http://www.ph.ucla.edu/epi/snow/1859map/cholera_prevailingtheories_a2.html. 2 Faria, M.A. Jr., Medical History -- Hygiene and Sanitation, Medical Sentinel, 2002, 7, (4), 122-123, Retrieved May 23, 2009 from http://www.haciendapub.com/faria5.html 3 ASP., A Century of Sterilization Leadership, History of Sterilization, 2007. Retrieved May 23, 2009 from http://web.archive.org/web/20070106144734/http://www.sterrad.com/about_asp/history_of_sterilization/ 4 Hird, E., Dr. Joseph Lister: Medical Revolutionary, Deep Cove Crier, 1998, Jan. Retrieved May 23, 2009 from http://www3.telus.net/st_simons/cr9801.htm 5 CDC, Life Expectancy, CDC/National Center for Health Statistics, 2009, Mar. Retrieved May 23, 2009 from http://www.cdc.gov/nchs/fastats/lifexpec.htm 6 Kurtz, S. M., The UHMWPE Handbook: Ultra-High Molecular Weight Polyethylene in Total Joint Replacement. Elsevier Academic Press: San Diego, CA 92101-4495, USA, 2004; p 379. 7 Zhang, J.; Burrows, S.; Gleason, C.; Matthews, M. A.; Drews, M. J.; LaBerge, M.; An, Y. H., Sterilizing Bacillus pumilus spores using supercritical carbon dioxide. J. Microbiol. Methods FIELD Full Journal Title:Journal of Microbiological Methods 2006, 66, (3), 479-485. 8 Kurtz, S., Mowat, F., Ong, K., Chan, N., Lau, E., Halpern, M., Prevalence of Primary and Revision Total Hip and Knee Arthroplasty in the United States From 1990 Through 2002, Journal of Bone and Joint SurgeryAmerican, 2005, 87, 1487-1497 9 Kurtz, S.M., Stein, H.L., Redeker, G., Meeting the Joint Replacement Challenge with UHMWPE, Medical Device & Diagnostic Industry, March 2005. 10 Kurtz, S. M.; Muratoglu, O. K.; Evans, M.; Edidin, A. A., Advances in the processing, sterilization, and crosslinking of ultra-high molecular weight polyethylene for total joint arthroplasty. Biomaterials FIELD Full Journal Title:Biomaterials 1999, 20, (18), 1659-1688. 11 Shmulewitz, A.; Langer, R.; Patton, J., Convergence in biomedical technology. Nat. Biotechnol. FIELD Full Journal Title:Nature Biotechnology 2006, 24, (3), 277. 12 Premnath, V., Harris, W.H., Jasty, M., Merrill, E.W., Gamma sterilization of UHMWPE articular implants: an analysis of the oxidation problem, Biomaterials, 1996, 17, (18), 1741-1753. 13 Charlebois, S. J.; Daniels, A. U.; Lewis, G., Isothermal microcalorimetry: an analytical technique for assessing the dynamic chemical stability of UHMWPE. Biomaterials FIELD Full Journal Title:Biomaterials 2002, 24, (2), 291-296. 14 Goldman, M.; Pruitt, L., Comparison of the effects of gamma -radiation and low temperature hydrogen peroxide gas plasma sterilization on the molecular structure, fatigue resistance, and wear behavior of UHMWPE. J. Biomed. Mater. Res. FIELD Full Journal Title: Journal of Biomedical Materials Research 1998, 40, (3), 378-384. 15 McKellop, H.; Shen, F. W.; Lu, B.; Campbell, P.; Salovey, R., Effect of sterilization method and other modifications on the wear resistance of acetabular cups made of ultra-high molecular weight polyethylene. A hip-simulator study. J Bone Joint Surg Am FIELD Full Journal Title:The Journal of bone and joint surgery. American volume 2000, 82-A, (12), 1708-25. 16 Reeves, E. A.; Barton, D. C.; FitzPatrick, D. P.; Fisher, J., Comparison of gas plasma and gamma irradiation in air sterilization on the delamination wear of the ultra-high molecular weight polyethylene used in knee replacements. Proc Inst Mech Eng [H] FIELD Full Journal Title:Proceedings of the Institution of Mechanical Engineers. Part H, Journal of engineering in medicine 2000, 214, (3), 249-55. 17 Lerouge, S.; Tabrizian, M.; Wertheimer, M. R.; Marchand, R.; Yahia, L. H., Safety of plasma-based sterilization: surface modifications of polymeric medical devices induced by Sterrad and Plazlyte processes. Bio-Med. Mater. Eng. FIELD Full Journal Title:Bio-Medical Materials and Engineering 2002, 12, (1), 3-13. 18 Scalia, S., Renda, A., Ruberto, G., Bonina, F., Menegatti, E., Assay of vitamin A palmitate and vitamine E acetate in cosmetic creams and lotions by supercritical fluid extraction and HPLC. J. Pharm. And Biomed. Analysis, 1995, 12, 273-277. 19 Dillow, A.K., Dehghani, F., Hrkach, J.S., Foster, N.R., Langer, R., Bacterial inactivation by using near- and supercritical carbon dioxide. Proc. Natl. Acad. Sci USA, 1999, 96 10344-10348.
_____________________________________________________________________ 31

20 Spilimbergo, S., Elvassore, N., Bertucco, A., Microbial inactivation by high-pressure. Journal of Supercritical Fluids, 2002, 22, 55-63. 21 Kamihira, M.; Taniguchi, M.; Kobayashi, T., Sterilization of microorganisms with supercritical carbon dioxide. Agric. Biol. Chem. FIELD Full Journal Title:Agricultural and Biological Chemistry 1987, 51, (2), 407-12. 22 Zhang, J., Davis, T.A., Matthews, M.A., Drews, M.J., LaBerge, M., An, Y.H., Sterilization using high-pressure carbon dioxide. Journal of Supercritical Fluids, 2006, 38, 354-372. 23 Enomoto, A.; Nakamura, K.; Nagai, K.; Hashimoto, T.; Hakoda, M., Inactivation of food microorganisms by high-pressure carbon dioxide treatment with or without explosive decompression. Biosci., Biotechnol., Biochem. FIELD Full Journal Title:Bioscience, Biotechnology, and Biochemistry 1997, 61, (7), 1133-1137. 24 Fraser, D., Bursting bacteria by release of gas pressure. Nature FIELD Full Journal Title:Nature 1951, 167, (4236), 33-4. 25 Dehghani, F.; Annabi, N.; Titus, M.; Valtchev, P.; Tumilar, A., Sterilization of ginseng using a high pressure CO2 at moderate temperatures. Biotechnol. Bioeng. FIELD Full Journal Title:Biotechnology and Bioengineering 2009, 102, (2), 569-576. 26 Hemmer, J.D., Drews, M.J., LaBerge, M., Matthews, M.A., Sterilization of Bacterial Spores by Using Supercritical Carbon Dioxide and Hydrogen Peroxide. Journal of Biomedical Materials Research Part B: Applied Biomaterials. 2006, March, 511-518. 27 White, A., Burns, D., Christensen, T.W., Effective terminal sterilization using supercritical carbon diozide, Journal of Biotechnology, 2006, 123, 504-515. 28 Dehghani, F. Biochemical Engineering Notes, Department of Chemical Engineering, University of Sydney 2006 29 Zhang, J., Dalal, N., Gleason, C., Matthews, M.A., Waller, L.N., Fox, K.F., Fox, A., Drews, M.J., LaBerge, M., An, Y.H., On the mechanisms of deactivation of Bacillus atrophaeus spores using supercritical carbon dioxide, Journal of Supercritical Fluids, 2006, 38, 268-273. 30 Jimenez, A.; Thompson, G. L.; Matthews, M. A.; Davis, T. A.; Crocker, K.; Lyons, J. S.; Trapotsis, A., Compatibility of medical-grade polymers with dense CO2. J. Supercrit. Fluids FIELD Full Journal Title:Journal of Supercritical Fluids 2007, 42, (3), 366-372. 31 Shieh, E., Paszczynski, A., Wai, C.M., Lang, Q., Crawford, R.L., Sterilzation of Bacillus pumilus, spores using supercritical fluid carbon dioxide containing various modifier solutions. Journal of Microbiological Methods, 2009, 76, 247-252. 32 Lim, J. S.; Lee, Y. Y.; Chun, H. S., Phase equilibria for carbon dioxide-ethanol-water system at elevated pressures. J. Supercrit. Fluids 1994, 7, (4), 219-30.
_____________________________________________________________________ 32

APPENDICES
Table 1: Mechanical Strength Data for Polymer Samples (Load before breaking and Elongation)
Sample Thickness (mm)
Area (mm2)
Extension(mm)
Load(N)
Load/Area(N/mm2)
Ext/Area(1/mm)
Crosshead Speed
(mm/min) Bag # CO2
1 4.31 13.79 65.1 480.5 34.8 4.7 5.08 1 yes 2 4.13 13.22 59.8 477.8 36.2 4.5 100 1 no 3 4.30 13.76 39.6 401.3 29.2 2.9 100 1 yes 4 4.00 12.80 38.4 404.0 31.6 3.0 100 1 yes 5 4.04 12.93 43.6 428.2 33.1 3.4 100 1 yes 6 4.06 12.99 64.3 535.6 41.2 4.9 100 1 yes 7 4.36 13.95 45.7 396.0 28.4 3.3 100 1 no 8 4.22 13.50 38.9 412.1 30.5 2.9 100 1 no 9 4.11 13.15 42.6 381.2 29.0 3.2 100 1 yes
10 4.14 13.25 50.6 457.7 34.5 3.8 100 1 no 11 4.15 13.28 40.3 358.4 27.0 3.0 100 1 yes 12 4.34 13.89 53.6 459.1 33.1 3.9 100 1 yes 13 4.17 13.34 42.7 413.4 31.0 3.2 100 1 no 14 3.64 11.65 71.4 508.7 43.7 6.1 100 2 yes 15 3.64 11.65 59.6 406.7 34.9 5.1 100 2 yes 16 3.65 11.68 45.8 339.6 29.1 3.9 100 2 yes 17 3.59 11.49 66.3 437.6 38.1 5.8 100 2 yes 18 3.57 11.42 45.0 365.1 32.0 3.9 100 2 yes 19 3.73 11.94 47.9 406.7 34.1 4.0 100 2 no 20 3.59 11.49 45.5 367.8 32.0 4.0 100 2 yes 21 3.70 11.84 45.0 383.9 32.4 3.8 100 2 yes 22 3.73 11.94 43.4 373.1 31.3 3.6 100 2 yes
23* 3.60 11.52 67.9 492.6 42.8 5.9 100 2 yes 24 3.70 11.84 60.0 438.9 37.1 5.1 100 2 yes 25 3.53 11.30 77.5 494.0 43.7 6.9 100 2 no 26 3.47 11.10 43.0 363.8 32.8 3.9 100 3 yes 27 3.60 11.52 69.1 452.3 39.3 6.0 100 3 yes 28 3.68 11.78 42.0 375.8 31.9 3.6 100 3 no 29 3.52 11.26 66.5 483.2 42.9 5.9 100 3 yes 30 3.70 11.84 43.8 378.5 32.0 3.7 100 3 yes 31 3.58 11.46 46.0 390.6 34.1 4.0 100 3 yes 32 3.58 11.46 67.9 496.6 43.3 5.9 100 3 yes 33 3.49 11.17 47.4 373.1 33.4 4.2 100 3 yes 34 3.64 11.65 63.9 441.6 37.9 5.5 100 3 yes 35 3.69 11.81 53.5 410.7 34.8 4.5 100 3 yes 36 3.64 11.65 44.4 378.5 32.5 3.8 100 3 yes 37 3.57 11.42 68.4 498.0 43.6 6.0 100 3 yes 38 3.55 11.36 69.1 503.3 44.3 6.1 100 4 no 39 3.52 11.26 55.5 424.2 37.7 4.9 100 4 no
40** 3.46 11.07 42.0 359.7 32.5 3.8 100 4 no 41 3.49 11.17 68.1 460.4 41.2 6.1 100 4 no
* Went into compression first accidentally ** Defect in the skinny area
_____________________________________________________________________ 33
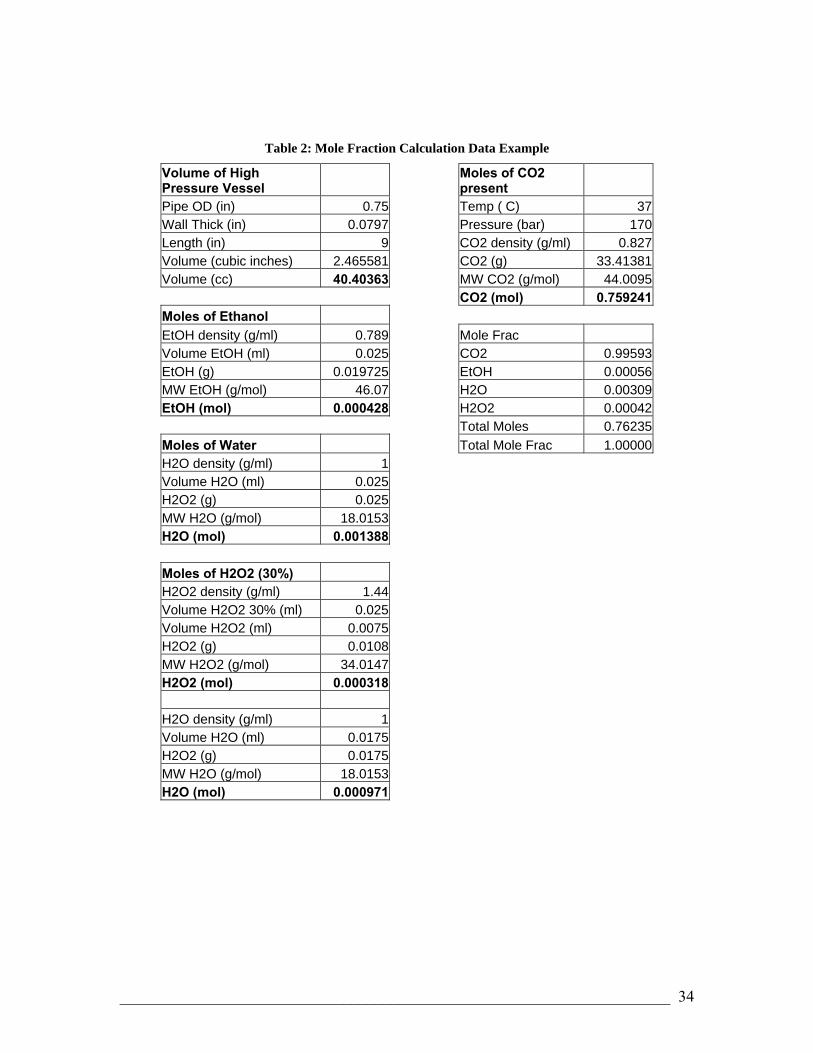
Table 2: Mole Fraction Calculation Data Example
Volume of High Pressure Vessel
Moles of CO2 present
Pipe OD (in) 0.75 Temp ( C) 37 Wall Thick (in) 0.0797 Pressure (bar) 170 Length (in) 9 CO2 density (g/ml) 0.827 Volume (cubic inches) 2.465581 CO2 (g) 33.41381 Volume (cc) 40.40363 MW CO2 (g/mol) 44.0095 CO2 (mol) 0.759241 Moles of Ethanol EtOH density (g/ml) 0.789 Mole Frac Volume EtOH (ml) 0.025 CO2 0.99593 EtOH (g) 0.019725 EtOH 0.00056 MW EtOH (g/mol) 46.07 H2O 0.00309 EtOH (mol) 0.000428 H2O2 0.00042 Total Moles 0.76235 Moles of Water Total Mole Frac 1.00000 H2O density (g/ml) 1 Volume H2O (ml) 0.025 H2O2 (g) 0.025 MW H2O (g/mol) 18.0153 H2O (mol) 0.001388 Moles of H2O2 (30%) H2O2 density (g/ml) 1.44 Volume H2O2 30% (ml) 0.025 Volume H2O2 (ml) 0.0075 H2O2 (g) 0.0108 MW H2O2 (g/mol) 34.0147 H2O2 (mol) 0.000318 H2O density (g/ml) 1 Volume H2O (ml) 0.0175 H2O2 (g) 0.0175 MW H2O (g/mol) 18.0153 H2O (mol) 0.000971
_____________________________________________________________________ 34

Table 3: Mole Fraction Data and Calculation Values
Test #
Ethanol (μL)
Water (μL)
H2O2 (30%) (μL)
Ethanol (g)
Water(g)
H2O2 (g)
Ethanol(mol)
Water (mol)
H2O2 (mol)
Total moles
Ethanol(mol frac)
Water (mol frac)
H2O2 (mol frac)
Total mole frac
1 0 0 25 0 0.0175 0.0108 0 0.000971 0.000318 0.76053 0.0E+00 1.3E-03 4.2E-04 1.7E-032 100 100 100 0.0789 0.17 0.0432 0.001713 0.009436 0.00127 0.77166 2.2E-03 1.2E-02 1.6E-03 1.6E-023 0 0 100 0 0.07 0.0432 0 0.003886 0.00127 0.764396 0.0E+00 5.1E-03 1.7E-03 6.7E-034 0 0 100 0 0.07 0.0432 0 0.003886 0.00127 0.764396 0.0E+00 5.1E-03 1.7E-03 6.7E-035 0 0 50 0 0.035 0.0216 0 0.001943 0.000635 0.761819 0.0E+00 2.6E-03 8.3E-04 3.4E-036 0 0 50 0 0.035 0.0216 0 0.001943 0.000635 0.761819 0.0E+00 2.6E-03 8.3E-04 3.4E-037 100 0 0 0.0789 0 0 0.001713 0 0 0.760953 2.3E-03 0.0E+00 0.0E+00 2.3E-038 100 0 0 0.0789 0 0 0.001713 0 0 0.760953 2.3E-03 0.0E+00 0.0E+00 2.3E-039 100 100 100 0.0789 0.17 0.0432 0.001713 0.009436 0.00127 0.77166 2.2E-03 1.2E-02 1.6E-03 1.6E-02
10 25 25 25 0.019725 0.0425 0.0108 0.000428 0.002359 0.000318 0.762346 5.6E-04 3.1E-03 4.2E-04 4.1E-0311 25 25 25 0.019725 0.0425 0.0108 0.000428 0.002359 0.000318 0.762346 5.6E-04 3.1E-03 4.2E-04 4.1E-0312 50 50 50 0.03945 0.085 0.0216 0.000856 0.004718 0.000635 0.76545 1.1E-03 6.2E-03 8.3E-04 8.1E-0313 50 50 50 0.03945 0.085 0.0216 0.000856 0.004718 0.000635 0.76545 1.1E-03 6.2E-03 8.3E-04 8.1E-0314 10 10 10 0.00789 0.017 0.00432 0.000171 0.000944 0.000127 0.760483 2.3E-04 1.2E-03 1.7E-04 1.6E-0315 10 10 10 0.00789 0.017 0.00432 0.000171 0.000944 0.000127 0.760483 2.3E-04 1.2E-03 1.7E-04 1.6E-0316 0 25 25 0 0.0425 0.0108 0 0.002359 0.000318 0.761917 0.0E+00 3.1E-03 4.2E-04 3.5E-0317 0 25 25 0 0.0425 0.0108 0 0.002359 0.000318 0.761917 0.0E+00 3.1E-03 4.2E-04 3.5E-0318 25 0 25 0.019725 0.0175 0.0108 0.000428 0.000971 0.000318 0.760958 5.6E-04 1.3E-03 4.2E-04 2.3E-0319 100 100 100 0.0789 0.17 0.0432 0.001713 0.009436 0.00127 0.77166 2.2E-03 1.2E-02 1.6E-03 1.6E-0220 100 100 100 0.0789 0.17 0.0432 0.001713 0.009436 0.00127 0.77166 2.2E-03 1.2E-02 1.6E-03 1.6E-0221 0 0 0 0 0 0 0 0 0 0.759241 0.0E+00 0.0E+00 0.0E+00 0.0E+0022 0 0 0 0 0 0 0 0 0 0.759241 0.0E+00 0.0E+00 0.0E+00 0.0E+0023 0 0 100 0 0.07 0.0432 0 0.003886 0.00127 0.764396 0.0E+00 5.1E-03 1.7E-03 6.7E-0324 0 0 100 0 0.07 0.0432 0 0.003886 0.00127 0.764396 0.0E+00 5.1E-03 1.7E-03 6.7E-0325 0 0 25 0 0.0175 0.0108 0 0.000971 0.000318 0.76053 0.0E+00 1.3E-03 4.2E-04 1.7E-0326 50 50 50 0.03945 0.085 0.0216 0.000856 0.004718 0.000635 0.76545 1.1E-03 6.2E-03 8.3E-04 8.1E-0327 100 100 0 0.0789 0.1 0 0.001713 0.005551 0 0.766504 2.2E-03 7.2E-03 0.0E+00 9.5E-0328 100 100 0 0.0789 0.1 0 0.001713 0.005551 0 0.766504 2.2E-03 7.2E-03 0.0E+00 9.5E-03
_____________________________________________________________________ 35